
EFS-Former: An Efficient Network for Fruit Tree Leaf Disease Segmentation and Severity Assessment

Abstract
1. Introduction
2. Materials and Methods
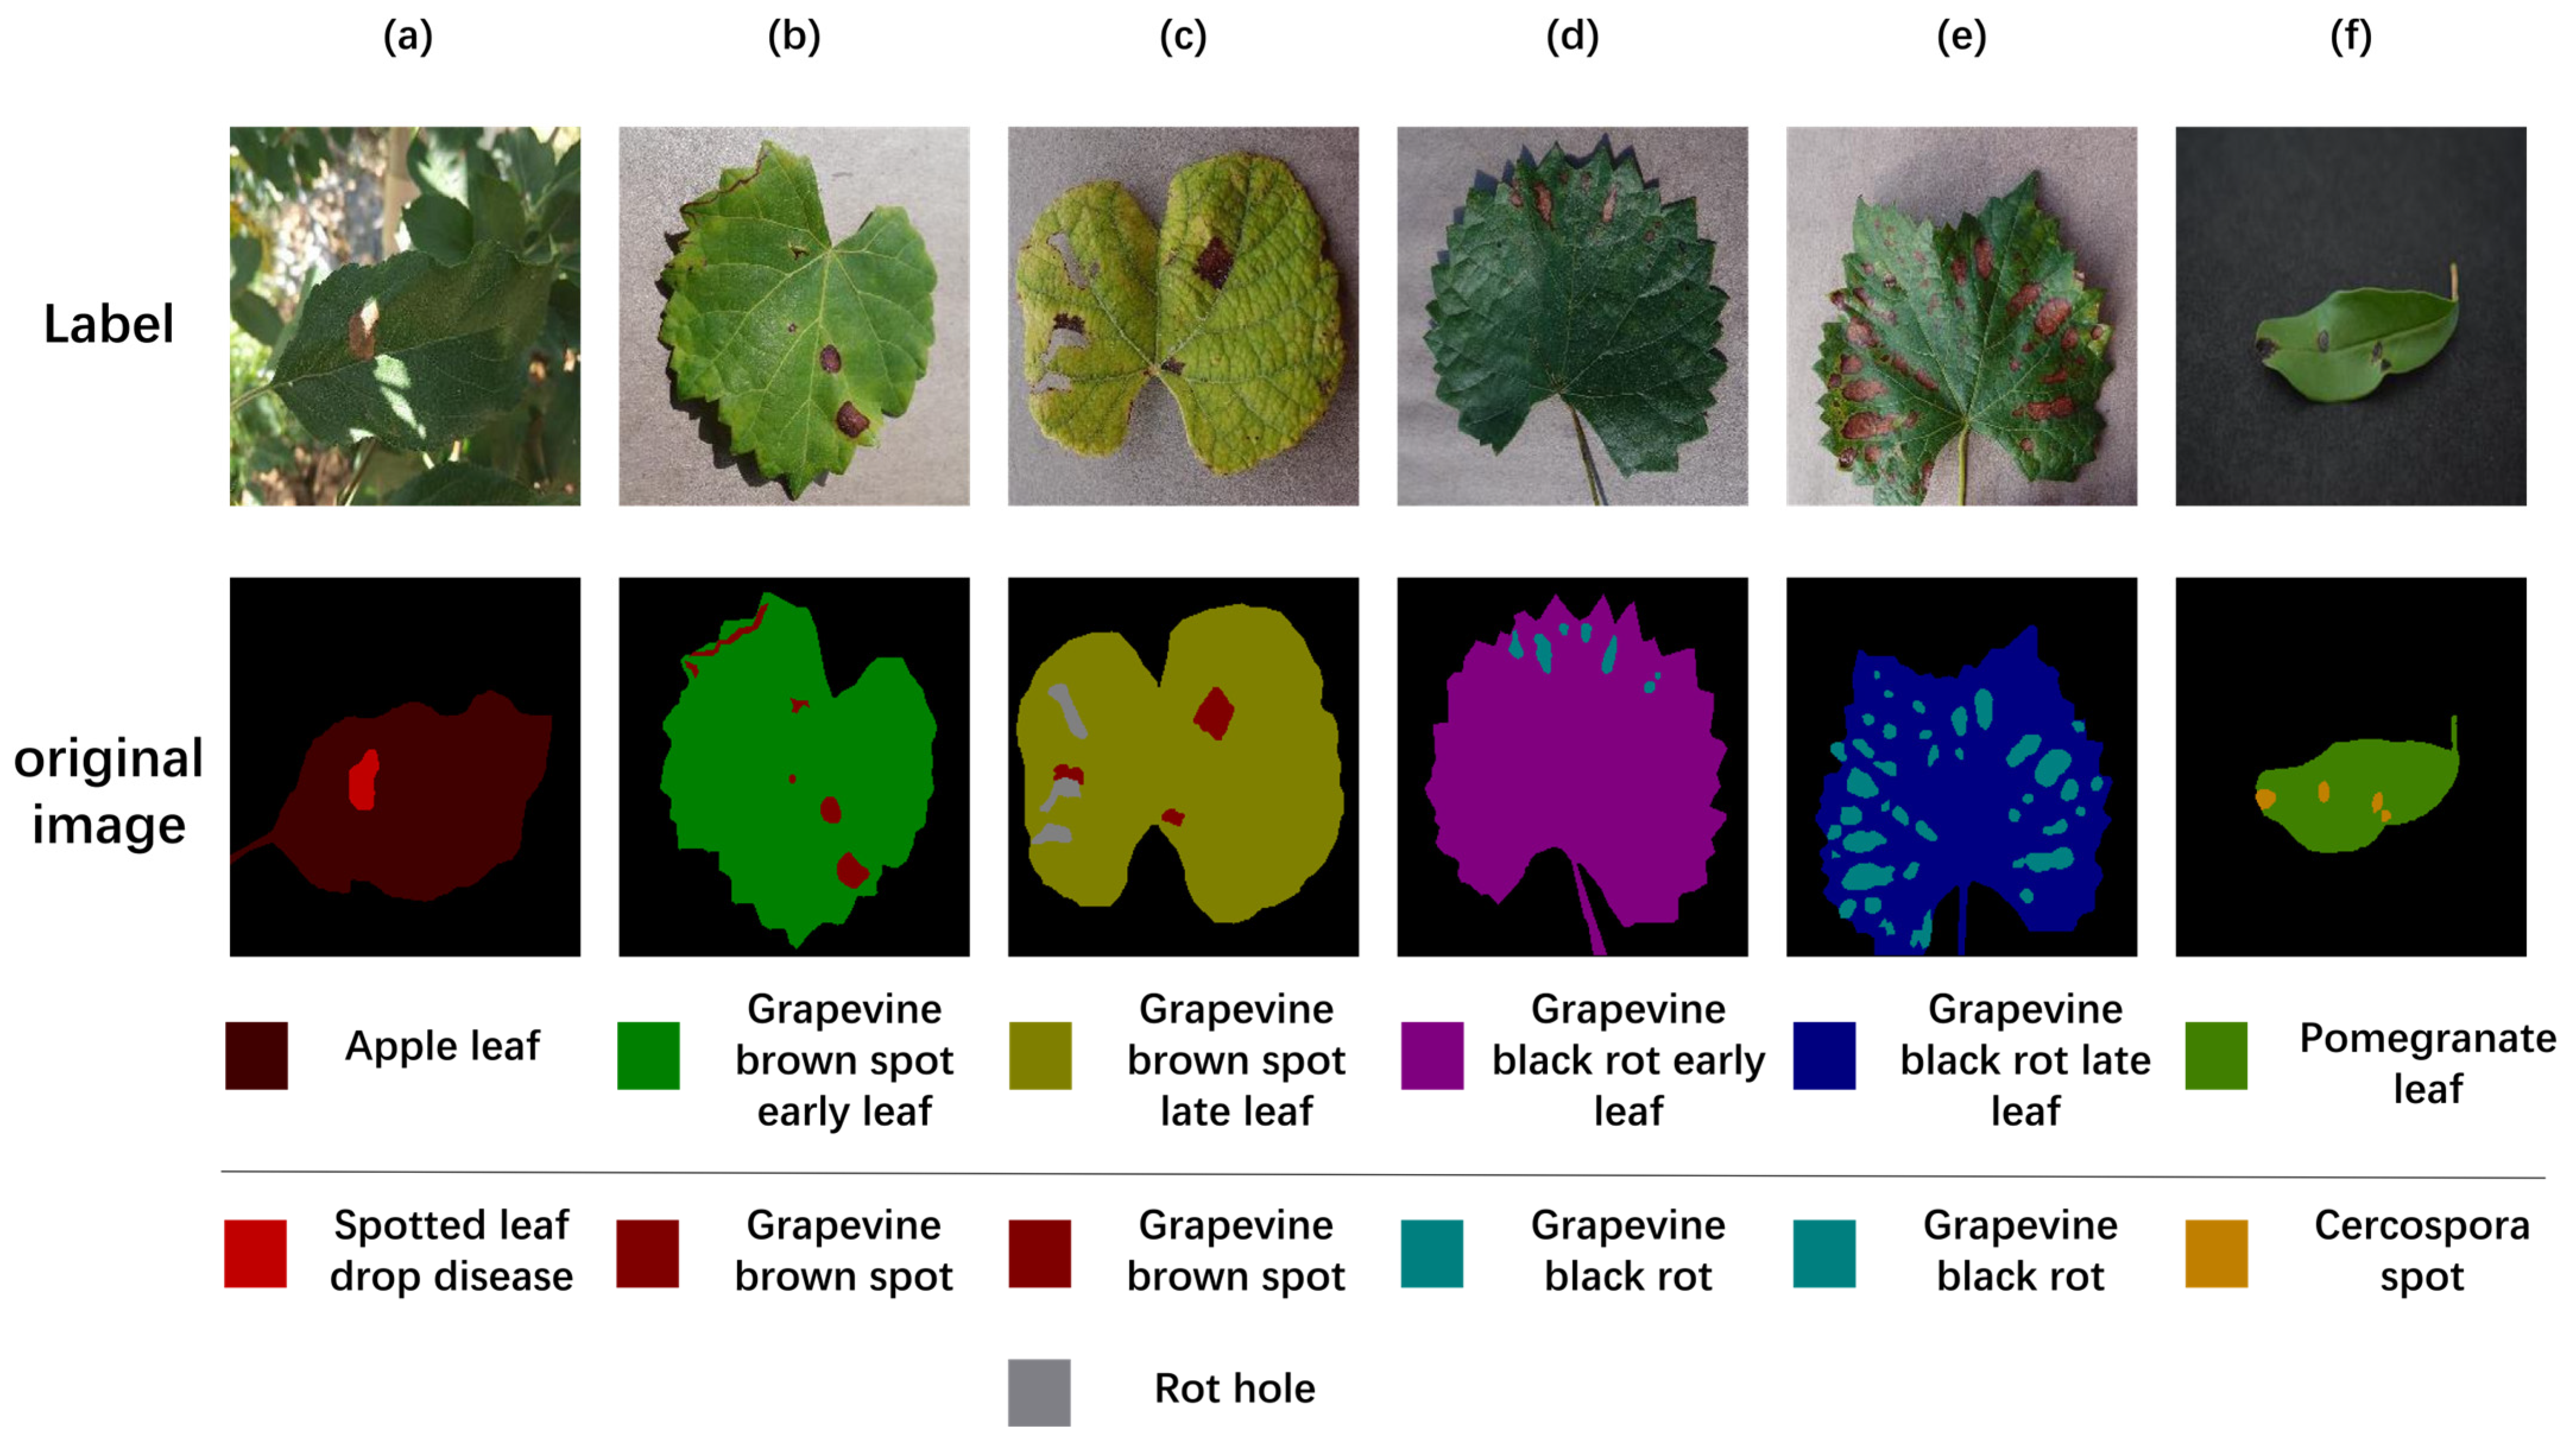
2.1. Dataset
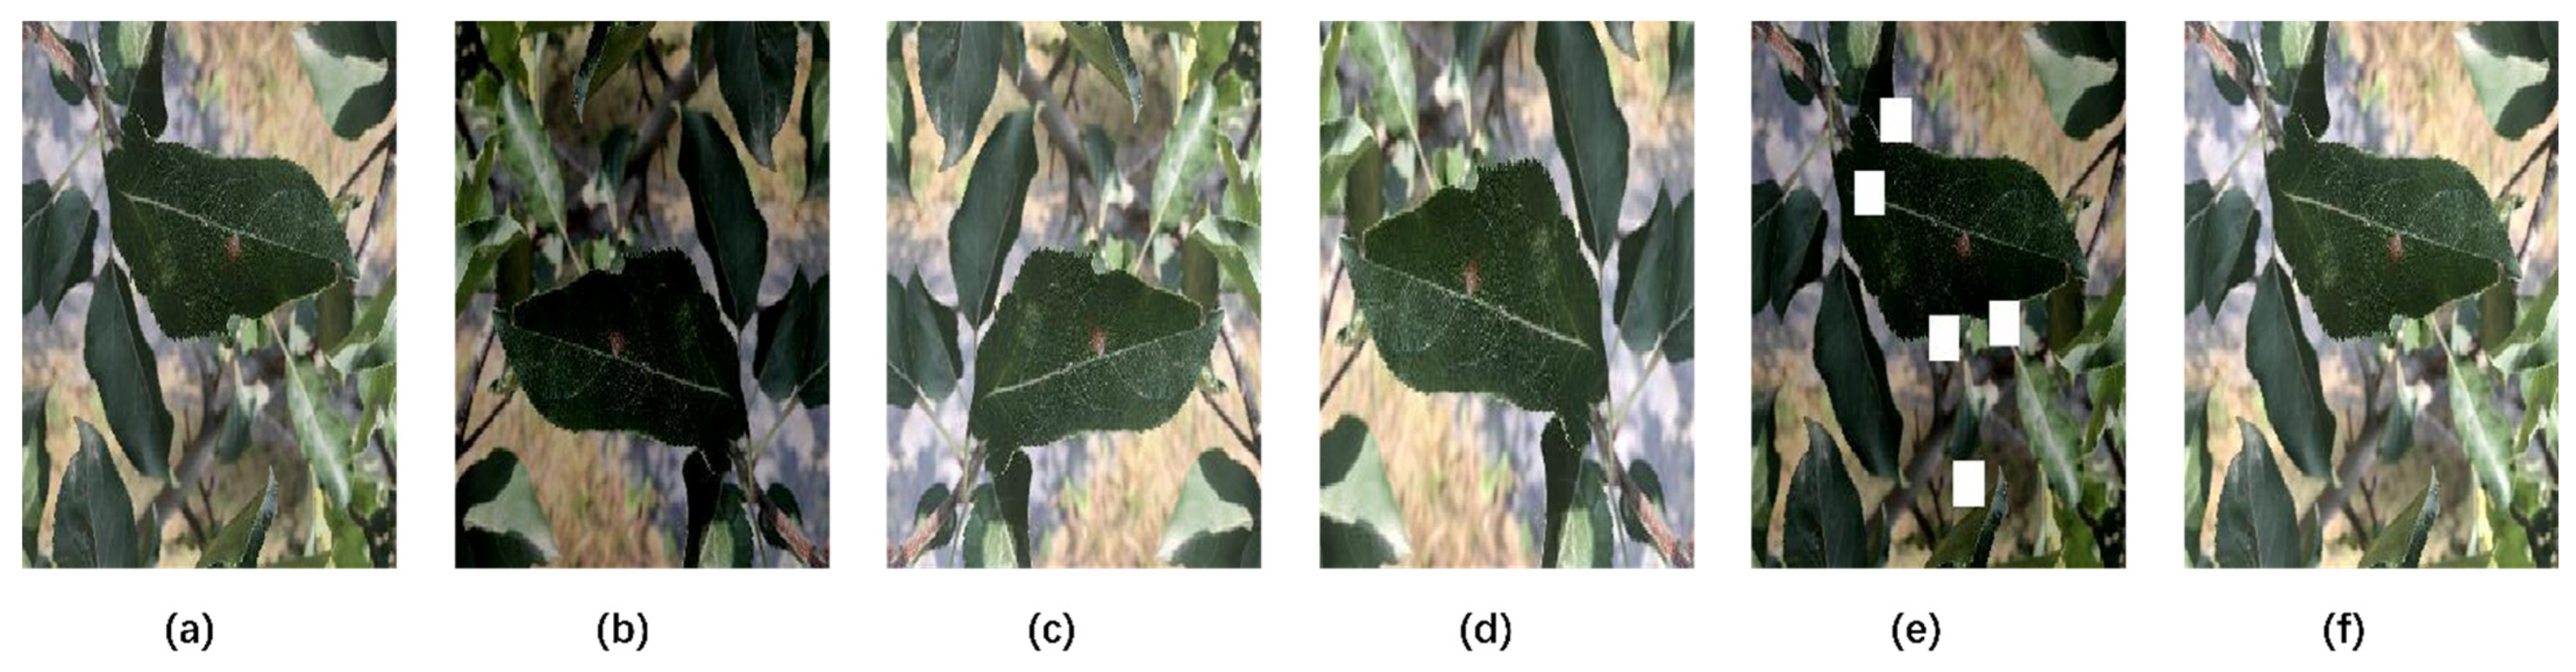
2.2. Image Preprocessing
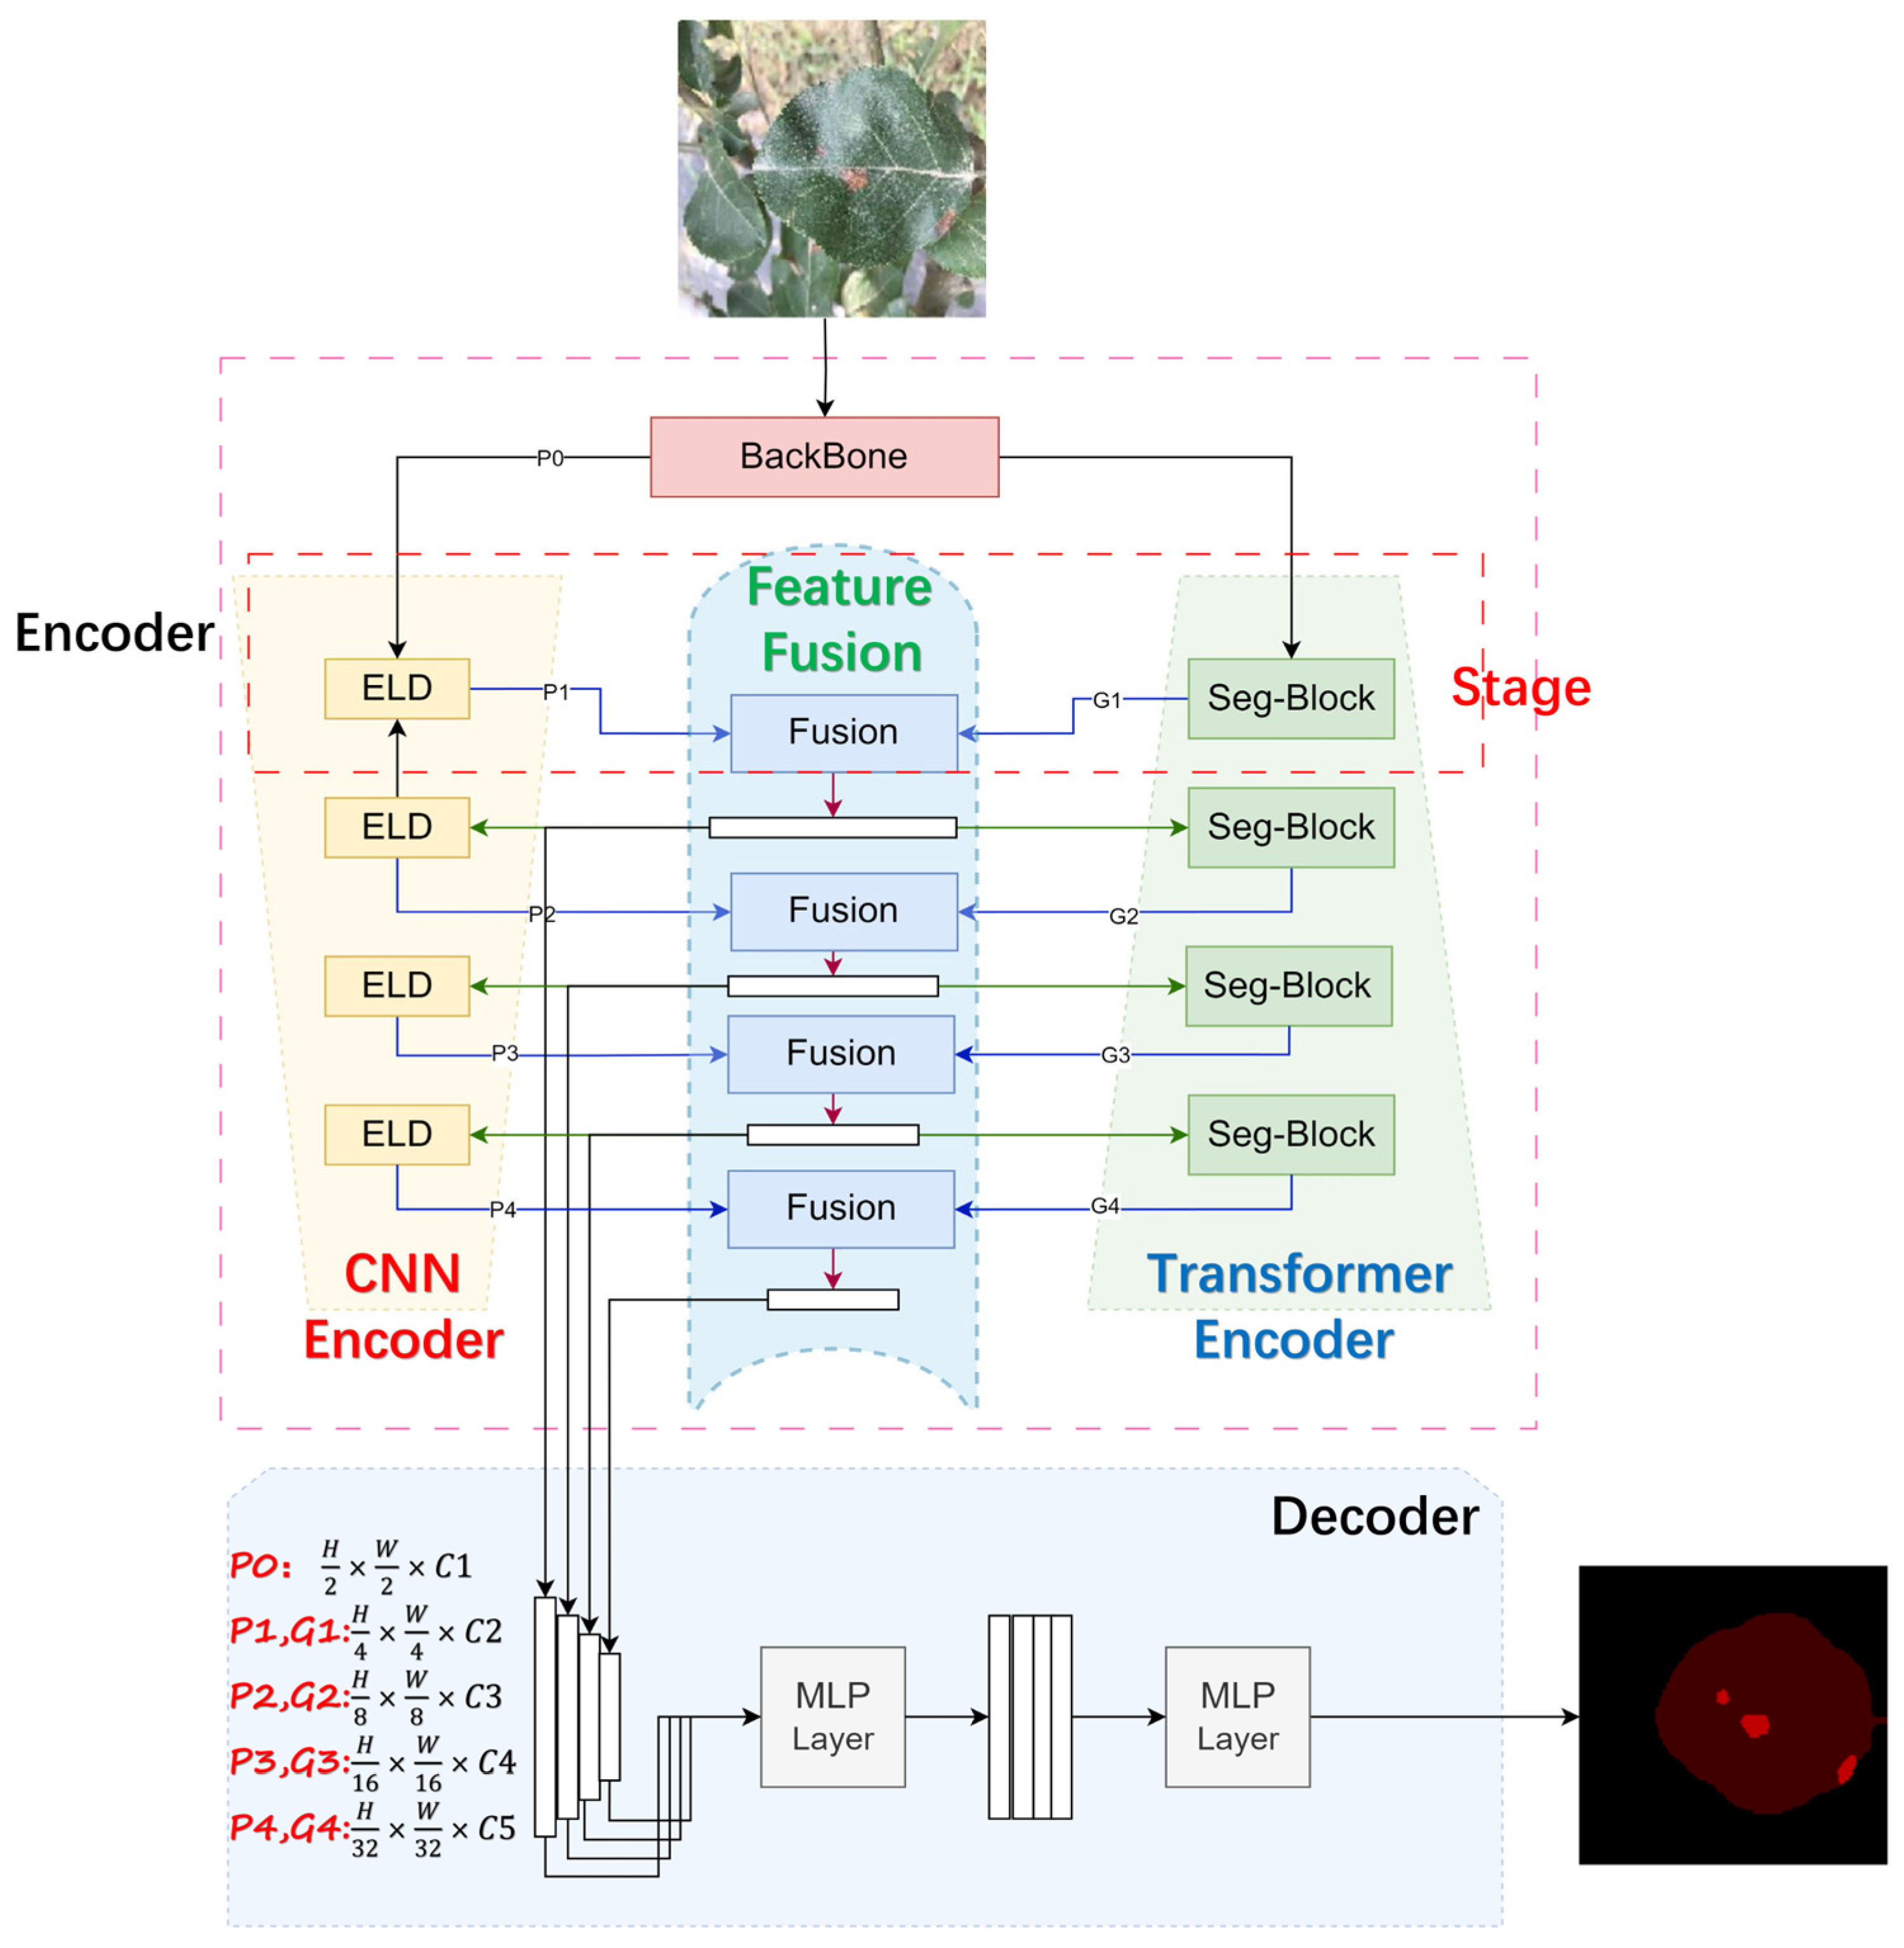
2.3. Methods
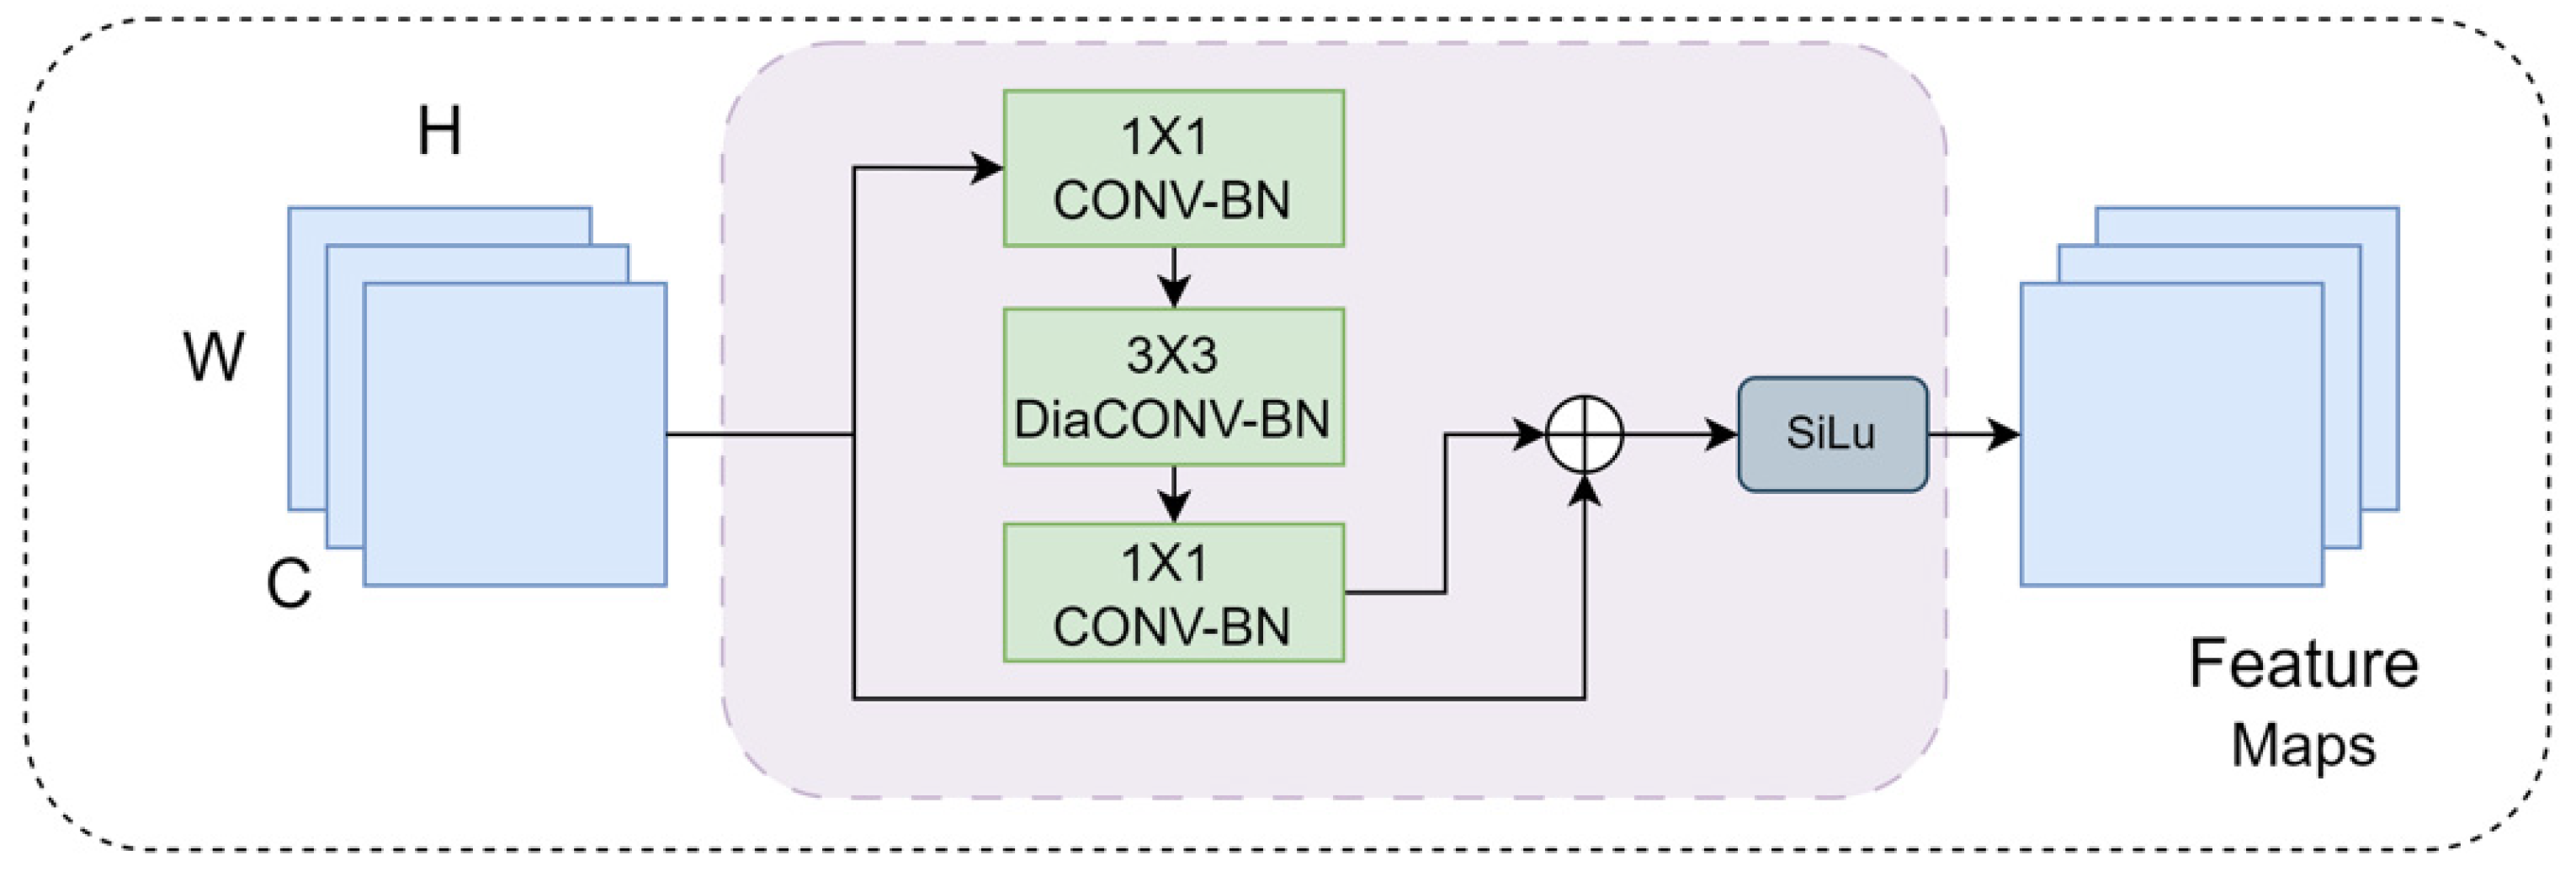
2.3.1. Expanded Local Detail (ELD) Module
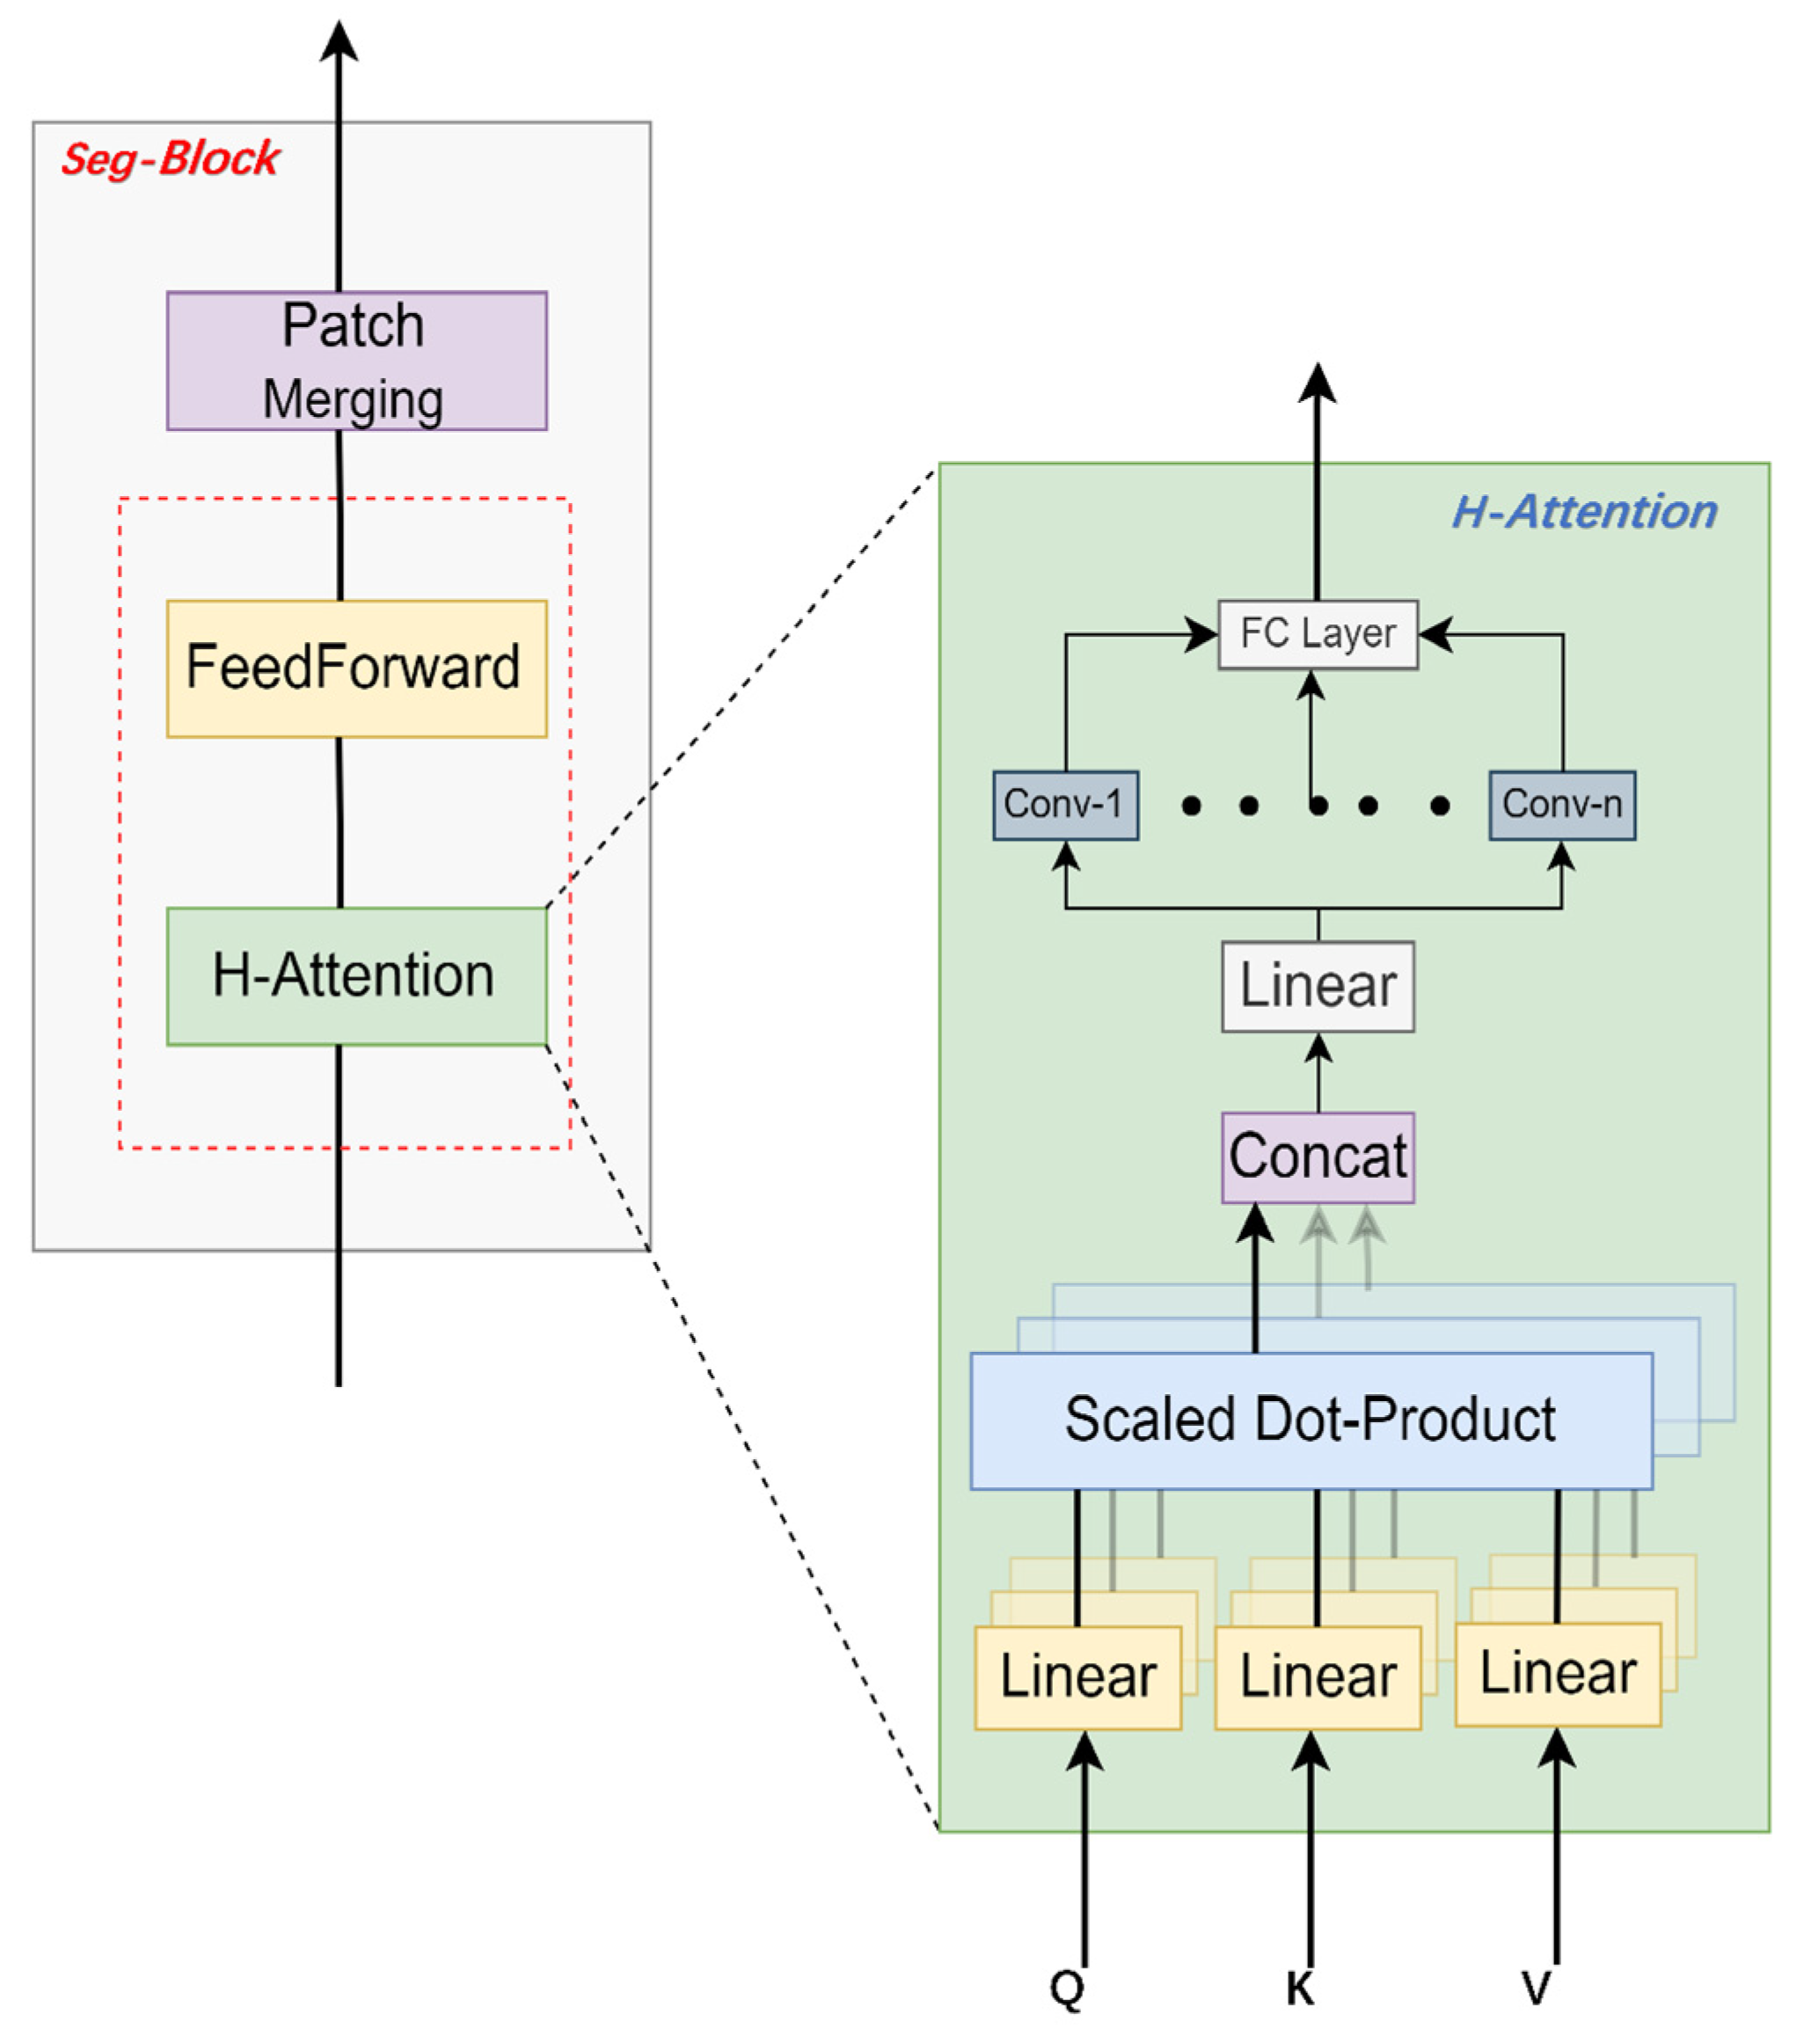
2.3.2. Seg-Block
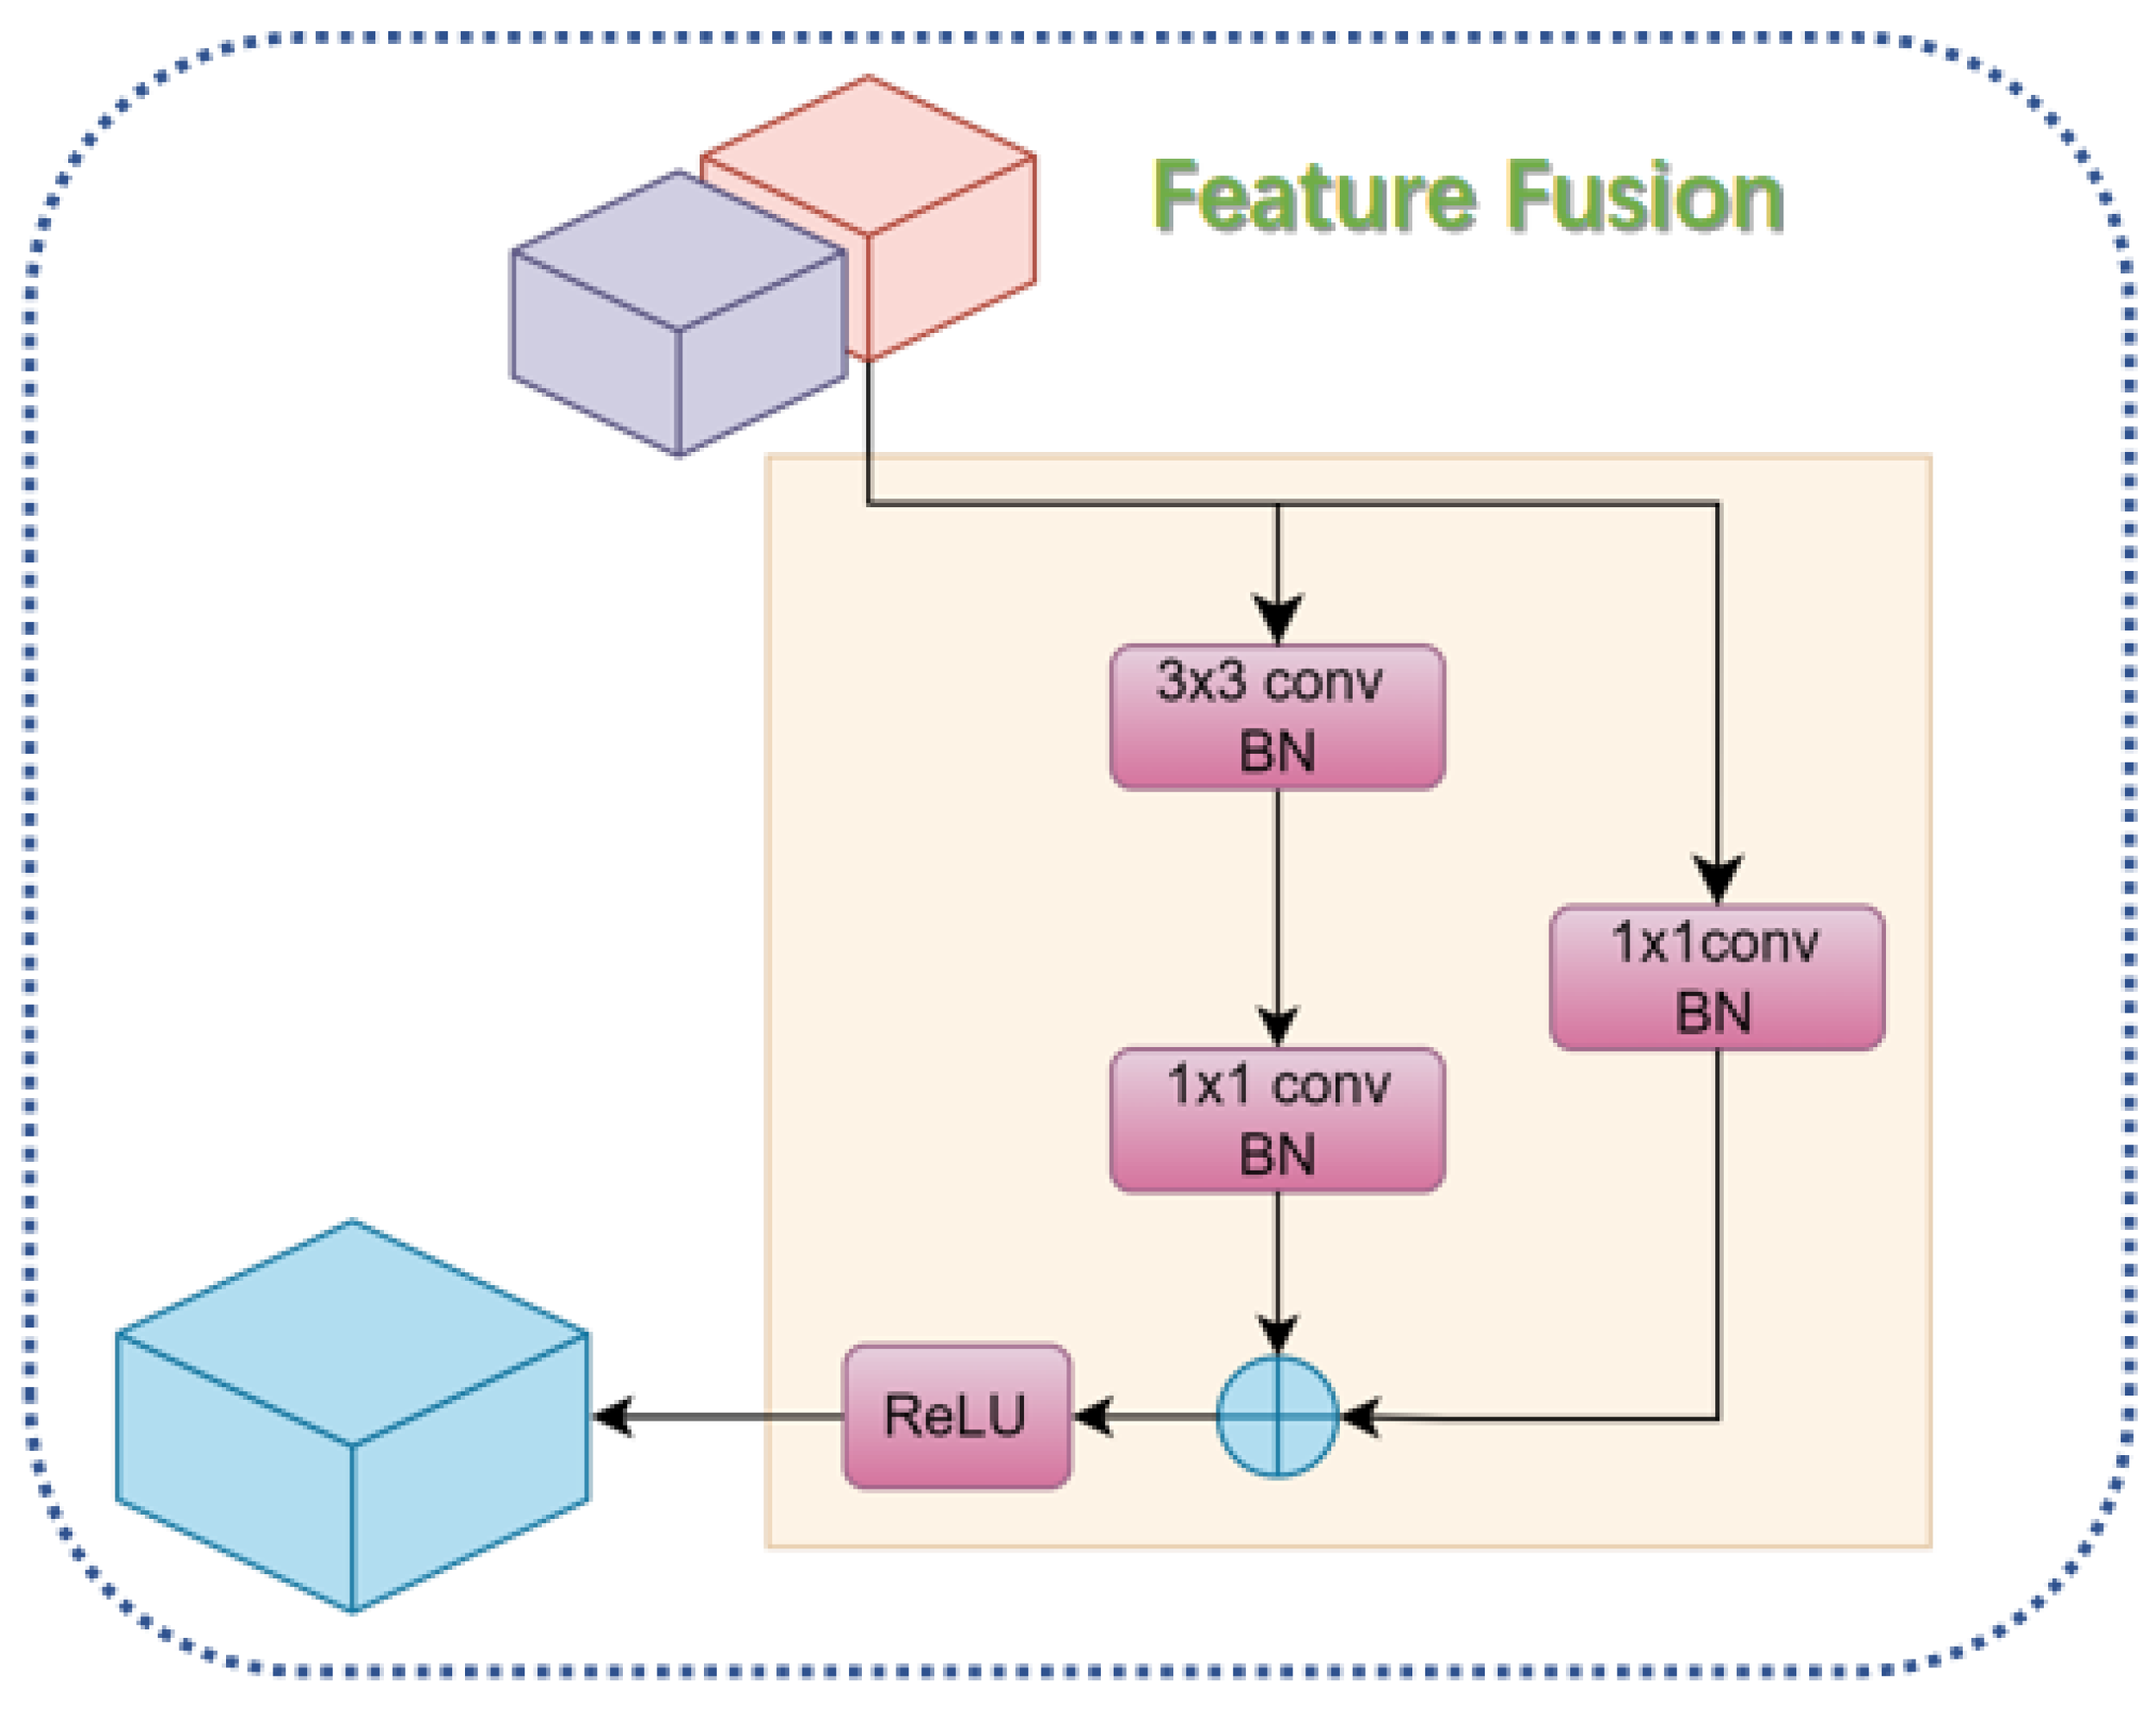
2.3.3. Feature Fusion Module
2.4. Experimental Platform and Experimental Evaluation Indices
3. Results and Discussion
3.1. Analysis of Experimental Results
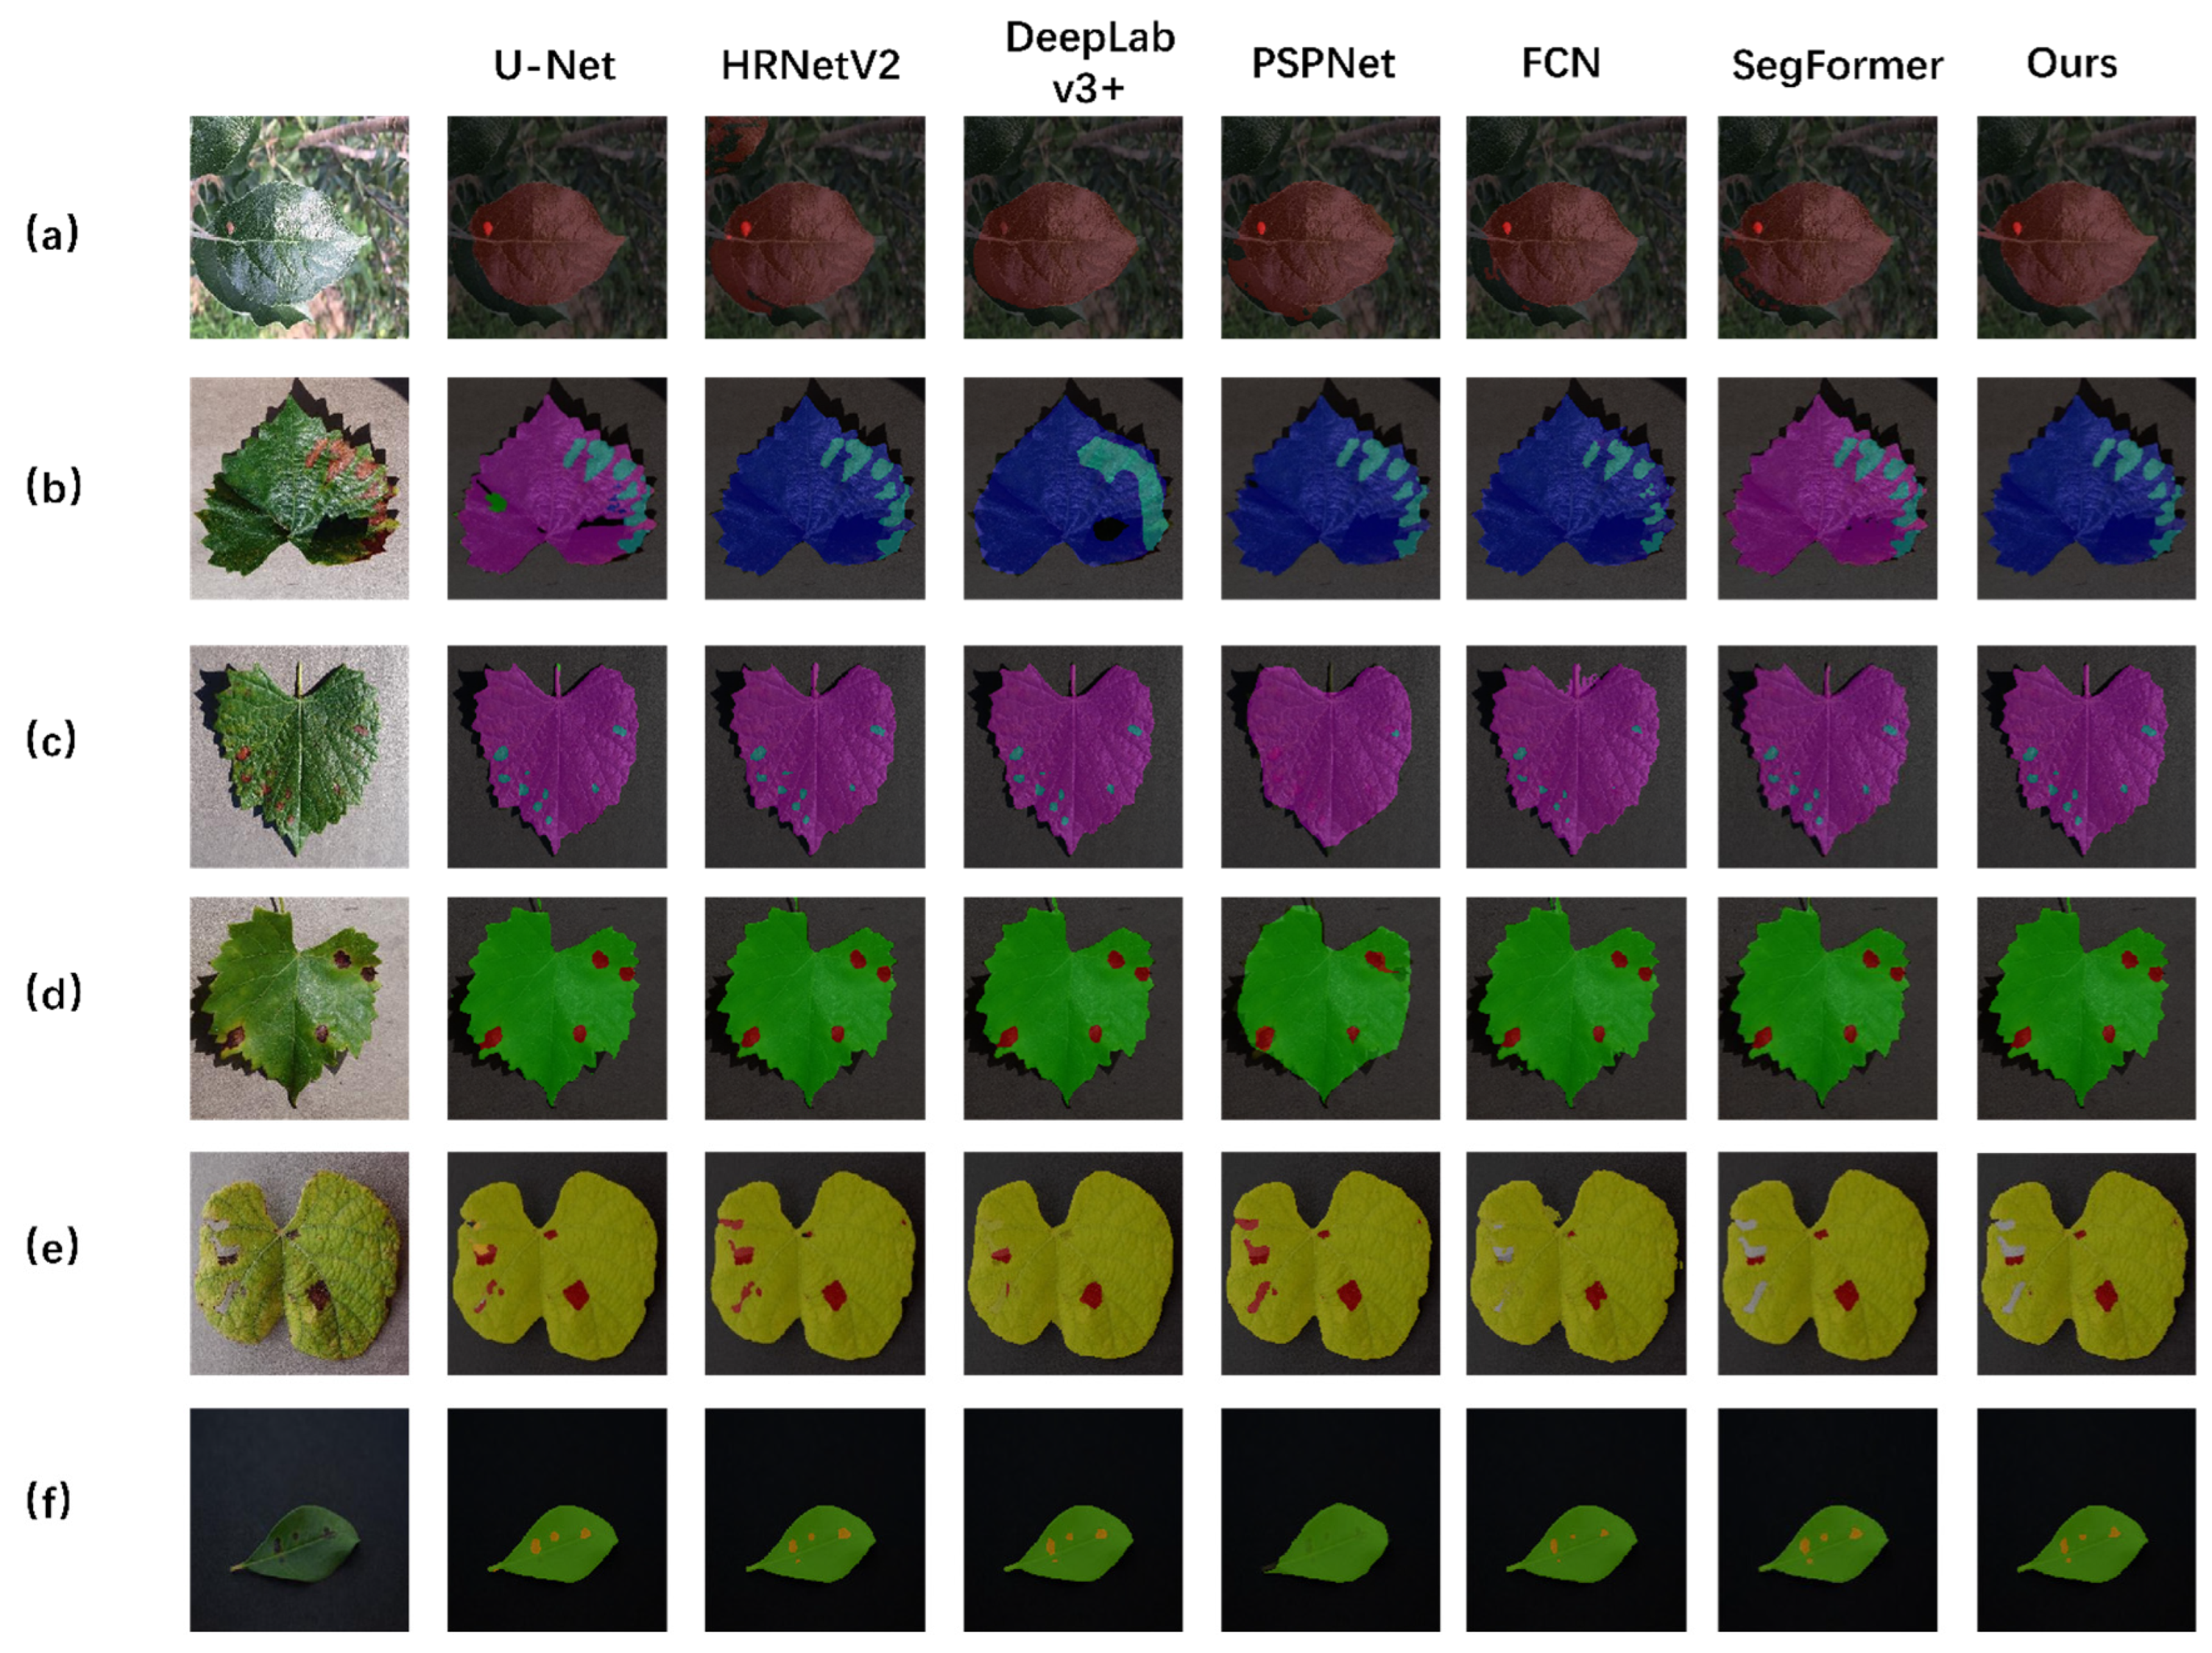
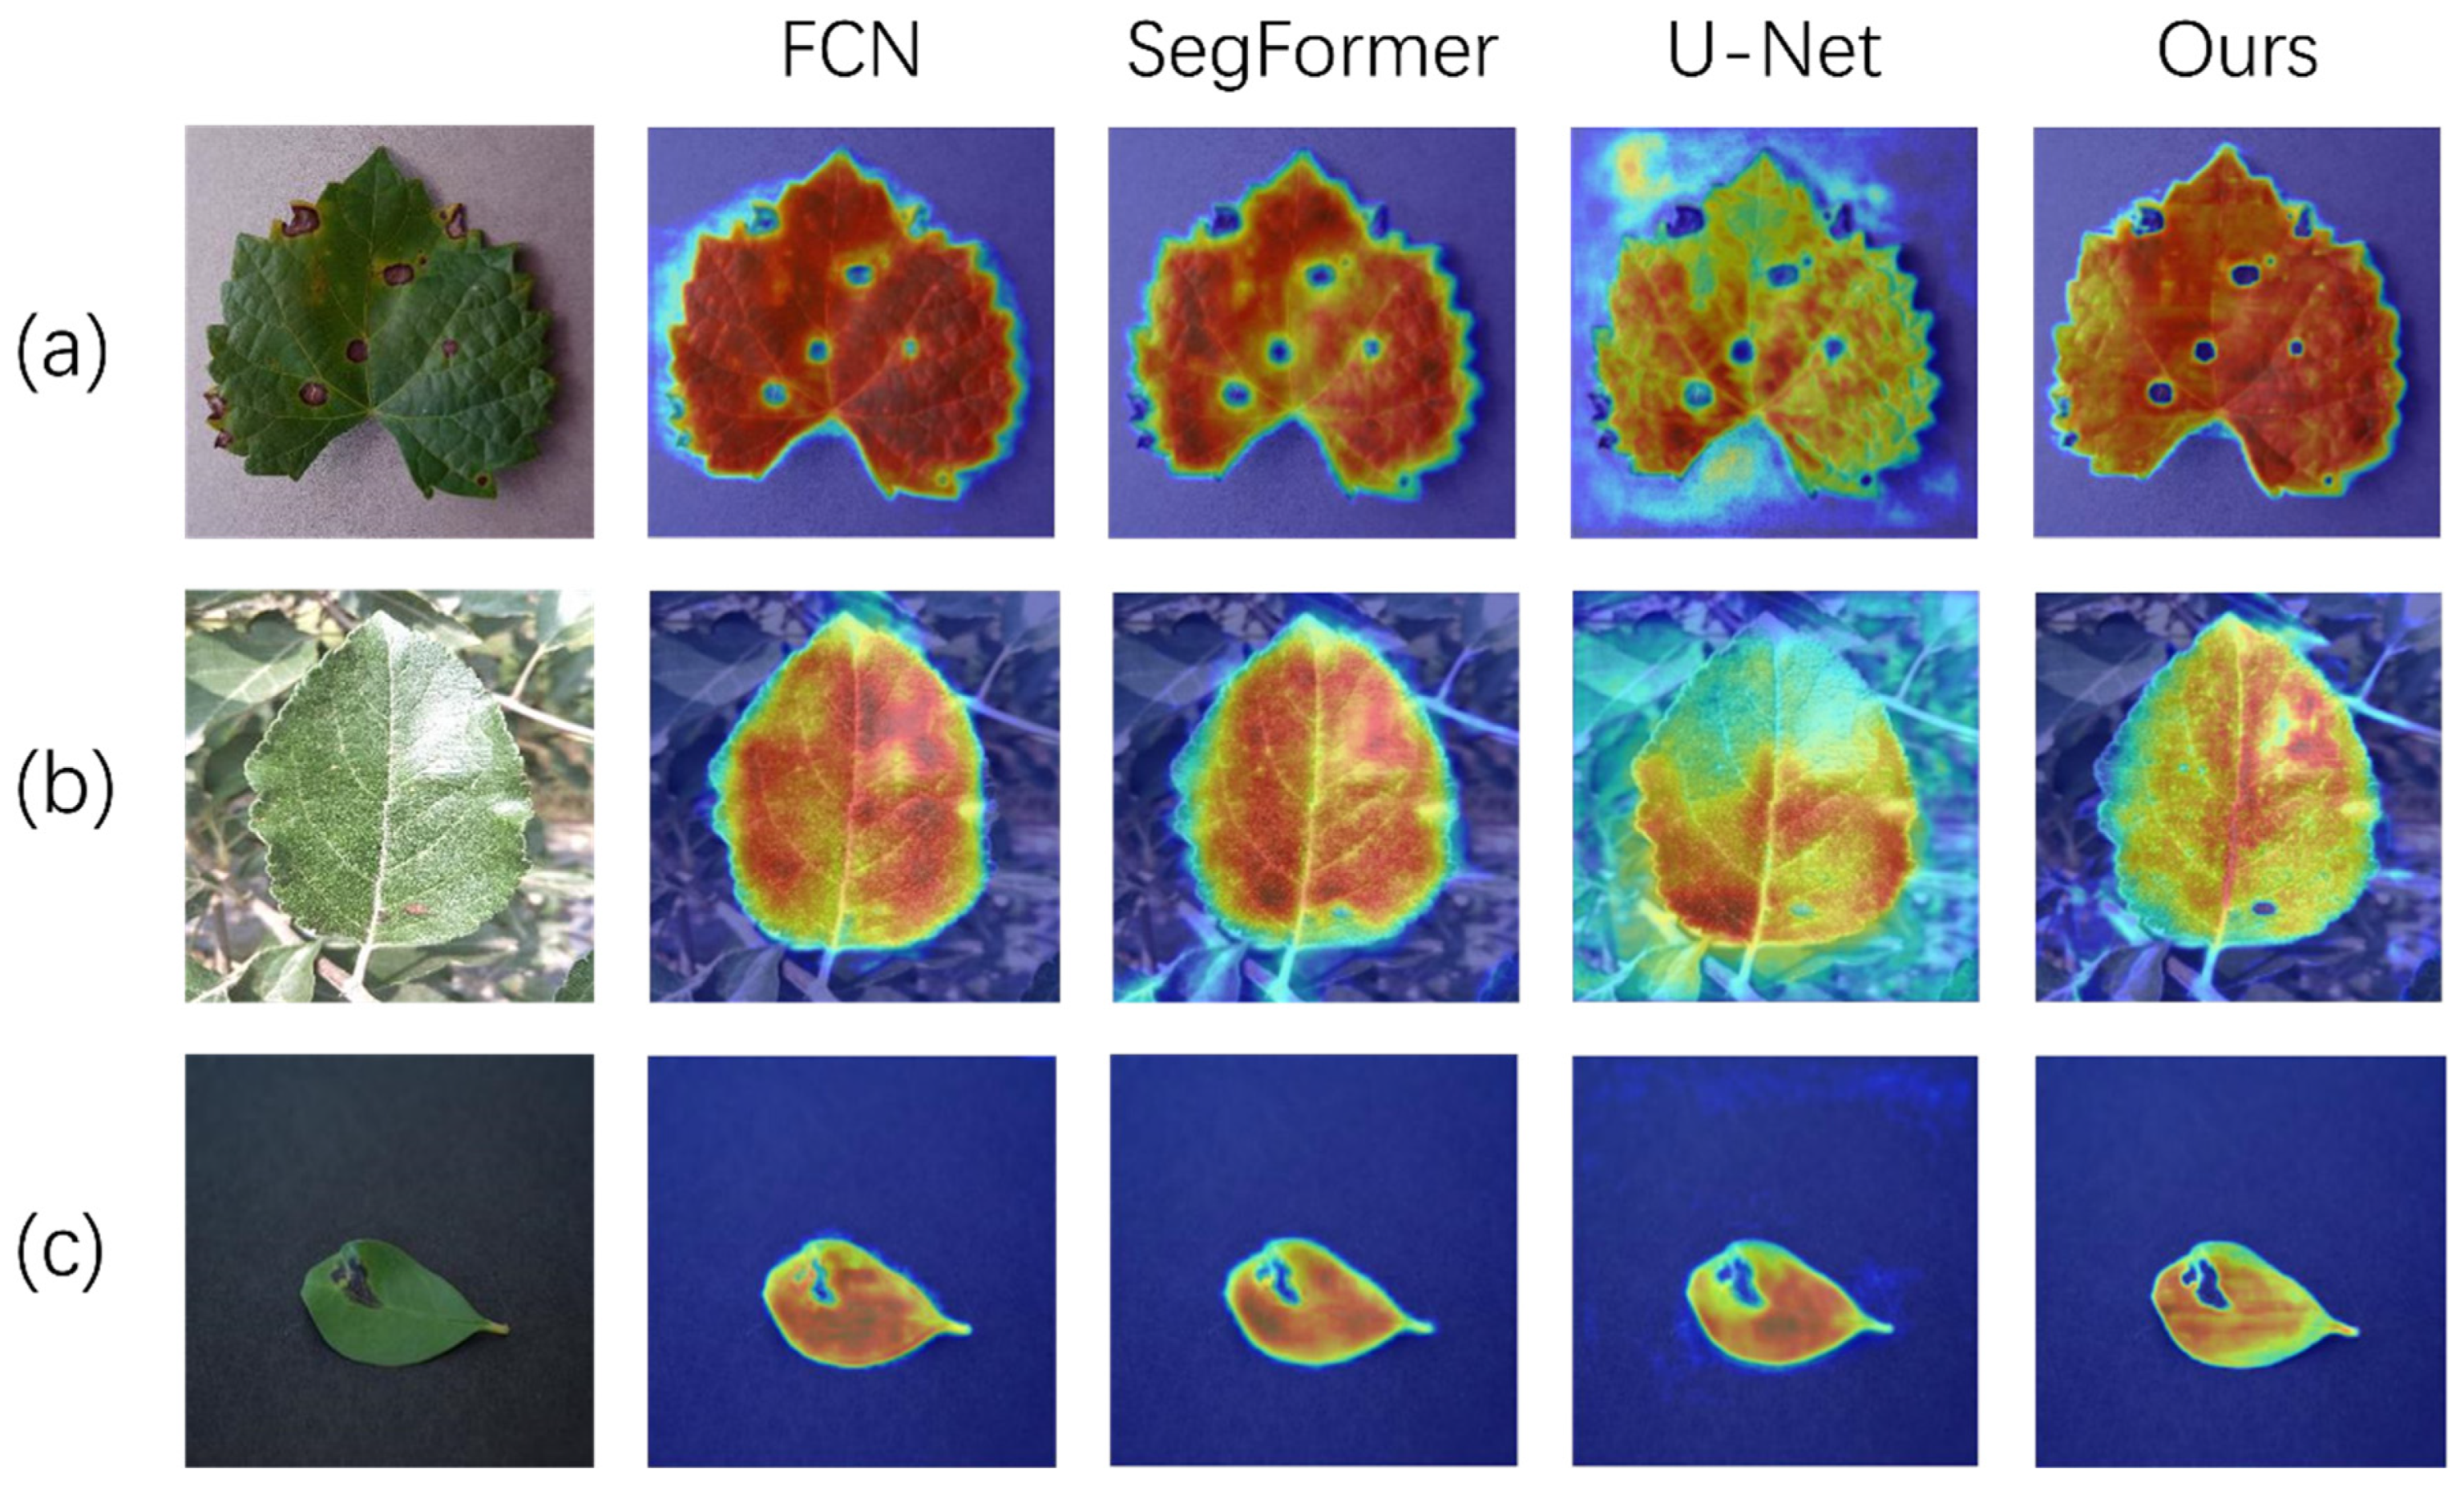
3.1.1. Different Models
3.1.2. Different Attention Mechanisms
3.2. Ablation Experiment
3.3. Disease Severity Assessment
3.4. Discussion
4. Conclusions
Author Contributions
Funding
Data Availability Statement
Conflicts of Interest
Abbreviations
| CNN | Convolutional neural network |
| ELD | Expanded local detail |
| FFM | Feature fusion module |
| MLP | Multilayer perceptron |
| FNN | Feedforward neural network |
| mIoU | Mean intersection over union |
| Acc | Accuracy |
| mPA | Mean pixel accuracy |
| FCN | Fully convolutional network |
References
- Shahi, T.B.; Xu, C.-Y.; Neupane, A.; Guo, W. Recent Advances in Crop Disease Detection Using Uav and Deep Learning Techniques. Remote Sens. 2023, 15, 2450. [Google Scholar] [CrossRef]
- Chin, R.; Catal, C.; Kassahun, A. Plant Disease Detection Using Drones in Precision Agriculture. Precis. Agric. 2023, 24, 1663–1682. [Google Scholar] [CrossRef]
- Coulibaly, S.; Kamsu-Foguem, B.; Kamissoko, D.; Traore, D. Deep Learning for Precision Agriculture: A Bibliometric Analysis. Intell. Syst. Appl. 2022, 16, 200102. [Google Scholar] [CrossRef]
- Febrinanto, F.G.; Dewi, C.; Triwiratno, A. The Implementation of K-Means Algorithm as Image Segmenting Method in Identifying the Citrus Leaves Disease. IOP Conf. Ser. Earth Environ. Sci. 2019, 243, 012024. [Google Scholar] [CrossRef]
- Chodey, M.D.; Shariff, C.N. Pest Detection Via Hybrid Classification Model with Fuzzy C-Means Segmentation and Proposed Texture Feature. Biomed. Signal Process. Control. 2023, 84, 104710. [Google Scholar] [CrossRef]
- Jothiaruna, N.; Sundar, K.J.A.; Karthikeyan, B. A Segmentation Method for Disease Spot Images Incorporating Chrominance in Comprehensive Color Feature and Region Growing. Comput. Electron. Agric. 2019, 165, 104934. [Google Scholar] [CrossRef]
- Ma, J.; Du, K.; Zhang, L.; Zheng, F.; Chu, J.; Sun, Z. A Segmentation Method for Greenhouse Vegetable Foliar Disease Spots Images Using Color Information and Region Growing. Comput. Electron. Agric. 2017, 142, 110–117. [Google Scholar] [CrossRef]
- Chen, C.; Wang, X.; Heidari, A.A.; Yu, H.; Chen, H. Multi-Threshold Image Segmentation of Maize Diseases Based on Elite Comprehensive Particle Swarm Optimization and Otsu. Front. Plant Sci. 2021, 12, 789911. [Google Scholar] [CrossRef] [PubMed]
- Xie, Z.; Wu, J.; Tang, W.; Liu, Y. Advancing Image Segmentation with Dbo-Otsu: Addressing Rubber Tree Diseases through Enhanced Threshold Techniques. PLoS ONE 2024, 19, e0297284. [Google Scholar] [CrossRef]
- Long, J.; Shelhamer, E.; Darrell, T. Fully Convolutional Networks for Semantic Segmentation. In Proceedings of the IEEE Conference on Computer Vision and Pattern Recognition (CVPR), Boston, MA, USA, 7–12 June 2015. [Google Scholar]
- Ronneberger, O.; Fischer, P.; Brox, T. U-Net: Convolutional Networks for Biomedical Image Segmentation. In Proceedings of the Medical Image Computing and Computer-Assisted Intervention—MICCAI 2015: 18th International Conference, Munich, Germany, 5–9 October 2015. [Google Scholar]
- Zhao, H.; Shi, J.; Qi, X.; Wang, X.; Jia, J. Pyramid Scene Parsing Network. In Proceedings of the IEEE Conference on Computer Vision and Pattern Recognition (CVPR), Honolulu, HI, USA, 21–26 July 2017. [Google Scholar]
- Chen, L.-C.; Papandreou, G.; Kokkinos, I.; Murphy, K.; Yuille, A.L. Deeplab: Semantic Image Segmentation with Deep Convolutional Nets, Atrous Convolution, and Fully Connected Crfs. IEEE Trans. Pattern Anal. Mach. Intell. 2017, 40, 834–848. [Google Scholar] [CrossRef]
- Badrinarayanan, V.; Kendall, A.; Cipolla, R. Segnet: A Deep Convolutional Encoder-Decoder Architecture for Image Segmentation. IEEE Trans. Pattern Anal. Mach. Intell. 2017, 39, 2481–2495. [Google Scholar] [CrossRef] [PubMed]
- He, K.; Gkioxari, G.; Dollár, P.; Girshick, R. Mask R-Cnn. In Proceedings of the IEEE International Conference on Computer Vision (ICCV), Venice, Italy, 22–29 October 2017. [Google Scholar]
- Jia, W.; Tian, Y.; Luo, R.; Zhang, Z.; Lian, J.; Zheng, Y. Detection and Segmentation of Overlapped Fruits Based on Optimized Mask R-Cnn Application in Apple Harvesting Robot. Comput. Electron. Agric. 2020, 172, 105380. [Google Scholar] [CrossRef]
- Zou, K.; Chen, X.; Wang, Y.; Zhang, C.; Zhang, F. A Modified U-Net with a Specific Data Argumentation Method for Semantic Segmentation of Weed Images in the Field. Comput. Electron. Agric. 2021, 187, 106242. [Google Scholar] [CrossRef]
- Kang, J.; Liu, L.; Zhang, F.; Shen, C.; Wang, N.; Shao, L. Semantic Segmentation Model of Cotton Roots in-Situ Image Based on Attention Mechanism. Comput. Electron. Agric. 2021, 189, 106370. [Google Scholar] [CrossRef]
- Azizi, A.; Abbaspour-Gilandeh, Y.; Vannier, E.; Dusséaux, R.; Mseri-Gundoshmian, T.; Moghaddam, H.A. Semantic Segmentation: A Modern Approach for Identifying Soil Clods in Precision Farming. Biosyst. Eng. 2020, 196, 172–182. [Google Scholar] [CrossRef]
- Wang, C.; Du, P.; Wu, H.; Li, J.; Zhao, C.; Zhu, H. A Cucumber Leaf Disease Severity Classification Method Based on the Fusion of Deeplabv3+ and U-Net. Comput. Electron. Agric. 2021, 189, 106373. [Google Scholar] [CrossRef]
- Sunil, C.K.; Jaidhar, C.D.; Patil, N. Tomato Plant Disease Classification Using Multilevel Feature Fusion with Adaptive Channel Spatial and Pixel Attention Mechanism. Expert Syst. Appl. 2023, 228, 120381. [Google Scholar]
- Liu, B.-Y.; Fan, K.-J.; Su, W.-H.; Peng, Y. Two-Stage Convolutional Neural Networks for Diagnosing the Severity of Alternaria Leaf Blotch Disease of the Apple Tree. Remote Sens. 2022, 14, 2519. [Google Scholar] [CrossRef]
- Dai, G.; Fan, J.; Tian, Z.; Wang, C. Pplc-Net:Neural Network-Based Plant Disease Identification Model Supported by Weather Data Augmentation and Multi-Level Attention Mechanism. J. King Saud Univ. Comput. Inf. Sci. 2023, 35, 101555. [Google Scholar] [CrossRef]
- He, K.; Zhang, X.; Ren, S.; Sun, J. Deep Residual Learning for Image Recognition. In Proceedings of the IEEE Conference on Computer Vision and Pattern Recognition (CVPR), Las Vegas, NV, USA, 27–30 June 2016. [Google Scholar]
- Vaswani, A.; Shazeer, N.; Parmar, N.; Uszkoreit, J.; Jones, L.; Gomez, A.N.; Kaiser, Ł.; Polosukhin, I. Attention Is All You Need. Adv. Neural Inf. Process. Syst. 2017, 30, 5998–6008. [Google Scholar]
- Wang, X.; Girshick, R.; Gupta, A.; He, K. Non-Local Neural Networks. In Proceedings of the IEEE Conference on Computer Vision and Pattern Recognition (CVPR), Salt Lake City, UT, USA, 18–23 June 2018. [Google Scholar]
- Zhang, H.; Goodfellow, I.; Metaxas, D.; Odena, A. Self-Attention Generative Adversarial Networks. In Proceedings of the International Conference on Machine Learning, Long Beach, CA, USA, 10–15 June 2019. [Google Scholar]
- Dosovitskiy, A.; Beyer, L.; Kolesnikov, A.; Weissenborn, D.; Zhai, X.; Unterthiner, T.; Dehghani, M.; Minderer, M.; Heigold, G.; Gelly, S. An Image Is Worth 16x16 Words: Transformers for Image Recognition at Scale. arXiv 2020, arXiv:2010.11929. [Google Scholar]
- Zheng, S.; Lu, J.; Zhao, H.; Zhu, X.; Luo, Z.; Wang, Y.; Fu, Y.; Feng, J.; Xiang, T.; Torr, P.H.S. Rethinking Semantic Segmentation from a Sequence-to-Sequence Perspective with Transformers. In Proceedings of the IEEE/CVF Conference on Computer Vision and Pattern Recognition, Virtual, 19–25 June 2021. [Google Scholar]
- Xie, E.; Wang, W.; Yu, Z.; Anandkumar, A.; Alvarez, J.M.; Luo, P. Segformer: Simple and Efficient Design for Semantic Segmentation with Transformers. Adv. Neural Inf. Process. Syst. 2021, 34, 12077–12090. [Google Scholar]
- Liu, Z.; Lin, Y.; Cao, Y.; Hu, H.; Wei, Y.; Zhang, Z.; Lin, S.; Guo, B. Swin Transformer: Hierarchical Vision Transformer Using Shifted Windows. In Proceedings of the IEEE/CVF International Conference on Computer Vision (CVPR), Nashville, TN, USA, 20–25 June 2021. [Google Scholar]
- Hughes, D.; Salathé, M. An Open Access Repository of Images on Plant Health to Enable the Development of Mobile Disease Diagnostics. arXiv 2015, arXiv:1511.08060. [Google Scholar]
- Russell, B.C.; Torralba, A.; Murphy, K.P.; Freeman, W.T. LabelMe: A Database and Web-Based Tool for Image Annotation. Int. J. Comput. Vis. 2008, 77, 157–173. [Google Scholar] [CrossRef]
- Wang, J.; Sun, K.; Cheng, T.; Jiang, B.; Deng, C.; Zhao, Y.; Liu, D.; Mu, Y.; Tan, M.; Wang, X. Deep High-Resolution Representation Learning for Visual Recognition. IEEE Trans. Pattern Anal. Mach. Intell. 2020, 43, 3349–3364. [Google Scholar] [CrossRef] [PubMed]
- Chen, L.-C.; Zhu, Y.; Papandreou, G.; Schroff, F.; Adam, H. Encoder-Decoder with Atrous Separable Convolution for Semantic Image Segmentation. In Proceedings of the European Conference on Computer Vision (ECCV), Munich, Germany, 8–14 September 2018. [Google Scholar]
- Woo, S.; Park, J.; Lee, J.-Y.; Kweon, I.S. Cbam: Convolutional Block Attention Module. In Proceedings of the European Conference on Computer Vision (ECCV), Munich, Germany, 8–14 September 2018. [Google Scholar]
- Li, X.; Wang, W.; Hu, X.; Yang, J. Selective Kernel Networks. In Proceedings of the IEEE/CVF Conference on Computer Vision and Pattern Recognition (CVPR), Long Beach, CA, USA, 15–20 June 2019. [Google Scholar]
- Hu, J.; Shen, L.; Sun, G. Squeeze-and-Excitation Networks. In Proceedings of the IEEE Conference on Computer Vision and Pattern Recognition (CVPR), Salt Lake City, UT, USA, 18–23 June 2018. [Google Scholar]
- Lu, J.; Yang, J.; Batra, D.; Parikh, D. Hierarchical Question-Image Co-Attention for Visual Question Answering. Adv. Neural Inf. Process. Syst. 2016, 29, 289–297. [Google Scholar]
- Cao, Y.; Xu, J.; Lin, S.; Wei, F.; Hu, H. Gcnet: Non-Local Networks Meet Squeeze-Excitation Networks and Beyond. In Proceedings of the IEEE/CVF International Conference on Computer Vision Workshop (ICCVW), Seoul, Republic of Korea, 27–28 October 2019. [Google Scholar]
- Ahmed, K.; Shahidi, T.R.; Alam, S.M.I.; Momen, S. Rice Leaf Disease Detection Using Machine Learning Techniques. In Proceedings of the 2019 International Conference on Sustainable Technologies for Industry 4.0 (STI), Dhaka, Bangladesh, 24–25 December 2019. [Google Scholar]
- Wang, Y.; Wang, H.; Peng, Z. Rice Diseases Detection and Classification Using Attention Based Neural Network and Bayesian Optimization. Expert Syst. Appl. 2021, 178, 114770. [Google Scholar] [CrossRef]
- Zhang, X.; Li, F.; Zheng, H.; Mu, W. Upformer: U-Sharped Perception Lightweight Transformer for Segmentation of Field Grape Leaf Diseases. Expert Syst. Appl. 2024, 249, 123546. [Google Scholar] [CrossRef]
- Wang, J.; Zhang, Z.; Luo, L.; Wei, H.; Wang, W.; Chen, M.; Luo, S. Dualseg: Fusing Transformer and Cnn Structure for Image Segmentation in Complex Vineyard Environment. Comput. Electron. Agric. 2023, 206, 107682. [Google Scholar] [CrossRef]


| Fruit and Leaf Type | Type of Disease | Original Image | Hazards | Challenges |
|---|---|---|---|---|
| Grape | Brown spot |  | Disrupts leaf photosynthesis and triggers early defoliation. | The image is disturbed by background noise (background blur), which blurs the blade edge information, and can affect the segmentation of the model. |
| Grape | Black rot | 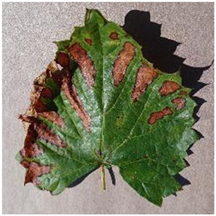 | It will increase the population of pathogenic bacteria. | Leaf blade edges are curled, resulting in poorly defined edge features. |
| Pomegranate | Cercospora spot | 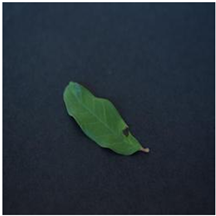 | It increases the rate of diseased leaves, and early leaf fall is obvious, which is unfavorable to flower bud differentiation. | Darker lighting conditions result in spot features that are similar to the background information, making feature extraction difficult. |
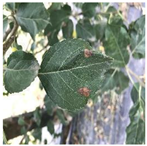
| Apple | Spotted leaf drop disease | 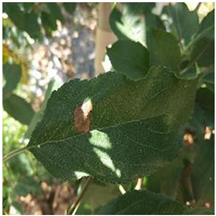 | Causes early defoliation, weakens fruit trees and affects fruit production. | Due to different lighting conditions during image acquisition, the reflected light on the surface of leaves or fruits may cause uneven brightness, increasing the difficulty of segmentation. |
| Indoor Pictures | Outdoor Pictures | ||||
|---|---|---|---|---|---|
| Apple Spotted Leaf Drop Disease | Grape Black Rot | Pomegranate Cercospora Spot | Grape Brown Spot | Apple Spotted Leaf Drop Disease | |
| Original | 157 | 677 | 271 | 866 | 335 |
| Enhanced | 785 | 3385 | 1355 | 4330 | 1675 |
| Total | 942 | 4062 | 1626 | 5196 | 2010 |
| Method | Grape Brown Spot | |||||||||||
|---|---|---|---|---|---|---|---|---|---|---|---|---|
| mIoU | mPA | Precision | Recall | |||||||||
| Early Stage | End Stage | Disease Spot | EARLY STAGE | End Stage | Disease Spot | Early Stage | End Stage | Disease Spot | Early Stage | End Stage | Disease Spot | |
| PSPNet | 91.0% | 92.0% | 40.0% | 95.0% | 97.0% | 48.0% | 95.0% | 95.0% | 95.0% | 95.0% | 97.0% | 48.0% |
| HRNetV2 | 95.0% | 94.0% | 77.0% | 97.0% | 97.0% | 85.0% | 97.0% | 97.0% | 89.0% | 97.0% | 97.0% | 85.0% |
| U-Net | 90.0% | 90.0% | 77.0% | 94.0% | 96.0% | 85.0% | 95.0% | 94.0% | 89.0% | 94.0% | 96.0% | 85.0% |
| DeepLabv3+ | 93.0% | 92.0% | 80.0% | 95.0% | 97.0% | 88.0% | 98.0% | 95.0% | 89.0% | 95.0% | 97.0% | 88.0% |
| SegFormer | 90.0% | 91.0% | 73.0% | 94.0% | 93.0% | 79.0% | 96.0% | 97.0% | 90.0% | 95.0% | 97.0% | 80.0% |
| FCN | 93.0% | 93.0% | 78.0% | 98.0% | 96.0% | 50.0% | 94.0% | 90.0% | 88.0% | 95.0% | 94.0% | 55.0% |
| Ours | 96.0% | 96.0% | 85.0% | 98.0% | 98.0% | 89.0% | 98.0% | 98.0% | 94.0% | 98.0% | 98.0% | 89.0% |
| Method | Pomegranate Cercospora Spot | Apple Spotted Leaf Drop Disease | ||||||||
|---|---|---|---|---|---|---|---|---|---|---|
| mIoU | mPA | Precision | Recall | mIoU | mPA | Precision | Recall | |||
| Leaf | Disease | Leaf | Disease | |||||||
| PSPNet | 65.00% | 29.00% | 51.00% | 80.00% | 51.00% | 83.00% | 39.00% | 62.50% | 84.00% | 64.50% |
| HRNetV2 | 96.00% | 72.00% | 89.50% | 92.50% | 89.50% | 97.00% | 72.00% | 90.50% | 91.00% | 90.50% |
| U-Net | 86.00% | 67.00% | 89.00% | 89.00% | 79.00% | 82.00% | 65.00% | 85.00% | 89.50% | 85.00% |
| DeepLabv3+ | 96.00% | 68.00% | 90.50% | 88.50% | 90.50% | 86.00% | 65.00% | 86.50% | 85.50% | 86.50% |
| SegFormer | 95.00% | 73.00% | 90.00% | 92.50% | 90.00% | 95.00% | 69.00% | 88.00% | 91.00% | 88.00% |
| FCN | 95.00% | 66.00% | 82.00% | 96.50% | 82.00% | 86.00% | 70.00% | 72.00% | 91.50% | 72.00% |
| Ours | 97.00% | 82.00% | 93.50% | 95.00% | 93.50% | 97.00% | 83.00% | 94.50% | 95.00% | 94.50% |
| Method | mIoU | mPA | Acc | F_Score | Total Parameters/M | FLOPs/G |
|---|---|---|---|---|---|---|
| PSPNet | 60.12% | 65.83% | 96.25% | 70.80% | 19.08 | 42.73 |
| HRNetV2 | 79.04% | 84.52% | 98.10% | 89.20% | 22.77 | 29.54 |
| U-Net | 68.74% | 75.67% | 95.58% | 79.60% | 24.89 | 103.00 |
| DeepLabv3+ | 77.82% | 83.98% | 97.88% | 87.90% | 23.81 | 33.24 |
| SegFormer | 77.35% | 84.52% | 96.25% | 70.80% | 3.72 | 3.41 |
| FCN | 70.49% | 74.93% | 89.11% | 85.30% | 18.88 | 30.23 |
| Ours | 88.60% | 93.49% | 98.60% | 95.90% | 22.03 | 32.92 |
| Method | mIoU | mPA | Acc | F_Score |
|---|---|---|---|---|
| CBAM | 65.72% | 70.52% | 95.74% | 88.40% |
| SK Attention | 70.48% | 72.87% | 96.37% | 90.40% |
| SE Attention | 70.49% | 74.93% | 96.25% | 89.40% |
| CoAttention | 72.90% | 76.25% | 97.27% | 90.80% |
| Global Context Attention | 72.76% | 76.28% | 97.08% | 90.60% |
| Multi-Head Attention | 82.88% | 96.98% | 96.98% | 90.90% |
| H-Attention | 88.60% | 93.49% | 98.60% | 95.90% |
| H-Attention (Seg-Block) | Structure (FFM) | ELD | mIoU | Acc | F_Score | mPA | |
|---|---|---|---|---|---|---|---|
| Method 1 | - | - | - | 77.35% | 97.22% | 88.60% | 83.31% |
| Method 2 | - | √ | √ | 86.02% | 98.35% | 93.80% | 90.42% |
| Method 3 | √ | - | - | 85.44% | 98.21% | 93.50% | 90.62% |
| Method 4 | √ | √ | √ | 88.60% | 98.60% | 95.90% | 93.49% |
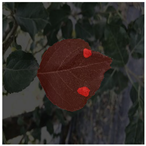
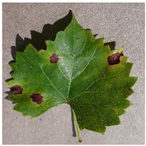
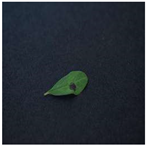
| Original Image | Visualized Image | Label | Value | Ratio | Disease Ratio |
|---|---|---|---|---|---|
 |  | Background | 214,067 | 81.66% | 4.03% |
| Leaf | 46,137 | 17.60% | |||
| Disease spots | 1940 | 0.74% | |||
 | 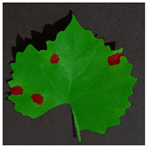 | Background | 143,367 | 54.69% | 2.21% |
| Leaf | 113,849 | 43.43% | |||
| Disease spots | 4928 | 1.88% | |||
 | 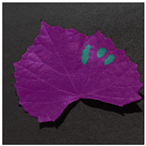 | Background | 153,171 | 58.43% | 3.22% |
| Leaf | 105,461 | 40.23% | |||
| Disease spots | 3512 | 1.34% | |||
 | 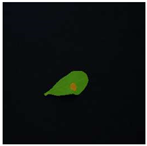 | Background | 253,388 | 96.66% | 5.98% |
| Leaf | 8231 | 3.14% | |||
| Disease spots | 525 | 0.20% |
Disclaimer/Publisher’s Note: The statements, opinions and data contained in all publications are solely those of the individual author(s) and contributor(s) and not of MDPI and/or the editor(s). MDPI and/or the editor(s) disclaim responsibility for any injury to people or property resulting from any ideas, methods, instructions or products referred to in the content. |
© 2024 by the authors. Licensee MDPI, Basel, Switzerland. This article is an open access article distributed under the terms and conditions of the Creative Commons Attribution (CC BY) license (https://creativecommons.org/licenses/by/4.0/).
Share and Cite
Jiang, D.; Sun, M.; Li, S.; Yang, Z.; Cao, L. EFS-Former: An Efficient Network for Fruit Tree Leaf Disease Segmentation and Severity Assessment. Agronomy 2024, 14, 1992. https://doi.org/10.3390/agronomy14091992
Jiang D, Sun M, Li S, Yang Z, Cao L. EFS-Former: An Efficient Network for Fruit Tree Leaf Disease Segmentation and Severity Assessment. Agronomy. 2024; 14(9):1992. https://doi.org/10.3390/agronomy14091992
Chicago/Turabian StyleJiang, Donghui, Miao Sun, Shulong Li, Zhicheng Yang, and Liying Cao. 2024. "EFS-Former: An Efficient Network for Fruit Tree Leaf Disease Segmentation and Severity Assessment" Agronomy 14, no. 9: 1992. https://doi.org/10.3390/agronomy14091992
APA StyleJiang, D., Sun, M., Li, S., Yang, Z., & Cao, L. (2024). EFS-Former: An Efficient Network for Fruit Tree Leaf Disease Segmentation and Severity Assessment. Agronomy, 14(9), 1992. https://doi.org/10.3390/agronomy14091992