Article

Carbon and Nitrogen Stocks in Soil under Native Pastures in the Pantanal Wetland Biome, Brazil

by
Diego Antonio França de Freitas
1,*,
Marx Leandro Naves Silva
2,
Evaldo Luis Cardoso
3,
Dener Marcio da Silva Oliveira
1,4,
Mara Regina Moitinho
5 and
Nilton Curi
2
1
Institute of Agricultural Sciences, Federal University of Viçosa (UFV), Florestal Campus, Rodovia LMG 818, km 06, Florestal 35690-000, MG, Brazil
2
Department of Soil Science, Federal University of Lavras (UFLA), Trevo Rotatório Professor Edmir Sá Santos, Lavras 37203-202, MG, Brazil
3
Pantanal Unit, Brazilian Agricultural Research Corporation (EMBRAPA), Rua 21 de Setembro 1880, Corumbá 79320-900, MS, Brazil
4
Research Centre for Greenhouse Gas Innovation (RCGI), Av. Professor Mello Moraes, 2231, Cidade Universitária, São Paulo 05508-030, SP, Brazil
5
School of Agricultural and Veterinary Sciences, São Paulo State University (FCAV–UNESP), Via de Acesso Prof. Paulo Donato Castellane, s/n, Jaboticabal 14884-900, SP, Brazil
*
Author to whom correspondence should be addressed.
Agronomy 2024, 14(9), 1994; https://doi.org/10.3390/agronomy14091994
Submission received: 1 July 2024 / Revised: 18 August 2024 / Accepted: 30 August 2024 / Published: 2 September 2024
(This article belongs to the Special Issue Climate-Smart Agriculture for a Changing World)

Abstract

:
The Pantanal has a high diversity of native pastures that provide food for many wild and domestic animals. Pantanal cattle raising is practiced in an extensive grazing-based system that varies according to the flood levels in the area. This study aimed to evaluate the fractions of soil organic matter in areas of native pastures under different uses and to quantify C and N stocks in sandy soils of the Pantanal. Soil samples from three native pastures differentiated by the predominance of Hymenachne amplexicaulis, Axonopus purpusii, and Mesosetum chaseae under different land use systems (continuous grazing and no grazing for five years) were collected and used to quantify the contents of carbon, nitrogen, and humic fractions. The dynamics of SOM are modified in grazed areas of the Pantanal, with influence on C and N, including their stocks. Native pastures of Axonopus purpusii and Hymenachne amplexicaulis showed an increase in organic matter after five years without grazing, while Mesosetum chaseae showed lower soil density and nitrogen levels. The highest C stock was observed in ungrazed areas of H. amplexicaulis (127.41 Mg ha−1 in the 0–40 cm layer). The dynamics of nitrogen in Pantanal pastures are influenced by the type of vegetation and land management, with higher nitrogen content in the surface layer (0–10 cm) and an increasing C/N ratio with soil depth, indicating lower nitrogen availability.

1. Introduction

With agriculture and livestock expansion, concerns about the growing emissions of greenhouse gases, mainly CO2, from cultivation practices and soil management in production systems are intensifying [1]. However, soils can also function as a carbon (C) sink, as they have a high potential to sequester C and mitigate climate change [2,3,4,5]. The soil can be a source or sink of carbon depending on its management [1,6], and the most sustainable management practices must necessarily be adapted to the specific characteristics of each biome or region [5], aiming to benefit from increased soil fertility and higher nutrient availability, better conditions for soil organic matter (SOM), improved physical attributes, and higher potential to sequester C [3].
According to MapBiomas [7], the Brazilian Pantanal, recognized as a Biosphere Reserve and World Heritage Site, has 65% of its territory in the State of Mato Grosso do Sul and the second lowest mean soil carbon stock relative to the other biomes in Brazil. According to the survey, while Brazilian soils hold a total of 37 billion tons of organic carbon, averaging 45 tons per hectare, the Pantanal averages 38 tons per hectare, just above the Caatinga’s 31 tons. The Pantanal stores a total of 0.6 gigatons of soil organic carbon, with 0.5 gigatons in natural areas and 0.1 gigatons in anthropic areas, whose original vegetation has been altered [7]. Given this panorama, understanding the characteristics of this important ecosystem is fundamental for the adoption of management practices that improve the understanding of the dynamics of carbon capture and emission in the soil and the monitoring of the impact and implementation of low-carbon agriculture practices in Brazil.
The Pantanal is the largest continuous floodplain on the planet and has extensive areas of native pastures that constitute the food base for wild herbivores and domestic animals used for livestock production [8]. However, despite the richness and diversity of its ecosystems, this region has high environmental fragility mainly because it depends on the flood regime to maintain ecological processes, as this is one of the factors that govern biodiversity in the Pantanal [9,10], and due to the little knowledge about the functioning of their ecosystems [11].
The Pantanal has, in some areas, sandy soils with low nutrient contents, with SOM being of fundamental importance for the sustainability of these systems. In this region, SOM can be decomposed at an accelerated rate due to high mean temperatures and precipitation [12]. Therefore, special care must be prioritized for the maintenance and storage of SOM in the Pantanal, as the maintenance of this biome is associated with vegetation cover and soil biogeochemical processes [9].
The reduction in SOM contents influences several soil properties, such as water and nutrient retention capacity, aggregation, aggregate stability, and soil aeration. SOM can be used as an indicator of soil quality [13], but its fractions are often more sensitive to environmental changes [14]. The SOM fractions can be divided into C-fulvic acid fraction (C-FAF), C-humic acid fraction (C-HAF), and C-humin fraction (C-HuF), the latter showing high molecular weight and resistance to biodegradation, accumulating C in the soil for long periods [14,15]. SOM distribution in fractions varies depending on the type of soil, vegetation, and use and management [16]. Humic fractions play an important role in providing nutrients to crops, cation retention, complexation of toxic elements and micronutrients, aggregate stability, and influencing microbial activity and biomass [12,14].
Soils accumulate more C than vegetation [17]. However, forests tend to accumulate more C in the shoot [18] and pastures in the root system [19]. Pastures can accumulate more C than forests due to denser root systems [20], litter accumulation, availability of more recalcitrant waste [21], and the return of OM and nutrients in feces and urine released by animals [22].
The tropical region presents controversies regarding the dynamics of SOM under pastures. Thus, SOM stocks can be maintained or increased after pasture cultivation in the Brazilian Cerrado region compared to native vegetation [23]. Roscoe et al. [24] reported that SOM contents after 23 years of pasture cultivation remained the same as those in native areas in the first 100 cm of soil depth in the Brazilian Cerrado. On the other hand, Detwiller [25] and Houghton et al. [26] estimated losses in C content between 20% and 25%, respectively, in areas cultivated with pastures. In the Pantanal, few studies have shown changes in SOM in pasture areas. Cardoso et al. [9] identified a reduction in C stock after the conversion of native forest to pasture and exposure of native pasture to continuous grazing. In this biome, Fernandes et al. [27] identified that the total organic C content of the soil decreased significantly in the area under pasture cultivated for 20 years relative to the native Cerrado in the 0–40 cm layer. Kaschuk et al. [28] identified a reduction in SOM through meta-analyses of several studies for the Pantanal after the conversion of forests into pastures.
Despite the richness and importance of ecosystems for maintaining biodiversity, the Pantanal is still an under-researched biome, especially regarding its abiotic aspects. Therefore, this study aimed to evaluate the fractions of soil organic matter in areas of native pastures under different uses and to quantify C and N stocks in sandy soils in the Pantanal.

2. Materials and Methods

2.1. Characterization of the Areas under Study

The study was conducted on the Embrapa Pantanal experimental farm (latitude 18°59′06″ and 19°00′06″ S and longitude 56°39′40″ and 55°40′40″ W), in the Pantanal of Nhecolândia, Mato Grosso do Sul, Brazil. The regional climate is classified as sub-humid tropical (Köppen’s Aw), with a dry winter, rain in the summer, annual rainfall between 1000 and 1400 mm, and air temperatures with annual means of 26 °C. The altitude varies between 100 and 120 m [29], and the soil in the sampled area is an Entisol (Neossolo Quartzarênico órtico), classified in the sandy textural class [30].
The areas under study were represented by native pastures located in three distinct topographic gradients and differentiated in terms of the predominance of certain grasses, all of which were subjected to the continuous grazing system and no grazing, being: (i) native pasture characterized by the predominance of Hymenachne amplexicaulis, located in a lowered area and subject to seasonal flooding (Ha-G—under continuous grazing; Ha-N—no grazing for five years); (ii) native pasture characterized by the predominance of Axonopus purpusii, located in an area of intermediate elevation (topographic position slightly higher than the previous one) and subject to occasional flooding (Ap-G—under continuous grazing; Ap-N—no grazing for five years); and (iii) native pasture with a predominance of Mesosetum chaseae, located in an area with a higher elevation (topographic position slightly higher than the previous one) and free from flooding (except for large floods) (Mc-G—Mesosetum chaseae under continuous grazing; Mc-N—no grazing for five years). The areas are grazed freely by various herbivores of different sizes that live in the Pantanal biome, in addition to cattle that are raised in the extensive production system. The non-grazed areas consist of 10 × 10 m plots fenced with wire, which prevents animals from entering.

2.2. Determination of Soil Attributes

Soil sampling was conducted in six native pasture use systems across three soil layers (0–10 cm, 10–20 cm, and 20–40 cm). Undisturbed samples collected using rings of known volume were used to determine soil bulk density [31], which was then used to calculate soil C and N stocks. The same soil bulk density value determined in the respective no-grazing ecosystem was adopted in grazed ecosystems to prevent soil compaction in pasture ecosystems caused by trampling by animals from resulting in higher stock values [9,32].
Organic carbon in humic fractions was quantified at the Federal University of Lavras using dry combustion in a Vario TOC Elementar analyzer coupled to an analytical balance [33,34]. The construction of the carbon standard curve used pure samples for analysis of PHP (potassium hydrogen phthalate, 47.05% C) and sucrose (42.1% C). Fulvic acid (C-FAF), humic acid (C-HAF), and humin (C-HuF) were obtained through chemical fractionation, according to the method proposed by the International Humic Substances Society (IHSS) [35]. The C-HAF/C-FAF and (C-HAF + C-FAF)/C-HuF ratios were calculated. The nitrogen content was determined using the TruMac CN equipment at USDA—Purdue University, where the samples were weighed, deposited in ceramic containers, and oxidized in a chamber with a controlled atmosphere. The homogenized gases were analyzed using a thermal conductivity cell to detect N2, and the nitrogen concentration was quantified and corrected for the temperature, pressure, and mass of the sample.

2.3. Data Processing and Analysis

The data were initially subjected to analysis of variance in a completely randomized experimental design with a triple factorial setup and three replications, according to the procedures of the statistical software Sisvar, version 5.6 [36]. The Scott–Knott test at the 5% probability was used to compare the means of different pastures and depths.
Subsequently, the data were subjected to exploratory multivariate cluster analyses using the hierarchical method and principal components. Cluster analysis using the hierarchical method is an exploratory multivariate technique that aims to gather sampling units into groups in such a way that there is homogeneity within the group and heterogeneity between them. The cluster structure contained in the data is seen in a graph called a dendrogram, constructed with the similarity matrix between samples [37,38]. The similarity matrix was constructed using Euclidean distance, and the clusters were linked using Ward’s method.
Principal component analysis is a technique that condenses the information contained in a set of original variables into a smaller set composed of new latent variables, preserving a relevant amount of the original information. The new variables are the eigenvectors (principal components) generated by linear combinations of the original variables, constructed with the eigenvalues of the covariance matrix [38]. The principal components whose eigenvalues were higher than unity were considered in the analysis according to the criterion established by Kaiser [39]. The coefficients of linear functions, which define the principal components, were used to interpret their meaning, using the sign and relative size of the coefficients as an indication of the weight to be assigned to each variable. Only coefficients with high values were considered for interpretation, usually those higher than or equal to 0.70 in absolute value. All statistical procedures were conducted in the R software, version R 4.1.2 [40].

3. Results

3.1. Effect of Pastures on Soil Carbon Content and Stock

The surface layer was the most influenced by the forms of use. The native pastures dominated by A. purpusii, H. amplexicaulis, and M. chaseae showed a high variation in C content in the soil, with values between 2.66 and 129.67 g kg−1 in the 0–10 cm layer. C values for the 20–40 cm layer varied between 5.03 and 0.91 g kg−1 (Table 1).
The pastures with a predominance of H. amplexicaulis presented higher C contents than the other pastures, as they are in areas located on the edges of bays and which, depending on the flood intensity, may remain submerged for a few months, with the deposition of a large number of plant residues that accumulate after flooding. Similarly, the areas of H. amplexicaulis with no grazing had higher C contents than grazed areas for the 0–10 and 10–20 cm layers but with similar contents for the 20–40 cm layer (Table 1).
The C content in pastures dominated by M. chaseae was higher in the surface soil layer of grazed environments compared to non-grazed areas (Table 1), indicating that grazing promotes greater C accumulation in the surface layer. This may occur because areas with more intensive grazing show infestations of other plant species, which contribute more C to the soil than M. chaseae. An indicator of species invasion in grazed areas is the higher N content observed in these systems compared to no-grazing areas. No-grazed and grazed areas had equal C contents at depths of 10–20 and 20–40 cm, which shows that the effect of maintaining the area as a reserve or degraded is more pronounced in the surface soil layer (Table 2).
Soil bulk density values showed high variability between pastures, with values of 0.48 kg dm−3 for H. amplexicaulis areas, which have high C contents, up to 1.33 kg dm−3, in grazed areas of M. chaseae (Table 1). Among the areas with A. purpusii, the grazed system presented a higher soil bulk density than the no-grazed area for the surface soil layer (0–10 cm). Grazed and non-grazed areas showed similar soil bulk density values at depths of 10–20 and 20–40 cm. The different management systems of Mesosetum pastures resulted in minor changes in soil bulk density, which ranged from 1.25 to 1.33 kg dm−3 (Table 1).
Soil C stocks reduced as depth increased for all pastures (Table 1). Continuous grazing in H. amplexicaulis areas did not change the C stock compared to the area not grazed for five years, regardless of the analyzed depth. This pasture presents a high reduction in C stock for the 20–40 cm layer, but it has a high capacity to retain C, storing 92.98 and 127.41 Mg ha−1 in the 0–40 cm depth for grazed and no-grazed areas, respectively. The highest C stock in M. chaseae pastures occurred in the grazed system for the surface soil layer. However, this system presented a C stock similar to no-grazed areas for the deeper soil layers.

3.2. Effect of Pastures on N Content and Soil C/N Ratio

In the studied areas, the N content varied from 0.38 to 13.06 g kg−1 in the surface layer of M. chaseae and H. amplexicaulis pastures, respectively (Table 2). No-grazed A. purpusii and M. chaseae pastures had lower N contents than the grazed systems for the surface soil layer. However, the N content for the 10–40 cm layers was similar between the two land use systems (Table 2).
Soil N stock showed high variation, with the lowest value observed for the no-grazed area in the A. purpusii pasture (0.74 Mg ha−1) and the highest values for the no-grazed area of H. amplexicaulis (5.97 Mg ha−1) in the surface soil layer (Table 2).
The C/N ratio of SOM showed no changes among the grazed and no-grazed systems for the 0–10 and 10–20 cm layers (Table 2). The C/N ratio in the 20–40 cm layer was lower only in the no-grazed A. purpusii pasture than in the grazed area.

3.3. SOM Fractionation and Relationships among Fractions

C in the humin fraction (C-HuF) was the SOM fraction with the highest occurrence in the soil, with mean matches of 81.8, 73.8, and 70.1% for H. amplexicaulis, A. purpusii, and M. chaseae pastures, respectively (Table 3). The grazed A. purpusii pasture system presented higher contents of C-FAF and C-HAF than the other systems, but the contents of C-HuF were similar to those in the no-grazed area.
All C fractions in the no-grazed H. amplexicaulis pasture were higher than the grazed area for the 0–10 cm surface soil layer, with a reduction in the concentration of organic fractions as soil depth increased. After 5 years without grazing by cattle and large native herbivores, the C-FAF and C-HAF contents in the grazed area were similar between the 0–10 and 10–20 cm layers, which indicates that labile SOM is incorporated beyond the surface where leaf deposition occurs, in H. amplexicaulis cultivation areas.
The no-grazed M. chaseae pasture presented a higher amount of C-FAH and C-HuF for the surface soil layer, but this system showed a high reduction with increasing soil depth for C-HuF. Therefore, this system has a recent deposition of organic material on the soil surface, which occurs due to the absence of grazing (Table 3).
As for humification, which refers to the breakdown of organic materials in soils and composts leading to the formation of humus [41,42,43], all studied pastures presented a reduction in the C-HAF/C-FAF ratio with increasing soil depth (Table 4), which shows a higher persistence of C-FAF in the deeper layers. Therefore, the 20–40 cm layer had a lower humification rate than the 0–10 cm layer for all analyzed pastures.
The ratio between the sum of humic and fulvic acids by the humin ((C-FAF+C-HAF)/C-HuF) indicates the proportion of SOM humification. Therefore, values lower than 1, as found in the studied areas (Table 4), represent soils with a higher proportion of the humin fraction, which is more stable in the soil. However, the ((C-FAF+C-HAF)/C-HuF) values increased for the deeper soil layers, which represents a reduction in the most stable fractions at depth for all analyzed grasses.

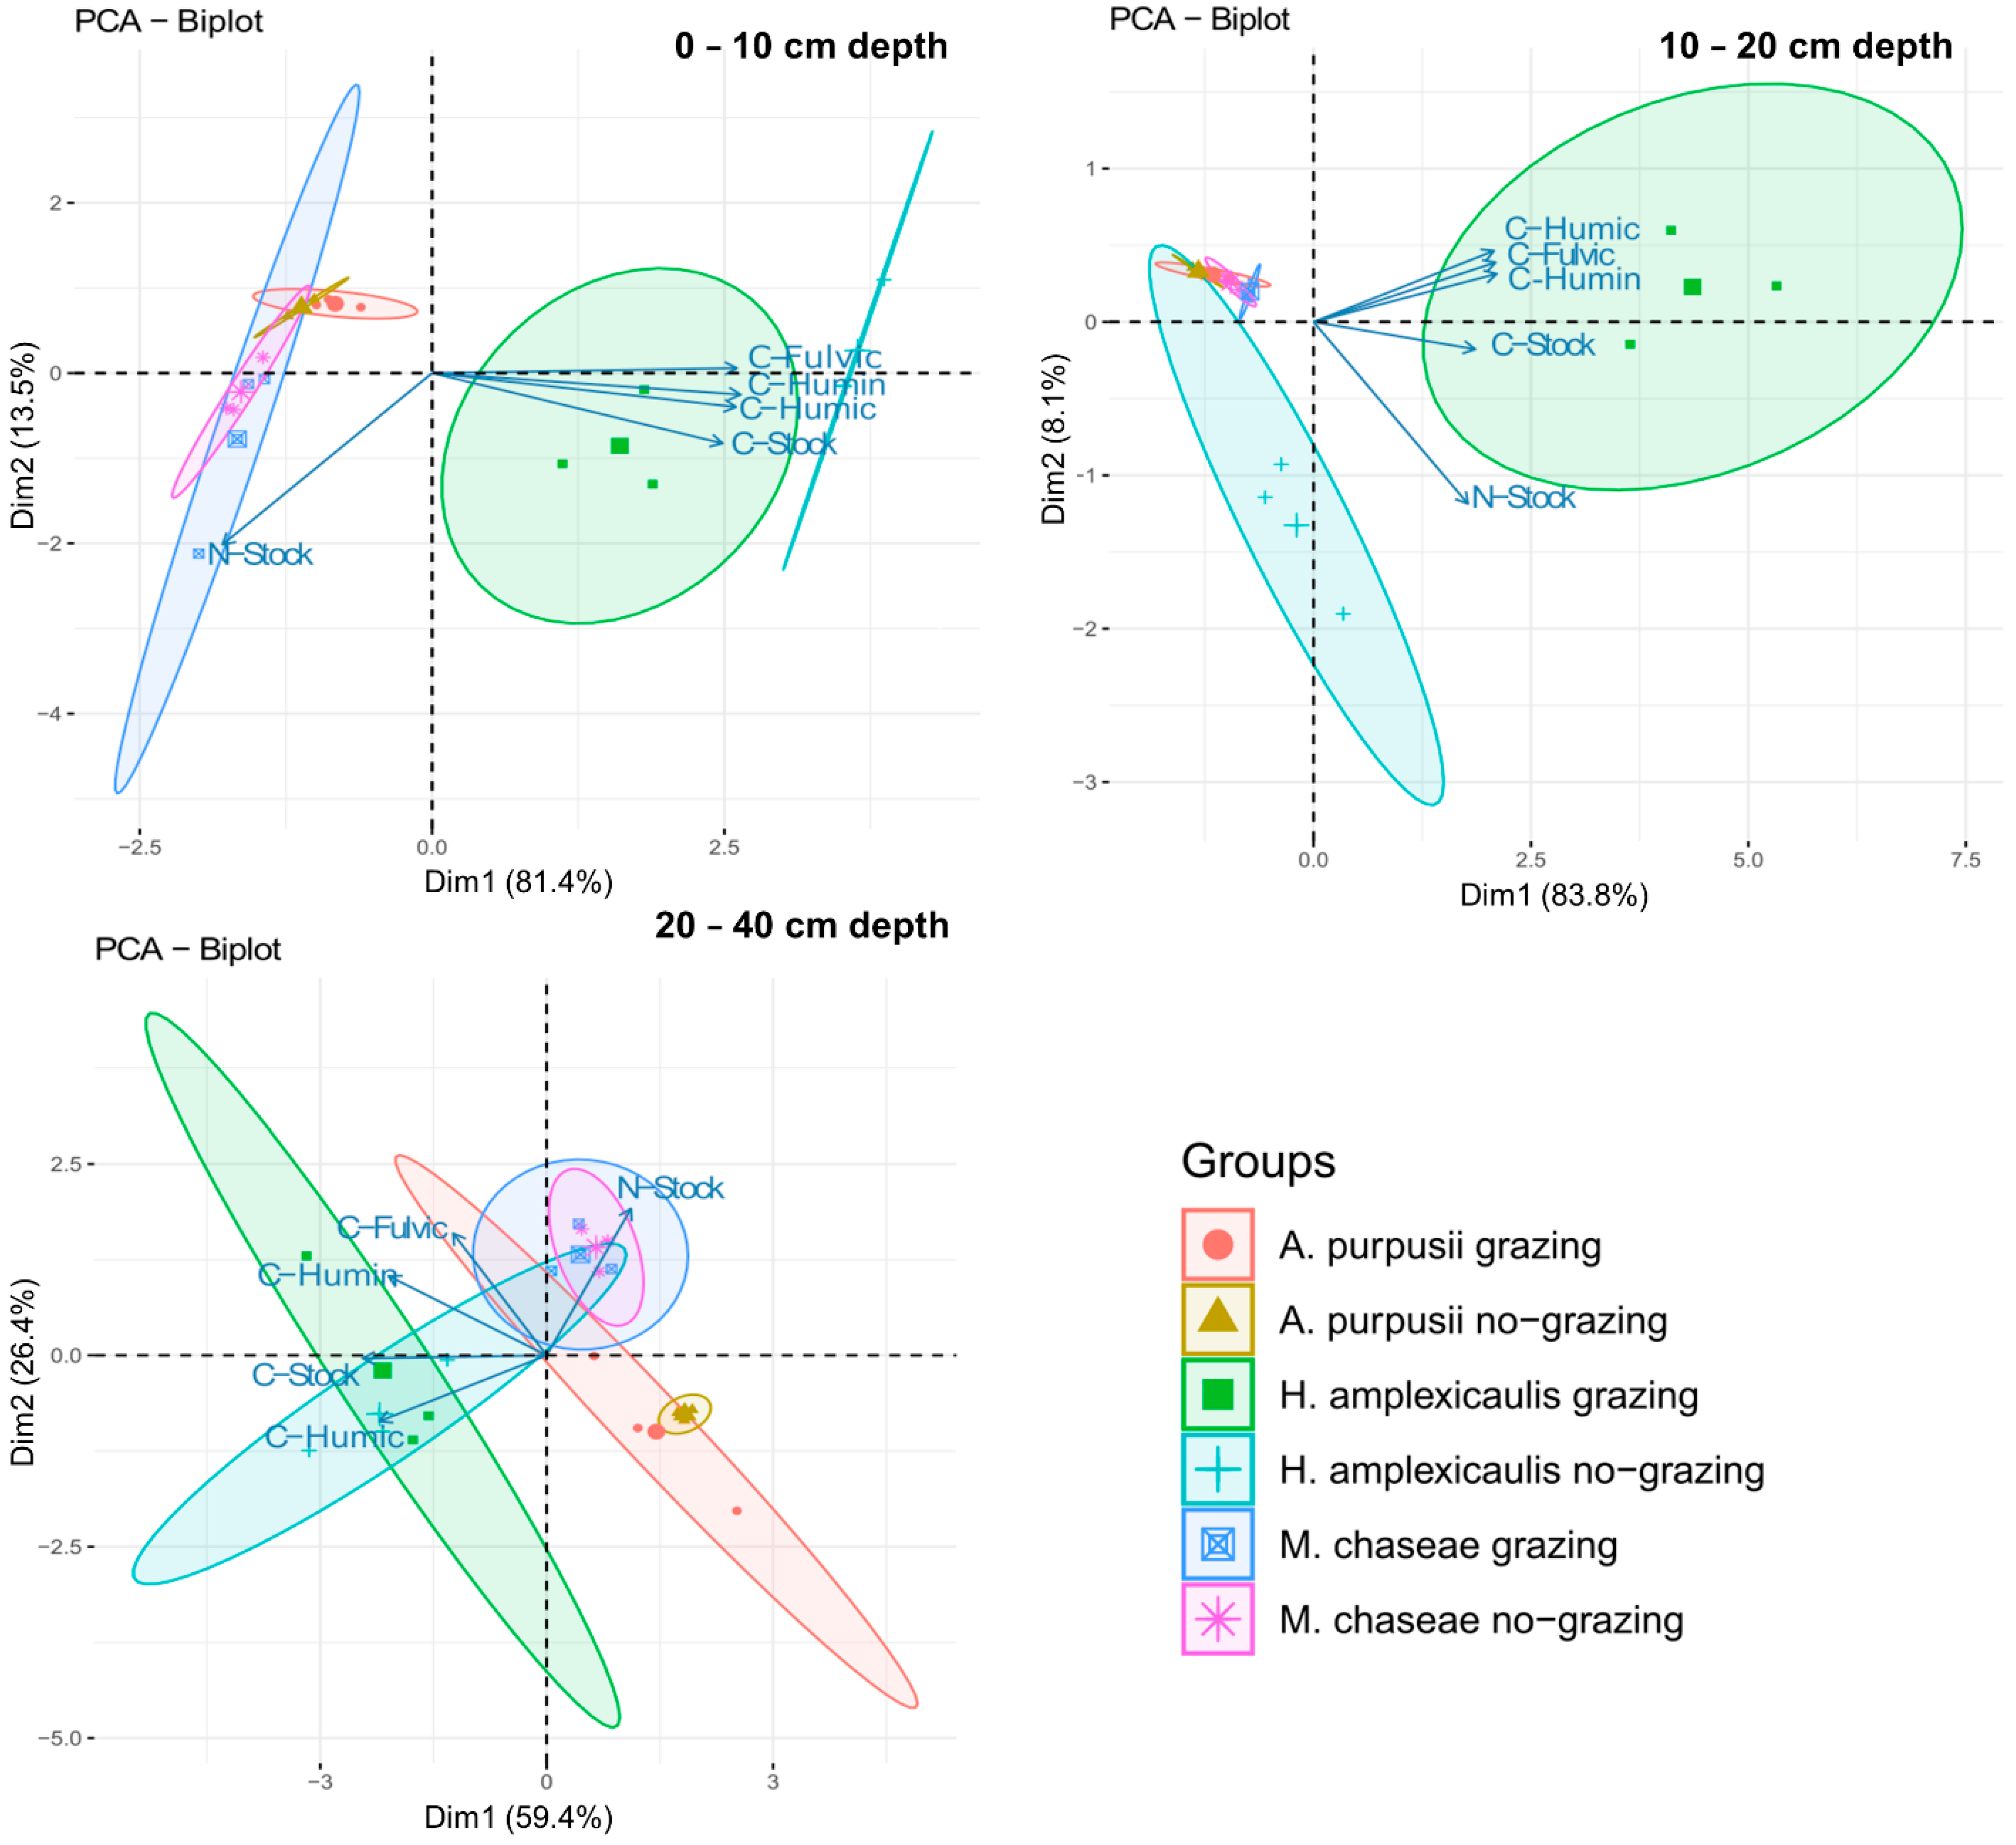
3.4. Interdependence Relationship among Pastures, SOM Fractions, and C and N Stocks

Multivariate analysis may be a very promising technique when considering that the fractions associated with the degree of SOM humification can indicate which natural pasture system has the highest potential to store carbon or nitrogen. It allows the identification of natural correlations and multiple influences on the behavior of the sample to be evaluated, that is, natural Pantanal pastures in the case of the present study.
The first (Dim1) and second (Dim2) principal components explained 94.9% (0–10 cm), 91.9% (10–20 cm), and 85.8% (20–40 cm) of the total variation in the original data when evaluated at different depths (Figure 1 and Table 5). The first component (Dim1) is the most important for the study, as it retains the highest percentage of variation and, consequently, the largest number of variables.
SOM fractions at a depth of 0–10 cm are directly associated with soil C stock but not associated with N stock, which is retained in the second principal component (Dim2), which is orthogonal to the first component and, therefore, independent.
Confidence ellipses are used in this study as statistical tools for multivariate analysis. They help to visualize the accuracy and variability of data in multidimensional space (biplot graph—Figure 1). Confidence ellipses are used to compare groups represented in this study by pastures. If there is an overlap of the ellipses, there is no difference between the pastures; if there is no overlap, there is a difference between these pastures within a 95% confidence interval.
The confidence ellipses (95% confidence) show that pastures with H. amplexicaulis grazing and H. amplexicaulis no-grazing differ from each other at the first depth, as the ellipses do not overlap, and both stand out from the other pastures, which are grouped on the left side of the biplot. Also, the scattering of points and width of the ellipses show higher variability in the area under grazed H. amplexicaulis pasture than the scattering under the no-grazing management. However, both areas are associated with higher carbon stocks and SOM fractions (fulvic and humic acids and humin), and these characteristics are shared among the H. amplexicaulis pasture regardless of the management. In contrast, the SOM fractions at a depth of 10–20 cm are related to both the C stock and the N stock but associated only with the grazed H. amplexicaulis pasture.
The correlation index of the attributes at a depth of 20–40 cm decreased when compared to the first two depths (Table 5), but the A. purpusii and M. chaseae pasture clusters stand out (Figure 1). At this depth, grazed and no-grazed H. amplexicaulis pastures do not differ from each other (overlapping ellipses) when the attributes are evaluated together. However, the soil under H. amplexicaulis still showed a higher concentration of SOM fractions (humic acid and humin) and carbon stock when compared to the other natural pastures.

4. Discussion

4.1. Soil Carbon and Nitrogen Dynamics in Natural Pastures

The higher C content in the 0–10 cm layer determined under the no-grazed pasture condition compared to the grazed area occurred due to the higher growth of A. purpusii vegetation cover in the no-grazed area, absence of cattle and horses grazing in this area, and higher nutrient cycling favored by maintaining biomass on site. Importantly, small wild animals feed in no-grazed areas [44], but these animals did not reduce the vegetation cover provided by this pasture. Our results are consistent with Moreira and Siqueira [45], who observed that areas with higher moisture and lower oxygen availability in the soil provide reduced decomposition of organic materials and higher C accumulation.
In general, the C contents found in areas that do not undergo annual flooding, characterized by A. purpusii and M. chaseae pastures, were close to those determined by Neill et al. [46] and Victoria et al. [47], who studied pastures in the Amazon and the Brazilian Pantanal, respectively. The H. amplexicaulis areas present high C contents due to the annual flooding and values similar to those determined by Ceballos et al. [48] for flooded areas. Thus, flooded areas can be considered C sinks [49] and represent the largest reservoirs of this element in the soil, contributing decisively to the global C cycle [50]. Xavier et al. [51] indicated that soil management practices that increase SOM content are important strategies for increasing fertility, especially in sandy soils, such as those found in the Pantanal of Nhecolândia, as they have low cation exchange capacity and little nutrient availability for plants.
Grazing also impacts soil bulk density, but this effect in well-managed pastures can also be beneficial for plant root growth [52]. Increases in SOM can be made through the deposition of animal urine and manure [22]. In our study, all areas presented soil bulk density values lower than those found by Reichert et al. [53] and Cardoso et al. [9]. However, grazed and degraded areas presented higher soil bulk density values for the surface soil layer (Table 1), as constant animal trampling reduces soil porosity in these areas [54].
In the present study, the grazed system presented higher soil bulk density, which is due to animal trampling, causing an increase in soil bulk density and changes in soil pore space [46]. Possibly, the high-density values in the no-grazed area are due to the grazing that occurred in the previous grazing period and the higher predisposition to soil moistening and drying cycles, as highlighted by Oliveira et al. [55].
Soil bulk density in the H. amplexicaulis pasture was lower in the grazed area than in the no-grazed area only for the surface soil layer (Table 1). This phenomenon, which occurs in the opposite way to what was expected, is possibly related to the fact that the grazed area has been disturbed by wild animals (feral pigs), which are common in these areas and turn over the soil in search of roots to feed on [44]. Thus, soil disturbance leads to a constant inversion of particles and a reduction in soil bulk density. Soil bulk density increases in deeper layers, regardless of the land use system, which is related to the substantial decrease in SOM content that occurs in H. amplexicaulis pastures at depth. Bulk density values in the 20–40 cm layer are the same between the different M. chaseae systems, which indicates that the effect of animal grazing is restricted to the first few centimeters of the soil [56].
The highest C stocks in the surface soil layer of A. purpusii pastures were found in the grazed area due to the higher soil bulk density values in this area than in the no-grazed area (Table 1). The increase in soil bulk density provides a higher soil C stock, as the amount of soil mass per volume in this situation is higher and represents higher C contents [57].
The C stock values in H. amplexicaulis areas exceed the values found by [46], Cardoso et al. [9], and Maia et al. [58] for pastures in Brazil and occurred due to the annual flooding to which they are subjected.
Thus, the higher C stock in the surface layer of M. chaseae pastures is possibly related to the high soil bulk density and the growth of other plant species, which develop in the area due to the degradation caused by grazing.
Soil C stock tends to increase with increasing soil clay content due to the physical and chemical protection that this soil fraction provides to organic matter [59,60]. Zinn et al. [61] showed that sandy soils in Brazil accumulate less C than clay soils, which is attributed to the easy dispersion of soil aggregates and exposure of organic matter, in addition to reduced adsorption and stabilization of organic derivatives generated by SOM decomposition. This reduction in C stock in sandy soils is of paramount importance in regions with a hot climate [62], such as the Pantanal of Nhecolândia.
Thus, the A. purpusii and M. chaseae pastures, not undergoing annual flooding, accumulated lower amounts of C than the tropical pastures studied by Carvalho et al. [63] and Moraes et al. [64] due to the high temperature in the region and high sand content in the soils of the Pantanal of Nhecolândia. However, Frazão et al. [65] studied pastures on sandy soils in Brazil and determined C stocks close to those found in soils where these grasses grow. Importantly, pastures that receive the addition of fertilizers and limestone tend to accumulate higher amounts of C in the soil [6], which is not the case observed in the pastures of the Pantanal of Nhecolândia.
Nitrogen is an important SOM fraction, and variation in its content depends on the type of organic material deposited on the soil [12]. The high variation in nitrogen content is a function of the type of vegetation, soil, degree of SOM decomposition, and land use [66]. Possibly, the higher SOM and soil moisture availabilities for the H. amplexicaulis area are the factors that provided the high N values. The 0–10 cm soil layer stores higher N contents than the other depths, as the surface layer has a higher deposition of organic material, which presents higher N content due to the low degree of decomposition.
Assessment of the C/N ratio of this soil is essential to understanding the C and N dynamics in the ecosystem. The C/N ratio is an index that allows the evaluation of the degree of SOM evolution and the biological activity of the soil depending on its capacity to produce assimilable nitrogen forms [67]. The lower the C/N ratio, the higher the N availability in SOM and the higher the SOM decomposition rate in the short term [2]. The C/N ratio in the deeper soil layers of all pastures was higher than in the surface layer (Table 2), which indicates a concentration of C relative to N and, indirectly, reflects the higher SOM recalcitrance, as C assimilation by decomposing microorganisms is accompanied by the simultaneous N assimilation [68].

4.2. SOM Humification in Native Pasture Areas

Our results show that the C in the humin fraction (C-HuF) was the SOM fraction most present in the soil (Table 3). The humin fraction is the most significant in terms of organic carbon reserves in soils, arising from the production, incorporation, decomposition, and mineralization rates of SOM, thus playing a crucial role in the carbon cycle [69]. C-HuF tends to accumulate in soils, as this is the most stable C fraction, especially lignin [35]. Furthermore, Moraes et al. [69] indicated that C-HuF has a high association with the mineral soil fraction, which increases the preservation of this organic fraction.
Higher concentrations of fulvic acid (C-FAF) and humic acid fractions (C-HAF) in the grazed system (A. purpusii pasture) (Table 3) probably occurred because C-FAF and C-HAF are less stable and represent the more recent processes that occur in soils, such as the deposition of waste by animals, reflecting to a lesser extent ancient processes [35]. The incorporation of labile SOM deep into the soil in the grazed area (Table 3) may reflect the activity of wild animals, which turn over the soil in these areas to feed on plant roots and seeds [44].
In general, maintaining high C contents in C-FAF and C-HAF becomes complex for hot regions and sandy soils [70], as is the case in the Pantanal. Thus, the high sand content in the soils of the Pantanal of Nhecolândia leads to reduced protection of SOM by this mineral fraction and, consequently, C-HuF accumulation, which is the most stable. This fraction represents a large part of the humified C in most tropical soils and can constitute up to 2/3 of the C, in addition to remaining in the soil for a long time. Differences in the composition of humic substances in the absence of soil disturbance are regulated mainly by microbial activity [58], and humification and the formation of molecules with higher molar mass are favored under this condition.
The C-HAF/C-FAF ratio is considered an indicator of the soil humification process and reflects the mobility of organic C in the soil [70]. Thus, values higher than 1 indicate a more advanced stage of MOS transformation, with a predominance of C-HAF [48]. C-HAF is considered the most important source of cation exchange in organic matter, and its presence in the soil can contribute to increasing the cation exchange capacity and nutrient cycling [71].
Guimarães et al. [70] reported that a C-HAF/C-FAF ratio higher than 1 indicates loss of the highest lability fraction, represented by C-FAF, which is a common situation in sandy soils. This rate higher than 1 was found in all pastures of the Pantanal, regardless of the system. However, the areas with higher moisture, represented by H. amplexicaulis, presented the highest values for all analyzed soil layers. According to Canellas et al. [72], these values may indicate high interaction between SOM and the mineral phase, which results in high SOM stability and higher concentration of humic fractions.
The relationships between SOM fractions and the soil C and N stock potential under different pastures (Figure 1) showed that the highest soil C stock in H. amplexicaulis pastures is directly associated with the highest C concentration in the humin fraction, and humic and fulvic acids, and these characteristics differentiate them from other pastures (Figure 1). As already discussed, the annual flooding that occurs in these areas possibly causes this C accumulation in the soil [55]. The M. chaseae and A. purpusii pastures did not differ from each other when SOM fractions and C and N stocks were analyzed together (Figure 1) at all depths, regardless of the use system. The similarity shown between these pastures is justified by their similar position in the landscape, that is, subject to occasional flooding and free from floods, showing lower intensity than in H. amplexicaulis when this occurs [73]. Thus, the frequency of flooding is possibly the main factor responsible for differentiating these pastures relative to C concentrations in the soil.
According to Couto and Oliveira [8], most soils in the Brazilian Pantanal have low fertility with reduced organic matter contents. In this biome, the maintenance of soil fertility depends mainly on the flooding of rivers, which are responsible for the annual contributions of SOM [74], and variations in relief, which lead to soil flooding and sediment accumulation [75].

5. Conclusions

  • Native pastures characterized by the predominance of Axonopus purpusii and Hymenachne amplexicaulis presented an increase in soil organic matter content when subjected to the absence of grazing for five years. The native pasture of Mesosetum chaseae had lower soil bulk density and lower contents of organic matter and nitrogen when subjected to the absence of grazing than under continuous grazing. The native pasture of Hymenachne amplexicaulis exhibited higher organic matter content due to its occurrence in a lower position in the landscape;
  • The dynamics of nitrogen in the soil of natural pastures in the Pantanal are strongly influenced by the type of vegetation and land management. The highest nitrogen contents are found in the surface layer (0–10 cm) due to the greater deposition of organic matter with a low degree of decomposition. As soil depth increases, the C/N ratio also increases, indicating a lower availability of assimilable nitrogen;
  • Continued monitoring of carbon and nitrogen stocks is crucial to assess the long-term impacts of land-use changes. Future research should focus on how agricultural intensification and different cropping systems can be adjusted to maximize carbon capture and nitrogen retention, thus contributing to the sustainability of Pantanal ecosystems.

Author Contributions

Conceptualization, D.A.F.d.F., M.L.N.S. and E.L.C.; methodology, D.A.F.d.F., M.L.N.S. and E.L.C.; software, D.A.F.d.F., M.L.N.S., E.L.C. and M.R.M.; validation formal analysis, D.A.F.d.F., M.L.N.S., E.L.C. and N.C.; investigation, D.A.F.d.F., M.L.N.S., E.L.C. and N.C.; resources, D.A.F.d.F., M.L.N.S., E.L.C. and N.C.; data curation, D.A.F.d.F., M.L.N.S. and E.L.C.; writing—original draft preparation, D.A.F.d.F., M.L.N.S., E.L.C. and N.C.; writing—review and editing, D.A.F.d.F., M.L.N.S., E.L.C., D.M.d.S.O., M.R.M. and N.C.; visualization, D.A.F.d.F., M.L.N.S., E.L.C., D.M.d.S.O., M.R.M. and N.C.; supervision, M.L.N.S., E.L.C. and N.C.; project administration, M.L.N.S., E.L.C. and N.C.; design of the work, D.A.F.d.F., M.L.N.S., E.L.C. and N.C.; drafting the work, D.A.F.d.F., M.L.N.S., E.L.C. and N.C.; revising it critically, D.A.F.d.F., M.L.N.S., E.L.C., D.M.d.S.O., M.R.M. and N.C. All authors have read and agreed to the published version of the manuscript.

Funding

This research received financial support from CNPq, FUNDECT, FAPEMIG, and CAPES.

Data Availability Statement

The original contributions presented in the study are included in the article; further inquiries can be directed to the corresponding author.

Acknowledgments

To the Federal University of Lavras and Embrapa Pantanal for institutional support.

Conflicts of Interest

The authors declare no conflicts of interest.

References

  1. Laborde, D.; Mamun, A.; Martin, W.; Piñeiro, V.; Vos, R. Agricultural subsidies and global greenhouse gas emissions. Nat. Commun. 2021, 12, 2601. [Google Scholar] [CrossRef]
  2. Bayer, C.; Martin-Neto, L.; Mielniczuk, J.; Pavinato, A.; Dieckow, J. Carbon sequestration in two Brazilian Cerrado soils under no-till. Soil Till. Res. 2006, 86, 237–245. [Google Scholar] [CrossRef]
  3. Lal, R. Challenges and oppottunities in soil organic matter research. Eur. J. Soil Sci. 2009, 60, 158–169. [Google Scholar] [CrossRef]
  4. Bossio, D.; Cook-Patton, S.; Ellis, P.; Fargione, J.; Sanderman, J.; Smith, P.; Wood, S.; Zomer, R.; von Unger, M.; Emmer, I.; et al. The role of soil carbon in natural climate solutions. Nat. Sustain. 2020, 3, 391–398. [Google Scholar] [CrossRef]
  5. Nwaogu, C.; Cherubin, M. Integrated agricultural systems: The 21st century nature-based solution for resolving the global FEEES challenges. Sci. Direct 2024, 185, 1–73. [Google Scholar]
  6. La Scala, N.; Figueiredo, E.; Panosso, A. A review on soil carbon accumulation due to the management change of major Brazilian agricultural activities. Bras. J. Bio. 2012, 72, 775–785. [Google Scholar] [CrossRef] [PubMed]
  7. MAPBIOMAS—Mapeamento Inédito Indica que Brasil Estoca no Solo o Equivalente a 70 Anos das Emissões de CO2 do País. 2021. Available online: https://brasil.mapbiomas.org/2023/06/21/mapeamento-inedito-indica-que-brasil-estoca-no-solo-o-equivalente-a-70-anos-das-emissoes-de-co2-do-pais/ (accessed on 20 June 2024).
  8. Couto, E.; Oliveira, M. The soil diversity of the Pantanal. In The Pantanal: Ecology, Biodiversity and Sustainable Management of a Large Neotropical Seasonal Wetland; Junk, W., Da Silva, C., Nunes da Cunha, C., Wantzen, K., Eds.; Pensoft Publishers: Sofia, Bulgaria, 2011; pp. 40–64. [Google Scholar]
  9. Cardoso, L.; Silva, M.; Silva, C.; Curi, N.; Freitas, D. Estoques de carbono e nitrogênio em solo sob florestas nativas e pastagens no bioma Pantanal. Pesq. Agropec. Bras. 2010, 45, 1028–1035. [Google Scholar] [CrossRef]
  10. Louzada, R.; Bergier, I.; McGlue, M.; Roque, F.; Rasbold, G.; Domingos-Luz, L.; Edward, L. Fluvial avulsions influence soil fertility in the Pantanal wetlands (Brazil). Sci. Total Environ. 2024, 926, 172127. [Google Scholar] [CrossRef]
  11. Barbiero, L.; Rezende Filho, A.; Firquim, S.; Furian, S.; Sakamoto, A.; Valles, V.; Graham, R.; Fort, M.; Ferreira, R.; Queiroz Neto, J. Soil morphological control on saline and freshwater lake hydrogeochemistry in the Pantanal of Nhecolândia, Brazil. Geoderma 2008, 148, 91–106. [Google Scholar] [CrossRef]
  12. Santos, G.; Silva, L.; Canellas, L.; Camargo, F. Fundamentos da Matéria Orgânica do Solo: Ecossistemas Tropicais e Subtropicais; Genesis: Porto Alegre, Brazil, 2008; p. 654. [Google Scholar]
  13. Wendling, B.; Jucksch, I.; Mendonça, E.; Alvarenga, R. Organic-matter pools of soil under pines and annual cultures. Commun. Soil Sci. Plant Anal. 2010, 41, 1707–1722. [Google Scholar] [CrossRef]
  14. Tiwari, J.; Ramanathan, A.; Bauddh, K.; Korstad, J. Humic substances: Structure, function and benefits for agroecosystems—A review. Pedosphere 2023, 33, 237–249. [Google Scholar] [CrossRef]
  15. West, T.; Post, W. Soil organic carbon sequestration rates by tillage and crop rotation: A global data analysis. Soil Sci. Soc. Am. J. 2002, 66, 1930–1946. [Google Scholar] [CrossRef]
  16. Stevenson, F. Humus Chemistry: Genesis, Composition, Reactions, 2nd ed.; John Wiley and Sons: New York, NY, USA, 1994; p. 496. [Google Scholar]
  17. Garnett, M.; Ineson, P.; Stevenson, A.; Howard, D. Terrestrial organic carbon in a British moorland. Glob. Change Biol. 2001, 7, 375–388. [Google Scholar] [CrossRef]
  18. Fujisaka, S.; Castilla, C.; Escobar, G.; Rodrigues, V.; Veneklaas, E.; Thomas, R.; Fisher, M. The effects of forest conversion on annual crops and pastures: Estimates of carbon emissions and plant species loss in a Brazilian Amazon colony. Agric. Ecosyst. Environ. 1998, 69, 17–26. [Google Scholar] [CrossRef]
  19. Lal, R. Soil carbon dynamics in cropland and rangeland. Environ. Pollut. 2002, 116, 353–362. [Google Scholar] [CrossRef] [PubMed]
  20. Camill, P.; Mckone, M.; Sturges, S.; Severud, W.; Ellis, E.; Limmer, J.; Martin, C.; Purdir, A.; Sandel, B.; Talukder, S.; et al. Community and ecosystem-level changes in a species-rich tallgrass prairie restoration. Ecol. Appl. 2004, 14, 1680–1694. [Google Scholar] [CrossRef]
  21. Mahaney, W.; Smemo, K.; Gross, K. Impacts of C4 grass introductions on soil carbon and nitrogen cycling in C3-dominated successional systems. Ecosyst. Ecol. 2008, 157, 295–305. [Google Scholar] [CrossRef] [PubMed]
  22. Oliveira, J.; Santana, M., Jr.; Maia, N.; Dubeux, J., Jr.; Gameiro, A.; Kunrath, T.; Mendonça, G.; Simili, F. Nitrogen balance and efficiency as indicators for monitoring the proper use of fertilizers in agricultural and livestock systems. Sci. Rep. 2022, 12, 12021. [Google Scholar] [CrossRef]
  23. Roscoe, R.; Boddey, R.; Salton, J. Sistemas de manejo e matéria orgânica do solo. In Dinâmica da Matéria Orgânica do Solo em Sistemas Conservacionistas: Modelagem Matemática e Métodos Auxiliaries; Roscoe, R., Mercante, F., Salton, J., Eds.; Embrapa Agropecuária Oeste: Dourados, Brazil, 2006; pp. 17–41. [Google Scholar]
  24. Roscoe, R.; Buurman, P.; Velthorst, E.; Vasconcellos, C. Soil organic matter dynamics in density and particle-size fractions as revealed 13 12 by the C/C isotopic ratio in a Cerrado’s Oxisol. Geoderma 2001, 104, 185–202. [Google Scholar] [CrossRef]
  25. Detwiller, R. Land use changes and the global carbon cycle: The role of tropical soils. Biogeochemistry 1986, 2, 67–93. [Google Scholar] [CrossRef]
  26. Houghton, R.; Hobble, J.; Melillo, J.; Moore, B.; Peterson, B.; Shaver, G.; Woodwell, G. Changes in the carbon content of terrestrial biota and soils between 1860 and 1980: A net release of CO2 to the atmosphere. Ecol. Monog. 1983, 53, 235–262. [Google Scholar] [CrossRef]
  27. Fernandes, F.; Cerri, C.; Fernandes, A. Alterações na matéria orgânica de um podzol hidromórfico pelo uso com pastagens cultivadas no Pantanal Mato-Grossense. Pesq. Agropec. Bras. 1999, 34, 1943–1951. [Google Scholar] [CrossRef]
  28. Kaschuk, G.; Aalberton, O.; Hungria, M. Quantifying effects of different agricultural land uses on soil microbial biomass and activity in Brazilian biomes: Inferences to improve soil quality. Plant Soil 2011, 338, 467–481. [Google Scholar] [CrossRef]
  29. Rodela, L. Unidades de Vegetação e Pastagens Nativas do Pantanal da Nhecolândia, Mato Grosso do Sul. Ph.D. Thesis, Universidade de São Paulo, São Paulo, Brazil, 2006; 222p. [Google Scholar]
  30. Santos, H.; Jacomine, P.K.T.; dos Anjos, L.H.C.; de Oliveira, V.A.; Lumbreras, J.F.; Coelho, M.R.; de Almeida, J.A.; de Araujo Filho, J.C.; de Oliveira, J.B.; Cunha, T.J.F. Sistema Brasileiro de Classificação de Solos; Embrapa Solos: Brasilia, Brazil, 2006; 353p. [Google Scholar]
  31. Teixeira, P.; Donagemma, G.; Fontana, A.; Teixeira, W. Manual de Métodos de Análise de Solo; Embrapa: Brasilia, Brazil, 2017; 573p. [Google Scholar]
  32. Sisti, C.; Santos, H.; Kohhann, R.; Alves, B.; Urquiaga, S.; Boddey, R. Change in carbon and nitrogen stocks in soil under 13 years of conventional or zero tillage in southern Brazil. Soil Till. Res. 2004, 76, 39–58. [Google Scholar] [CrossRef]
  33. Swift, R. Organic matter characterization. In Methods of Soil Analysis; Sparks, D., Page, A., Helmke, P., Loeppert, R., Soltanpour, P., Tabatabai, M., Johnston, C., Sumner, M., Eds.; Soil Science Society American: Madison, WI, USA, 1996; pp. 1011–1020. [Google Scholar]
  34. Benites, V.; Madari, B.; Machado, P.A. Extração e Fracionamento Quantitativo de Substâncias Húmicas do Solo: Um Procedimento Simplificado de Baixo Custo; Comunicado Técnico 16; Embrapa Solos: Brasilia, Brazil, 2003; 7p. [Google Scholar]
  35. Hayes, M.; McCarthy, P.; Malcolm, R.; Swift, R. (Eds.) Structures of humic substances: The emergence of forms. In Humic Substance, 2nd ed.; John Wiley & Sons: Hoboken, NJ, USA, 1989; pp. 3–31. [Google Scholar]
  36. Ferreira, D. Sisvar: A computer statistical analysis system. Ciênc. Agrotec. 2011, 35, 1039–1042. [Google Scholar] [CrossRef]
  37. Sneath, P.; Sokal, R. Numerical Taxonomy; Freeman and Co.: New York, NY, USA, 1973; 573p. [Google Scholar]
  38. Hair, J.; Black, W.; Babin, B.; Anderson, R.; Tatham, R. Análise Multivariada de Dados, 5th ed.; Bookman: Delhi, India, 2005; 688p. [Google Scholar]
  39. Kaiser, H. The varimax criterion for analytic rotation in factor analysis. Psychometrika 1958, 23, 187–200. [Google Scholar] [CrossRef]
  40. R Core Team. R: A Language and Environment for Statistical Computing, version 4.1.2; R Foundation for Statistical Computing: Vienna, Austria, 2022; Available online: https://www.R-project.org/ (accessed on 13 March 2024).
  41. Hayes, M.H.B.; Swift, R.S. Chapter One—Vindication of humic substances as a key component of organic matter in soil and water. In Advances in Agronomy; Sparks, D.L., Ed.; Academic Press: Cambridge, MA, USA, 2020; Volume 163, pp. 1–37. [Google Scholar]
  42. Ghabbour, E.A.; Davies, G.; Misiewicz, T.; Alami, R.A.; Askounis, E.M.; Cuozzo, N.P.; Filice, A.J.F.; Haskell, J.M.; Moy, A.K.; Roach, A.C.; et al. Chapter One—National Comparison of the Total and Sequestered Organic Matter Contents of Conventional and Organic Farm Soils. In Advances in Agronomy; Sparks, D.L., Ed.; Academic Press: Cambridge, MA, USA, 2017; Volume 146, pp. 1–35. [Google Scholar]
  43. Gerke, J. The Central Role of Soil Organic Matter in Soil Fertility and Carbon Storage. Soil Syst. 2022, 6, 33. [Google Scholar] [CrossRef]
  44. Desbiez, A.; Keuroghlian, A. Ageing feral pigs (Sus scrofa) through tooth eruption and wear. Suif. Soun. 2009, 9, 48–55. [Google Scholar]
  45. Moreira, F.; Siqueira, J. Microbiologia e Bioquímica do Solo; Editora UFLA: Lavras, Brazil, 2006; 729p. [Google Scholar]
  46. Neill, C.; Melillo, J.; Steudler, P.; Cerri, C.; Moraes, J.; Piccolo, M.; Brito, M. Soil carbon and nitrogen stocks following forest clearing for pasture in the southwestern Brazilian Amazon. Ecol. Appl. 1997, 7, 1216–1225. [Google Scholar] [CrossRef]
  47. Victoria, R.; Fernandes, F.; Martinelli, L.; Piccolo, C.; Camargo, P.; Trumbore, S. Past vegetation changes in the Brazilian Pantanal arboreal-grassy savanna ecotone by using carbon isotopes in the soil organic matter. Glob. Change Biol. 1995, 1, 165–171. [Google Scholar] [CrossRef]
  48. Ceballos, D.; Frangi, J.; Jobbágy, E. Soil volume and carbon storage shifts in drained and afforested wetlands of the Paraná River Delta. Biogeochemistry 2013, 112, 359–372. [Google Scholar] [CrossRef]
  49. Mitsch, W.; Gosselink, J. Wetlands, 4th ed.; John Wiley & Sons, Inc: Hoboken, NJ, USA, 2007; 582p. [Google Scholar]
  50. Mitra, S.; Wassmann, R.; Vlek, P. An appraisal of global wetland area and its organic carbon stock. Curr. Sci. 2005, 88, 25–35. [Google Scholar]
  51. Xavier, F.; Maia, S.; Ribeiro, K.; Mendonça, E.; Oliveira, T. Effect of cover plants on soil C and N dynamics in different soil management systems in dwarf cashew culture. Agric. Ecosyst. Environ. 2013, 165, 173–183. [Google Scholar] [CrossRef]
  52. Wilson, C.; Strickland, M.; Hutchings, J.; Bianchi, T.; Flory, S. Grazing enhances belowground carbon allocation, microbial biomass, and soil carbon in a subtropical grassland. Glob. Chang. Biol. 2018, 24, 2997–3009. [Google Scholar] [CrossRef]
  53. Reichert, J.; Suzuki, L.; Reinert, D.; Horn, R.; Hakansson, I. Reference bulk density and critical degree-of-compactness for no-till crop production in subtropical highly weathered soils. Soil Till. Res 2009, 102, 242–254. [Google Scholar] [CrossRef]
  54. Albuquerque, J.; Sangoi, L.; Ender, M. Efeitos da interação lavoura-pecuária nas propriedades físicas do solo e características da cultura do milho. R. Bras. Ciênc. Solo 2001, 25, 717–723. [Google Scholar] [CrossRef]
  55. Oliveira, T.; Costa, L.; Figueiredo, M.; Regazzi, A. Efeitos dos ciclos de umedecimento e secagem sobre a estabilidade de agregados em água de quatro latossolos Brasileiros. R. Bras. Ciênc. Solo 1996, 20, 509–515. [Google Scholar]
  56. Cantarutti, R.; Nascimento, D., Jr.; Costa, O. Impacto animal sobre o solo: Compactação e reciclagem de nutrientes. In A Produção Animal na Visão dos Brasileiros; Matos, W., Ed.; FEALQ: Piracicaba, Brazil, 2001; pp. 826–837. [Google Scholar]
  57. Gifford, R.; Roderick, M. Soil carbon stocks and bulk density: Spatial or cumulative mass coordinates as a basis of expression? Glob. Change Biol. 2003, 9, 1507–1514. [Google Scholar] [CrossRef]
  58. Maia, S.; Ogle, S.; Cerri, C.; Cerri, C. Effect of grassland management on soil carbon sequestration in Rondônia and Mato-Grosso states, Brazil. Geoderma 2009, 149, 84–91. [Google Scholar] [CrossRef]
  59. Feller, C.; Beare, M. Physical control of soil organic matter dynamics in the tropics. Geoderma 1997, 79, 69–116. [Google Scholar] [CrossRef]
  60. Zinn, Y.; Resck, D.; Silva, J. Soil organic carbon as affected by afforestation with Eucalyptus and Pinus in the Cerrado region of Brazil. For. Ecol. Manag. 2002, 166, 285–294. [Google Scholar] [CrossRef]
  61. Zinn, Y.; Lal, R.; Resck, D. Changes in soil organic carbon stocks under agriculture in Brazil. Soil Till. Res. 2005, 84, 28–40. [Google Scholar] [CrossRef]
  62. Amelung, W.; Flach, K.; Zech, W. Climatic effects on soil organic matter composition in the Great Plains. Soil Sci. Soc. Am. J. 1997, 61, 115–123. [Google Scholar] [CrossRef]
  63. Carvalho, J.; Raucci, G.; Cerri, C.; Bernoux, M.; Feigl, B.; Wruck, F.; Cerri, C. Impact of pasture, agriculture and crop-livestock systems on soil C stocks in Brazil. Soil Till. Res 2010, 110, 175–186. [Google Scholar] [CrossRef]
  64. Moraes, J.; Neill, C.; Volkoff, B.; Cerri, C.; Melillo, J.; Lima, V.; Steudler, P. Soil carbon and nitrogen stocks following forest conversion to pasture in the Western Brazilian Amazon Basin. Acta Sci. 2003, 24, 1369–1376. [Google Scholar]
  65. Frazão, L.; Frazão, L.; Santana, I.; Campos, D.; Feigl, B.; Cerri, C. Estoques de carbono e nitrogênio e fração leve da matéria orgânica em Neossolo Quartzarênico sob uso agrícola. Pesq. Agropec. Bras. 2010, 45, 1198–1204. [Google Scholar] [CrossRef]
  66. Mielniczuk, J.; Bayer, C.; Vezzani, F.; Lovato, T.; Fernandes, F.; Debarba, L. Manejo de solo e culturas e sua relação com os estoques de carbono e nitrogênio do solo. In Tópicos em Ciência do Solo; Curi, N., Marques, J., Guilherme, L., Lima, J., Lopes, A., Alvarez, V., Eds.; Sociedade Brasileira de Ciência do Solo: Viçosa, Brazil, 2003; pp. 209–248. [Google Scholar]
  67. Lopes, A.; Sousa, D.; Chaer, G.; Reis Júnior, F.; Goedert, W.; Mendes, I. Interpretation of microbial soil indicators as a function of crop yield and organic carbon. Soil Sci. Soc. Am. J. 2013, 77, 461–472. [Google Scholar] [CrossRef]
  68. Chantigny, M.; Rochette, P.; Angers, A. Short-term C and N dynamics in a soil amended whit pigs slurry and barley straw: A field experiment. Can. J. Soil Sci. 2001, 81, 131–137. [Google Scholar] [CrossRef]
  69. Moraes, G.; Xavier, F.; Mendonça, E.; Araújo Filho, J.; Oliveira, T. Chemical and structural characterization of soil humic substances under agroforestry and conventional systems. R. Bras. Ciênc. Solo 2011, 35, 1597–1608. [Google Scholar] [CrossRef]
  70. Guimarães, D.; Gonzaga, M.; Silva, T.; Silva, T.; Dias, N.; Matias, M. Soil organic matter pools and carbon fractions in soil under different land uses. Soil Till. Res 2013, 126, 177–182. [Google Scholar] [CrossRef]
  71. Melo, L.; Silva, C.; Dias, B. Characterization of the organic matrix of residues from different origins. R. Bras. Ciênc. Solo 2008, 32, 101–110. [Google Scholar] [CrossRef]
  72. Canellas, L.; Teixeira, L., Jr.; Dobbss, L.; Silva, C.; Medici, L.; Zandonadi, D.; Facanha, A. Humic acids crossinteractions with root and organic acids. Ann. Appl. Bio. 2008, 153, 157–166. [Google Scholar] [CrossRef]
  73. Santos, S.; Cispim, S.; Comastri Filho, J.; Cardoso, E. Princípios de Agroecologia no Manejo das Pastagens Nativas do Pantanal; Documentos 63; Embrapa Pantanal: Corumbá, Brazil, 2004; pp. 1–35. [Google Scholar]
  74. Petsch, D.; Cionek, V.; Thomaz, S.; Santos, N. Ecosystem services provided by river-floodplain ecosystems. Hydrobiologia 2023, 850, 2563–2584. [Google Scholar] [CrossRef]
  75. Couto, E.; Corrêa, G.; Oliveira, V.; Nascimento, A.; Vidal-Torrado, P.; Beirigo, R.; Schaefer, C. Soils of Pantanal: The largest continental wetland. In The Soils of Brazil; Schaefer, C.E.G.R., Ed.; Springer International Publishing: Cham, Switzerland, 2023; pp. 239–267. [Google Scholar]
Figure 1. Biplot showing the interdependence relationship between carbon fractions, C and N stocks in pastures, and confidence ellipses (95% confidence) from the multivariate test for clusters. C-Fulvic = carbon in the fulvic acid fractions; C-humin = carbon in the humin fractions; C-humic = carbon in the humic acid fractions; N-Stock = nitrogen stock; C-Stock = carbon stock. Pastures evaluated: Axonopus purpusii grazing; Axonopus purpusii no-grazing; Hymenachne amplexicaulis grazing; Hymenachne amplexicaulis no-grazing; Mesosetum chaseae grazing; Mesosetum chaseae no-grazing.
Agronomy 14 01994 g001
Table 1. Total carbon, soil bulk density, and carbon stock in soils under native pastures in the Pantanal of Nhecolândia, MS, Brazil.
PastureTotal Carbon (g kg−1)Soil Bulk Density (kg dm−3)Carbon Stock (Mg ha−1)
0–1010–2020–400–400–1010–2020–400–400–1010–2020–400–40
Ap-G8.62 Ba4.61 Ab1.01 Ac14.241.28 Ab1.37 Aa1.35 Aa4.0013.19 Aa6.35 Ab0.68 Ac21.15
Ap-N10.36 Aa3.78 Ab1.81 Ac15.951.17 Bb1.38 Aa1.33 Aa3.8810.12 Ba5.16 Ab1.21 Ac20.11
Ha-G80.6 Ba55.56 Bb4.57 Ac140.730.48 Bc0.88 Ab1.44 Aa2.8055.13 Aa48.51 Ab3.3 Ac92.98
Ha-N129.67 Aa68.91 Ab5.03 Ac203.610.68 Ac0.75 Ab1.43 Aa2.8661.27 Aa51.75 Aa3.6 Ab127.41
Mc-G7.51 Aa3.31 Ab2.75 Ab13.571.33 Aa1.33 Aa1.31 Aa3.9710.01 Aa4.41 Ab1.8 Ac20.66
Mc-N5.64 Ba3.56 Ab2.52 Ab11.721.25 Ba1.30 Aa1.26 Aa3.817.02 Ba4.62 Ab1.59 Ac20.38
Ap-G—grazed Axonopus purpusii; Ap-N—no-grazed Axonopus purpusii; Ha-G—grazed Hymenachne amplexicaulis; Ha-N—no-grazed Hymenachne amplexicaulis; Mc-G—grazed Mesosetum chaseae; Mc-N—no-grazed Mesosetum chaseae. Means followed by the same uppercase letter in the column for each pasture and lowercase letter in the row for each attribute do not differ by the Scott-Knott test at a 5% probability.
Table 2. Total nitrogen (TN), nitrogen stock, and C/N ratio in soils under native pastures in the Pantanal of Nhecolândia, MS, Brazil.
PastureTotal Nitrogen (g kg−1)Nitrogen Stock (Mg ha−1)C/N
0–1010–2020–400–400–1010–2020–400–400–1010–2020–4020–40
Ap-G0.78 Aa0.34 Ab0.06 Ac1.181.00 Aa0.47 Ab0.15 Bc1.6213.17 Ab13.62 Ab18.26 Aa45.05
Ap-N0.63 Ba0.27 Ab0.12 Ac1.020.74 Ba0.38 Ab0.33 Ab1.4513.15 Ac13.93 Ab15.29 Ba42.37
Ha-G7.63 Ba5.43 Bb0.29 Ac13.355.07 Ba4.97 Aa0.83 Ab10.8710.10 Ab10.01 Ab16.55 Aa36.66
Ha-N13.06 Aa6.57 Ab0.30 Ac19.935.97 Aa4.74 Ab0.85 Ac11.5610.12 Ab10.38 Ab16.95 Aa37.45
Mc-G0.56 Aa0.25 Ab0.19 Ab1.000.75 Aa0.34 Ac0.49 Ab1.5812.56 Ab13.93 Aa15.02 Aa41.51
Mc-N0.38 Ba0.27 Ab0.17 Ac0.820.48 Ba0.35 Ab0.45 Aa1.2813.11 Aa13.80 Aa14.10 Aa41.01
Ap-G—grazed Axonopus purpusii; Ap-N—no-grazed Axonopus purpusii; Mc-G—grazed Mesosetum chaseae; Ha-G—grazed Hymenachne amplexicaulis; Ha-N—no-grazed Hymenachne amplexicaulis; Mc-N—no-grazed Mesosetum chaseae. Means followed by the same uppercase letter in the column for each pasture and lowercase letter in the row for each attribute do not differ by the Scott-Knott test at a 5% probability.
Table 3. Carbon in the humic acid, fulvic acid, and humin fractions in soils under native pastures in the Pantanal of Nhecolândia, MS, Brazil.
PastureC-Fulvic Acid (g kg−1)C-Humic Acid (g kg−1)C-Humin (g kg−1)
0–1010–2020–400–400–1010–2020–400–400–1010–2020–400–40
Ap-G0.62 Aa0.39 Ab0.30 Ac1.312.29 Aa0.67 Ab0.17 Ac3.137.45 Aa3.55 Ab0.54 Ac11.54
Ap-N0.51 Ba0.36 Ab0.24 Ac1.111.49 Ba0.62 Ab0.20 Ac2.316.61 Aa2.79 Ab1.37 Ac10.77
Ha-G1.12 Ba1.27 Aa0.36 Ab2.7512.82 Ba15.60 Aa1.69 Ab30.1166.66 Ba38.69 Bb2.53 Ac107.88
Ha-N2.20 Aa1.22 Ab0.34 Ac3.7616.13 Aa7.41 Bb2.34 Ac25.88111.34 Aa60.27 Ab2.35 Ac173.96
Mc-G0.50 Aa0.39 Ab0.34 Ac1.231.68 Aa0.10 Bb0.17 Bb1.955.33 Aa2.82 Ab2.24 Ab10.39
Mc-N0.48 Aa0.39 Aa0.35 Ab1.221.23 Ba0.56 Ab0.36 Ac2.153.94 Ba2.62 Ab1.81 Ab8.37
Ap-G—grazed Axonopus purpusii; Ap-N—no-grazed Axonopus purpusii; Ha-G—grazed Hymenachne amplexicaulis; Ha-N—no-grazed Hymenachne amplexicaulis; Mc-G—grazed Mesosetum chaseae; Mc-N—no-grazed Mesosetum chaseae. Means followed by the same uppercase letter in the column for each pasture and lowercase letter in the row for each attribute do not differ by the Scott–Knott test at a 5% probability.
Table 4. Relationship between the carbon of the humic acid (C-HAF), fulvic acid (C-FAF), and humin fractions (C-HuF) in soils under native pastures in the Pantanal of Nhecolândia, MS, Brazil.
PastureC-HAF/C-FAFC-HAF+C-FAF/C-HuF
0–1010–2020–400–1010–2020–40
Ap-G3.68 Aa1.70 Ab0.57 Ac0.39 Ab0.30 Ab0.87 Aa
Ap-N2.92 Ba1.73 Ab0.95 Ac0.30 Aa0.36 Aa0.32 Ba
Ha-G11.64 Aa12.50 Aa5.21 Ab0.21 Ab0.45 Ab0.87 Aa
Ha-N7.40 Aa6.04 Ba7.26 Aa0.17 Ab0.15 Bb1.14 Aa
Mc-G3.38 Aa0.27 Bb0.51 Bb0.42 Aa0.18 Aa0.23 Aa
Mc-N2.59 Ba1.44 Ab1.05 Ab0.45 Aa0.37 Aa0.39 Aa
Ap-G—grazed Axonopus purpusii; Ap-N—no-grazed Axonopus purpusii; Ha-G—grazed Hymenachne amplexicaulis; Ha-N—no-grazed Hymenachne amplexicaulis; Mc-G—grazed Mesosetum chaseae; Mc-N—no-grazed Mesosetum chaseae. Means followed by the same uppercase letter in the column for each pasture and lowercase letter in the row for each attribute do not differ by the Scott–Knott test at a 5% probability.
Table 5. Correlation between attributes and pastures.
0–10 cm Layer
Principal componentDim1Dim2
Explained variance (%)81.4 *13.5 *
Correlation
C-fulvic0.960.01
C-humic0.970.11
C-humin0.980.08
C-stock0.930.24
N-stock−0.380.87
0–20 cm Layer
Principal componentDim1Dim2
Explained variance (%)83.8 *8.1 *
Correlation
C-fulvic0.96−0.12
C-humic0.96−0.25
C-humin0.97−0.18
C-stock0.840.07
N-stock0.790.49
20–40 cm layer
Principal componentDim1Dim2
Explained variance (%)59.4 *26.4 *
Correlation
C-fulvic0.400.70
C-humic0.80−0.35
C-humin0.850.42
C-stock0.89−0.02
N-stock−0.450.78
* Value referring to the percentage of variation in the original dataset retained by the respective principal components. Correlations in bold (>0.70 in absolute value) were considered in the interpretation of the principal component.
Disclaimer/Publisher’s Note: The statements, opinions and data contained in all publications are solely those of the individual author(s) and contributor(s) and not of MDPI and/or the editor(s). MDPI and/or the editor(s) disclaim responsibility for any injury to people or property resulting from any ideas, methods, instructions or products referred to in the content.

