Abstract
UV-B radiation is becoming a bigger threat to plants as a result of the ozone layer’s depletion. As an alpine plant, Rhododendron chrysanthum Pall. (R. chrysanthum) may grow regularly under UV-B radiation throughout its lengthy acclimatization period, although the mechanism of acclimatization is still poorly understood. The current investigation uncovered a number of adaptation strategies that R. chrysanthum has developed in reaction to UV-B rays. UV-B radiation impeded photosynthesis and damaged the photosystem, according to OJIP testing. Through transcriptomics and proteomics analyses, this study found that the differential proteins and differential genes of R. chrysanthum were significantly enriched in glycolysis and tricarboxylic acid (TCA) cycle pathways after UV-B treatment. The metabolomics results showed that a total of eight differential metabolites were detected in the glycolytic and TCA cycle pathways, and the changes in the expression of these metabolites reflected the final outcome of gene regulation in the glycolytic and TCA cycle pathways. The combined experimental results demonstrated that R. chrysanthum’s photosynthetic system was impacted by UV-B stress and, concurrently, the plant activated an adaptation mechanism in response to the stress. To maintain its energy supply for growth, R. chrysanthum adapts to UV-B stress by adjusting the expression of the relevant proteins, genes, and metabolites in the glycolytic and TCA cycling pathways. This study provides a new perspective for understanding the changes in the carbon metabolism of R. chrysanthum under UV-B stress and its mechanisms for UV-B resistance, and provides an important theoretical basis for the study of enhancing plant resistance to stress.
1. Introduction
R. chrysanthum, a member of the Rhododendronaceae family, is one of the world’s most valuable germplasm resources [1]. In China, R. chrysanthum is mainly found in the Changbai Mountain region, where it grows at elevations of 1300–2650 m. The plant’s ability to develop is severely hampered by Changbai Mountain’s severe environment and intense UV-B radiation. This implies that R. chrysanthum’s ability to grow on Changbai Mountain indicates its resistance to abiotic stresses [1,2,3]. So, R. chrysanthum makes a useful experimental material for researching abiotic stress tolerance in plants.
UV-B is ultraviolet light in the solar spectrum with wavelengths of 280–315 nm [4]. Under normal conditions, it has very little impact on plant growth because most UV-B is absorbed by the ozone, and just 10% reaches the ground [5,6]. Currently, however, the amount of UV-B radiation reaching the ground is gradually rising due to declining ozone levels [7]. Furthermore, the impact of UV-B radiation on crop productivity is closely linked to human existence through the provision of clothing and food. Researchers have extensively studied the effects of UV-B radiation on plants over time, with a primary focus on the morphological structure, physiology and biochemistry, metabolic control, and growth and development of plants [8,9,10,11,12]. An extensive understanding of the processes underlying plants’ responses to UV-B radiation and the associated metabolic regulatory pathways have been made possible by these investigations.
UV-B exposure can inhibit plant photosynthesis, affecting carbon metabolism. Maintaining plants’ photosynthetic efficiency under UV-B stress is crucial for their resistance to such environmental stress. Plants activate the photosystem II (PSII) reaction center during photosynthesis, which is particularly susceptible to UV-B stress. This susceptibility is a pivotal factor in how UV-B stress impacts plant photosynthesis [13]. In a JIP test on the high arctic Vaccinium uliginosum, it was found that the ability of plants to process light energy by photosynthesis mechanisms slightly decreased after UV-B treatment [14]. In cotton (Gossypium hirsutom L.), research indicated that net photosynthesis declines under UV-B stress, but the plant’s reducing capacity improves under stress-free conditions [15]. Our earlier research determined that a 48-h exposure to UV-B radiation inhibited photosynthesis in R. chrysanthum, as indicated by chlorophyll fluorescence. However, the study also revealed the presence of inherent repair mechanisms [2]. Adding on to earlier research, this study examines the modifications in protein acetylation linked to the TCA cycle and glycolysis that are important for the downstream processes of photosynthesis. As a matter of fact, the determination of chlorophyll fluorescence parameters is generally used in current studies on photosynthesis [16,17,18]. Alternatively, the functional changes in PSII in plant leaves can be easily and quickly analyzed using the fast-phase chlorophyll fluorescence parameter technique (OJIP).
In fact, under certain conditions, alterations in the expression of tricarboxylic acid (TCA) cycle enzymes lead to changes in plant growth and photosynthesis. TCA is an important pathway in plant metabolism, and the TCA cycle contributes to plant responses to stress [19]. The TCA cycle is capable of providing many important intermediary metabolites for other pathways in the plant body, and reactants for various biosynthetic pathways. At the same time, the TCA cycle is a fundamental component of the respiratory process of mitochondria, and is connected to the glycolysis process [20,21,22]. In higher plants, the main role of the glycolysis pathway is to oxidize sucrose to produce ATP, reducing power (NADH) and pyruvate [23]. The widespread presence of this pathway in organisms is largely related to its ability to regulate abiotic stresses [24]. Plants can produce primary or secondary metabolites through the glycolysis metabolic pathway, and these secondary metabolites, especially phosphoenolpyruvate (PEP), can produce a large number of aromatic compounds through the shikimate pathway, which is of great significance for the adaptation of plants to their external environments. Normally, the glycolysis pathway causes a corresponding feedback inhibition due to excessive product accumulation. The glycolysis metabolic pathway, through its own positive regulation and feedback inhibition, keeps the glycolysis metabolism of a plant under optimal conditions, thus improving the plant’s ability to adapt to the environment [25]. The precursors of the TCA cycle may have their origins in ancient bioenergetic conversion processes, and over time this cycle has been fine-tuned and expanded in plants to adapt to variable environmental stresses. In the face of various stresses, plants may adjust their metabolic flow by increasing the expression of certain TCA cycle enzymes to maintain their intracellular reduction state and energy homeostasis, thereby protecting their cells from oxidative damage. The glycolytic pathway is another key metabolic process that allows plants to undergo rapid energy production even when the oxygen supply is low. The glycolytic pathway has evolved, with diverse adaptive changes, that allow plants to rapidly adjust their metabolic state in the face of environmental stress [26]. These evolutionary adaptive changes not only reveal the complexity of plant metabolic pathways, but also provide potential molecular targets for breeding plant varieties with a greater adaptive capacity to adversity.
Here, we aimed to analyze the molecular mechanisms of Rhododendron chrysanthum Pall. (R. chrysanthum) resistance to UV-B stress. The transcriptome and proteome are powerful tools for identifying RNAs and proteins [27]. Currently, a host of researchers are utilizing transcriptomics to investigate the mechanisms by which plants produce UV-resistant substances in response to UV radiation [28,29]. Therefore, this experiment utilizes transcriptomics and proteomics in order to study the changes in RNA and proteins, and to analyze their biological functions.
Coupled transcriptome and metabolomic investigations have revealed that UV-B stress causes considerable alterations to the carbohydrate metabolism pathways in R. chrysanthum [30]. Whereas the glycolytic pathway is the initiating step in this process, the TCA cycle is the key link for the production of large amounts of ATP in plants. Although research has focused on the role of carbohydrate metabolic pathways in UV-B stress, detailed studies on the R. chrysanthum glycolytic pathway and the TCA cycling pathway in this context have not been reported. Based on this, and due to the importance of these two pathways, the present study integrates transcriptomics, proteomics, and metabolomics to analyze the molecular regulatory mechanisms of the glycolytic pathway and the TCA cycle in R. chrysanthum under UV-B stress, from multiple perspectives and at multiple levels. This study provides new perspectives for understanding the adaptive responses of plants to UV-B stress and provides suggestions, at the molecular level, for stress tolerance improvement in R. chrysanthum.
2. Materials and Methods
2.1. Treatment of Plant Material
The cultivation of the material used for this experiment and radiation treatments was carried out in strict accordance with previous experimental descriptions [31]. The material in this experiment originated from Changbai Mountain and was transplanted from its place of origin into a smart incubator (Ningbo Saifu Experimental Instrument Co., Ningbo, China), where it was cultured using 1/4 MS medium. Prior to the UV-B treatment, the R. chrysanthum plants were cultured in a smart incubator under diurnal temperature and time conditions of 10 h at 25 °C and 14 h at 18 °C, and the experimental materials were incubated until they were eight months old. We randomly selected three plants and placed 400 nm filters (Edmund, Filter Long 2IN SQ, Barrington, NJ, USA) on their culture flasks and irradiated them with PAR light for 48 h (CG group); the other three treatments used 295 nm filters (Edmund, Filter Long 2IN SQ. Barrington, NJ, USA), which were placed on their culture flasks for an additional UV-B radiation treatment of 48 h (BG group). UV-B fluorescent tubes (Philips, Ultraviolet-B TL 20 W/01 RS, Amsterdam, The Netherlands) were used as the source which provided artificial UV-B radiation. The effective irradiance received by the CG group was 50 µmol m−2 s−1 PAR, and the effective irradiance received by the BG group was 2.3 W m−2 UV-B. The irradiance of the samples treated with UV-B was determined in accordance with the transmission function of the long-pass filter, utilizing a UV intensity meter (Sentry Optron-ICS Corp., ST-513, SHH, New Taipei City, China) and a light meter (TES Electrical Electronic Corp., Tes-1339 Light Meter Pro., Taipei, China).
2.2. Determination of Chlorophyll Fluorescence Parameters of R. chrysanthum
The chlorophyll fluorescence parameters of R. chrysanthum were determined using Handy PEA. Three measurement points on the leaves of the CG and BG groups were selected, and the following chlorophyll fluorescence parameters were measured: minimum fluorescence (Fv), (Fo), and (Fm); energy captured per unit reaction center (TRo/RC); initial electron transfer photon flux per reaction center (ETo/RC), and photosynthetic performance index based on the absorbed light energy (PIABS). The following parameters were calculated after dark adaptation for 30 min with dark adaptation clamps.
Potential photochemical efficiency: Fv/Fo = (Fm − Fo)/Fo;
Maximum photochemical efficiency of PS II: Fv/Fm = 1 − (Fo/Fm);
Quantum yield of absorbed energy for electron transfer: φE0 = [1 − (Fo/Fm)] (1 − Vj);
Quantum yield of captured light energy for electron transfer downstream of QA−: ψo = 1 − Vj.
2.3. Determination of the R. chrysanthum Transcriptome
2.3.1. RNA Extraction and Sequencing
First, R. chrysanthum’s total RNA was processed by mRNA enrichment. The process of mRNA enrichment involved capturing polyA-tailed mRNA using an OligodT and an Oligitex mRNA kit (Qiagen, Hilden, Germany). For the rRNA removal, the RNA was hybridized with a DNA probe, followed by the selective digestion of the DNA/RNA hybrid by RNase H. Subsequently, the DNA probe was degraded with DNase I, allowing for the purification of the target RNA. Random N6 primer was used for the reverse transcription to synthesize two-stranded cDNA to form double-stranded DNA using a Hieff NGS ds-cDNA Synthesis Kit (Yeasen Biotechnology Co., Ltd., Shanghai, China). The synthesized double-stranded DNA underwent flattening and phosphorylation at the 5′ end of the DNA, while the 3′ end developed into a sticky end with a prominent “A”. A raised “T” junction was then attached to the 3′ end. Next, a protruding “T” and a raised junction were attached to the 3′ end. Subsequently, the ligated product was subjected to a polymerase chain reaction using specific primers, the product was heat-denatured to make it into a single-stranded DNA, and then a bridge primer was used to turn the single-stranded DNA into a single-stranded circular DNA library. Finally, online sequencing was performed.
2.3.2. Filtering, Reassembly, and Annotation of Data
The raw data were filtered with SOAPnuke [32] (v1.6.5) by (1) removing the reads containing adapters (adapter contamination); (2) removing the reads whose unknown base (‘N’ base) ratio was more than 1%; and (3) removing the reads whose low-quality base ratio (base quality less than or equal to 15) was more than 40%. Afterwards, the clean reads were obtained by and stored in FASTQ format. Trinity (v2.13.2) [33] was used to assemble the clean reads and BUSCO was used to assess the assembly quality. The clean data were mapped onto the assembled unique gene by Bowtie2 (v2.4.5) [34], and the expression level of the genes was calculated by RSEM (v1.3.1) [35]. The candidate coding regions in the unigene were identified by the software Transdecoder (v1.3.1) [36], and the regions were aligned with SwissProt by BLAST. The homologous sequences of the Pfam protein and the coding regions were, respectively, searched for and predicted by Hmmscan. MISA was used for unigene detection (v1.0), [36] and Primer3 (v2.6.1) [37] designed the primer for SSR detection.
The raw transcriptome data were deposited into the Sequence Read Archive with accession number PRJNA756577 (https://www.ncbi.nlm.nih.gov/sra/PRJNA756577 (accessed on 6 May 2023)). In this investigation, six cDNA libraries of the R. chrysanthum samples were created, 58 Gb of RNA-seq data were acquired, and 93,034 unigenes were assembled and made non-redundant. A total of 45.44 million Raw Reads were collected. The clean reads ranged in size from 42.21 to 43.51 million following data cleaning and quality checks. Q20 was more than or equal to 97.75%, whereas Q30 was greater than or equal to 93.39%.
2.3.3. Differential Gene Expression Analysis
Using Bowtie2, the clean reads were aligned with genomic sequences. Then, RSEM was used to count the gene expression levels for the individual samples. RSEM (v1.2.8) is a software package used to read RNA-seq, which can count gene expression and transcript isoforms. The fold change (FC) represents the multiplicity of differences in gene expression, with FC > 1 and p < 0.05 as DEGs.
2.4. Determination of R. chrysanthum’s Whole Protein Profile Using 4D Label-Free Quantitative Proteomics
2.4.1. Protein Extraction
After pulverizing the R. chrysanthum using liquid nitrogen, the powder was moved to a 5 mL centrifuge tube and subjected to three minutes of ice sonication using a Scientech high-intensity ultrasonic processor in a lysis buffer, which contained 1% TritonX-100, 10 mM dithiothreitol, and a 1% protease inhibitor cocktail. Tris-saturated phenol (pH 8.0) was added in an equivalent volume. The mixture was then vortexed for an additional five minutes. Following 5500× g centrifugation at 4 °C for 10 min, the top phenol phase was moved to a fresh centrifuge tube. At least four liters of ammonium sulfate-saturated methanol was added to precipitate the proteins, which were then incubated at −20 °C for at least six hours. The supernatant was thrown away following a 10 min centrifugation at 4 °C. We washed the residual precipitate with three cycles of ice-cold acetone and ice-cold methanol. The proteins were redissolved in 8 M urea, according to the manufacturer’s instructions, and the protein concentration was determined using a BCA kit.
2.4.2. Trypsin Digestion
To precipitate the proteins, the samples were gradually added to a final concentration of 20% (m/v) TCA. The samples were then vortexed for mixing and incubated at 4 °C for two hours. The precipitated proteins were centrifuged at a setting of 4 °C and 4500× g for 5 min. The precipitated proteins were repeatedly washed three times in pre-cooled acetone, followed by drying for 1 min. After redissolving the precipitated proteins in 200 mM TEAB, the proteins were dispersed using an ultrasonic technique. During the first digestion, trypsin was used in a ratio of 1:50 of trypsin to protein mass for 1 night. R. chrysanthum was reduced with 5 mM dithiothreitol for 60 min at a temperature set to 37 °C. Subsequently, the peptides were alkylated with 11 mM iodoacetamide for 45 min at room temperature, and protected from light. Finally, the peptides were desalted in order to be used in a Strata X SPE column.
2.4.3. Mass Spectrometer
Tryptic peptides were solubilized using solvent A (0.1% formic acid, 2% acetonitrile/water) and loaded onto a homemade reversed-phase analytical column (25 cm long, 100 μm i.d.). Using a nanoElute ultra-high-performance liquid chromatography system (Bruker Daltonics, Billerica, MA, USA) with a constant flow rate set at 350 nL/min, a gradient separation of the peptide from 6% to 22% in solvent B (0.1% formic acid acetonitrile) was required to be accomplished in 42 min, followed sequentially by a separation from 22% to 30% in 12 min, to 80% in 3 min, and held at 80% during the last 3 min. The leptides were then analyzed by a timsTOF Pro (Bruker Dalton) mass spectrometry after passing them through the capillary source. The electrospray voltage was 1.75 kV. The precursors and fragments were analyzed on a TOF detector with an MS/MS scanning range of 100 to 1700 m/z. timsTOF Pro employs a mode of parallel accumulation serial fragmentation (PASEF). The precursors with charge states from 0 to 5 were selected for fragmentation, and 10 PASEF-MS/MS scans were performed per cycle. The dynamic exclusion time was set to 24 s.
2.4.4. Database Search
The acquired MS/MS data needed to be processed using the MaxQuant search engine (v.1.6.6.0). Tandem mass spectrometry searches were based on the Rhododendron_lapponicum_313330 database (45945 entries) and the reverse decoy database. Trypsin/P was designated as the lytic enzyme. In the first search, the mass tolerance for the precursor ions was set to 20 ppm; in the primary search, the mass tolerance for the precursor ions was set to 20 ppm and that for the fragment ions was set to 20 ppm. The FDR was adjusted to <1%.
2.4.5. Differential Proteins Expression Analysis
Proteins with a fold change ≥ 1.5 and p < 0.05 were selected and considered to be significantly different proteins.
2.5. Annotation Methods
2.5.1. KEGG Pathway Annotation
Differential protein enrichment pathways were identified by a two-tailed Fisher’s exact test based on the KEGG database, which examines the enrichment of DEPs. Pathways with corrected p-values of less than 0.05 were considered significantly enriched for differential proteins.
2.5.2. Subcellular Localization
Here, we used Wolfpsort (v.0.2), a subcellular localization predication software tool, to predict subcellular localization. Wolfpsort is an updated version of PSORT/PSORT II for the prediction of eukaryotic sequences.
The datasets analyzed during the current study are available in the iProX repository, https://www.iprox.cn/page/project.html?id=IPX0007178000 (accessed on 6 May 2023) or PXD046044.
2.6. Widely Targeted Metabolome Testing
2.6.1. Extraction
R. chrysanthum was vacuum freeze-dried in a lyophilizer (Scientz-100F, Ningbo Scientz Biotechnology Co., Ltd., Ningbo, China) and then ground (30 Hz, 15 min) into powder form using a grinder (MM400, Retsch, Haan, Germany). After the powder was made, 50 mg of R. chrysanthum powder was weighed using an electronic balance (MS105DM, Mettler-Toledo International Inc., Shanghai, China), and after adding 1200 μL of −20 °C pre-cooled 70% methanol aqueous internal standard solution, vortexing was performed six times for 30 s each, every 30 min. This was followed by centrifugation (set at 12,000 rpm for 3 min); the supernatant was aspirated, and the sample was filtered using a microporous filter membrane (022 pore size) and stored in an injection bottle for UPLC-MS/MS analysis.
2.6.2. Chromatography and Mass Spectrometry Acquisition Conditions
The liquid-phase conditions included the following: The column was an Agilent SB-CI8 18 m, 2, 1 mm × 100 mm. The mobile phases used ultra-pure water and 0.1% formic acid in phase A, and in phase B, acetonitrile and 0.1% formic acid. The elution gradient was compared to 5% in phase A, and the comparison in phase B rose to 95% within 9 min, and was maintained for 1 min. At 10–11 min, the B-phase ratio was reduced to 5%, and equilibrated at 5% for 14 min. The flow rate was 0.35 mL/min, the column temperature was 40 °C, and the injection volume was 2 μL. The conditions for mass spectrometry were as follows: electrospray ionization (ESI) at 500 °C; ion spray voltage (IS) of 5500 V/−4500 V; and ion source gas I (GSI) was at 50 psi, gas II (GSII) was at 60 psi, and curtain gas (CUR) was at 25 psi. QQQ scanning was performed in the MRM mode. The nitrogen setting was set to medium. By further optimization of the declustering potential (DP) and collision energy (CE), the individual MRM scans were completed. The DP and CE of individual MRM ion pairs were completed and a specific set of MRM ion pairs was monitored during each period, based on the metabolites eluted during each period.
2.7. Analysis of Non-Covalent Interactions of Proteins
Protein sequences were used to retrieve the PDB Code of the proteins on the RCSB PDB website, and analyses of the non-covalent interactions (salt bridges, hydrophobic clusters) of the proteins were carried out on the ProteinTools website, and their 3D structures were downloaded.
2.8. Data Processing
An independent samples t-test was performed using IBM SPSS 26.0 with a significance level of p < 0.05. Excel 2019 was used for data statistics and graphing. The data were expressed as the mean ± SD.
3. Results
3.1. Inhibition of R. chrysanthum Photosynthesis and Consequent Effects on Carbon Metabolism under UV-B Stress
To thoroughly understand the absorption, trapping, and dissipation of light energy by PSII in R. chrysanthum, this study selected several JIP-measured parameters, including ABS/RC, TRo/RC, DIo/RC, and ETo/RC, which are related to these processes. Additionally, we analyzed the parameters associated with PSII’s photosynthetic activity, such as φEo, ψO, and φDO, for a comprehensive evaluation.
In Figure 1, R. chrysanthum under UV-B stress exhibits an increasing trend for both φDO and DIo/RC. The plant mitigates UV-B resistance by reducing excitation energy production through enhanced heat dissipation. However, this excessive heat dissipation also decreases the energy transfer efficiency, as indicated by the reduced φEO and ETo/RC. The openness of the PSII photoresponse center, measured by the commonly used fluorescence parameters Fv/Fm and PIABS, are reduced under UV-B stress. Notably, PIABS, a performance index based on absorbed light energy, demonstrates greater sensitivity to UV-B radiation. PSII’s potential activity (Fv/Fo) decreases, indicating that UV-B stress reduces the electron transfer rate and the photo-chemical activity of R. chrysanthum. The rise in the BG group ψO suggests that most of the light energy captured by PSII of R. chrysanthum under UV-B stress is transferred to other electron receptors located downstream of QA−. The increased capacity of the receptor pool facilitates electron transfer on the receptor side of PSII. The rise in ABS/RC indicates that UV-B stress prompts a rise in the energy absorbed per unit in the reaction center of PSII in R. chrysanthum, suggesting that the efficiency per unit in the reaction center increases; whereas, the decline in TRo/RC indicates that the energy captured by PSII declines, and the deactivation of the reaction center intensifies.
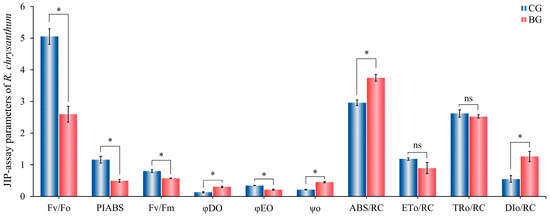
Figure 1.
Changes in JIP assay parameters of R. chrysanthum under UV-B stress. CG group: UV-B treatment; BG group: PAR treatment; Fv/Fm: maximum photochemical efficiency of PS II; Fv/Fo: potential photochemical efficiency); TRo/RC: energy captured per unit in reaction center; ABS/RC: energy absorbed per unit in reaction center; PIABS: photosynthetic performance index based on absorbed light energy; φEO: quantum yield of absorbed energy for electron transfer); ψo: quantum yield of captured light energy for electron transfer downstream of QA−); ETo/RC: initial electron transfer photon flux per reaction center; DIo/RC: Heat dissipation per unit in reaction center; φDO: heat dissipation quantum yield. The height of the bar graph represents the mean of three biological replicates performed (n = 3), and the error bars represent SD (standard deviation) “*” represents significant changes (t-test p < 0.05); “ns” stands for not significant.
3.2. DEGs Enrichment in Glycolysis and TCA Cycling Pathways in R. chrysanthum under UV-B Stress
According to the criteria of p < 0.05 and |log2(FC)| ≥ 1, there were 2348 DEGs; 1157 DEGs were upregulated, whereas 1191 DEGs were downregulated (Figure 2A). To further study the regulatory effects of UV-B treatment on the metabolism of R. chrysanthum at the transcriptional level, we performed a KEGG enrichment analysis. Through the KEGG pathway classification analysis, 203 and 41 DEGs were found to be involved in carbohydrate metabolism and energy metabolism, respectively (Figure 2B). Indeed, both carbohydrate catabolism and energy production were closely related to glycolysis and the TCA cycle, so we focused on analyzing the DEGs of these two pathways in R. chrysanthum under UV-B stress. However, most of the genes classified as being involved in the citrate cycle were downregulated in the 48 h UV-B treatment groups (Figure 2C), including two pyruvate dehydrogenase (DLAT) genes and one dihydrolipoyl dehydrogenase (DLD) gene. But genes classified as being involved in the citrate cycle were also upregulated, including four phosphoenolpyruvate carboxykinase (ATP) (pckA) genes, one aconitate hydratase (ACO) gene, and one ATP citrate (pro-S)-lyase (ACLY) gene. ACO catalyzes the combination of acetyl coenzyme A with oxaloacetate to produce citric acid, a process that is one of the key steps in a cell’s production of energy. PYC helps to maintain the supply of oxaloacetate and ensures that the cycle proceeds smoothly. In the glycolysis/gluconeogenesis pathway, both were genetically upregulated and genetically downregulated. In the glycolysis pathway, only five genes showed downregulation only after the UV-B stress treatment, including one DLD gene, one 2,3-bisphosphoglycerate-dependent phosphoglycerate mutase (PGAM) gene, and two DALT genes. Similarly, only ten genes showed upregulation only after the treatment, including four pckA genes, one diphosphate-dependent phosphofructokinase (pfp) gene, one aldehyde dehydrogenase (NAD+) (ALDH) gene, one alcohol dehydrogenase (ADH) gene, one fructose-1,6-bisphosphatase I (FBP) gene, one 2,3-bisphosphoglycerate-independent phosphoglycerate mutase (gpml) gene, and one L-lactate dehydrogenase (LDH) gene. The activity of PFK and GPML are critical to the rate of glycolysis. ALDH catalyzes the conversion of acetaldehyde into acetic acid, which can further enter the citric acid cycle to be oxidized and produce energy. LDH helps cells to continue to produce energy in the absence of oxygen. The rest of the genes were revised both upwards and downwards (Figure 2D). These changes in the key enzymes suggest that R. chrysanthum is indeed able to respond positively to UV-B stress through both pathways.
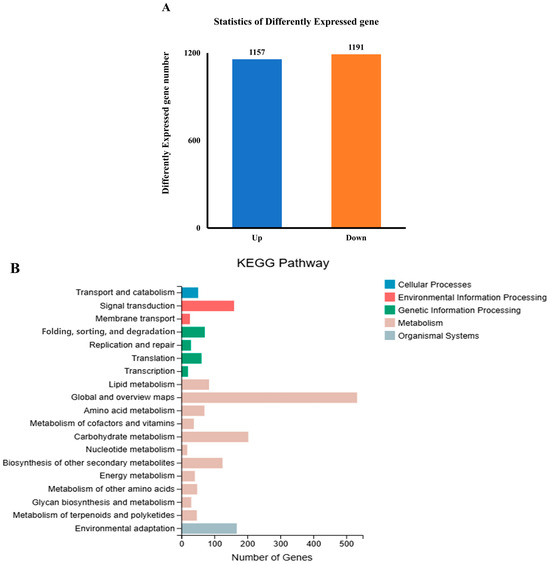
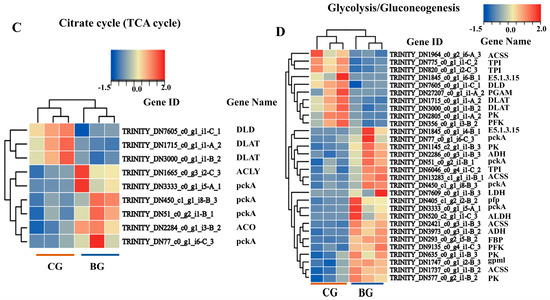
Figure 2.
The DEGs of R. chrysanthum in the glycolysis and TCA cycling pathways. (A) The number of DEGs in R. chrysanthum under UV-B stress. (B) KEGG pathway classification analysis of the pathways of the DEGs in CG vs. BG. (C) Cluster heat map of the DEGs involved in the citrate cycle. (D) Cluster heat map of the DEGs involved in glycolysis/gluconeogenesis. The horizontal coordinates are the expression results for the different comparison groups, and the vertical coordinates indicate the enzymes corresponding to the relevant genes. The expression level of the DEGs is reflected by color; the bluer the color, the lower the expression level, and the redder the color, the higher the expression level.
3.3. R. chrysanthum under UV-B Stress Showed a Large Number of DEPs
According to the standard of p < 0.05 and |log2(FC)| ≥ 1.5, there were 807 DEPs; 450 DEPs were upregulated, whereas 357 DEPs were downregulated (Figure 3A, Supplementary Table S1). These DEPs were analyzed by using GO for enrichment to determine the plant systems in R. chrysanthum influenced by UV-B stress (Figure 3B,D). The analysis results showed that the DEPs were dramatically enriched in chloroplast thylakoid and plastid thylakoid in their cellular components; significantly enriched in the molecular functions of mRNA binding and thioredoxin-disulfide reductase activity; and significantly enriched in the biological processes that respond to UV-B exposure, the cellular response to light intensity, and photosystem II repair.
Figure 3.
DEPs of R. chrysanthum under UV-B stress. (A) Number of DEPs in R. chrysanthum under UV-B stress. (B) GO enrichment analysis of DEPs in biological processes (BPs). (C) GO enrichment analysis of DEPs in cellular components (CCs). (D) GO enrichment analysis of DEPs in molecular functions (MFs).
3.4. UV-B Stress Leads to Differential Expression of Important Proteins in TCA and Glycolytic Pathways
In order to investigate the changes in the related proteins in the glycolytic and TCA cycling pathways of R. chrysanthum from multiple perspectives, we performed a comprehensive proteomic analysis of the two pathways. Simplified models of these two pathways were constructed to reflect the upstream and downstream relationships between the proteins involved (Figure 4). We analyzed a total of 32 DEPs, and the results showed that the same enzyme proteins and genes were differentially expressed. In the pathway for glycolysis, some of the genes and proteins were expressed in the same way, but there were also differences. For example, for the pfp protein, its gene expression tended to be upregulated, but its protein expression tended to be downregulated. fbp gene expression tended to be upregulated, but its protein expression was both upregulated and downregulated. The same situation existed in the TCA cycling pathway, where, for the ACLB protein, its gene expression trend was downregulated, but its protein expression was both up- and downregulated. PFP is the main rate-limiting enzyme of the glycolytic process, and it is the main point of regulation during glycolysis. ACLB catalyzes the conversion of citric acid to cis-aconitic acid, and plays an important role in glycolysis, with important implications for plant defense responses. These results suggest that R. chrysanthum is able to withstand the effects of UV-B stress on it through changes in the proteins involved in the important enzymes in the glycolysis and TCA cycle pathways.
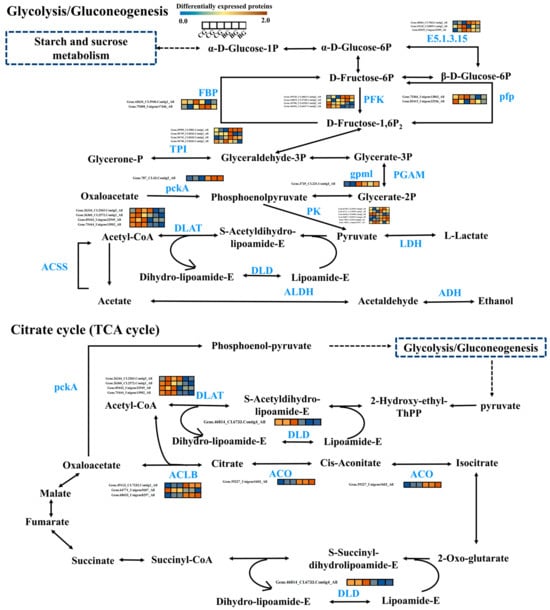
Figure 4.
Heatmaps of glycolysis and citrate cycle metabolism-related pathways among the DEPs in R. chrysanthum in CG vs. BG. The expression levels of the relevant proteins are represented by a clustered heat map. The three neighboring boxes on the left half of the clustering heat map represent the results of three replicate experiments on the CG group, and the three neighboring boxes on the right half represent the results of three replicate experiments on the BG group. The expression level of the proteins is reflected by color; the bluer the color, the lower the expression level, and the redder the color, the higher the expression level.
3.5. Changes in Expression of DMs in Glycolysis and TCA Cycling Pathways of R. chrysanthum under UV-B Stress
Metabolites are the end products of cellular metabolic pathways, and their changes can reflect alterations in cellular status and function. Changes in metabolite expression can validate the results resulting from changes in related gene expression and protein activity. To explore the changes in the metabolites, we performed an extensively targeted metabolomics analyses. As shown in Figure 5, we identified a total of eight differential metabolites (DMs) in the glycolysis and TCA cycle pathways. They are D-Fructose-6P, phosphoenolpyruvate, pyruvate, L-Lactate, citrate, malate, isocitrate, fumarate, and succinate. Specifically, the expression of D-Fructose-6P, phosphoenolpyruvate, pyruvate, L-Lactate, malate, fumarate, and succinate are elevated, while the expression of citrate and isocitrate are decreased. In the glycolysis pathway, the upregulation of enzyme expression promotes phosphoenolpyruvate, pyruvate, and L-Lactate synthesis. In the TCA cycle pathway, citrate generates Acetyl-CoA in response to ACLY, which decreases citrate and, thus, isocitrate. The metabolomics results corroborate the results from the transcriptomic and proteomic analyses, i.e., the changes in the key DEGs and DEPs therein, which ultimately activate the glycolysis and TCA cycle metabolic pathways and, consequently, enhances the resilience of R. chrysanthum itself.
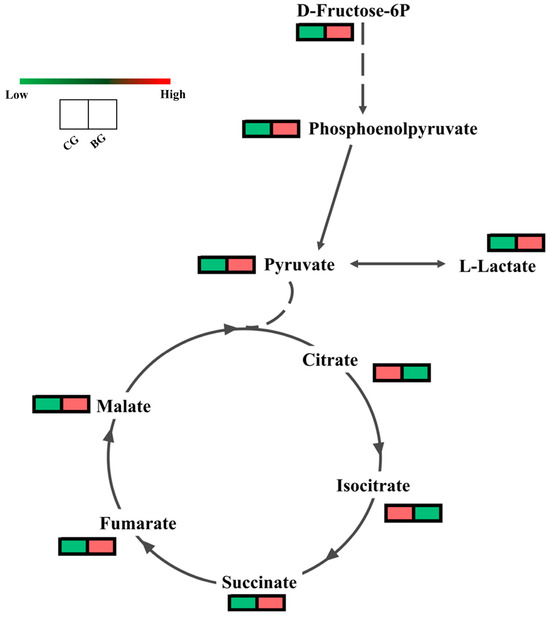
Figure 5.
Effect of UV-B on metabolism in glycolysis and TCA cycle in R. chrysanthum. Effect of UV-B under CG and BG conditions on expression of metabolites in glycolysis and TCA cycle. Red indicates an increase in metabolite content, while green indicates a decrease in metabolite content.
4. Discussion
Currently, studies on R. chrysanthum have reported on its morphology, physiology, and biochemistry, but only a few of them have revealed the molecular mechanisms of R. chrysanthum resistance to UV-B stress by a multi-omics strategy. In this study, we used transcriptomics and metabolomics to combine multi-omics with biochemical methods to investigate the response of R. chrysanthum to UV-B stress at the molecular level.
The effects of enhanced UV-B radiation on both plant organs and photosynthesis are direct and pronounced, with its unfavorable effects inhibiting plant photosynthesis and causing damage to photosystem II [38]. The effect of UV-B radiation on photosynthesis is mainly due to a reduction in chlorophyll and carotenoid content, a disruption of the PSII reaction center, an inhibition of PSII electron transfer, and decrease in the chlorophyll fluorescence quenching coefficient [39,40,41]. A decrease in Fv/Fm values was found in a study of the effect of UV-B stress on the fluorescence properties of soybean chlorophyll [42]. In a study of photosynthetic performance in rice, UV-B stress was found to cause a significant decrease in the fluorescence parameters Fv/Fm [43]. The results of the present study, in which the fast-phase fluorescence kinetic properties of chlorophyll are investigated for Fv/Fm and Fv/Fo, are in agreement with the aforementioned results of the previous studies. In an analysis of the chlorophyll fluorescence properties of kale, it was found that UV-B stress elevated the DIo/CSo and PIABS of kale (Brassica oleracea L.) [9]. In a study on the effect of UV-B on the PSII properties of Betula alba, it was found that Fv/Fm and PIABS were reduced [44]. Whereas, in another study, the φE0, ψ0, and PIABS of maize were significantly increased in the absence of UV-B treatment [45]. Our findings are consistent with those of our predecessors. This indicates that R. chrysanthum photosynthesis is inhibited under UV-B stress. In addition, we analyzed the parameters related to the donor side of the PSII reaction center, the acceptor side, and photosynthetic performance. The Fv/Fo ratio, which is related to the activity of the donor side of the PSII reaction center, decreased, and the TRo/RC ratio decreased. The was an increase in ψ0, but φE0 was decreased. And the decrease in the ETo/RC ratios, which are related to the receptor-side activities of the PSII reaction centers, influenced the PSII photosynthetic performance parameters Fv/Fm and PIABS ratio, which decreased. However, the increased efficiency of electron transfer (ψ0) indicated that while UV-B radiation affected it, R. chrysanthum is resistant to UV-B stress and is able to keep the PSII center active. Therefore, within R. chrysanthum there exists a certain degree of resistance to UV-B stress, which ensures the plant’s ability to photosynthesize on its own.
In fact, photosynthesis plays an extremely important role in the supply of energy needed for a plant’s own life activities, for example, glycolysis and the TCA cycle. Researchers have extensively employed high-throughput sequencing technologies to investigate internal gene variations and identify novel genes across numerous species [46,47]. Yet, the transcriptome is not equivalent to the proteome; transcription represents only part of the process [48]. A multi-omics analysis better explains the real situation [49]. In a study of UV-B stress in Lonicera japonica Thunb., elevated levels of proteins associated with processes such as glycolysis, TCA, and major carbohydrates were found [50]. In a study of Clematis terniflora DC., it was found that the proteins related to the tricarboxylic acid cycle were differentially expressed under UV-B stress [51]. In corn (Zea mays L.) during the de-etiolation, DAPs were concentrated in the processes of glycolysis and the TCA cycle [52]. The results of the present study are consistent with these previous studies, in that some of the key DEGs and DEPs of R. chrysanthum are indeed enriched in the TCA and glycolytic pathways after UV-B stress. Previous studies on the subject have emphasized the conserved and ancient nature of some of the genetic programs for plant adaptation to terrestrial environmental stresses [53]. The changes in gene and protein expression in the glycolytic and TCA cycle pathways observed in this study not only reflect the central role of these pathways in energy metabolism, but also reveal their potential importance in the evolution of plant adaptation. Future studies could further explore the conserved and adaptive functions of these genes in different plant species. In particular, the role of these genes in plant responses to other environmental stresses (e.g., drought, low temperature, etc.) could be investigated, as well as their contribution to plant adaptive evolution. Taken together, the results of the present study suggest that R. chrysanthum may enhance its tolerance to UV-B radiation through the activation of these ancient genetic programs, which may be a widespread adaptive mechanism in the plant kingdom.
Metabolomics is the study of small molecule metabolites that act as the substrates and products of various metabolic pathways. Metabolomics can be used to validate other omics. In a study of Dendrobium officinale Kimura et Migo, UV-B induced glycolysis, starch and sucrose metabolism, and fructose and mannose metabolism pathways [54]. The level of D-fructose-6-phosphate in Porphyra haitanensis increased under UV-B stress, indicating that carbohydrate metabolism helps maintain the energy supply for plant metabolic activities in response to UV-B radiation [55]. In our study, we found that the levels of DMs detected in the glycolysis pathway increased, while the levels of citrate and isocitrate decreased in the TCA cycle pathway, and the levels of succinate, fumarate, and malate increased. This is consistent with previous research.
In conclusion, UV-B stress impairs the photosynthetic system and inhibits photosynthesis in R. chrysanthum. R. chrysanthum responds positively to UV-B stress through the TCA and glycolytic pathways. The differential expression of key proteins and genes in these pathways occurs, ultimately altering the content of the metabolites therein, and giving the plant the ability to adapt to UV-B stress (Figure 6).
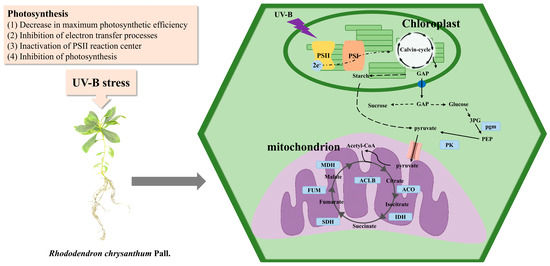
Figure 6.
Inhibition of photosynthesis under UV-B stress and acetylation-modified glycolysis and TCA cycle pathways in R. chrysanthum. PK: pyruvate kinase; ACO: aconitate hydratase; ACLB: ATP citrate (pro-S)-lyase; IDH: isocitrate dehydrogenase; SDH: succinate dehydrogenase (ubiquinone) flavoprotein subunit; FUM: fumarate hydratase; MDH: malate dehydrogenase; pgm: phosphoglucom.
Supplementary Materials
The following supporting information can be downloaded at: https://www.mdpi.com/article/10.3390/agronomy14091996/s1, Table S1: R. chrysanthum DEPs of information under UV-B stress.
Author Contributions
Writing—original draft preparation, W.Y. and F.G.; writing—review and editing, W.Y. and F.G.; methodology, W.Y. and F.G.; software, K.C. and W.Y.; visualization, W.Y. and F.G.; supervision, H.X. and X.Z.; project administration, H.X. and X.Z. All authors have read and agreed to the published version of the manuscript.
Funding
This work was supported by the Jilin Provincial Science and Technology Development Program project (YDZJ202301ZYTS517).
Data Availability Statement
The datasets generated during and/or analyzed during the current study are available from the corresponding author upon reasonable request.
Acknowledgments
We are grateful to Jingjie PTM Biolab (Hangzhou, China) Co., Ltd., for providing mass spectrometry support.
Conflicts of Interest
The authors declare no conflicts of interest.
References
- Zhou, X.; Chen, S.; Wu, H.; Yang, Y.; Xu, H. Biochemical and proteomics analyses of antioxidant enzymes reveal the potential stress tolerance in Rhododendron chrysanthum Pall. Biol. Direct 2017, 12, 10. [Google Scholar] [CrossRef]
- Lyu, J.; Wang, C.; Liang, D.Y.; Liu, L.; Pandey, L.K.; Xu, H.W.; Zhou, X.F. Sensitivity of wild and domesticated Rhododendron chrysanthum to different light regime (UVA, UVB, and PAR). Photosynthetica 2019, 57, 841–849. [Google Scholar] [CrossRef]
- Gong, F.; Yu, W.; Zeng, Q.; Dong, J.; Cao, K.; Xu, H.; Zhou, X. Rhododendron chrysanthum’s Primary Metabolites Are Converted to Phenolics More Quickly When Exposed to UV-B Radiation. Biomolecules 2023, 13, 1700. [Google Scholar] [CrossRef] [PubMed]
- Mmbando, G.S. The recent possible strategies for breeding ultraviolet-B-resistant crops. Heliyon 2024, 10, e27806. [Google Scholar] [CrossRef]
- Prado, F.E.; Rosa, M.; Prado, C.; Podazza, G.; Interdonato, R.; González, J.A.; Hilal, M. UV-B Radiation, Its Effects and Defense Mechanisms in Terrestrial Plants. In Environmental Adaptations and Stress Tolerance of Plants in the Era of Climate Change; Springer: New York, NY, USA, 2012; pp. 57–83. [Google Scholar] [CrossRef]
- Caldwell, M.M. Chapter 4—Solar uv irradiation and the growth and development of higher plants. Photophysiology 1971, 6, 131–177. [Google Scholar] [CrossRef]
- Yin, H.; Perera-Castro, A.V.; Randall, K.L.; Turnbull, J.D.; Waterman, M.J.; Dunn, J.; Robinson, S.A. Basking in the sun: How mosses photosynthesise and survive in Antarctica. Photosynth. Res. 2023, 158, 151–169. [Google Scholar] [CrossRef] [PubMed]
- Yu, G.H.; Li, W.; Yuan, Z.Y.; Cui, H.Y.; Lv, C.G.; Gao, Z.P.; Han, B.; Gong, Y.Z.; Chen, G.X. The effects of enhanced UV-B radiation on photosynthetic and biochemical activities in super-high-yield hybrid rice Liangyoupeijiu at the reproductive stage. Photosynthetica 2013, 51, 33–44. [Google Scholar] [CrossRef]
- Yoon, H.I.; Kim, D.; Son, J.E. Spatial and Temporal Bioactive Compound Contents and Chlorophyll Fluorescence of Kale (Brassica oleracea L.) Under UV-B Exposure Near Harvest Time in Controlled Environments. Photochem. Photobiol. 2020, 96, 845–852. [Google Scholar] [CrossRef]
- Yao, X.; Liu, Q. Responses of enzymes in terrestrial plants to enhanced UV-B radiation. Chin. J. Appl. Ecol. 2006, 17, 939. [Google Scholar]
- Yao, J.W.; Ma, Z.; Ma, Y.Q.; Zhu, Y.; Lei, M.Q.; Hao, C.Y.; Chen, L.Y.; Xu, Z.Q.; Huang, X. Role of melatonin in UV-B signaling pathway and UV-B stress resistance in Arabidopsis thaliana. Plant Cell Environ. 2021, 44, 114–129. [Google Scholar] [CrossRef]
- Liaqat, W.; Altaf, M.T.; Barutçular, C.; Nawaz, H.; Ullah, I.; Basit, A.; Mohamed, H.I. Ultraviolet-B radiation in relation to agriculture in the context of climate change: A review. Cereal Res. Commun. 2023, 52, 1–24. [Google Scholar] [CrossRef] [PubMed]
- Vass, I.; Szilárd, A.; Sicora, C. 43 Adverse Effects of UV-B Light on the Structure and Function of the Photosynthetic Apparatus. In Handbook of Photosynthesis; Talylor Francis Group: Abingdon, UK, 2005. [Google Scholar] [CrossRef]
- Albert, K.R.; Mikkelsen, T.N.; Ro-Poulsen, H. Ambient UV-B radiation decreases photosynthesis in high arctic Vaccinium uliginosum. Physiol. Plant. 2010, 133, 199–210. [Google Scholar] [CrossRef] [PubMed]
- Dehariya, P.; Kataria, S.; Guruprasad, K.N.; Pandey, G.P. Photosynthesis and yield in cotton (Gossypium hirsutum L.) Var. Vikram after exclusion of ambient solar UV-B/A. Acta Physiol. Plant. 2012, 34, 1133–1144. [Google Scholar] [CrossRef]
- Schoedl, K.; Schuhmacher, R.; Forneck, A. Correlating physiological parameters with biomarkers for UV-B stress indicators in leaves of grapevine cultivars Pinot noir and Riesling. J. Agric. Sci. Camb. 2013, 151, 189–200. [Google Scholar] [CrossRef]
- Yang, S.H.; Wang, L.J.; Li, S.H.; Duan, W.; Loescher, W.; Liang, Z.C. The effects of UV-B radiation on photosynthesis in relation to Photosystem II photochemistry, thermal dissipation and antioxidant defenses in winter wheat (Triticum aestivum L.) seedlings at different growth temperatures. Funct. Plant Biol. 2007, 34, 907–917. [Google Scholar] [CrossRef]
- Liang, L.; Ze, M.; Yang, J.; Xu, Q.; Du, C.; Hu, X.; Dong, M.; Zou, L.; Qi, T. Physiological and transcriptomic response reveals new insight into manganese tolerance of Celosia argentea Linn. J. Hazard. Mater. 2024, 465, 133079. [Google Scholar] [CrossRef]
- Zhang, Y.; Fernie, A.R. The Role of TCA Cycle Enzymes in Plants. Adv. Biol. 2023, 7, e2200238. [Google Scholar] [CrossRef]
- Fernie, A.R.; Carrari, F.; Sweetlove, L.J. Respiratory metabolism: Glycolysis, the TCA cycle and mitochondrial electron transport. Curr. Opin. Plant Biol. 2004, 7, 254–261. [Google Scholar] [CrossRef]
- Millar, A.H.; Small, I.D.; Day, D.A.; Whelan, J. Mitochondrial biogenesis and function in Arabidopsis. Arab. Book. 2008, 6, e0111. [Google Scholar] [CrossRef]
- Ofoe, R.; Thomas, R.H.; Abbey, L. Coordinated Regulation of Central Carbon Metabolism in Pyroligneous Acid-Treated Tomato Plants under Aluminum Stress. Metabolites 2023, 13, 770. [Google Scholar] [CrossRef] [PubMed]
- Millar, A.H.; Whelan, J.; Soole, K.L.; Day, D.A. Organization and regulation of mitochondrial respiration in plants. Annu. Rev. Plant Biol. 2011, 62, 79–104. [Google Scholar] [CrossRef] [PubMed]
- Zhang, J.; Zhang, Y.; Du, Y.; Chen, S.; Tang, H. Dynamic metabonomic responses of tobacco (Nicotiana tabacum) plants to salt stress. J. Proteome Res. 2011, 10, 1904–1914. [Google Scholar] [CrossRef] [PubMed]
- Toro, G.; Pinto, M. Plant respiration under low oxygen. Chil. J. Agric. Res. 2015, 75, 57–70. [Google Scholar] [CrossRef]
- Dadras, A.; Rieseberg, T.P.; Zegers, J.M.S.; Fürst-Jansen, J.M.R.; Irisarri, I.; de Vries, J.; de Vries, S. Accessible versatility underpins the deep evolution of plant specialized metabolism. Phytochem. Rev. 2023. [Google Scholar] [CrossRef]
- Wang, Z.; Rehman, A.; Jia, Y.; Dai, P.; He, S.; Wang, X.; Li, H.; Wang, L.; Qayyum, A.; Peng, Z.; et al. Transcriptome and proteome profiling revealed the key genes and pathways involved in the fiber quality formation in brown cotton. Gene 2023, 868, 147374. [Google Scholar] [CrossRef] [PubMed]
- Lin, N.; Liu, X.; Zhu, W.; Cheng, X.; Wang, X.; Wan, X.; Liu, L. Ambient Ultraviolet B Signal Modulates Tea Flavor Characteristics via Shifting a Metabolic Flux in Flavonoid Biosynthesis. J. Agric. Food Chem. 2021, 69, 3401–3414. [Google Scholar] [CrossRef]
- Zhang, Q.; Yang, W.; Liu, J.; Liu, H.; Lv, Z.; Zhang, C.; Chen, D.; Jiao, Z. Postharvest UV-C irradiation increased the flavonoids and anthocyanins accumulation, phenylpropanoid pathway gene expression, and antioxidant activity in sweet cherries (Prunus avium L.). Postharvest Biol. Technol. 2021, 175, 111490. [Google Scholar] [CrossRef]
- Sun, Q.; Liu, M.; Cao, K.; Xu, H.; Zhou, X. UV-B Irradiation to Amino Acids and Carbohydrate Metabolism in Rhododendron chrysanthum Leaves by Coupling Deep Transcriptome and Metabolome Analysis. Plants 2022, 11, 2730. [Google Scholar] [CrossRef]
- Yu, W.; Gong, F.; Xu, H.; Zhou, X. Molecular Mechanism of Exogenous ABA to Enhance UV-B Resistance in Rhododendron chrysanthum Pall. by Modulating Flavonoid Accumulation. Int. J. Mol. Sci. 2024, 25, 5248. [Google Scholar] [CrossRef]
- Chen, Y.; Chen, Y.; Shi, C.; Huang, Z.; Zhang, Y.; Li, S.; Li, Y.; Ye, J.; Yu, C.; Li, Z.; et al. SOAPnuke: A MapReduce acceleration-supported software for integrated quality control and preprocessing of high-throughput sequencing data. Gigascience 2018, 7, 1–6. [Google Scholar] [CrossRef]
- Grabherr, M.G.; Haas, B.J.; Yassour, M.; Levin, J.Z.; Thompson, D.A.; Amit, I.; Adiconis, X.; Fan, L.; Raychowdhury, R.; Zeng, Q.; et al. Full-length transcriptome assembly from RNA-Seq data without a reference genome. Nat. Biotechnol. 2011, 29, 644–652. [Google Scholar] [CrossRef]
- Langmead, B.; Salzberg, S.L. Fast gapped-read alignment with Bowtie 2. Nat. Methods 2012, 9, 357–359. [Google Scholar] [CrossRef] [PubMed]
- Li, B.; Dewey, C.N. RSEM: Accurate transcript quantification from RNA-Seq data with or without a reference genome. BMC Bioinform. 2011, 12, 323. [Google Scholar] [CrossRef] [PubMed]
- Kim, H.S.; Lee, B.Y.; Won, E.J.; Han, J.; Hwang, D.S.; Park, H.G.; Lee, J.S. Identification of xenobiotic biodegradation and metabolism-related genes in the copepod Tigriopus japonicus whole transcriptome analysis. Mar. Genom. 2015, 24, 207–208. [Google Scholar] [CrossRef]
- Untergasser, A.; Cutcutache, I.; Koressaar, T.; Ye, J.; Faircloth, B.C.; Remm, M.; Rozen, S.G. Primer3--new capabilities and interfaces. Nucleic Acids Res. 2012, 40, e115. [Google Scholar] [CrossRef] [PubMed]
- Abramova, A.; Vereshchagin, M.; Kulkov, L.; Kreslavski, V.D.; Kuznetsov, V.V.; Pashkovskiy, P. Potential Role of Phytochromes A and B and Cryptochrome 1 in the Adaptation of Solanum lycopersicum to UV-B Radiation. Int. J. Mol. Sci. 2023, 24, 13142. [Google Scholar] [CrossRef] [PubMed]
- Mishra, V.; Srivastava, G.; Prasad, S.M.; Abraham, G. Growth, photosynthetic pigments and photosynthetic activity during seedling stage of cowpea (Vigna unguiculata) in response to UV-B and dimethoate. Pestic. Biochem. Physiol. 2008, 92, 30–37. [Google Scholar] [CrossRef]
- Surabhi, G.-K.; Reddy, K.R.; Singh, S.K. Photosynthesis, fluorescence, shoot biomass and seed weight responses of three cowpea (Vigna unguiculata (L.) Walp.) cultivars with contrasting sensitivity to UV-B radiation. Environ. Exp. Bot. 2009, 66, 160–171. [Google Scholar] [CrossRef]
- Jaiswal, J.; Kumari, N.; Gupta, A.; Singh, A.P.; Sinha, R.P. Impacts of ultraviolet and photosynthetically active radiations on photosynthetic efficiency and antioxidant systems of the cyanobacterium Spirulina subsalsa HKAR-19. Folia Microbiol. (Praha) 2024, 69, 747–765. [Google Scholar] [CrossRef]
- Li, H.M.; Hu, Z.H.; Yang, Y.P.; Chen, S.T.; Li, C.Z.; Suo, F.X.; Shen, S.H. Influence of enhanced UV-B radiation on chlorophyll fluorescence characteristics of soybean. Huan Jing Ke Xue 2009, 30, 3669–3675. [Google Scholar]
- Lidon, F.C.; Ramalho, J.C. Impact of UV-B irradiation on photosynthetic performance and chloroplast membrane components in Oryza sativa L. J. Photochem. Photobiol. B 2011, 104, 457–466. [Google Scholar] [CrossRef] [PubMed]
- Albert, K.R.; Mikkelsen, T.N.; Ro-Poulsen, H.; Arndal, M.F.; Boesgaard, K.; Michelsen, A.; Bruhn, D.; Schmidt, N.M. Solar UV-B effects on PSII performance in Betula nana are influenced by PAR level and reduced by EDU: Results of a 3-year experiment in the High Arctic. Physiol. Plant 2012, 145, 485–500. [Google Scholar] [CrossRef] [PubMed]
- Shine, M.B.; Guruprasad, K.N. Oxyradicals and PSII activity in maize leaves in the absence of UV components of solar spectrum. J. Biosci. 2012, 37, 703–712. [Google Scholar] [CrossRef] [PubMed]
- Zou, W.; Sun, T.; Chen, Y.; Wang, D.; You, C.; Zang, S.; Lin, P.; Wu, Q.; Su, Y.; Que, Y. Sugarcane ScOPR1 gene enhances plant disease resistance through the modulation of hormonal signaling pathways. Plant Cell Rep. 2024, 43, 158. [Google Scholar] [CrossRef] [PubMed]
- Chen, X.; Gao, J.; Shen, Y. Abscisic acid controls sugar accumulation essential to strawberry fruit ripening via the FaRIPK1-FaTCP7-FaSTP13/FaSPT module. Plant J. 2024, 119, 1400–1417. [Google Scholar] [CrossRef]
- Huang, H.; Xie, S.; Xiao, Q.; Wei, B.; Zheng, L.; Wang, Y.; Cao, Y.; Zhang, X.; Long, T.; Li, Y.; et al. Sucrose and ABA regulate starch biosynthesis in maize through a novel transcription factor, ZmEREB156. Sci. Rep. 2016, 6, 27590. [Google Scholar] [CrossRef]
- Roychowdhury, R.; Das, S.P.; Gupta, A.; Parihar, P.; Chandrasekhar, K.; Sarker, U.; Kumar, A.; Ramrao, D.P.; Sudhakar, C. Multi-Omics Pipeline and Omics-Integration Approach to Decipher Plant’s Abiotic Stress Tolerance Responses. Genes 2023, 14, 1281. [Google Scholar] [CrossRef]
- Zhu, W.; Zheng, W.; Hu, X.; Xu, X.; Zhang, L.; Tian, J. Variations of metabolites and proteome in Lonicera japonica Thunb. buds and flowers under UV radiation. Biochim. Biophys. Acta Proteins Proteom. 2017, 1865, 404–413. [Google Scholar] [CrossRef]
- Tao, M.; Zhu, W.; Han, H.; Liu, S.; Liu, A.; Li, S.; Fu, H.; Tian, J. Mitochondrial proteomic analysis reveals the regulation of energy metabolism and reactive oxygen species production in Clematis terniflora DC. leaves under high-level UV-B radiation followed by dark treatment. J. Proteom. 2022, 254, 104410. [Google Scholar] [CrossRef]
- Yan, Z.; Shen, Z.; Gao, Z.F.; Chao, Q.; Qian, C.R.; Zheng, H.; Wang, B.C. A comprehensive analysis of the lysine acetylome reveals diverse functions of acetylated proteins during de-etiolation in Zea mays. J. Plant Physiol. 2020, 248, 153158. [Google Scholar] [CrossRef]
- Dadras, A.; Furst-Jansen, J.M.R.; Darienko, T.; Krone, D.; Scholz, P.; Sun, S.; Herrfurth, C.; Rieseberg, T.P.; Irisarri, I.; Steinkamp, R.; et al. Environmental gradients reveal stress hubs pre-dating plant terrestrialization. Nat. Plants 2023, 9, 1419–1438. [Google Scholar] [CrossRef] [PubMed]
- Chen, Y.; Shen, Q.; Lv, P.; Sun, C. Comparative metabolomic analyses of Dendrobium officinale Kimura et Migo responding to UV-B radiation reveal variations in the metabolisms associated with its bioactive ingredients. PeerJ 2020, 8, e9107. [Google Scholar] [CrossRef] [PubMed]
- Fu, S.; Xue, S.; Chen, J.; Shang, S.; Xiao, H.; Zang, Y.; Tang, X. Effects of Different Short-Term UV-B Radiation Intensities on Metabolic Characteristics of Porphyra haitanensis. Int. J. Mol. Sci. 2021, 22, 2180. [Google Scholar] [CrossRef] [PubMed]
Disclaimer/Publisher’s Note: The statements, opinions and data contained in all publications are solely those of the individual author(s) and contributor(s) and not of MDPI and/or the editor(s). MDPI and/or the editor(s) disclaim responsibility for any injury to people or property resulting from any ideas, methods, instructions or products referred to in the content. |
© 2024 by the authors. Licensee MDPI, Basel, Switzerland. This article is an open access article distributed under the terms and conditions of the Creative Commons Attribution (CC BY) license (https://creativecommons.org/licenses/by/4.0/).