Article

Differentiated In-Row Soil Management in a High-Density Olive Orchard: Effects on Weed Control, Tree Growth and Yield, and Economic and Environmental Sustainability

1
Council for Agricultural Research and Economics, Research Centre for Olive, Fruit and Citrus Crops, 00134 Rome, Italy
2
Department of Agricultural, Food and Environmental Sciences, Università Politecnica delle Marche, 60131 Ancona, Italy
3
Department of Economics and Legal Studies, Parthenope University of Naples, 80132 Naples, Italy
4
Council for Agricultural Research and Economics, Research Centre for Engineering and Agro-Food Processing, 00015 Monterotondo, Italy
5
Department of Soil, Plant, and Food Sciences, University of Bari ‘Aldo Moro’, 70126 Bari, Italy
6
Council for Agricultural Research and Economics, Research Centre for Agriculture and Environment, 00184 Rome, Italy
*
Authors to whom correspondence should be addressed.
Agronomy 2024, 14(9), 2051; https://doi.org/10.3390/agronomy14092051 (registering DOI)
Submission received: 14 June 2024 / Revised: 31 August 2024 / Accepted: 3 September 2024 / Published: 7 September 2024
(This article belongs to the Special Issue The Impact of Mulching on Crop Production and Farmland Environment)

Abstract

:
Two different in-row soil management techniques were compared in the Olive Orchard Innovation Long-term experiment of the Council for Agricultural Research and Economics, Research Centre for Olive, Fruit, and Citrus Crops in Rome, Italy. Rows were managed with an in-row rotary tiller and with synthetic mulching using permeable polypropylene placed after cultivar Maurino olive trees planting. The effects of the two treatments were assessed through weed soil coverage and the growth of the olive trees. Results showed better agronomic performance associated with synthetic mulching. The weed control effect along the row of a young high-density olive orchard was higher with the synthetic mulching compared to hoeing. The effect of the synthetic mulching seemed to disappear when removed from the ground (spring 2023) since no significant differences were found for tree size and yield in the two tested in-row soil management systems at the end of 2023. Finally, the growth of the young olive trees (Trunk Cross Sectional Area, Height, and Canopy expansion) measured across the three years, was higher for the synthetic mulched row than the hoed one. The use of synthetic mulching along the row positively forced the vegetative growth of the young olive trees and anticipated the onset of fruit production compared to periodical hoeing: a significantly higher fruit production was registered three years after planting. Root diameter was higher under synthetic mulching one year after planting, and no differences were observed in the following sampling dates showing similar fluctuations linked to the seasonal growth pattern. The life cycle assessment and costing highlighted that the application of mulching had a higher eco- and economic-efficiency than the periodical in-row soil hoeing.

1. Introduction

Olive-training systems are moving toward the progressive intensification of planting density to increase mechanization and reduce the cultivation costs, up to super-high density olive orchards with more than 1000 trees per hectare [1,2]. Strong vegetative growth of the trees is then required in the 2–3 years after planting to form as soon as possible a continuous hedgerow to allow an early onset of fruit production [3,4]. Previous studies have highlighted the importance of soil management techniques to reach this goal [5,6] as well as in preventing soil losses and erosion since the very early stages after planting [7,8]. Finally, soil biodiversity must be preserved for its important role in efficient root functioning, and the use of soil conservation practices, such as minimum mechanical soil disturbances, permanent soil covering (e.g., living mulches and/or residues), and intercropping, should be promoted.
In high-density olive orchards, two soil sectors can be distinguished: the soil area between the rows (inter-row) and the strip along the row (intra-row) [9]. The grass covering, in the inter-row soil area, provides good protection from soil erosion [7,8,10], improves soil fertility and reduces its structure degradation/compaction, avoids nutrient leaching, enhances a suitable habitat for the beneficial microorganisms and insects in order to increase biodiversity and root trophism [6,9,11], and ensures good transit ability of machinery, especially in rainy conditions. The study of alternative management systems, for specific procedural needs, has also led to the development of new technologies to facilitate individual operations as reported for other emerging supply chains. The green cover can be managed with periodical mowing (3–4 times per year) or laying the cover down using a roller crimper [12]. At the same time, weed control along the row is pivotal to reducing the competition for water and nutrients during the early critical period of tree growth [13]. There are different techniques for the management of the soil strips along the rows but not all of them are sustainable from an environmental and economical point of view [14]. They can be related to two main strategies: weed suppression (weed eradication by chemical or mechanical tools) or weed prevention (occupying their ecological niche, e.g., by organic or synthetic mulching).
Hoeing and tillage with cultivators or with innovative “finger-weeders” are common practices for weed suppression in such systems. Tillage destroys the roots encased within different soil layers, so the adoption of shallow tillage is highly recommended [14], and innovative tools are under implementation. Moreover, several drawbacks due to tillage are well documented, such as the highest risks of hurting the base of the plants during cultivation operations; the increased danger of soil erosion; the highest soil susceptibility to compaction or crusting; the decline of soil biological activity and diversity; and the highest CO2 emission into the atmosphere [6,15].
To reduce the impact of tillage on soil conservation, prevention strategies are encouraged to manage weeds; among these, the use of mulching can be very effective [3]. Indeed, besides weed control, mulching prevents strong fluctuations in soil temperature, improves the physical, chemical, and biological characteristics of the soil, and enhances orchard biodiversity [9,16]. Recently, the use of wild strawberry or local official species has been suggested as living mulching along the row in organic vineyards, olive and stone fruit orchards (peaches and apricots), registering a good weed control capacity and acting as agro-ecological service crops [9,17]. On the other hand, the use of roller crimpers has been proposed to obtain dead mulch to prevent weed seedling emergence and growth [11,18]. Similarly, synthetic mulching (e.g., polyethylene or geotextile films) can be effective in suppressing weeds, especially during the early stages of plant growth [16,19]. The use of synthetic mulch can reduce labor requirements, and other costs for weed control, and can ameliorate the growing conditions by reducing competition with weeds [20,21]. Plastic has a large effect on the microclimate around the plant affecting both the above-ground and below-ground temperatures and enhancing soil water conservation [22]. Disadvantages related to the use of synthetic mulch are the costs of mulch removal at the end of the weed control requirement, petrol consumption, and waste generation. Strips of mulching have successfully been applied for decades in horticulture and in fruit orchards where plants are arranged in continuous rows [21]. Therefore, mulching is suggested as an alternative solution for intra-row soil management as part of the intensification of cultural practices in olive oil orchards [5,23]. During a two-year vineyard weed management study, vines mulched with geotextile films exhibited nearly double canopy growth compared to control plants weeded with herbicide. The authors attributed this effect to the synthetic mulch’s ability to effectively suppress weeds and enhance soil temperature and moisture [24]. In an apple orchard, soil moisture under the polypropylene foil mulching was seven times lower than in the rows weeded with chemical herbicides; nevertheless. the cumulated yield in the third and fourth year after planting was 30% higher in the polypropylene mulched rows [19]. Żelazny et al. [25] reported a small effect of polypropylene mulch on soil water balance, but it is necessary to distinguish this within different synthetic mulches, such as film-structured or non-film-structured mulches [26].
To avoid the use of synthetic materials with subsequent problems of microplastic release and final disposal, the use of organic by-products or biodegradable/compostable films is highly advisable as indicated in previous studies [27].
Soil management practices along the rows have a strong influence on root growth, and therefore also on canopy development and tree yield [27,28].
The aim of the present research was to study the effects of synthetic mulching and mechanical in-row soil management on weed control, olive canopy growth, and root development in a high-density olive orchard with a suitable Italian variety Maurino during the three years after planting. We assumed that the two systems differently affected both the weed community composition and dynamics, and the tree growth. Moreover, since the two techniques have different requirements in terms of energy consumption and workload, their environmental and economic impacts were estimated under Italy’s Mediterranean conditions. We specifically hypothesized the following: (i) the weed control effect was higher with the mulch presence, (ii) the residual effect of the two treatments differently influenced the weed community dynamics; (iii) the mulch positively affected the olive canopy growth; and (iv) the soil hoeing had a higher eco-efficiency than mulching. It is a case study approach [29,30,31], in which the authors try to identify the best field management system from an environmental and economic point of view, in specific agroclimatic conditions. To that end, an eco-efficiency ratio [32] (which measures the value added per 1 Mg of greenhouse gases (GHGs) emitted into the atmosphere for each mulching strategy) was estimated to identify the most advantageous scenario.
To the best of our knowledge, this is the first study that focuses on the economic and environmental sustainability of two different in-row management strategies. Therefore, the impacts of the low-cost and eco-friendly aspects of mulching practice should be explored deeply in the future.

2. Materials and Methods

2.1. Site and Experimental Setup

The trial was carried out on Maurino cultivar trees, in the Super High-Density (SHD) “Olive Orchard Innovation Long-term experiment” (OOIL) located at the experimental farm of the Council for Agricultural Research and Economics, Research Centre for Olive, Fruit, and Citrus Crops (CREA-OFA) in Rome, central Italy (Lat. 41°47′20.4″ N, Long. 12°33′42.2″ E, Alt. 100 m a.s.l.). The olive trees were planted at 4 m × 2 m (1250 trees per hectare) in October 2019. The maintenance of the central leader was ensured by periodically tying an extension leader to the stake. Pruning was executed yearly and limited to eliminate vigorous branches nearby to the extension leader and to remove suckers or branches in the trunk up to 50–60 cm from the ground. The soil of the experimental trial is classified as a Eutric Phaeozem (IUSS Working Group WRB, 2015) [33]. It has a sandy clay loam texture (75%, 10%, and 15% of sand, clay, and silt, respectively) with an Electric Conductivity of 0.130 mS cm−1 and a pH of 7.2, and it contains 0.032% and 0.48% of total nitrogen and organic matter (0–40 cm layer), respectively. A drip irrigation system was positioned with a single line per row and each dripper was positioned with an interval of 0.5 m and a flow rate of 1.6 L h−1. Supplied irrigation volumes were calculated by estimating the effective crop evapotranspiration [7] and then supplying about 100% of the water requirements according to the climate conditions to ensure strong vegetative growth. Each tree was fertilized with 65 g of urea (46-0-0 NPK) in May and 100 g of Nitrophoska Gold (15-9-15 NPK; Compo Expert Italia srl, Cesano Maderno, MB, Italy) in June and July for a total of 60 g of N per tree in 2020. In 2021 and 2022, each tree received a total of 120 g of N divided into 130.4 g of urea (46 N) in May and 200 g of Nitrophoska Gold (15-9-15 NPK) in June and July, respectively.
Meteorological data were obtained from the agrometeorological station of the Integrated Agrometeorological Service of the Regional Agency for the Development and Innovation of Agriculture in Latium (ARSIAL), located in Marino (RM). Meteorological conditions during the years of the trial for the experimental site are shown in Figure 1.
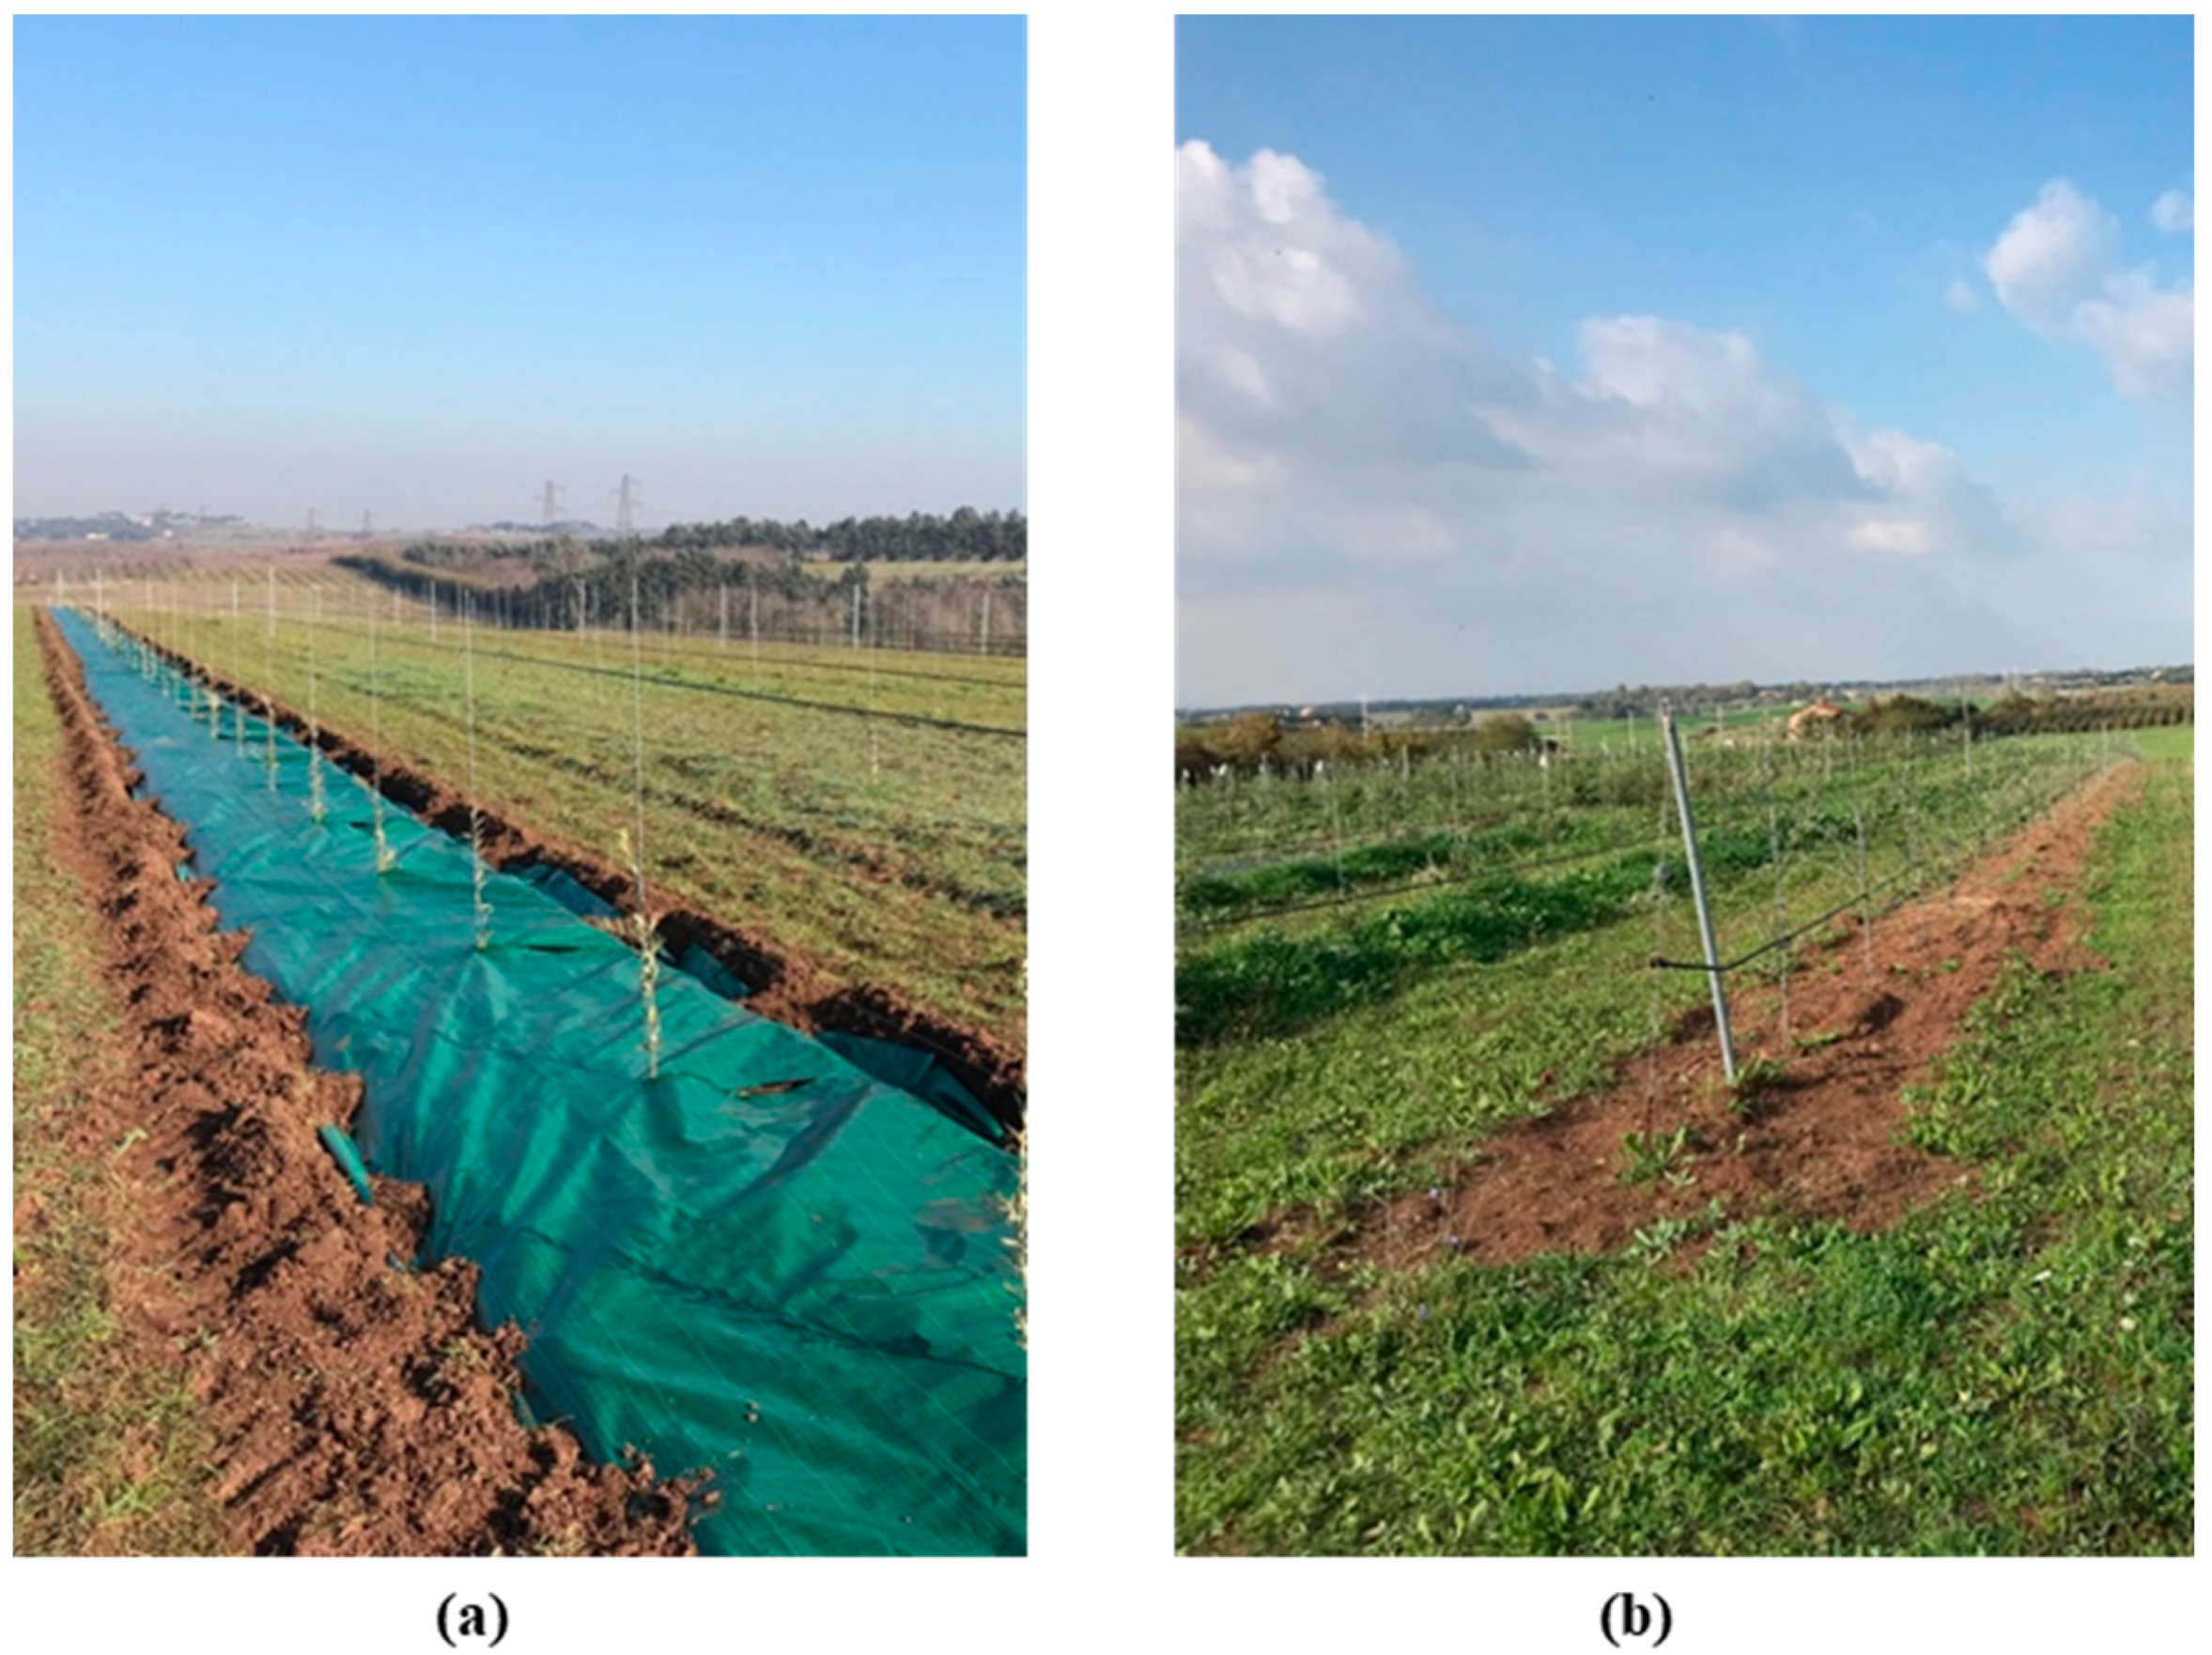
The differential soil management was conducted on two adjacent rows (63 trees for rows) from 2020 to 2023. Along the first row, a synthetic mulch (Tenax®, Viganò, LC, Italy; outdoor cover permeable polypropylene green anti-weed net 1.0 m width, 40 μm thickness, 105 g m−2 weight) was placed immediately after planting (in November 2019). The second row was managed with mechanical weeding (hoeing by an inter-row rotary hoe), executed four times per year (Figure 2). The inter-row space was managed by periodical mowing, leaving the chopped residues on the soil surface twice per year, corresponding to the maximum development of the natural grass cover (autumn and spring).
The synthetic mulch was then removed on 25 November 2022, when it began to wear away. Likewise, the last hoeing was performed two days later, allowing the residual effect of the two treatments (mulching vs. hoeing) on spontaneous cover to be evaluated until spring 2023.

2.2. Measurements

The effect of the two treatments (mulching vs. hoeing) were evaluated in two separate moments: (i) during the trial, and (ii) the residual effect after the removal of the synthetic mulch. The weed evolution during the trial was evaluated during 2020–2021 as a visual estimation of the total weed cover (Tot cov %) by taking photos in the intra-row soil surface between two consecutive trees for each treatment, using nine 1.0 m × 1.0 m quadrats uniformly positioned along the row in each sampling time. Photos were taken on 9 September 2020, on 11 November 2020 (before and immediately after hoeing by an inter-row hoe), on 16 December 2020 (35 Days After Tillage, DAT), on 19 January 2021 (69 DAT) and on 7 April 2021 (147 DAT), corresponding to 12, 13, 14, and 18 months after the placement of the synthetic mulch respectively. At each sampling time, weed cover was evaluated at the species level to provide: total cover % (total weed cover in 1 m−2), incidence of perennials (PRN%), species richness, R (n° species per sampled area) within each treatment, and evenness, e. Evenness (e) [34] was based on the Pielou index as H/Hmax, where H is the Shannon–Weaver index (1) and Hmax is the base-e logarithm of R.
H = i   =   1 R ( Pi × ln Pi ) ;
where Pi is the proportion of a given species over the total number of species found in the ith sample, ln Pi is the natural logarithm of Pi, and R is the number of species found in the ith sample.
The evaluation of the residual effects by direct visual estimation was performed twice after the mulch removal and the last hoeing, at the end of winter (10 February 2023; 77 days after mulch removal/hoeing) and the beginning of spring (21 March 2023; 116 days after mulch removal/hoeing). The two samplings were carried out at the species level by positioning 9 quadrats (1.0 × 1.0 m2) per treatment (hoeing and mulching) along the row plus 9 randomly selected quadrats (1.0 × 1.0 m2) in the inter-row area, in correspondence of in-row samplings, to evaluate the effect of mowing. The quadrats were repeated at the same places in both the dates and Tot cov %, R, and e were computed also at this stage. Additionally, the Sorensen similarity (Slq %) index was calculated to measure the relationship between the two following samplings. Slq was obtained by taking the ratio of the number of species shared between the two populations, relative to the total number of species in both samplings. Finally, the Community Weighted Mean (CWM) was calculated for the following traits: growth form (Grass-like %, graminoids vs. rosette-forming and ascending or creeping leafy species), Nitrogen-fixing (N-Fixing %, leguminous species), life form (PRN %, perennials vs. annuals), canopy height (CH, m, maximum height at maturity), seed weight (SW, g), and specific leaf area (SLA, mm2 mg−1). The CWM is a community-aggregated metric and represents the expected functional trait value of a random community sample, often representing the dominant trait value in a community.
Measurements of tree height, longitudinal (along the row), and transversal (perpendicular to the row) canopy widths and trunk diameter at 20 cm above the ground level were executed at the beginning and at the end of each vegetative season on 30 trees (replicates) per each treatment uniformly distributed along the row. The Trunk Cross-Sectional Area (TCSA) was then calculated.
The volume of tree canopies was calculated at the end of two vegetative seasons (December 2021 and October 2022) assuming the shape of the canopy as a cylinder with an elliptical base, where tree canopy width along the row, and width across the row were considered the axis of the ellipse. The formula used to calculate the canopy volume (2) was:
Canopy Volume (m3) = π × (½ a) × (½ b) × H
where a is the width along the row (m), b is the width in inter-row (m), and H is the canopy height (m) calculated as the tree height—the distance of the first primary branch insertion from the soil.
Fruits were collected in early November 2021 for the 2nd year, and in October 2022 for the 3rd year in the same 30 trees per treatment used for the measurements of the vegetative growth. The yield of the fruits per tree (kg), and the number of fruits collected were considered. The number of fruits was estimated as the ratio between the weight of the entirety of the fruits harvested per tree, above the weight of a single fresh fruit, obtained as the mean weight of 50 fresh fruits. Furthermore, the yield efficiency index was calculated, as the ratio between the weight of harvested fruits and the TCSA per tree.
In November 2020, December 2021, and October 2022 soil samples were collected to study the root development. The weeds above the ground were removed and soil cores were collected using a hand auger (7.0 cm diameter and 15.0 cm length). For both intra-row management treatments, soil samples were collected along the row at 30 cm from the base of the trunk and at a depth of 0–15 cm. Sampling was repeated on 8 trees (replicates) per treatment. The collected cores were then dried at 60 °C, until reaching constant weight. The soil was separated from the roots using sieves (Ø = 1 mm) and tweezers. Washed roots and root fragments were placed on transparent paper sheets and scanned (HP Scanjet G4050). Images were processed using WinRHIZO™ software (basic version, Regent Instrument Inc., Quebec, QC, Canada) [35] to obtain the length and the mean diameter of the roots. The Root Length Density (RLD) (cm g−1) was calculated by dividing the root length by the corresponding soil sample weight.
The measured parameters during the experimental field trial are summarized in Table 1.

2.3. Statistical Analysis

Data were analyzed by one-way ANOVA and the Tukey–Kramer test (HSD) at p < 0.05 was performed for the separation of means. All the statistical analyses except for weed data were performed using JMP 14.0 software (SAS Institute, Cary, NC, USA) [36].
The Kruskal–Wallis H-test, based on rank transformation, was applied for the analysis of the insight on weed community evolution after mulch removal/last hoeing, and the pairwise comparisons between a couple of treatment factors were processed by the exact Mann–Whitney post hoc test. A Principal Component Analysis (PCA) was run per sampling date (February and March 2023) on a total of 9 variables (6 weed traits plus R and e index, and the Tot cov %) calculated for 27 treatments (hoeing, mulching, and the chopped inter-row) with the aim of characterizing the weed traits and community diversity relationships. A biplot (traits and community structural parameters vs. treatments) considering the two most important components were generated with the aim of identifying the latent relationship between cases (treatments) and variables (traits and weed community structural parameters). All the analyses on weed community comparison and traits were performed with the STATISTICA analytical software version 7.1 (StatSoft Inc., Tulsa, OK, USA) [37].

2.4. Life Cycle Assessment Methodology

The environmental assessment related to the two different in-row management techniques (i.e., mulching and hoeing) in SHD olive cultivation was performed using the life cycle assessment methodology (LCA) according to UNI EN ISO 14040: 2006 and 14044: 2006 [38,39] and using an attributional approach.
Firstly, in the LCA system boundary, all the agricultural phases of in-row management strategies were considered, while the functional unit, that is, the reference unit used to calculate all inputs and outputs from the boundaries of the system, was set as 1 hectare of olive cultivation. Secondly, a life cycle inventory was prepared. The necessary data for the assessment, for instance, the technical features of tractors and agricultural equipment and fuel consumption, were derived from our internal survey (Table 2). The secondary data (i.e., data referred to the emission related to the machinery during different agricultural phases) derive from the Simapro code database 8.0.2 (Prè Consultants, Amersfoort, The Netherlands) [40].
Thirdly, a life cycle impact assessment was prepared. In particular, to assess the environmental impact of 1 hectare of olive cultivation; the method CML-IA baseline [41] was used to allow us to assess several midpoint impact categories. Successively, in order to calculate the eco-efficiency ratio, the environmental impact was measured by the carbon footprint for each mulching strategy in terms of GHG emissions (IPCC, 2007, 100-year) per 1 hectare of olive. In particular, the carbon footprint was defined as the overall amount of all GHGs emitted during all agricultural phases within the considered system boundary and expressed in CO2 eq. using the IPCC 2007 methodology (Global Warming Potential, GWP, 100-year life span—V1.02). The carbon footprint was calculated using the Simapro code 8.0.2 (Prè Consultants, Amersfoort, The Netherlands) [40]. Moreover, an economic evaluation was carried out in parallel with LCA also using a life cycle approach that considers the same LCA system boundaries. It is important to observe that the economic assessment is a critical aspect because, in the assessment of different alternatives for field management, the focus of farmers is mainly based on the economic aspect.

2.5. Life Cycle Costing and the Eco-Efficiency Ratio

The life cycle costing methodology (LCC) relies on LCA steps as reported in the International Organization for Standardization [38,39], and is used to assess the costs along the whole life cycle of a given product [31] focusing on the costs of each step [42]. In the present study, a conventional LCC was used including the evaluation of costs associated with the life cycle of the olive cultivation to each management strategy (i.e., mulching the row with synthetic cloth vs. hoeing the soil along the row with the rotary tiller). The LCC assessment is focused on the intermediate consumption costs that include the value of goods and services consumed as inputs by a production process (including raw materials, services, and other operating expenses), other than fixed assets. All costs come from experimental field data and are calculated for each management strategy and referred to 1 hectare of olive cultivation. The total intermediate consumption costs (tractor, equipment, intermediate inputs) are subtracted from the total revenues (multiplying olive price [43] and quantity of product) for each considered field management to obtain the gross value added (GVA). GVA is an indicator used to evaluate the farm’s economic sustainability. According to Van Passel et al., 2004 [44], a farm can be indeed defined as economically sustainable if it creates an added value sufficient to remunerate all resources in an adequate way, both today and in the future.
Finally, the eco-efficiency ratio has been calculated as the ratio between the economic aspect and environmental burden of each scenario (e.g., by dividing its GVA by its GHG emission total) [45]. This ratio was used to measure the added value per Mg of GHGs emitted into the atmosphere by the two different soil management strategies.
In addition, the ratio between gross margin and GWP emissions was used to assess the economic performance per unit of environmental impact.

3. Results and Discussion

3.1. Weed Dynamics during the Trial

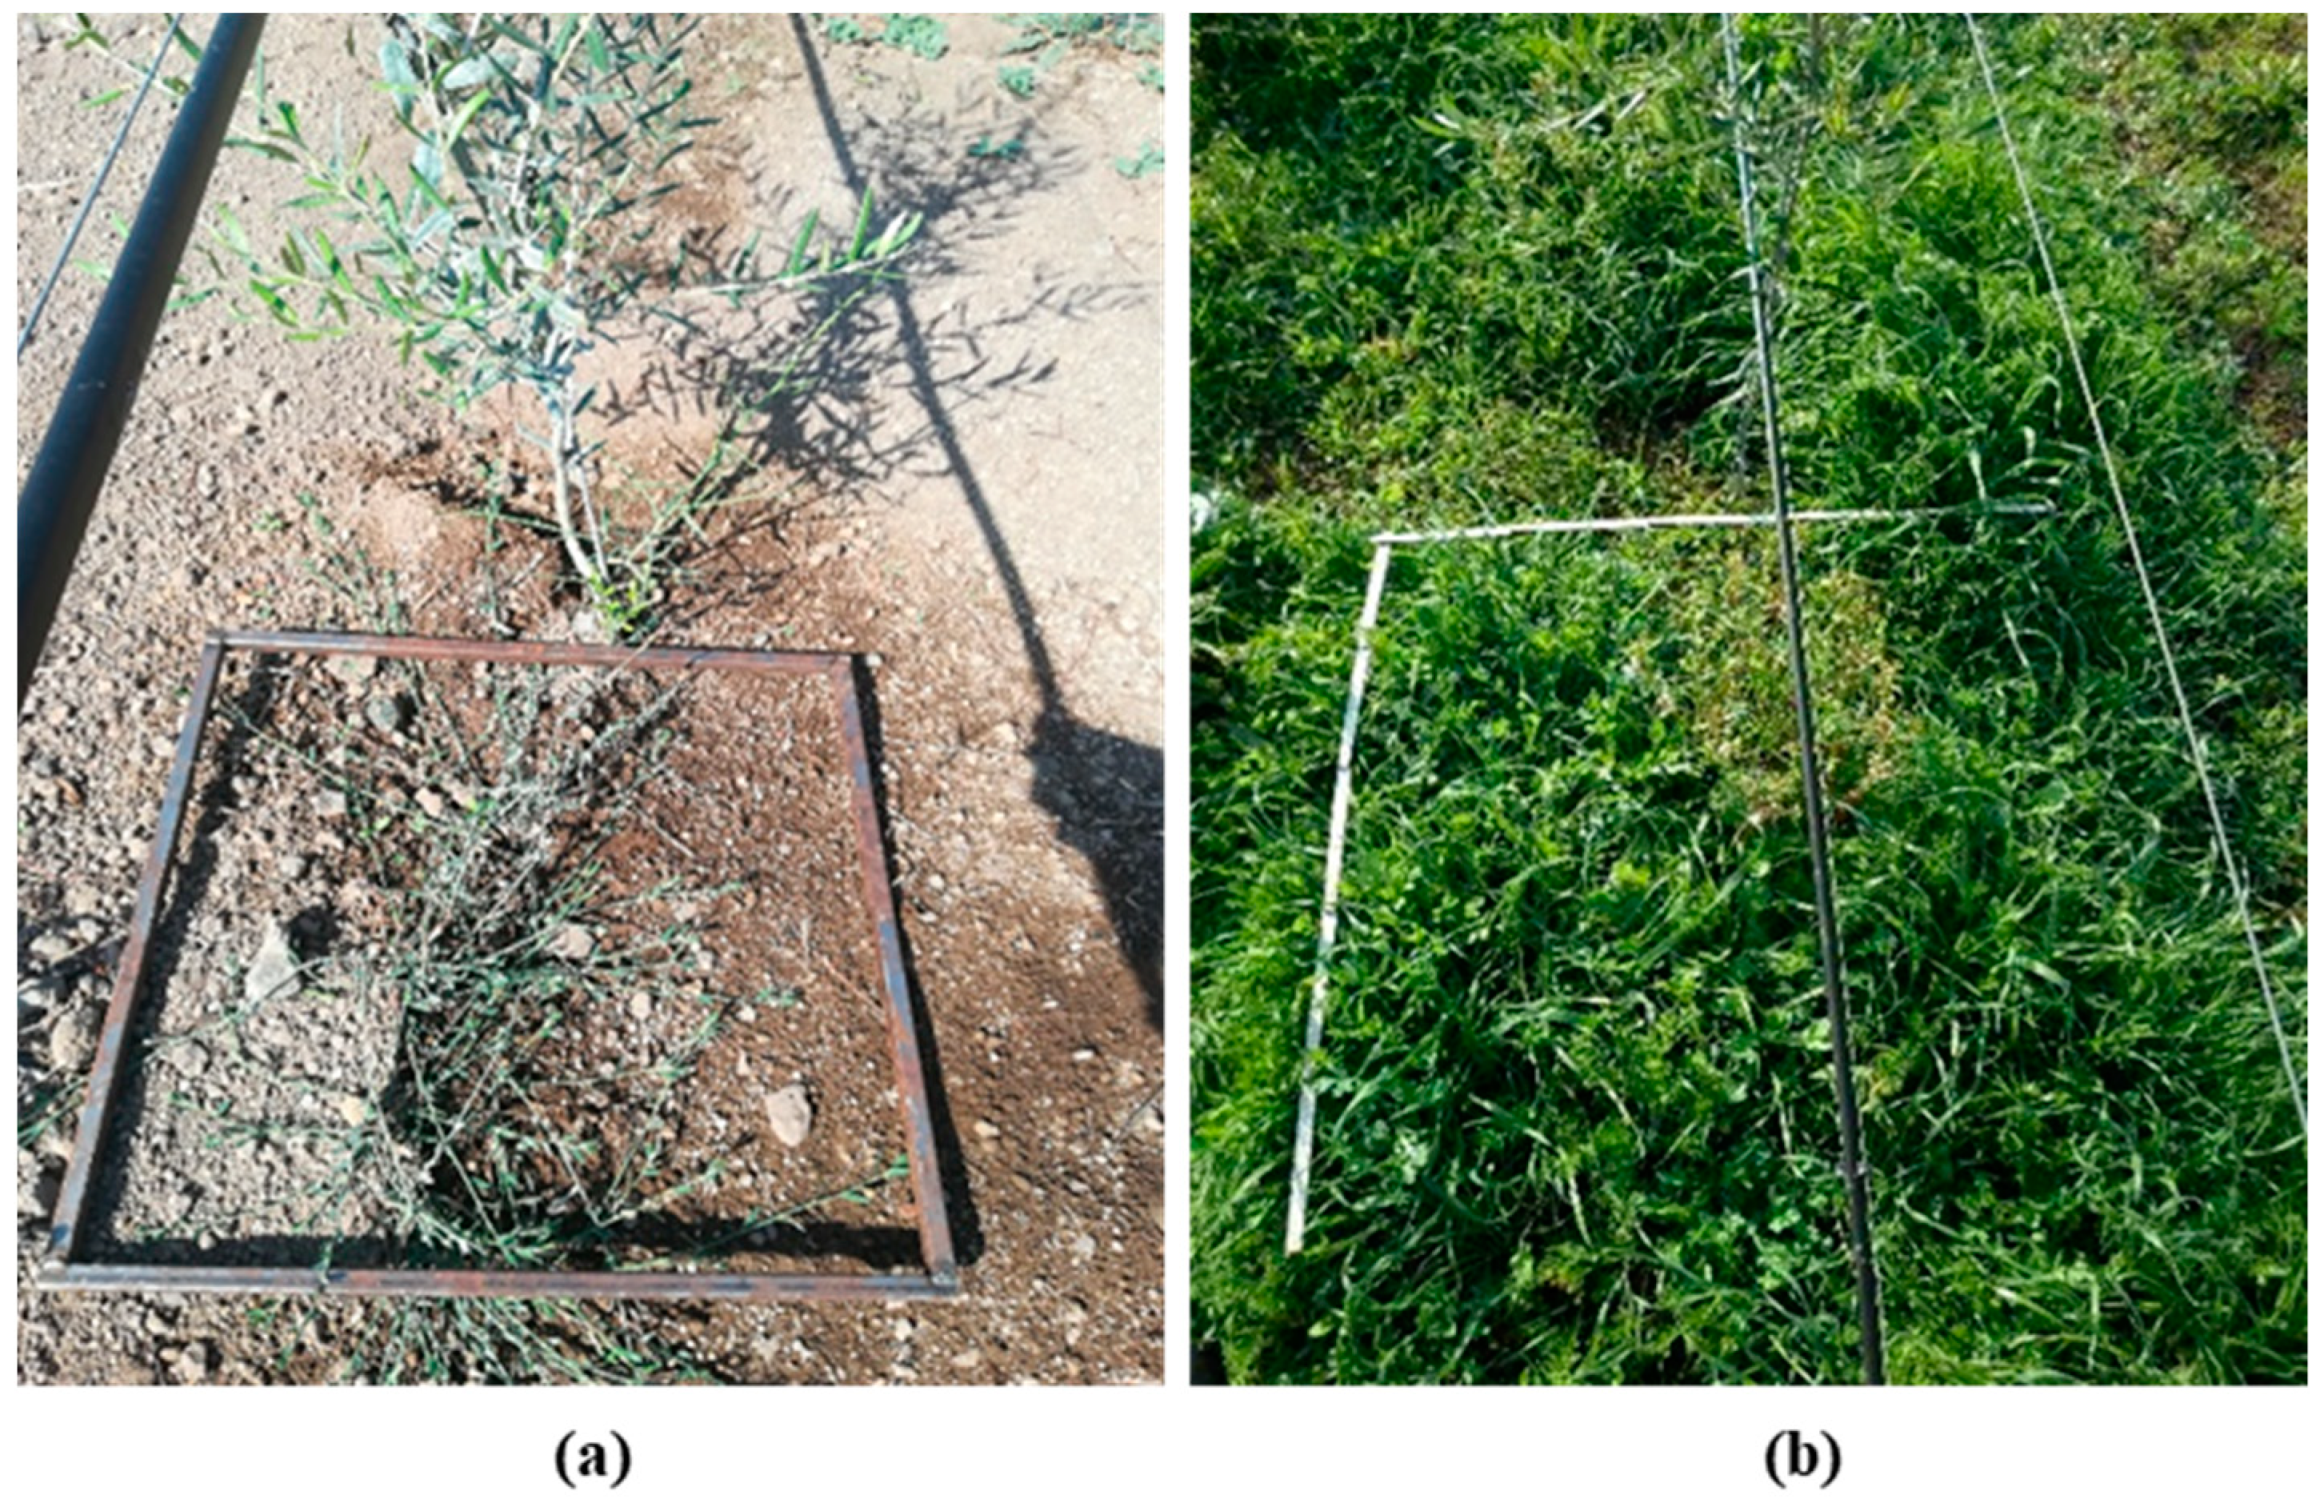
Synthetic mulching confirmed the strong attitude to prevent weed emergence. No weed presence was recorded along mulched row, until the synthetic mulching was removed in October 2022. The percentage of the total weed cover (Tot cov %) along the hoed row, increased from September 2020 (14.9%) up to November 2020 (100%) just before the passage of the rotary tiller (Figure 3b).
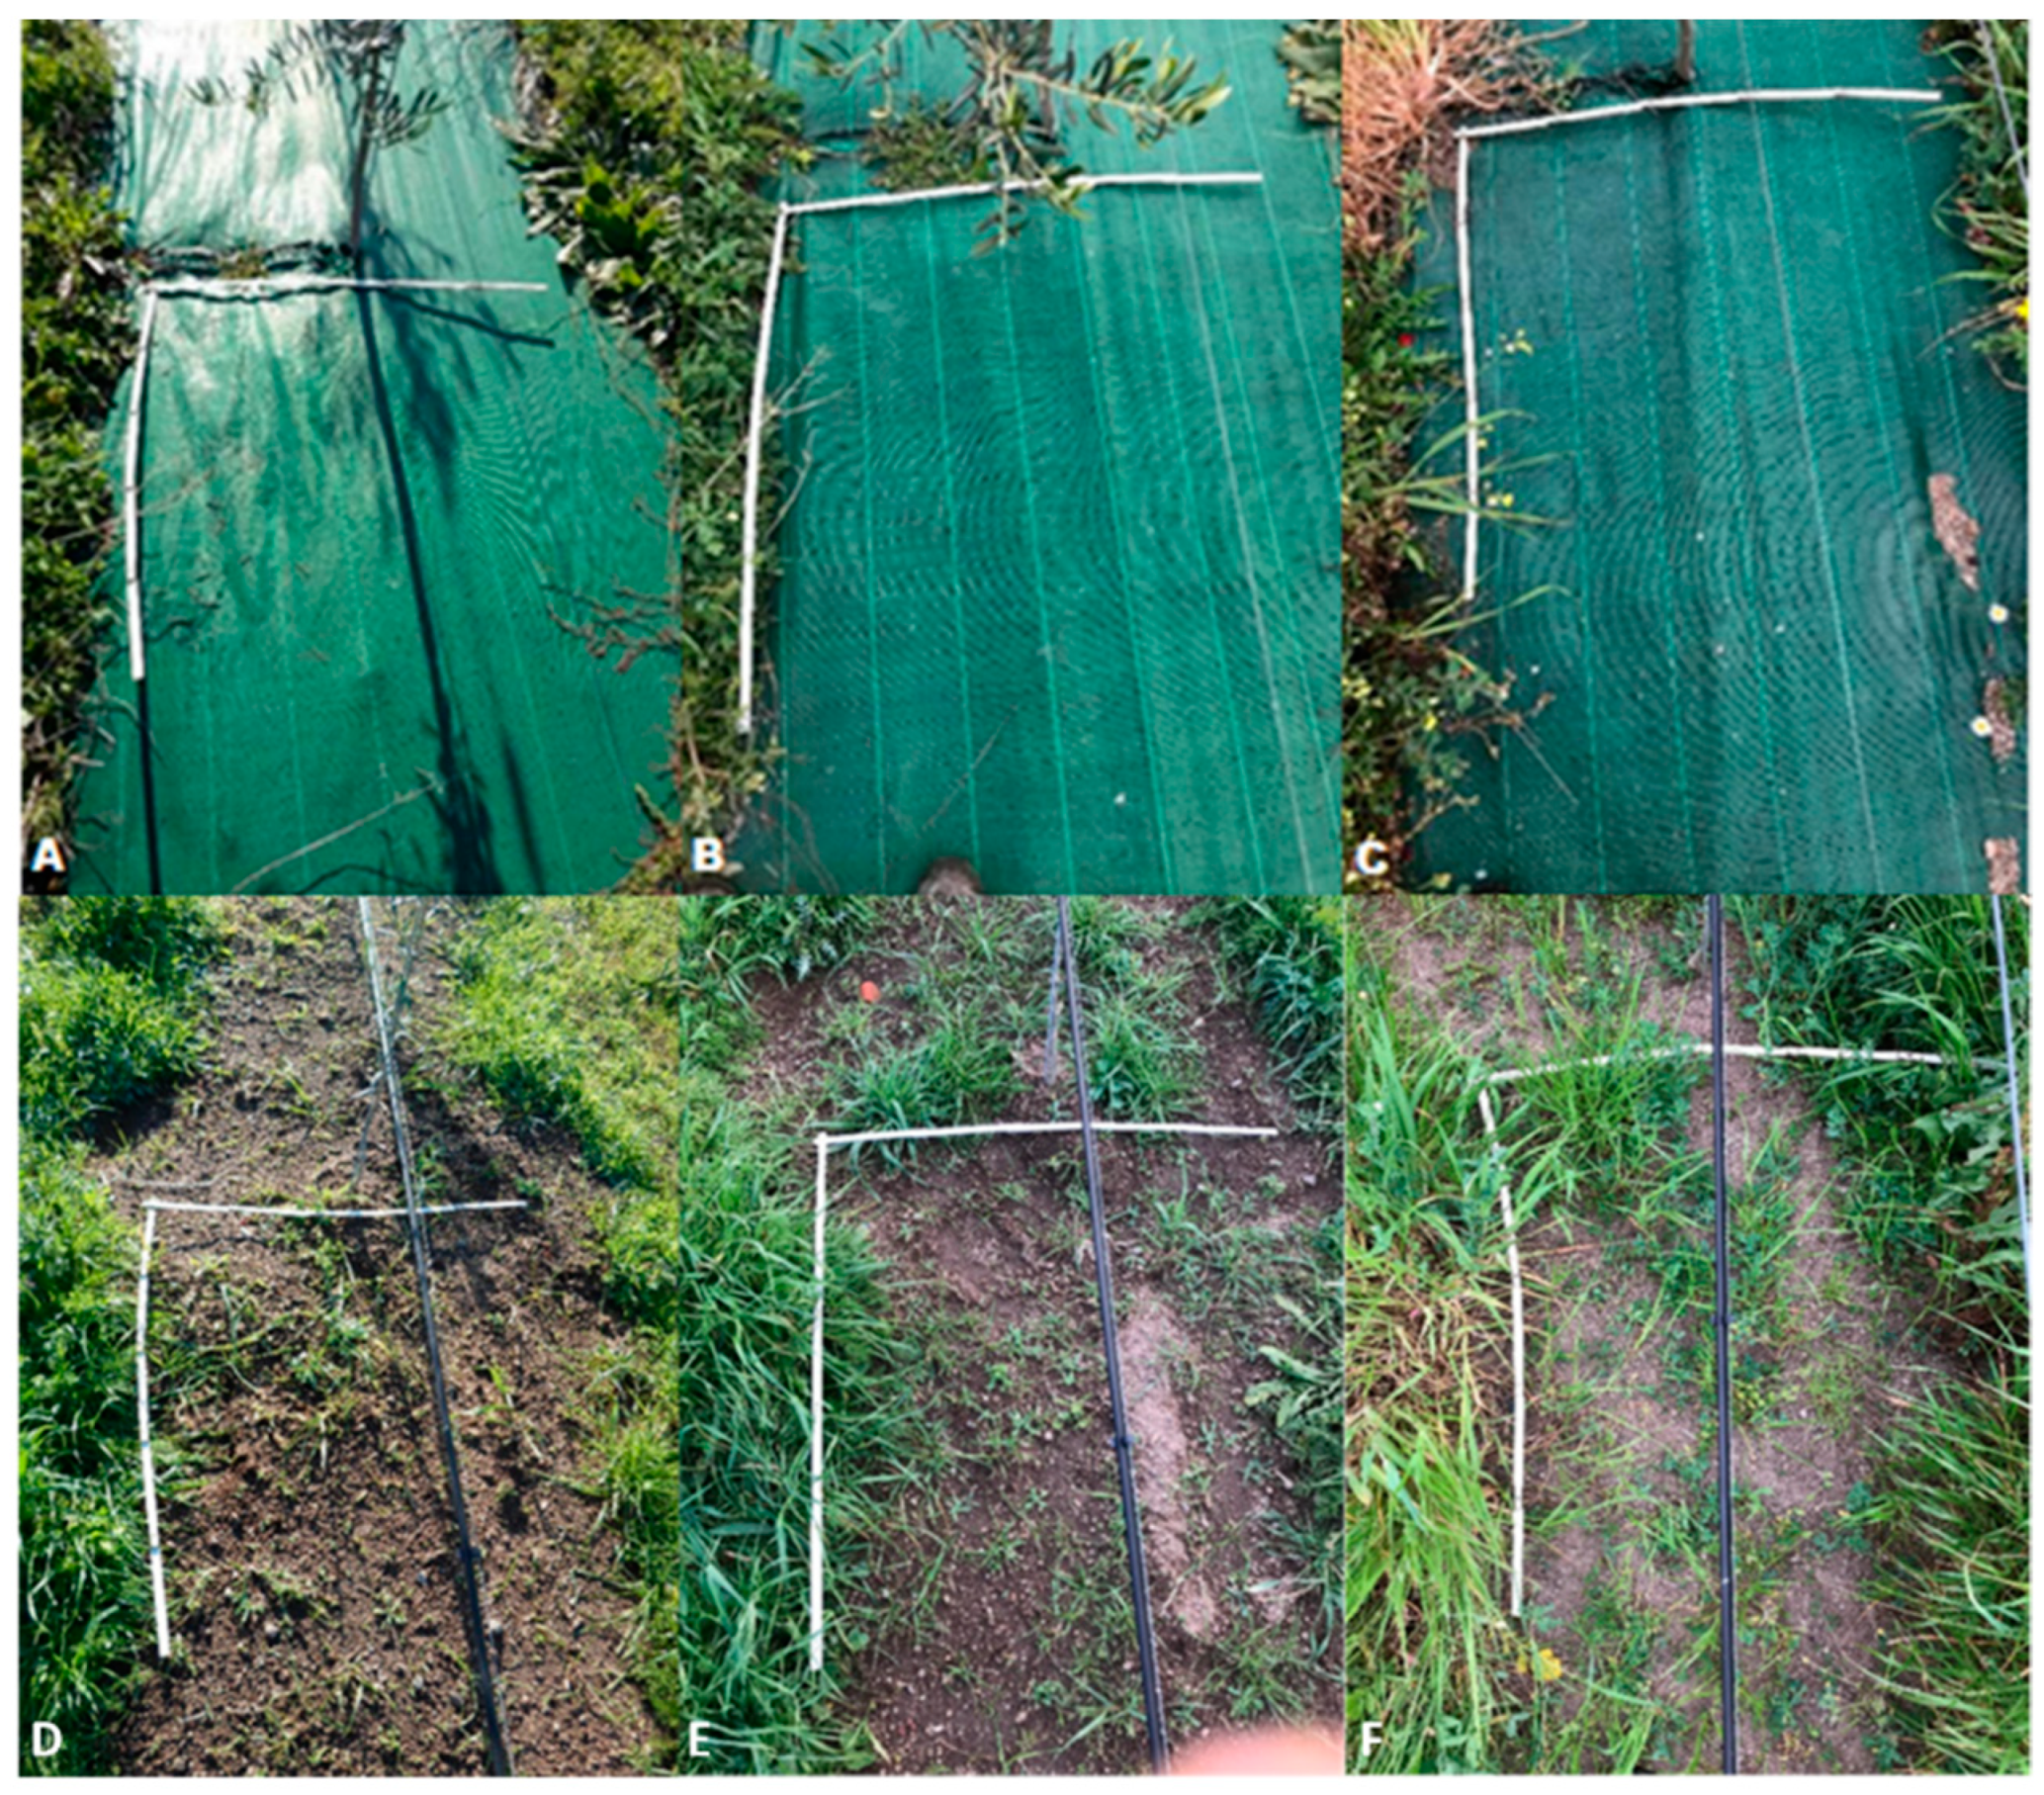
Synthetic mulching, in coherence with the declared use-advantage of the chosen mulch, resulted in effectively smothering the emergence of the weed seedling during the duration of the trial; this was also due to the absence of any rips or holes (Figure 4) and the thickness of the mulch, and was in contrast with other experiences of use of plastic mulch in perennial crops where seedling emergence was observed after one year from the application [46]. Table 2 reports the evolution of the weed community structure, described by the three considered parameters (Tot cov %, R, e, and PRN %), before the hoeing and then 147 days after the treatment. Along the hoed row, the weed presence resulted in 0.00 immediately after the hoeing (0 DAT), and rose across the months reaching up to 37.6% of total cover in April 2022 (at 147 DAT) (Table 3 and Figure 4).
On the side of the weed community composition, the Poaceae family was statistically found to be the most predominant in all sampling dates of the trial (35 DAT, 69 DAT, and 147 DAT), followed by the Asteraceae family. In April 2021 Fabaceae family appeared with a few species.

3.2. Residual Effect of Treatments on Weed Communities

Analysis of the residual effect of treatments (mulching or hoeing along the row, mowing and chopping of the inter-row area) on weed communities on the two samplings of February 2023 and March 2023 put in evidence a reduction in total weed cover percentage along the mulched row, with no differences between hoeing and chopping (Table 4). Mulching also showed the lowest weed community richness (with the chopped in February, and alone in March) and the highest evenness. The mulching showed the highest incidence of N-fixing and perennial species, as well as the highest SLA (both sampling) and CH (hoed one time in spring). Hoeing recorded the highest R, incidence of Grass-like species, and SLA, whereas the chopping showed significantly lower values for all considered parameters, but the weed total cover percentage (Tot cov %) showed no differences with the hoeing. The community showed the highest similarity between the two sampling dates in the hoed row, whereas the lowest was in the mulched one.
Figure 5 reports the PCA analysis of the two samplings, whereas the loadings of the different variables are reported in Table 5. Results in the two samplings pointed out similar performance of the three compared treatments over time. The total weed cover positively characterizes the first PCA axis, which is negatively correlated with the evenness and the N-fixing on both dates, and the perennials and SLA in the second one (Figure 5a,b, Table 5). The second PCA is instead positively correlated with the Grass-like species and SLA in both samplings and with R and SW in March, whereas negatively correlated with PRN and CH in February (Figure 5c,d, Table 5). The three systems are then discriminated mainly by the total cover, positively characterizing the chopped one and negatively the mulched one, instead mainly related to evenness, N-fixing, and (in March) incidence of perennial species. Moreover, hoeing was more related to SLA and Grass-like species, showing an intermediate behavior between the other two systems.
In our research, the use of synthetic mulching properly controlled weed development, maintaining its complete effectiveness up to two years after the application (Figure 5a–c). This result was in line with previous studies reported by the World Business Council for Sustainable Development [45]. On the contrary, weed development has a fluctuating trend in relation to climate conditions and the environmental requirements of each weed species in hoeing, according to Las Casas et al. [9]. The latter treatment effectively controlled the weeds immediately after the passage of the hoeing, due to the synthetic mulching, and no significative difference between the two treatments was observed. However, along the row managed with the hoeing, weeds resumed to develop shortly after the treatment, and in April (147 days after treatment), soil surface cover returned to 37% (Figure 4). Especially during the rainy and temperate months (in spring and autumn), weed development between two consecutive mechanical hoeing could represent a competitive factor for the growth of the young olive plantlets. Looking at the residual effect of the treatment, our results highlighted the increase in perennial species in the presence of a no-tilled and mulched system, as well the highest cover development in the presence of mowing, suggesting alternating the practices to overcome the risk of selection of a competitive flora, according to World Business Council for Sustainable Development publication [45]. On the other hand, the high evenness of the mulched system indicates the low potential competitive effect of its weed community on the olive crop, due to the lack of dominance of any species.

3.3. Olive Tree Growth and Yield

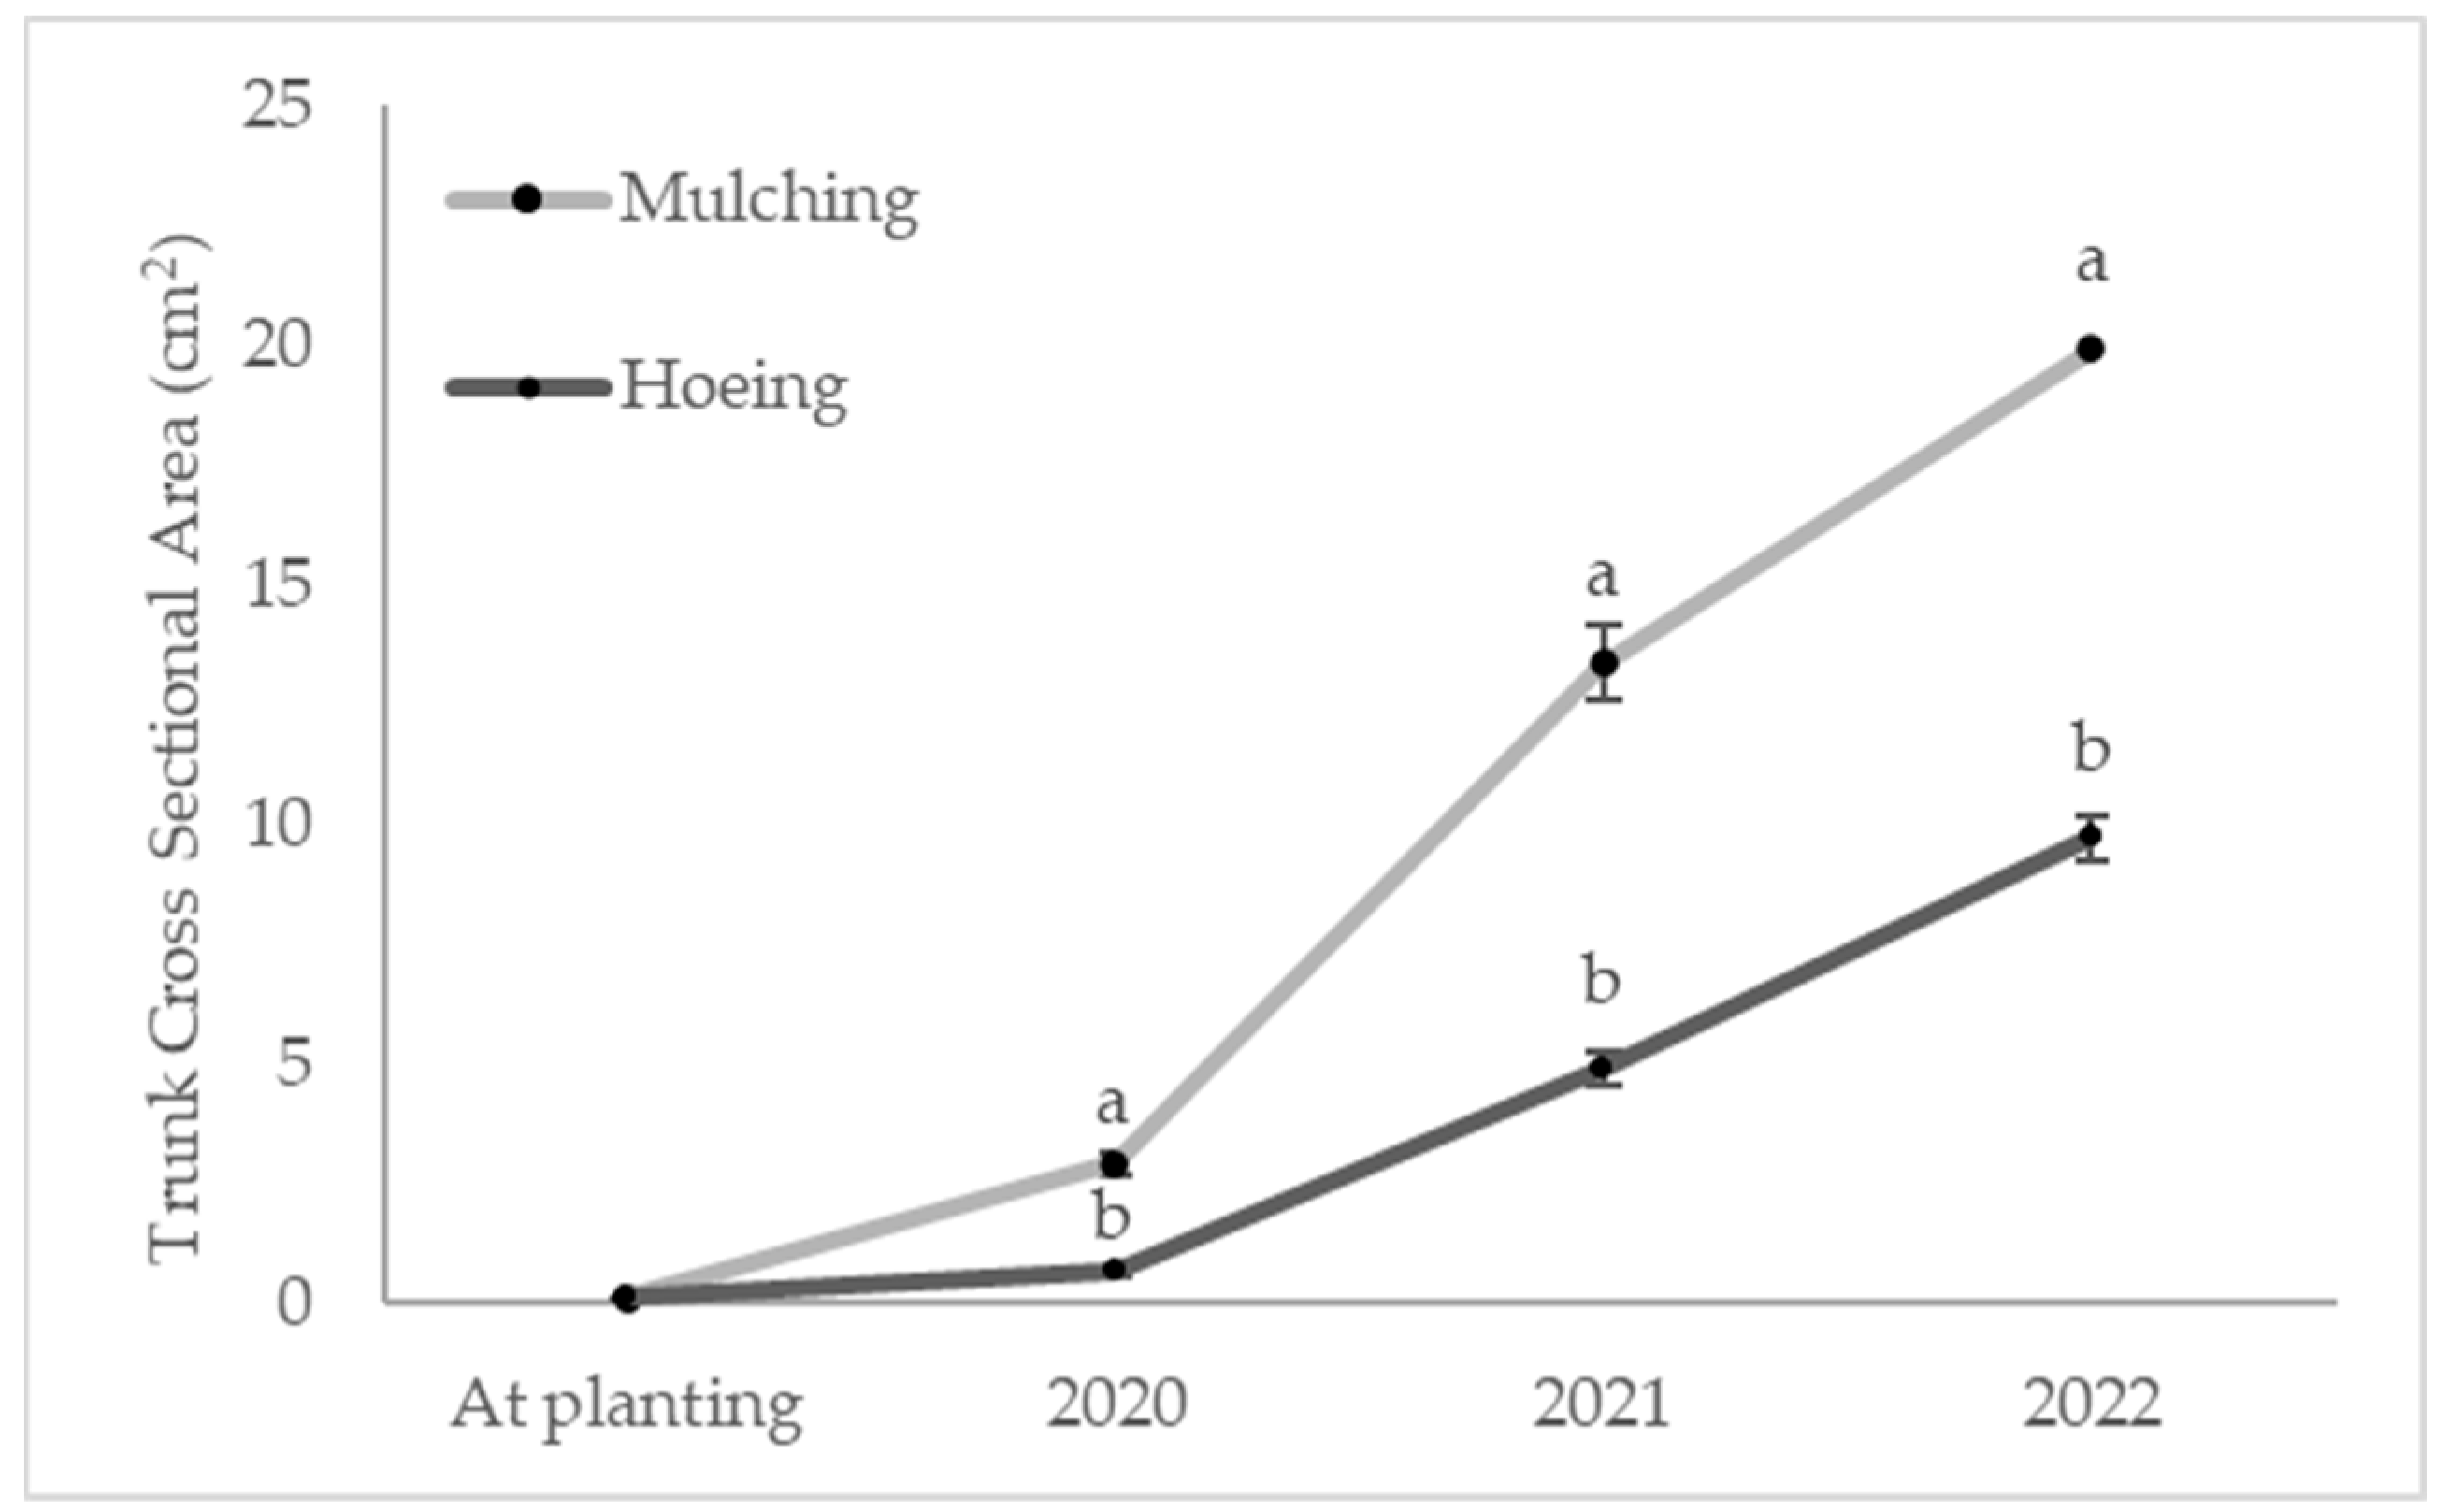
The Trunk Cross Sectional Area (TCSA) increased across the three years of experimentation (Figure 6) at a higher rate for the mulching treatment compared to the hoeing one. At planting, the TCSA of the plantlets was homogeneous without significant differences between the two treatments (0.13 cm2 ± 0.01 and 0.12 cm2 ± 0.01 for the mulching and the hoeing, respectively). One year after planting (2020), mulching promoted a significantly higher TCSA increase compared to the hoeing treatment (+2.80 cm2 ± 0.21 vs. +0.53 cm2 ± 0.04). This difference in the increase in TCSA between the two studied treatments was more pronounced two years after planting.
In December 2021, the TCSA of the olive trees was 13.4 cm2 ± 0.78 for the mulching row and 4.91 cm2 ± 0.32 for the hoed one. During 2022, the TCSA grew in both treatments. In October 2022, the TCSA of the trees along the mulching row was 19.9 cm2 ± 0.95, while it was 9.73 cm2 ± 0.48 for the trees along the row managed with hoeing. The TCSA variation during 2022 was significantly higher (HSD test of Tukey–Kramer, p < 0.05) for the trees subjected to mulching treatment (+6.35 cm2 ± 0.66 for the mulching and +4.82 cm2 ± 0.37 for the hoeing).
The height of the trees subjected to the mulching treatment increased at a higher rate compared to the hoeing one across the three years of experimentation (Table 4). Plantlet heights at planting were homogeneous without significant differences between the two treatments (60.4 cm ± 2.34 for the mulching vs. 60.2 cm ± 1.96 for the hoeing). After one year from planting (October 2020) mulching promoted a significant growth in terms of tree height compared to the hoeing treatment (+70.0 cm ± 2.62 vs. +39.7 cm ± 2.38). Differences in height variation were not statistically relevant for the second growing season (2021) with + 74.1 cm ± 3.55 for the mulching vs. +73.3 cm ± 3.02 for the hoeing). Tree height at the end of the second (October 2021) and the third (October 2022) year after planting was significantly different between the treatments (Table 4), with the mulching significantly higher than the hoeing (239.5 cm ± 3.10 vs. 215.8 cm ± 4.78). During the three years of experimentation, the registered increase in tree height for the mulching was +178.7 cm ± 3.47, significantly higher than the hoeing (+155.0 cm ± 5.20) (Table 6).
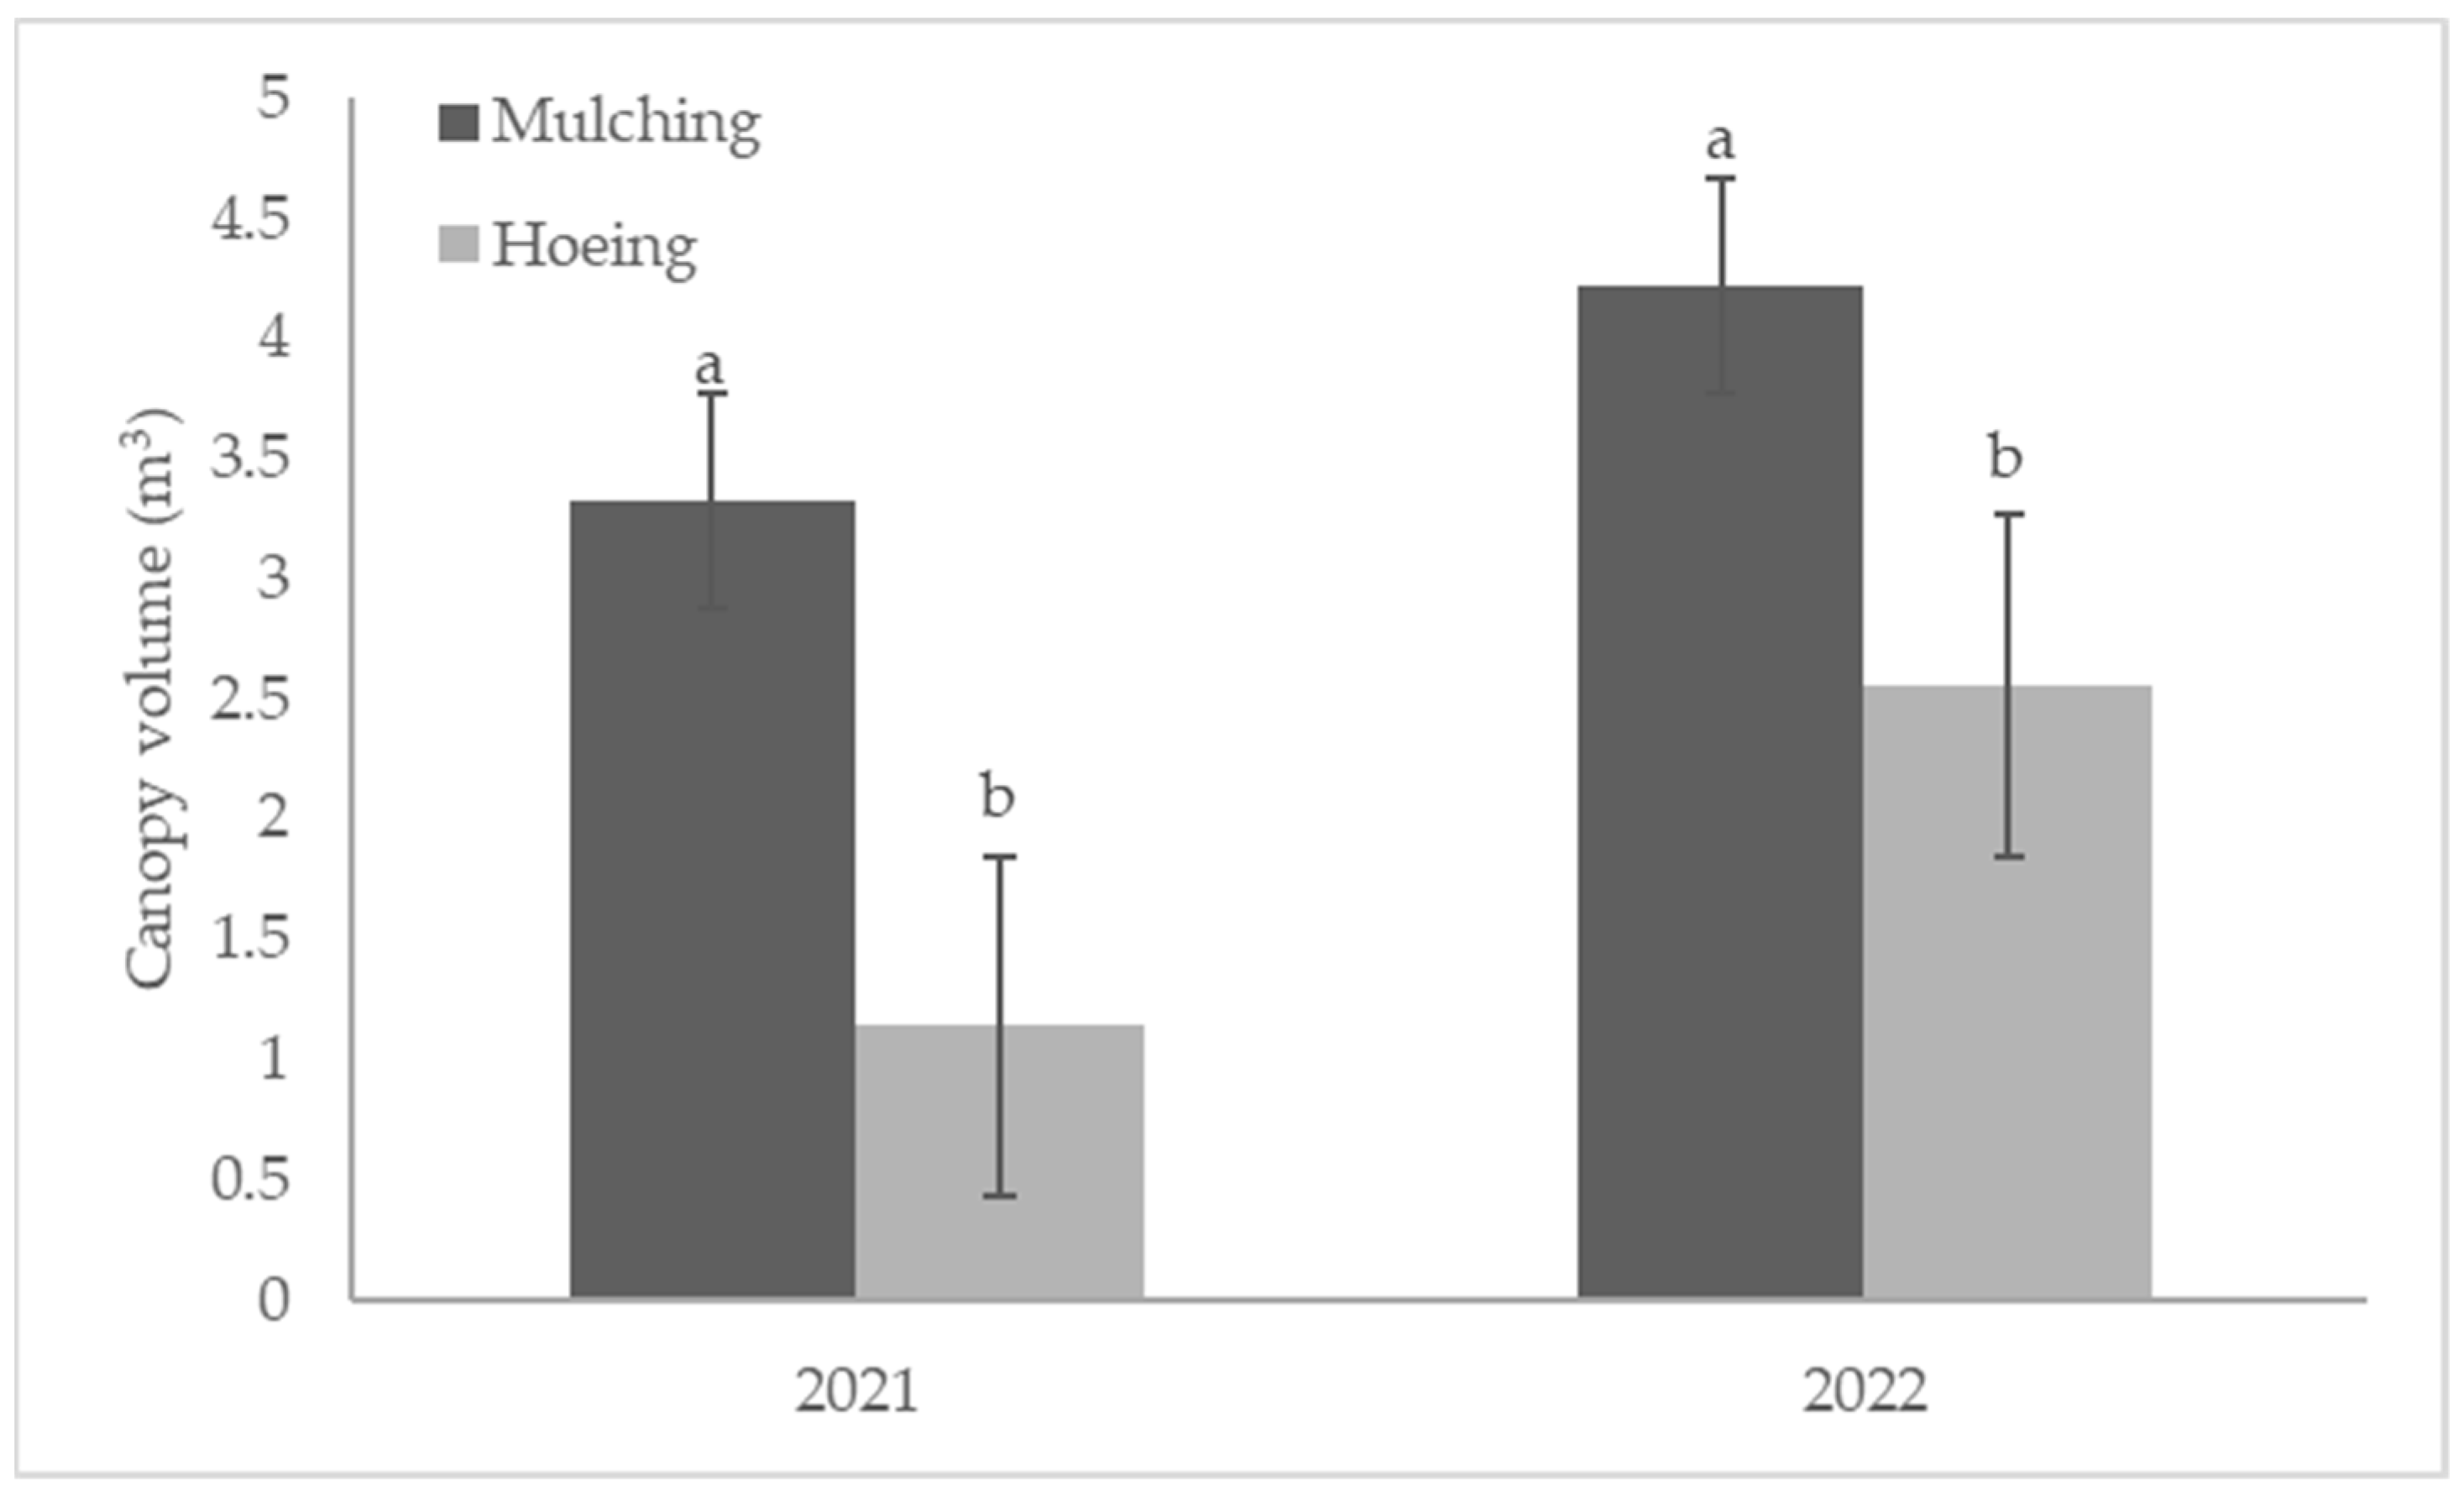
The volume of canopies was significantly higher for the trees managed with the mulching than those managed with hoeing, both at the end of the 2nd and 3rd year after planting. At the end of the third growing season (2022), the calculated tree canopy was 4.22 m3 ± 0.18 for the synthetic mulching and 2.55 m3 ± 0.17 for the hoeing (Figure 7). In both studied treatments, the tree canopy growth ensured the creation of a continuous hedgerow at the end of the 3rd year after planting.
As a consequence of the stronger vegetative growth of the trees subjected to the mulching treatment, a higher fruit yield per tree was collected in the 2nd and 3rd year after planting for the synthetic mulching compared to the hoeing, indicating an effect of the anticipation of the onset of fruit production.
In the 2nd year after planting (2021), the fruit yield of the trees with synthetic mulching was 5.50 times higher than that of the hoeing treatment. In the 3rd year after planting (2022), both the compared treatments registered an increase in fruit yield compared to the previous year. Indeed, the mean fruit production per tree for synthetic mulching was 2.37 times higher than that of hoeing. (Table 7).
The yield efficiency increased for both studied treatments from 2021 to 2022. Significant differences between mulching and hoeing were found only in terms of fruit production over canopy volume in 2022. When the yield efficiency in terms of fruit production over TCSA was used, the highest values were registered in 2022 even though the differences were not statistically significant.
In the specific pedo-climatic conditions of our trial, the trees subjected to mulching showed good results in terms of growth of the aerial portion (TCSA, tree height, and canopy volume) across the three years, compared to hoeing management. Synthetic mulching promoted canopy expansion in both directions, along the row, and across the row (Table 6), achieving the early formation of a continuous hedgerow with the quick closure of the spaces between one tree and another.
Moreover, the applied synthetic mulching promoted a significant early bearing, in the third year after planting the fruit yield was profitable for a mechanized harvest (average 5.84 kg per tree, corresponding to 7.3 t per hectare). The fruit production harvested from the trees subjected to hoeing was significantly lower than those subjected to synthetic mulching (average 2.46 kg per tree, corresponding to 3.0 t per hectare, Table 7). These results are in line with another work in which hoeing management was associated with reduced tree growth and low fruit yield [27].

3.4. Root Development

No significant differences were observed between different sampling dates in each treatment, nor between the two considered treatments in each sampling date. The Root Length Density (RLD) of olive trees under synthetic mulching increased from November 2020 to October 2022. RLD along the row managed with hoeing slightly increased from November 2020 to December 2021, and decreased in October 2022. These differences were not statistically relevant for p < 0.05.
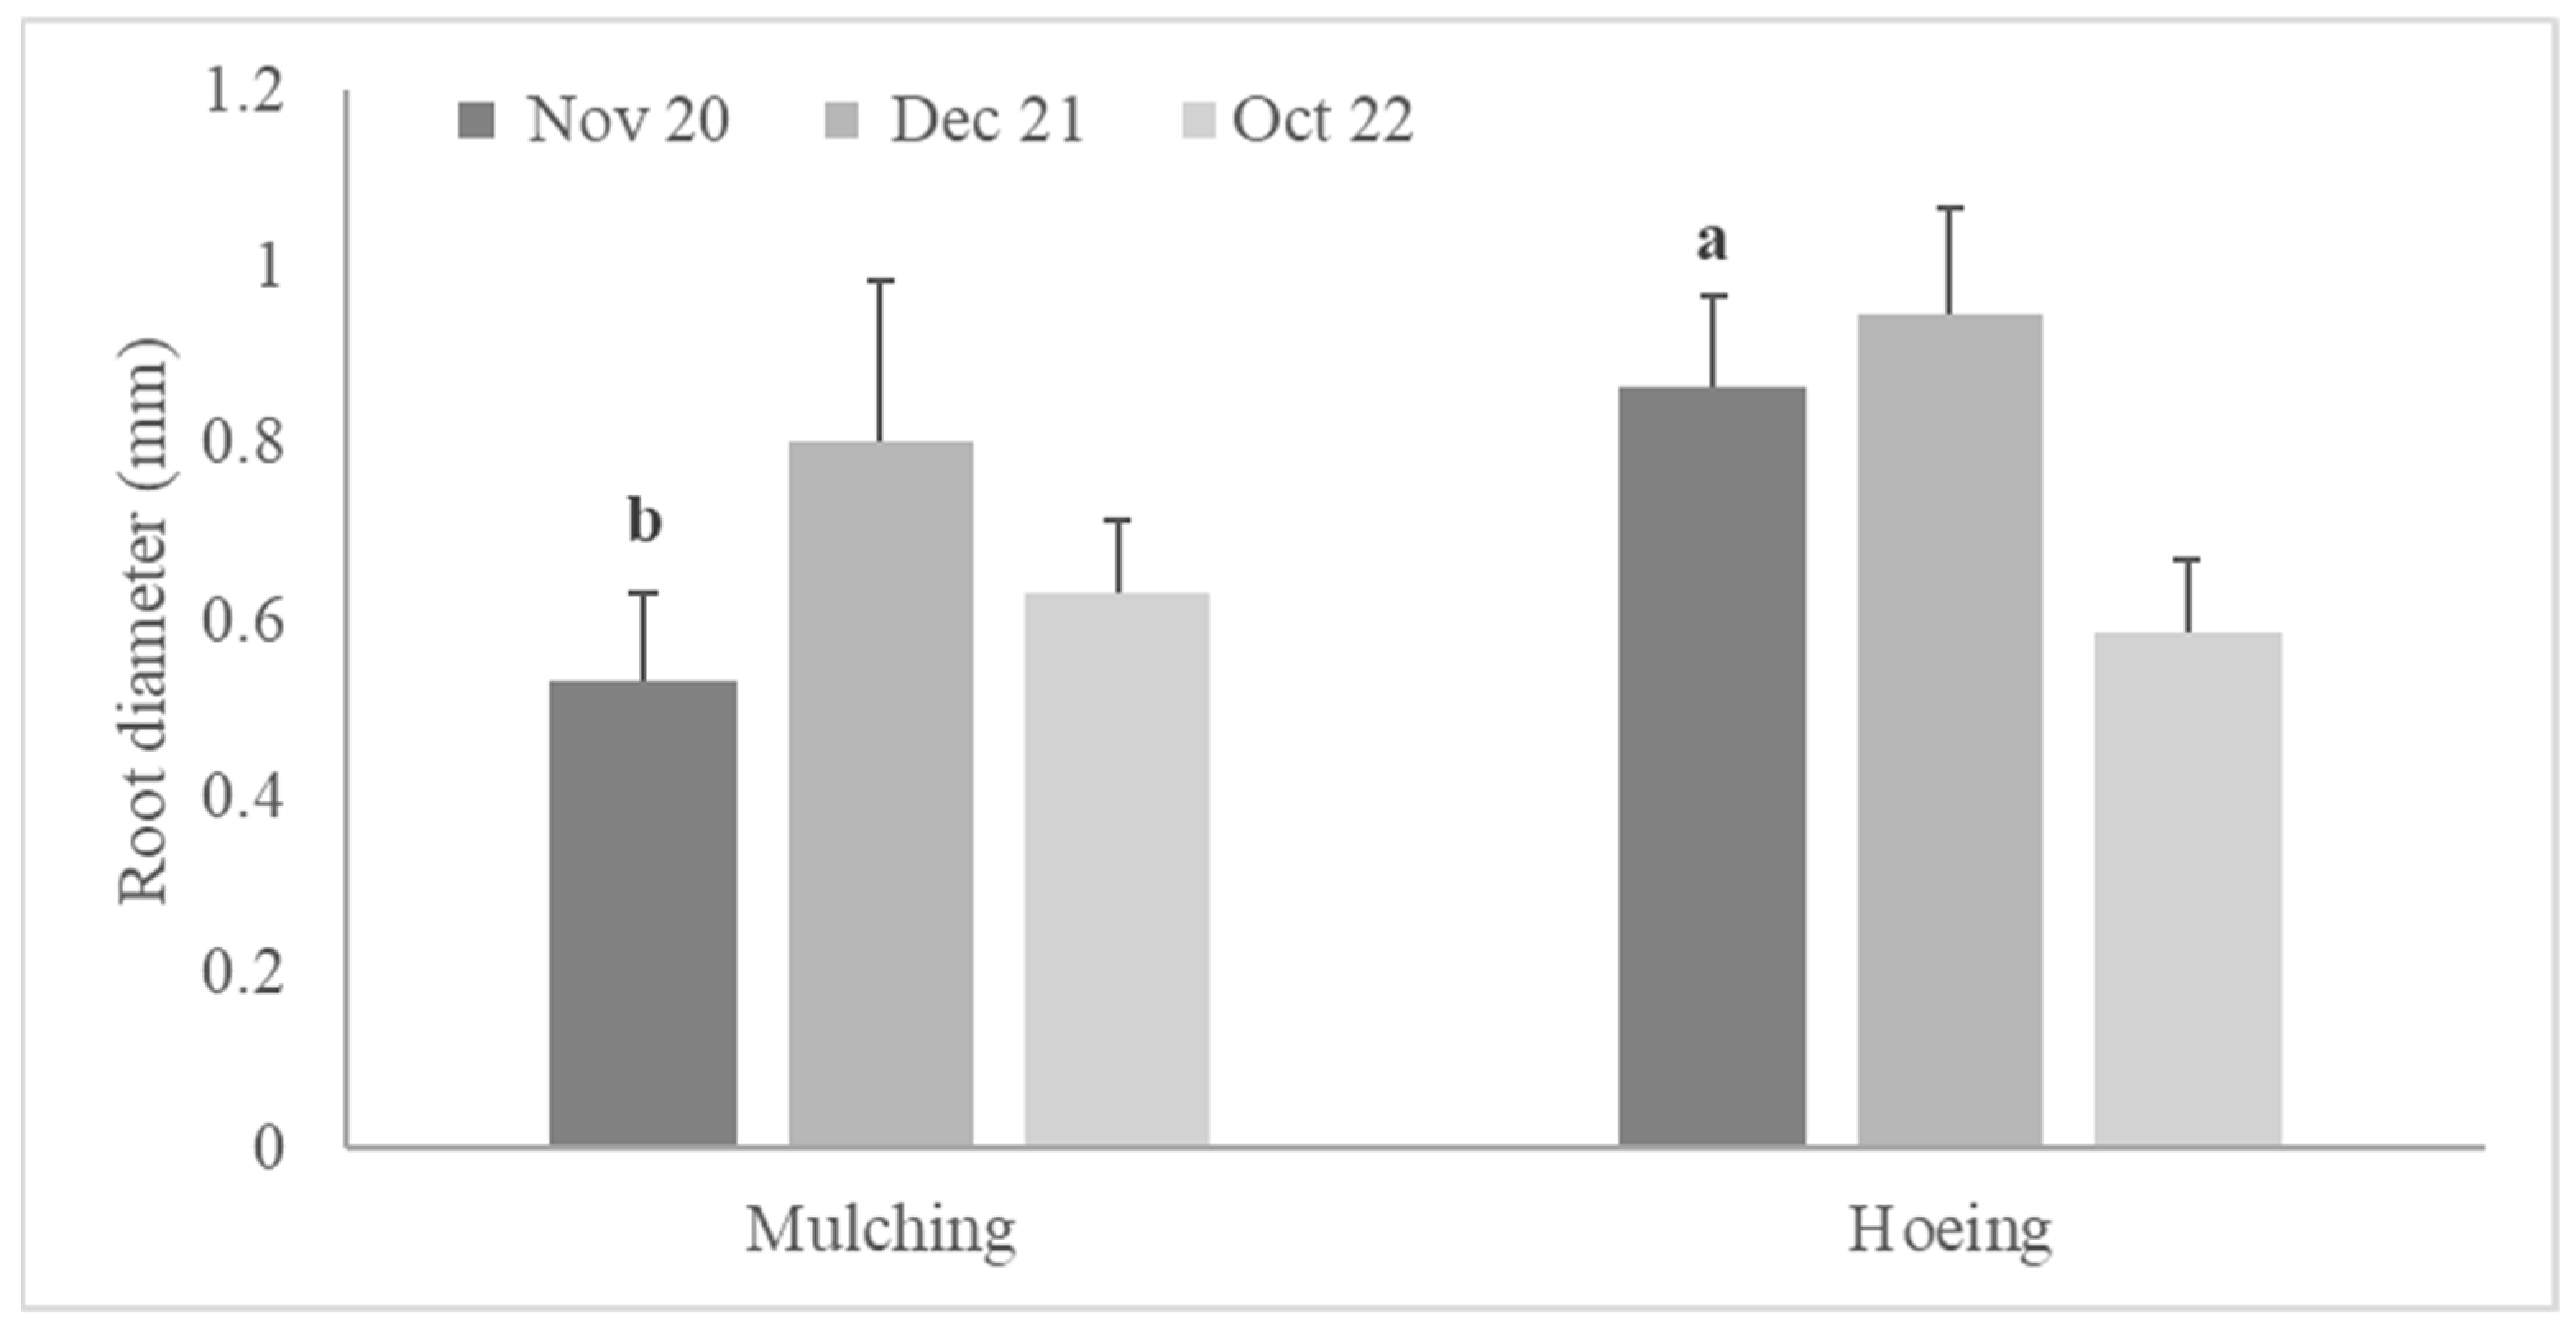
In both treatments, root diameter was slightly higher on the December 2021 sampling date than on the other ones. Comparing the two treatments, values were slightly higher for hoeing than for mulching (statistically significant on the November 2020 sampling date), except for October 2022 sampling, when differences between the studied treatments were negligible (0.586 mm ± 0.13 for hoeing vs. 0.630 mm ± 0.082 for synthetic mulching) (Figure 8).
Root development is related to aerial portion development [27], and it is also influenced by the soil management techniques. Usually, periodical mechanical weeding damages the terminal root tips developing in the shallow layer of the soil. Our results suggest that the RLD of the trees subjected to periodical hoeing along the row was higher than that subjected to mulching on the November 2020 and December 2021 sampling dates. During the October 2022 sampling, RLD along the mechanically weeded row decreased, and the reason may be due to the passage of the rotary tiller that took place a few days before the sampling date of October 2022. Even though mechanical weeding favors root branching and renovation by the cut of the leading tips, and the emission of lateral tips, plants are subjected to the constant restoration of the damaged root system (RLD decreased immediately after the passage of the hoe) in the shallow soil layers, using the carbohydrates produced by photosynthesis otherwise allocated for the vegetative growth of the aerial portion and the fruit development. On the contrary, synthetic mulching seems to work in the direction of reducing the branching activity of the root system by preserving its integrity and allocating resources toward the vegetative growth of the canopy.
Root diameter was negatively related to RLD. Root diameter was higher under the synthetic mulching than along the row managed by hoeing (the difference was significant in November 2020, Figure 8). Results suggest that root development in the shallowest layer of soil (0–15 cm) reaches fluctuations according to different seasons of growth of the trees during the year, as Palese et al., 2000, and Masmoudi-Charfi et al., 2013, also observed in their studies [47,48]. The closer winter and the cold season are, the greater the investment of trees in secondary root growth with an increase in root diameter [49]. The approaching of vegetative rest in December 2021 and the presence of fruits as a sink on the October 2022 sampling date probably slowed down root exploration. The roots reduced the emission of new tips and their elongation, investing the resources to consolidate the structure of the existing roots through secondary growth [49,50] (Figure 8).
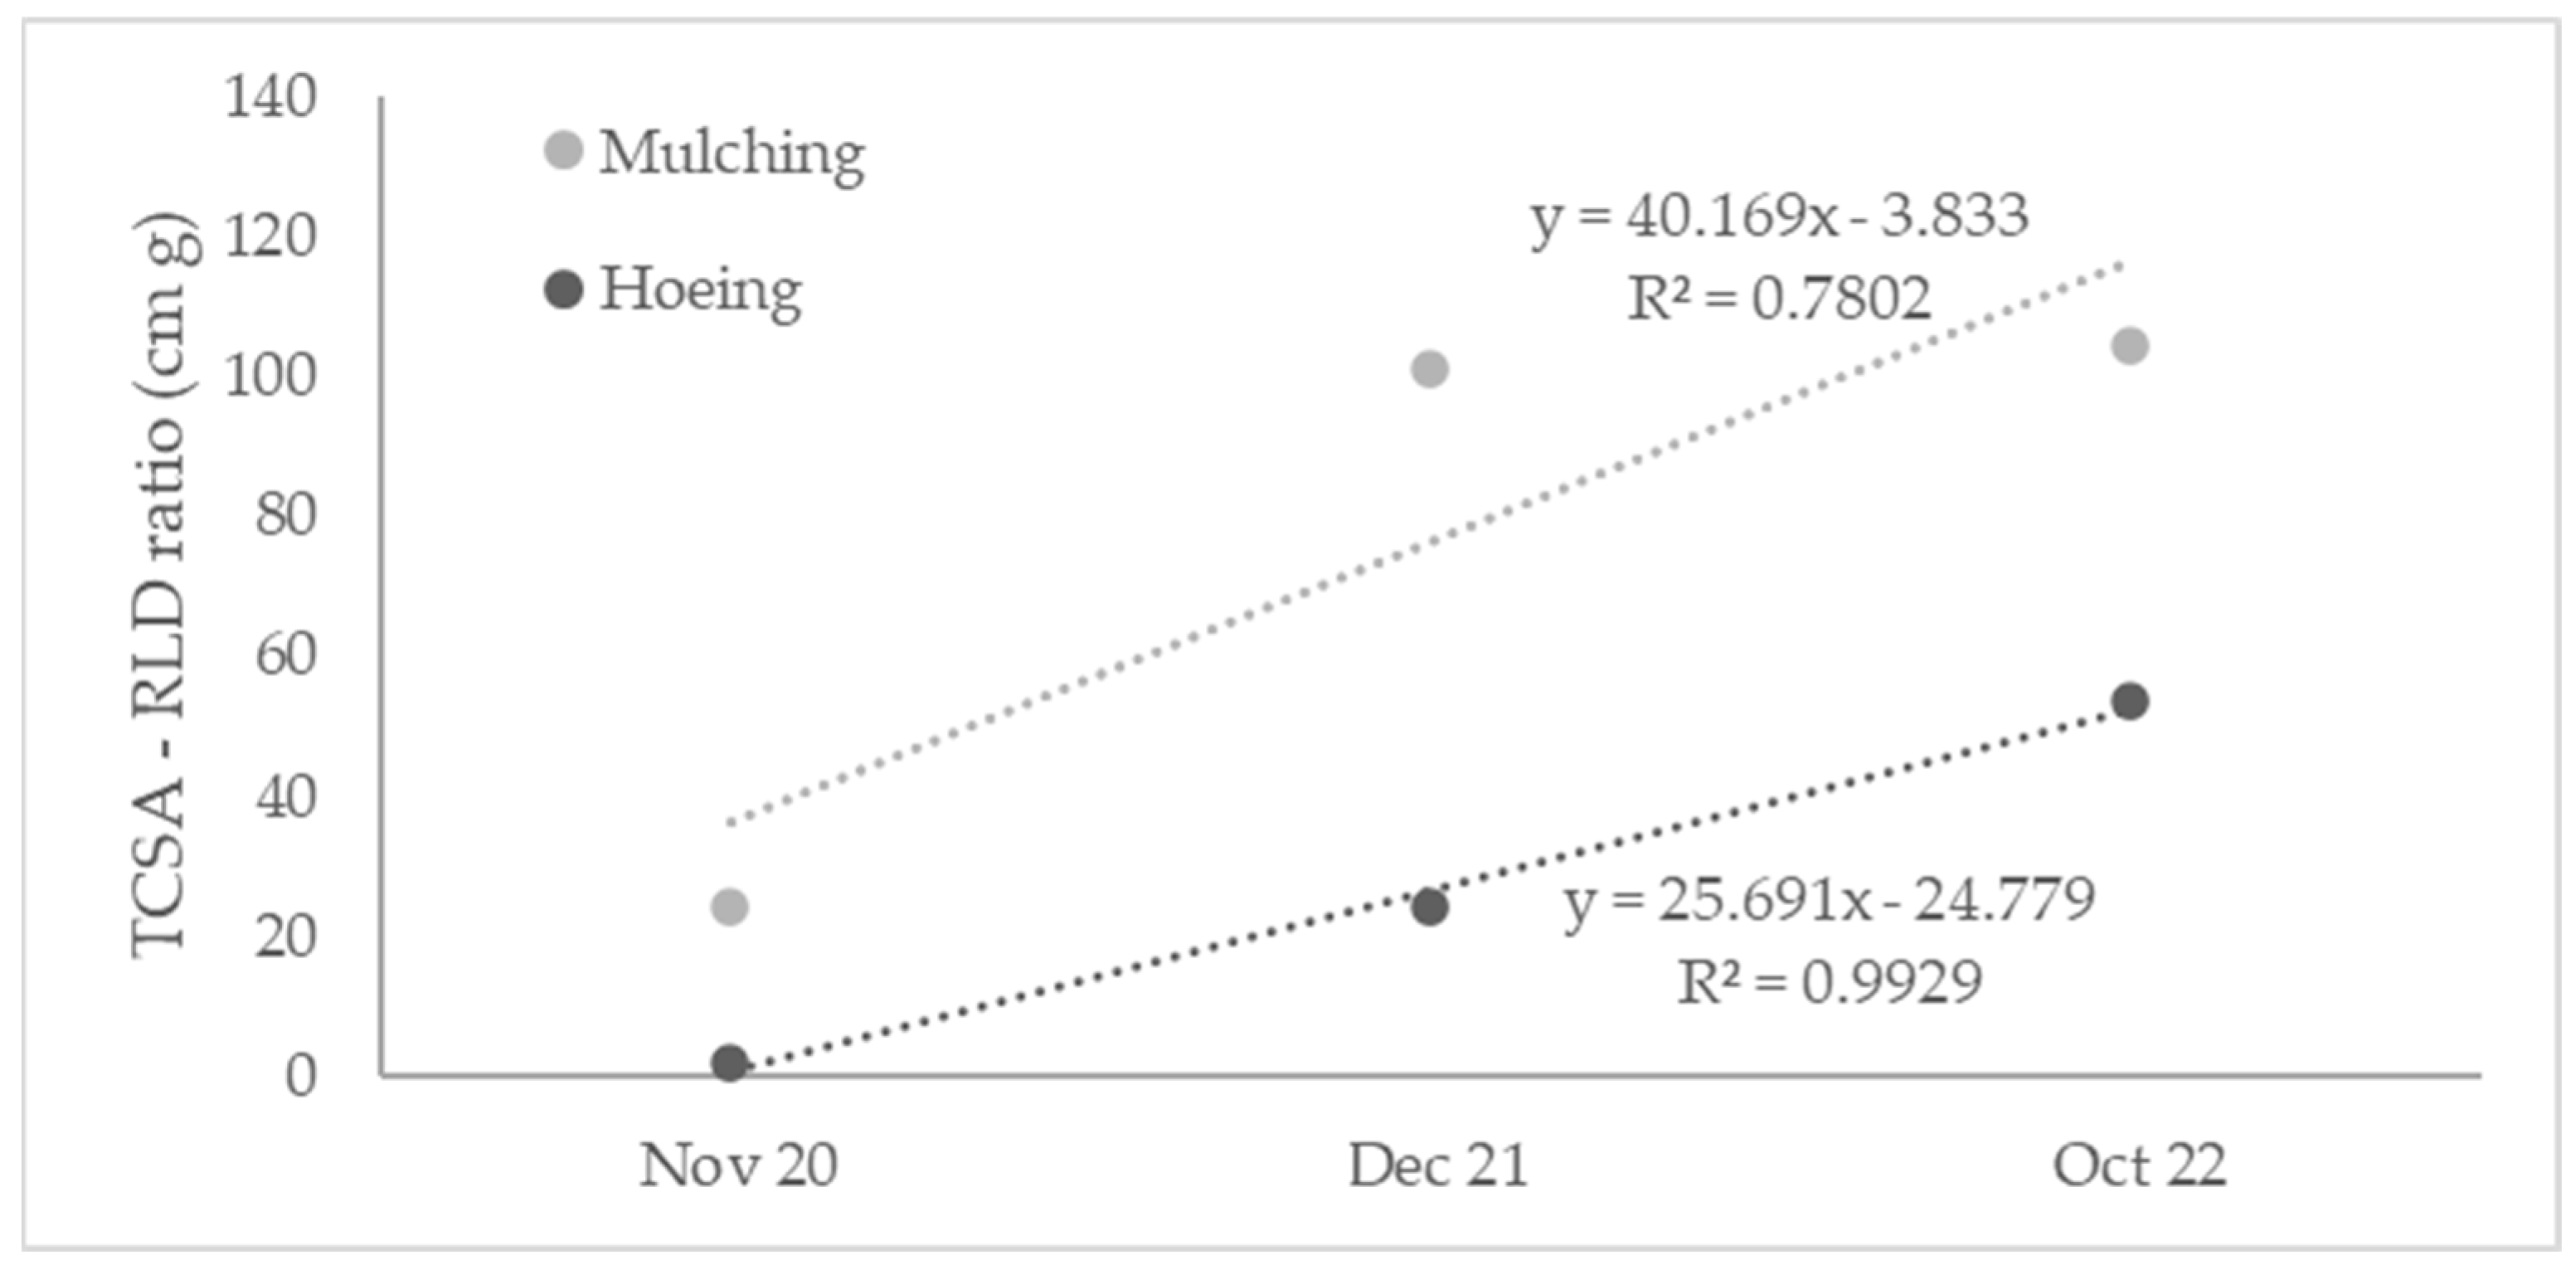
The trend line of the ratio between TCSA (cm2) and RLD (cm of roots g−1 of soil), as an index of vegetative growth above the root growth, showed an increase for both considered treatments from the November 2020 to October 2022 sampling dates. In particular, the TCSA/RLD ratio of synthetic mulching increased faster than that of hoeing, resulting in a steeper slope (40.2 and 25.7 for synthetic mulching and hoeing, respectively, Figure 9).

3.5. Environmental and Economic Assessment: The Eco-Efficiency Ratio

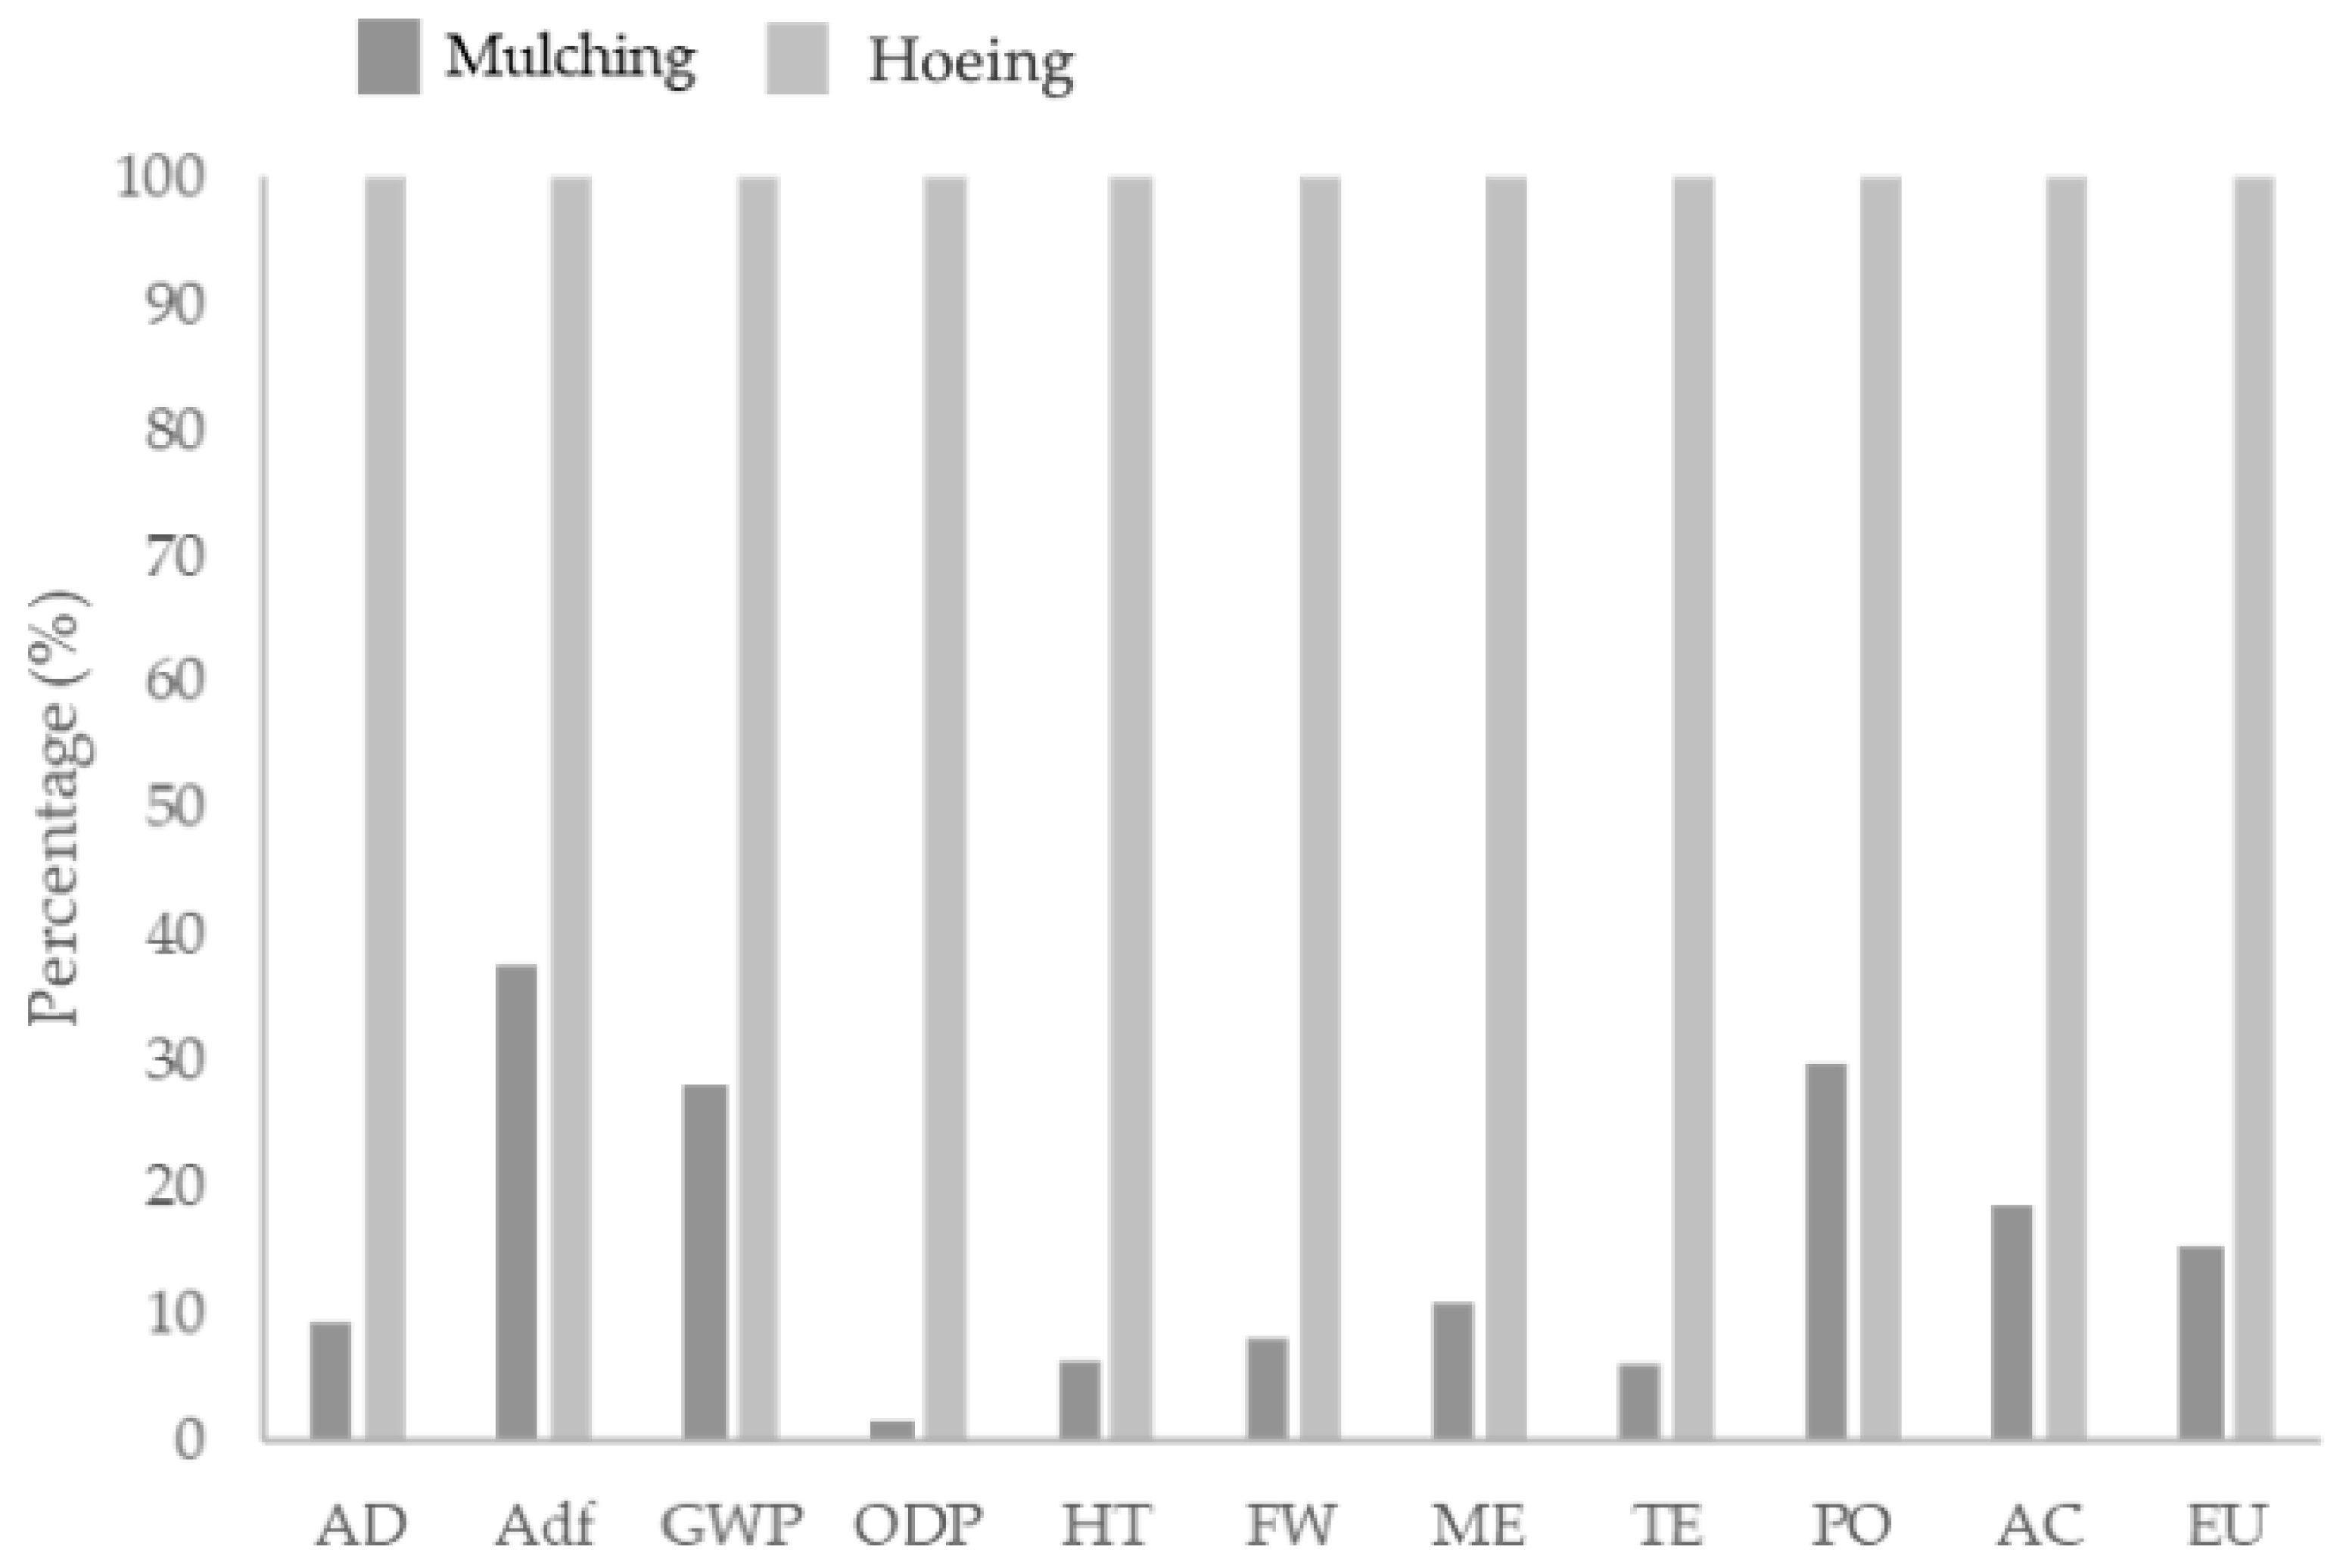
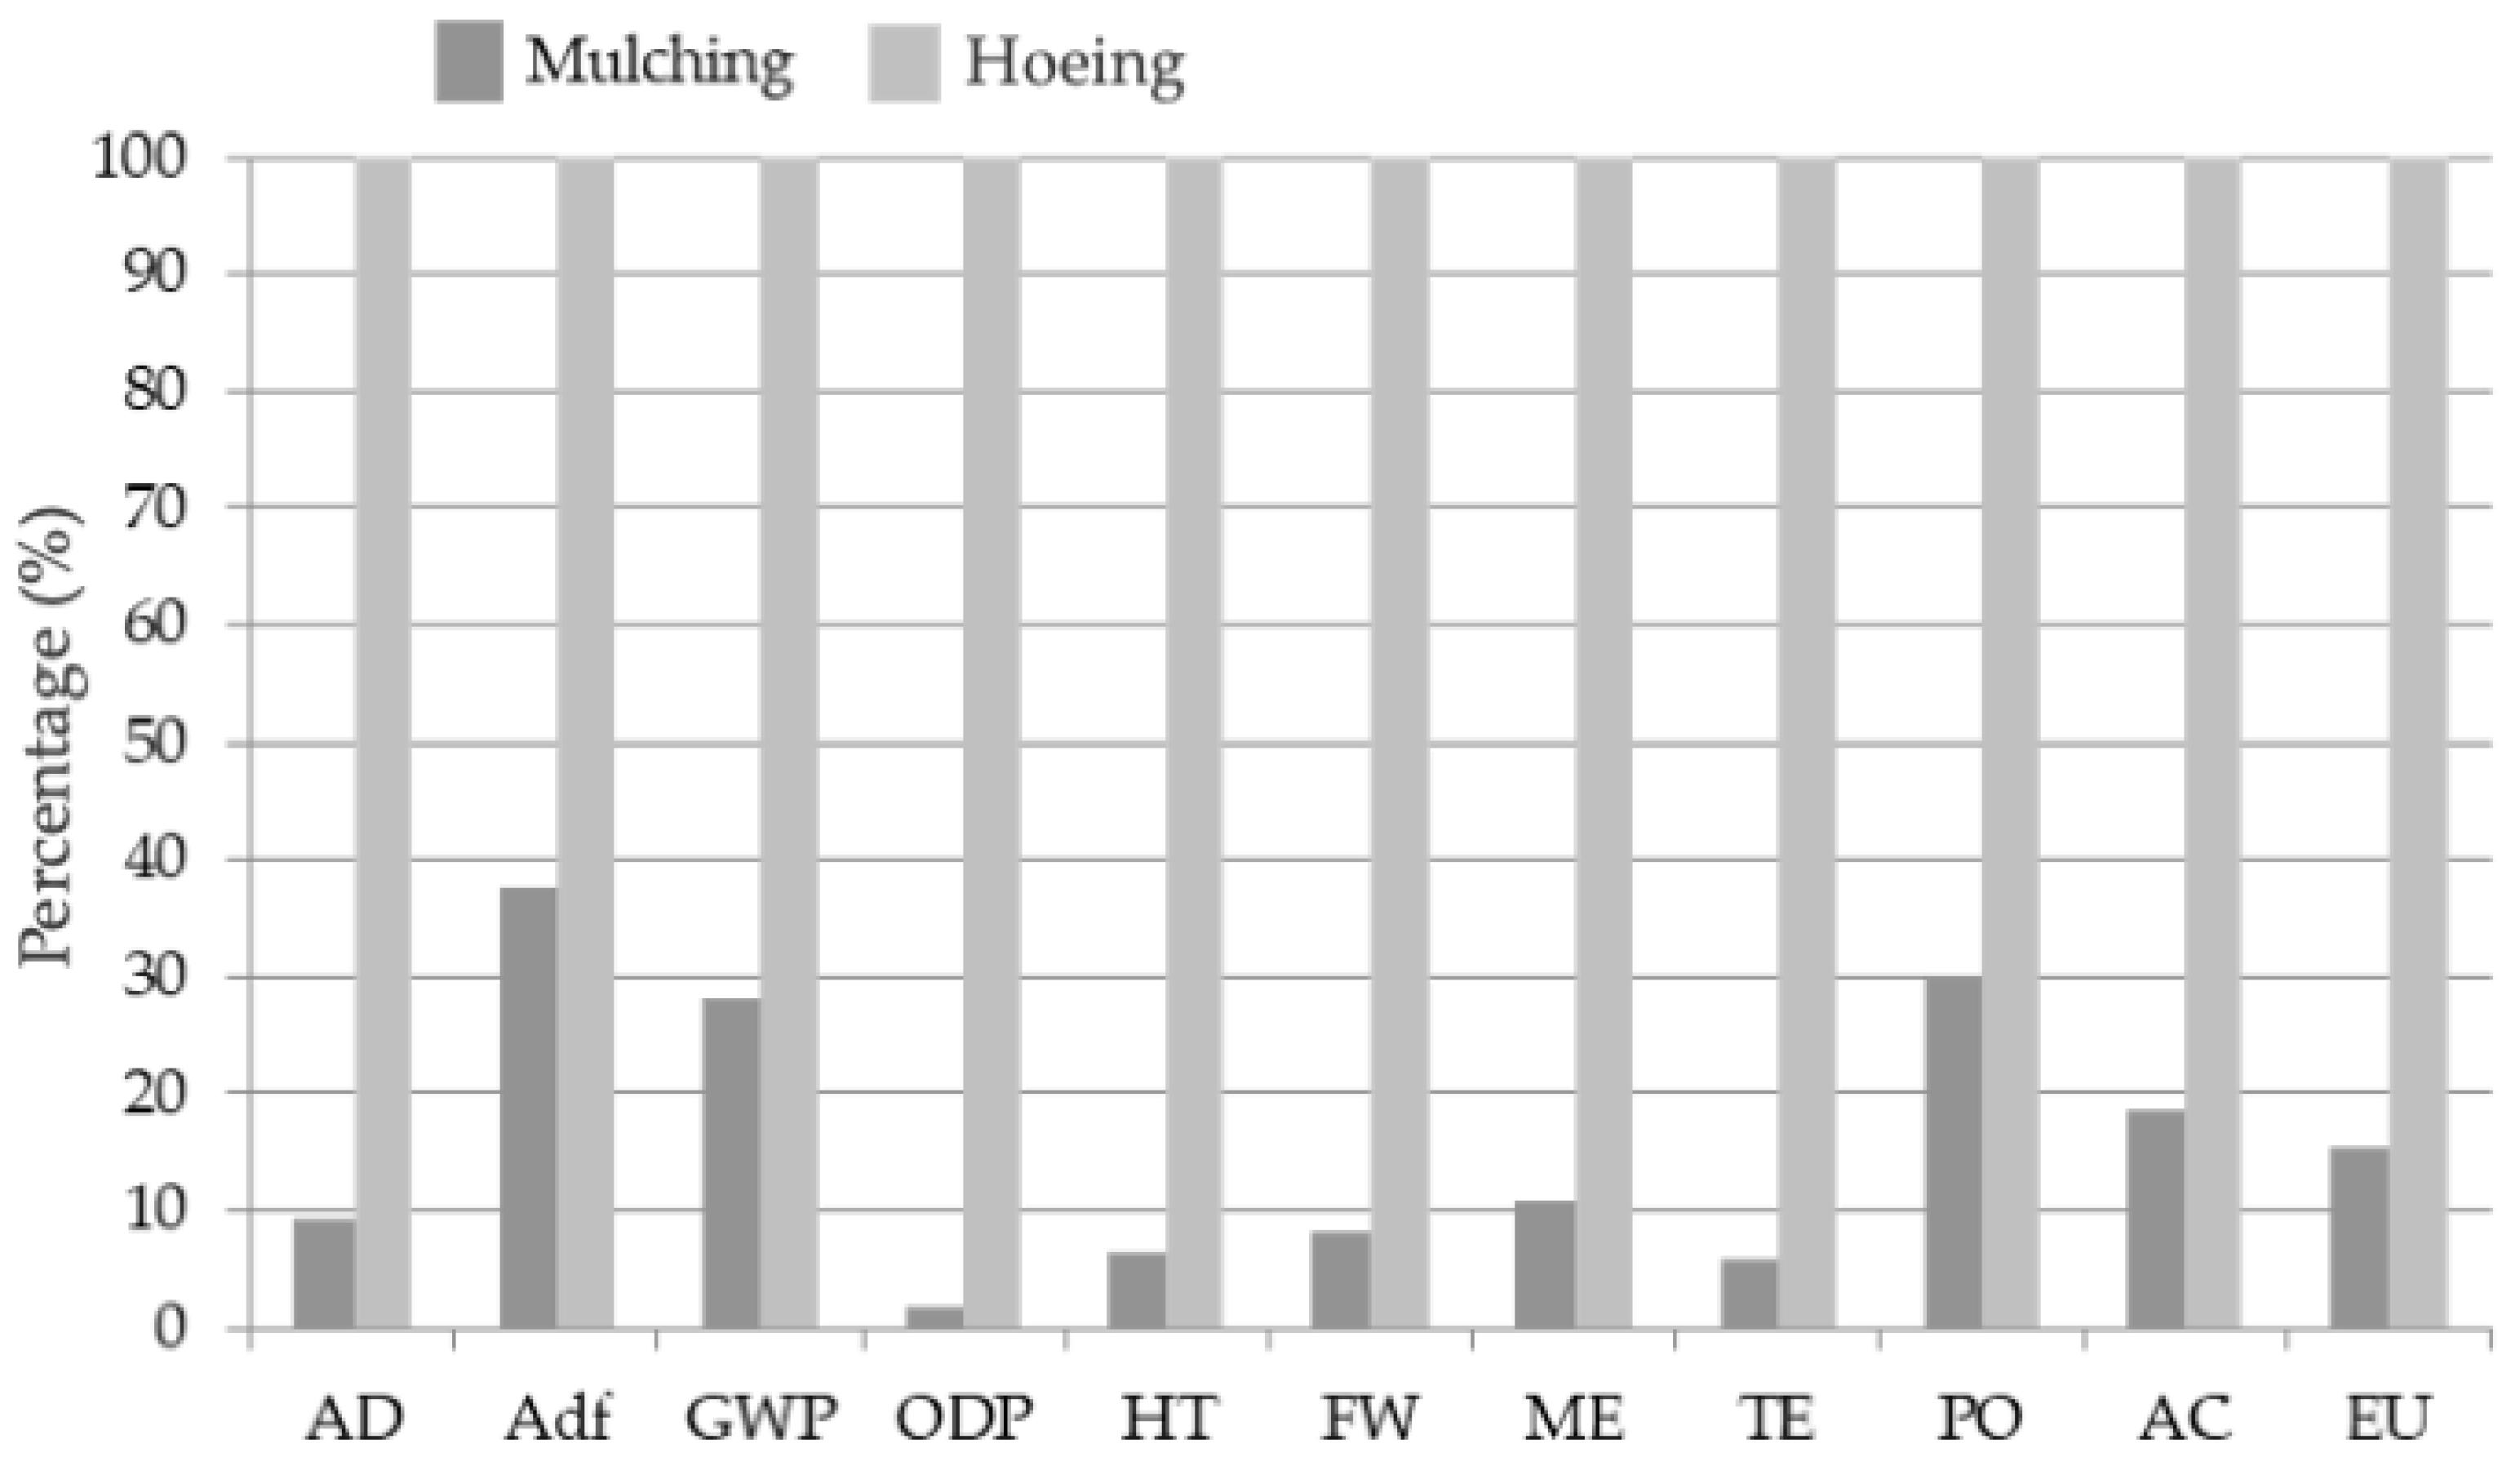
This environmental analysis allowed us to identify the processes that have the highest level of burden on the environment. The analysis showed that hoeing is the scenario with the highest impact on all environmental impact categories (Figure 10). As reported in previous studies on the environmental impacts of crops [31,51], these results can be due to different nutrient destinations in the applied management systems, even though this aspect was not considered in the present trial. Moreover, according to Houle and Babeux, 1994 [52], plastic mulch increased the death rate of transplanted plants, but in our case, instead, no differences were recorded between synthetic mulching and hoeing regarding this rate.
Moreover, results did not change when we carried out a sensitivity analysis changing functional units (FU = 1 hectare vs. FU = 1 Mg of product, Figure 11) because mulch is usually used in agriculture to increase yield and to improve a variety of soil properties [53], and in our case, the best scenario from an environmental point of view (i.e., mulching with synthetic cloth) shows a higher yield (5.84 and 2.46 kg per tree in the synthetic mulching and in the hoeing, respectively, corresponding to 7.3 and 3.1 tons per hectare, respectively). These results are in line with the study of Nemecek et al. [54] where productivity is defined as a crucial factor in an environmental assessment since the environmental impact, in relative terms, decreases with increasing yields.
It is widely recognized that mulching practice shows benefits for the environment [55]. In fact, this practice could potentially minimize water runoff, improve the infiltration capacity of the soil, restrain weed population via shading, and act as an obstacle to evapotranspiration [55,56]. In addition, mulching practice can decrease pesticide use and any application of fungicides and insecticides [55]. It is important to underline that a herbicide phase is not included in the study. On the other hand, mulching has some other helpful environmental effects such as the temperature regulation of soil and plant roots, minimum nutrient losses, cut down soil erosion and compactness, and improved physical conditions of soil [55,57,58]. Moreover, mulching practice could improve the aesthetic value of landscapes and the economic value of crops [55].
It is important to underline that the higher the ratio value, the higher the economic performance per unit of GHG emitted. The economic findings confirm previous results about the environmental impact of each field management system. In fact, the findings showed that mulching with synthetic mulch had a better ratio between economic performance and GHG emitted into the atmosphere (EUR 2.73 per kg CO2eq), while the hoeing practice showed the worst ratio between economic and environmental performances (EUR 1.32 per kg CO2-eq). The same results are reached with sensitivity analysis. In fact, synthetic mulching showed a better eco-efficiency ratio than the rotary tiller (EUR 106.05 per kg CO2-eq vs. EUR 42.36 per kg CO2-eq). These results were due to different field management (Table 2) and different yields.
In Table 8, the economic performance per unit of environmental impact is reported according to the ratio between gross margin and GWP emissions.

4. Conclusions

In the specific pedo-climatic conditions of our experimentation, our results indicated that the weed control effect along the row of a young high-density olive orchard was higher with the synthetic mulching presence and that the residual effect of the two treatments differently influenced weed community dynamics. In particular, the soil along the row covered with the synthetic mulching resulted in a significant reduction in both weed seedling emergence and growth, even after mulch removal; at the same time, the mulch acted as a filter for perennial weed selection, suggesting that the in-row space should be managed by designing a series of complementary soil management practices over time instead of repeating the practice to minimize selective weed pressure.
Moreover, the use of synthetic mulching along the row positively forced the vegetative growth of the young olive trees, increasing the TCSA, the height, and the canopy volume of the trees (and thus the shoot-to-root ratio) and anticipated the onset of fruit production compared to periodical hoeing: significantly higher fruit production was registered after three years after planting. It is not clear how the synthetic mulching was affected in order to induce higher tree growth and early fruit production after planting. We can hypothesize that it was the overcoming of a limiting factor in the early stages after planting or a thermic effect on the soil, thus anticipating the vegetative growth in spring and delaying it in autumn. No indications were available about the microbic biodiversity and activity under the different in-row soil management treatments, and further studies about this component would be very interesting.
The effect of synthetic mulching seemed to disappear when removed from the ground (spring 2023) since no significant differences were found for tree size and yield in the two tested in-row soil management systems at the end of 2023.
According to the life cycle assessment, the application of synthetic mulching had a higher economic efficiency and less environmental impact than periodical soil hoeing. It would have been interesting to check if a different carbon accumulation had occurred in the soil under the two tested management systems, thus affecting the carbon footprint, but the shortness of the experimental trial did not allow robust results for this analysis.
The synthetic mulching applied to the specific soil characteristics and climatic conditions of our experimental site allowed performing results in terms of weed control, tree growth, and onset of fruit production to be found, indicating that to obtain these results on young olive trees, the mulch along the row must resist degradation for at least three years after planting.
As a consequence of our findings, the use of organic mulching films with a duration of at least three years represents an interesting solution for tree crop systems in order to have a positive effect on weed control and tree vegetative growth during the early stages after planting, and to avoid the cost of mulch removal from the soil and consequent disposal, and moreover, to prevent dispersion of plastic particles into the environment. Further research activities are ongoing in this direction.

Author Contributions

Conceptualization, E.M.L. and A.A.; methodology, E.M.L., A.A., V.G., M.Z., D.N. and N.P.; validation, E.M.L., A.A. and N.P.; formal analysis, A.d.I., P.G.L., A.A., N.P., C.C. and E.M.L.; investigation, E.M.L., A.d.I., P.G.L., M.Z., V.G., S.C., K.M., A.A., N.P. and C.C.; data curation, E.M.L., A.d.I., P.G.L., M.Z., V.G., S.C., K.M., A.A. and N.P.; writing—original draft preparation, A.d.I., P.G.L., E.M.L. and N.P.; writing—reviewing and editing, E.M.L., A.d.I., P.G.L., M.Z., V.G., S.C., K.M., A.A., N.P., C.C. and D.N.; supervision, E.M.L. and A.A.; project administration, E.M.L.; funding acquisition, E.M.L. All authors have read and agreed to the published version of the manuscript.

Funding

This study was carried out within the MOLTI project (Decree n. 13938, 24 April 2018) funded by the Italian Ministry of Agriculture (MiPAAF).

Data Availability Statement

Data are contained within the article.

Acknowledgments

Thanks to Nolasco A., Vona S., and Pacella M. for contributing to the collection of part of the data presented in this work.

Conflicts of Interest

The authors declare no conflicts of interest.

References

  1. Camposeo, S.; Ferrara, G.; Palasciano, M.; Godini, A. Varietal Behaviour According to The Superintensive Oliveculture Training System. Acta Hortic. 2008, 791, 271–274. [Google Scholar] [CrossRef]
  2. Marino, G.; Macaluso, L.; Marra, F.P.; Ferguson, L.; Marchese, A.; Campisi, G.; Volo, P.; Laudicina, V.A.; Caruso, T. Horticultural Performance of 23 Sicilian Olive Genotypes in Hedgerow Systems: Vegetative Growth, Productive Potential and Oil Quality. Sci. Hortic. 2017, 217, 217–225. [Google Scholar] [CrossRef]
  3. Lodolini, E.M.; de Iudicibus, A.; Lucchese, P.G.; Las Casas, G.; Torrisi, B.; Nicolosi, E.; Giuffrida, A.; Ferlito, F. Comparison of Canopy Architecture of Five Olive Cultivars in a High-Density Planting System in Sicily. Agriculture 2023, 13, 1612. [Google Scholar] [CrossRef]
  4. León, L.; de la Rosa, R.; Barranco, D.; Rallo, L. Breeding for Early Bearing in Olive. HortScience 2007, 42, 499–502. [Google Scholar] [CrossRef]
  5. Russo, G.; Vivaldi, G.A.; De Gennaro, B.; Camposeo, S. Environmental Sustainability of Different Soil Management Techniques in a High-Density Olive Orchard. J. Clean. Prod. 2015, 107, 498–508. [Google Scholar] [CrossRef]
  6. Vignozzi, N.; Agnelli, A.E.; Brandi, G.; Gagnarli, E.; Goggioli, D.; Lagomarsino, A.; Pellegrini, S.; Simoncini, S.; Simoni, S.; Valboa, G.; et al. Soil Ecosystem Functions in a High-Density Olive Orchard Managed by Different Soil Conservation Practices. Appl. Soil. Ecol. 2019, 134, 64–76. [Google Scholar] [CrossRef]
  7. Bombino, G.; Denisi, P.; Gómez, J.A.; Zema, D.A. Mulching as Best Management Practice to Reduce Surface Runoff and Erosion in Steep Clayey Olive Groves. Int. Soil Water Conserv. Res. 2021, 9, 26–36. [Google Scholar] [CrossRef]
  8. Prosdocimi, M.; Tarolli, P.; Cerdà, A. Mulching Practices for Reducing Soil Water Erosion: A Review. Earth Sci. Rev. 2016, 161, 191–203. [Google Scholar] [CrossRef]
  9. Las Casas, G.; Ciaccia, C.; Iovino, V.; Ferlito, F.; Torrisi, B.; Lodolini, E.M.; Giuffrida, A.; Catania, R.; Nicolosi, E.; Bella, S. Effects of Different Inter-Row Soil Management and Intra-Row Living Mulch on Spontaneous Flora, Beneficial Insects, and Growth of Young Olive Trees in Southern Italy. Plants 2022, 11, 545. [Google Scholar] [CrossRef]
  10. Metzidakis, I.; Martinez-Vilela, A.; Castro Nieto, G.; Basso, B. Intensive Olive Orchards on Sloping Land: Good Water and Pest Management Are Essential. J. Environ. Manag. 2008, 89, 120–128. [Google Scholar] [CrossRef]
  11. Simoni, S.; Caruso, G.; Vignozzi, N.; Gucci, R.; Valboa, G.; Pellegrini, S.; Palai, G.; Goggioli, D.; Gagnarli, E. Effect of Long-Term Soil Management Practices on Tree Growth, Yield and Soil Biodiversity in a High-Density Olive Agro-Ecosystem. Agronomy 2021, 11, 1036. [Google Scholar] [CrossRef]
  12. Lodolini, E.M.; Ciaccia, C. Inter-Row Weed Management in a Young High-Density Olive Orchard. Acta Hortic. 2022, 1354, 41–48. [Google Scholar] [CrossRef]
  13. Assirelli, A.; Ciaccia, C.; Giorgi, V.; Zucchini, M.; Neri, D.; Lodolini, E.M. An Alternative Tool for Intra-Row Weed Control in a High-Density Olive Orchard. Agronomy 2022, 12, 605. [Google Scholar] [CrossRef]
  14. Hammermeister, A.M. Organic Weed Management in Perennial Fruits. Sci. Hortic. 2016, 208, 28–42. [Google Scholar] [CrossRef]
  15. Márquez-García, F.; González-Sánchez, E.J.; Castro-García, S.; Ordóñez-Fernández, R. Improvement of Soil Carbon Sink by Cover Crops in Olive Orchards under Semiarid Conditions. Influ. Type Soil Weed. Span. J. Agric. Res. 2013, 11, 335. [Google Scholar] [CrossRef]
  16. Granatstein, D.; Kupferman, E. Sustainable horticulture in fruit production. Acta Hortic. 2008, 767, 295–308. [Google Scholar] [CrossRef]
  17. Neri, D.; Zucchini, M.; Giorgi, V. Weed Management in Organic Orchards with Strawberry Species as Living Mulch. Acta Hortic. 2022, 1354, 49–56. [Google Scholar] [CrossRef]
  18. Sportelli, M.; Frasconi, C.; Gagliardi, L.; Fontanelli, M.; Raffaelli, M.; Sbrana, M.; Antichi, D.; Peruzzi, A. Testing of Roller-Crimper-and-Undercutting-Blade-Equipped Prototype for Plants Termination. AgriEngineering 2023, 5, 182–192. [Google Scholar] [CrossRef]
  19. Måge, F. Black Plastic Mulching, Compared to Other Orchard Soil Management Methods. Sci. Hortic. 1982, 16, 131–136. [Google Scholar] [CrossRef]
  20. Schonbeck, M. Synthetic Mulching Materials for Weed Management. Virginia Association for Biological Farming. (Elektronski Vir). 2012. Available online: https://eorganic.org/node/4872 (accessed on 8 August 2024).
  21. Kasirajan, S.; Ngouajio, M. Polyethylene and Biodegradable Mulches for Agricultural Applications: A Review. Agron. Sustain. Dev. 2012, 32, 501–529. [Google Scholar] [CrossRef]
  22. Tarara, J.M. Microclimate Modification with Plastic Mulch. HortScience 2000, 35, 169–180. [Google Scholar] [CrossRef]
  23. Torrisi, B.; Allegra, M.; Amenta, M.; Gentile, F.; Rapisarda, P.; Fabroni, S.; Ferlito, F. Physico-Chemical and Multielemental Traits of Anaerobic Digestate from Mediterranean Agro-Industrial Wastes and Assessment as Fertiliser for Citrus Nurseries. Waste Manag. 2021, 131, 201–213. [Google Scholar] [CrossRef] [PubMed]
  24. Hostetler, G.L.; Merwin, I.A.; Brown, M.G.; Padilla-Zakour, O. Influence of Undervine Floor Management on Weed Competition, Vine Nutrition, and Yields of Pinot Noir. Am. J. Enol. Vitic. 2007, 58, 421–430. [Google Scholar] [CrossRef]
  25. Żelazny, W.R.; Licznar-Małańczuk, M. Soil Quality and Tree Status in a Twelve-Year-Old Apple Orchard under Three Mulch-Based Floor Management Systems. Soil. Tillage Res. 2018, 180, 250–258. [Google Scholar] [CrossRef]
  26. Merwin, I.A.; Rosenberger, D.A.; Engle, C.A.; Rist, D.L.; Fargione, M. Comparing Mulches, Herbicides, and Cultivation as Orchard Groundcover Management Systems. Horttechnology 1995, 5, 151–158. [Google Scholar] [CrossRef]
  27. Zucconi, F. Nuove Tecniche per i Frutteti: Fisiologia e Metodi Innovativi Nell’allevamento Dei Fruttiferi; Edagricole: Bologna, Italy, 2003; ISBN 9788850648092. [Google Scholar]
  28. Gucci, R.; Caruso, G.; Bertolla, C.; Urbani, S.; Taticchi, A.; Esposto, S.; Servili, M.; Sifola, M.I.; Pellegrini, S.; Pagliai, M.; et al. Changes of Soil Properties and Tree Performance Induced by Soil Management in a High-Density Olive Orchard. Eur. J. Agron. 2012, 41, 18–27. [Google Scholar] [CrossRef]
  29. Adewale, C.; Reganold, J.P.; Higgins, S.; Evans, R.D.; Carpenter-Boggs, L. Agricultural Carbon Footprint Is Farm Specific: Case Study of Two Organic Farms. J. Clean. Prod. 2019, 229, 795–805. [Google Scholar] [CrossRef]
  30. Mittal, J.P.; Dhawan, K.C.; Thyagraj, C.R. Energy Scenario of Castor Crop under Dryland Agriculture of Andhra Pradesh. Energy Convers. Manag. 1991, 32, 425–430. [Google Scholar] [CrossRef]
  31. Pari, L.; Suardi, A.; Stefanoni, W.; Latterini, F.; Palmieri, N. Environmental and Economic Assessment of Castor Oil Supply Chain: A Case Study. Sustainability 2020, 12, 6339. [Google Scholar] [CrossRef]
  32. Palmieri, N.; Suardi, A.; Alfano, V.; Pari, L. Circular Economy Model: Insights from a Case Study in South Italy. Sustainability 2020, 12, 3466. [Google Scholar] [CrossRef]
  33. IUSS Working Group WRB. World Reference Base for Soil Resources 2014; Update 2015. Reports no.106; FAO: Rome, Italy, 2015; ISBN 978-92-5-108369-7. Available online: http://www.fao.org/3/a-i3794e.pdf (accessed on 8 August 2024).
  34. Magurran, A.E. Measuring Biological Diversity; Wiley-Blackwell: Hoboken, NJ, USA, 2013; ISBN 978-1-118-68792-5. [Google Scholar]
  35. Regent Instruments Inc. WinRHIZO™ Analysis of Washed Roots and Arabidopsis Seedlings. Copyright© 1991–2024. Available online: https://regent.qc.ca (accessed on 8 August 2024).
  36. SAS Institute Inc. JMP®, Version 14.0; SAS Institute Inc.: Cary, NC, USA, 1989.
  37. StatSoft, Inc. STATISTICA™ (Data Analysis Software System), Version 7.1; StatSoft, Inc.: Tulsa, OK, USA, 2007.
  38. ISO 14040:2006; Environmental Management—Life Cycle Assessment—Principles and Framework. International Organization for Standardization: Geneva, Switzerland, 2006.
  39. ISO 14044:2006; Environmental Management—Life Cycle Assessment—Requirements and Guidelines. International Organization for Standardization: Geneva, Switzerland, 2006.
  40. SIMAPRO, LCA Software for Informed Change-Makers. 2022. Available online: https://simapro.com/ (accessed on 6 February 2023).
  41. Bamber, N.; Jones, M.; Nelson, L.; Hannam, K.; Nichol, C.; Pelletier, N. Life Cycle Assessment of Mulch Use on Okanagan Apple Orchards: Part 1—Attributional. J. Clean. Prod. 2020, 267, 121960. [Google Scholar] [CrossRef]
  42. Brandão, M.; Clift, R.; Basson, L. A Life-Cycle Approach to Characterising Environmental and Economic Impacts of Multifunctional Land-Use Systems: An Integrated Assessment in the UK. Sustainability 2010, 2, 3747–3776. [Google Scholar] [CrossRef]
  43. ISMEA, Istituto Di Servizi per Il Mercato Agricolo Alimentare (ISMEA). 2022. Available online: https://www.ismea.it/flex/cm/pages/ServeBLOB.php/L/IT/IDPagina/6 (accessed on 6 February 2023).
  44. Van Passel, S.; Lepoutre, J.; Nevens, F.; Van Huylenbroeck, G.; Mathijs, E. Economische Duurzaamheid en Toegevoegde Waarde: Een Eerste Aanzet Op Basis van Macro-Economische Gegevens; Stedula Publicatie: Gontrode, Belgium, 2004; ISBN 90-77547-09-6. [Google Scholar]
  45. World Business Council for Sustainable Development (WBCSD). Eco-Efficiency Learning Module. 2006. Available online: https://docs.wbcsd.org/2006/08/EfficiencyLearningModule.pdf (accessed on 8 August 2024).
  46. Ferrara, G.; Fracchiolla, M.; Chami, Z.A.; Camposeo, S.; Lasorella, C.; Pacifico, A.; Aly, A.; Montemurro, P. Effects of Mulching Materials on Soil and Performance of Cv. Nero Di Troia Grapevines in the Puglia Region, Southeastern Italy. Am. J. Enol. Vitic. 2012, 63, 269–276. [Google Scholar] [CrossRef]
  47. Palese, A.M.; Nuzzo, V.; Dichio, B.; Celano, G.; Romano, M.; Xiloyannis, C. The Influence of Soil Water Content on Root Density in Young Olive Trees. Acta Hortic. 2000, 537, 329–336. [Google Scholar] [CrossRef]
  48. Masmoudi-Charfi, C.; Masmoudi, M.; Ben Mechlia, N. Root Distribution in Young Olive Trees (Olea europaea Cv. Chétoui) and Agronomic Application. Adv. Hortic. Sci. 2013, 25, 112–122. [Google Scholar] [CrossRef]
  49. Lodolini, E.M.; de Iudicibus, A.; Lucchese, P.G.; Zucchini, M.; Crescenzi, S.; Pacella, M.; Giorgi, V.; Neri, D. Canopy and Root Growth of Young Olive Trees in a High-Density Orchard. Acta Hortic. 2023, 1366, 253–260. [Google Scholar] [CrossRef]
  50. Zadworny, M.; Eissenstat, D.M. Contrasting the Morphology, Anatomy and Fungal Colonization of New Pioneer and Fibrous Roots. New Phytol. 2011, 190, 213–221. [Google Scholar] [CrossRef]
  51. Pari, L.; Alexopoulou, E.; Stefanoni, W.; Latterini, F.; Cavalaris, C. The Eco-Efficiency of Castor Supply Chain: A Greek Case Study. Agriculture 2022, 12, 206. [Google Scholar] [CrossRef]
  52. Houle, G.; Babeux, P. Fertilizing and Mulching Influence on the Performance of Four Native Woody Species Suit-able for Revegetation in Subarctic Quebec. Can. J. For. Res. 1994, 24, 2342–2349. [Google Scholar] [CrossRef]
  53. Neilsen, G.H.; Hogue, E.J.; Forge, T.; Neilsen, D. Surface Application of Mulches and Biosolids Affect Orchard Soil Properties after 7 Years. Can. J. Soil Sci. 2003, 83, 131–137. [Google Scholar] [CrossRef]
  54. Nemecek, T.; Dubois, D.; Huguenin-Elie, O.; Gaillard, G. Life cycle assessment of Swiss farming systems: I. Integrated and organic farming. Agric. Syst. 2011, 104, 217–232. [Google Scholar] [CrossRef]
  55. Iqbal, R.; Raza, M.A.S.; Valipour, M.; Saleem, M.F.; Zaheer, M.S.; Ahmad, S.; Toleikiene, M.; Haider, I.; Aslam, M.U.; Nazar, M.A. Potential Agricultural and Environmental Benefits of Mulches—A Review. Bull. Natl. Res. Cent. 2020, 44. [Google Scholar] [CrossRef]
  56. Lightfoot, D.R. Morphology and Ecology of Lithic-Mulch Agriculture. Geogr. Rev. 1994, 84, 172–185. [Google Scholar] [CrossRef]
  57. Ngouajio, M.; McGiffen, M.E. Sustainable Vegetable Production: Effects of Cropping Systems on Weed and Insect Population Dynamics. In Proceedings of the XXVI International Horticultural Congress: Sustainability of Horticultural Systems in the 21st Century, Toronto, ON, Canada, 11–17 August 2002; Volume 638, pp. 77–83. [Google Scholar] [CrossRef]
  58. Lamont, W.J. Plastics: Modifying the Microclimate for the Production of Vegetable Crops. Horttechnology 2005, 15, 477–481. [Google Scholar] [CrossRef]
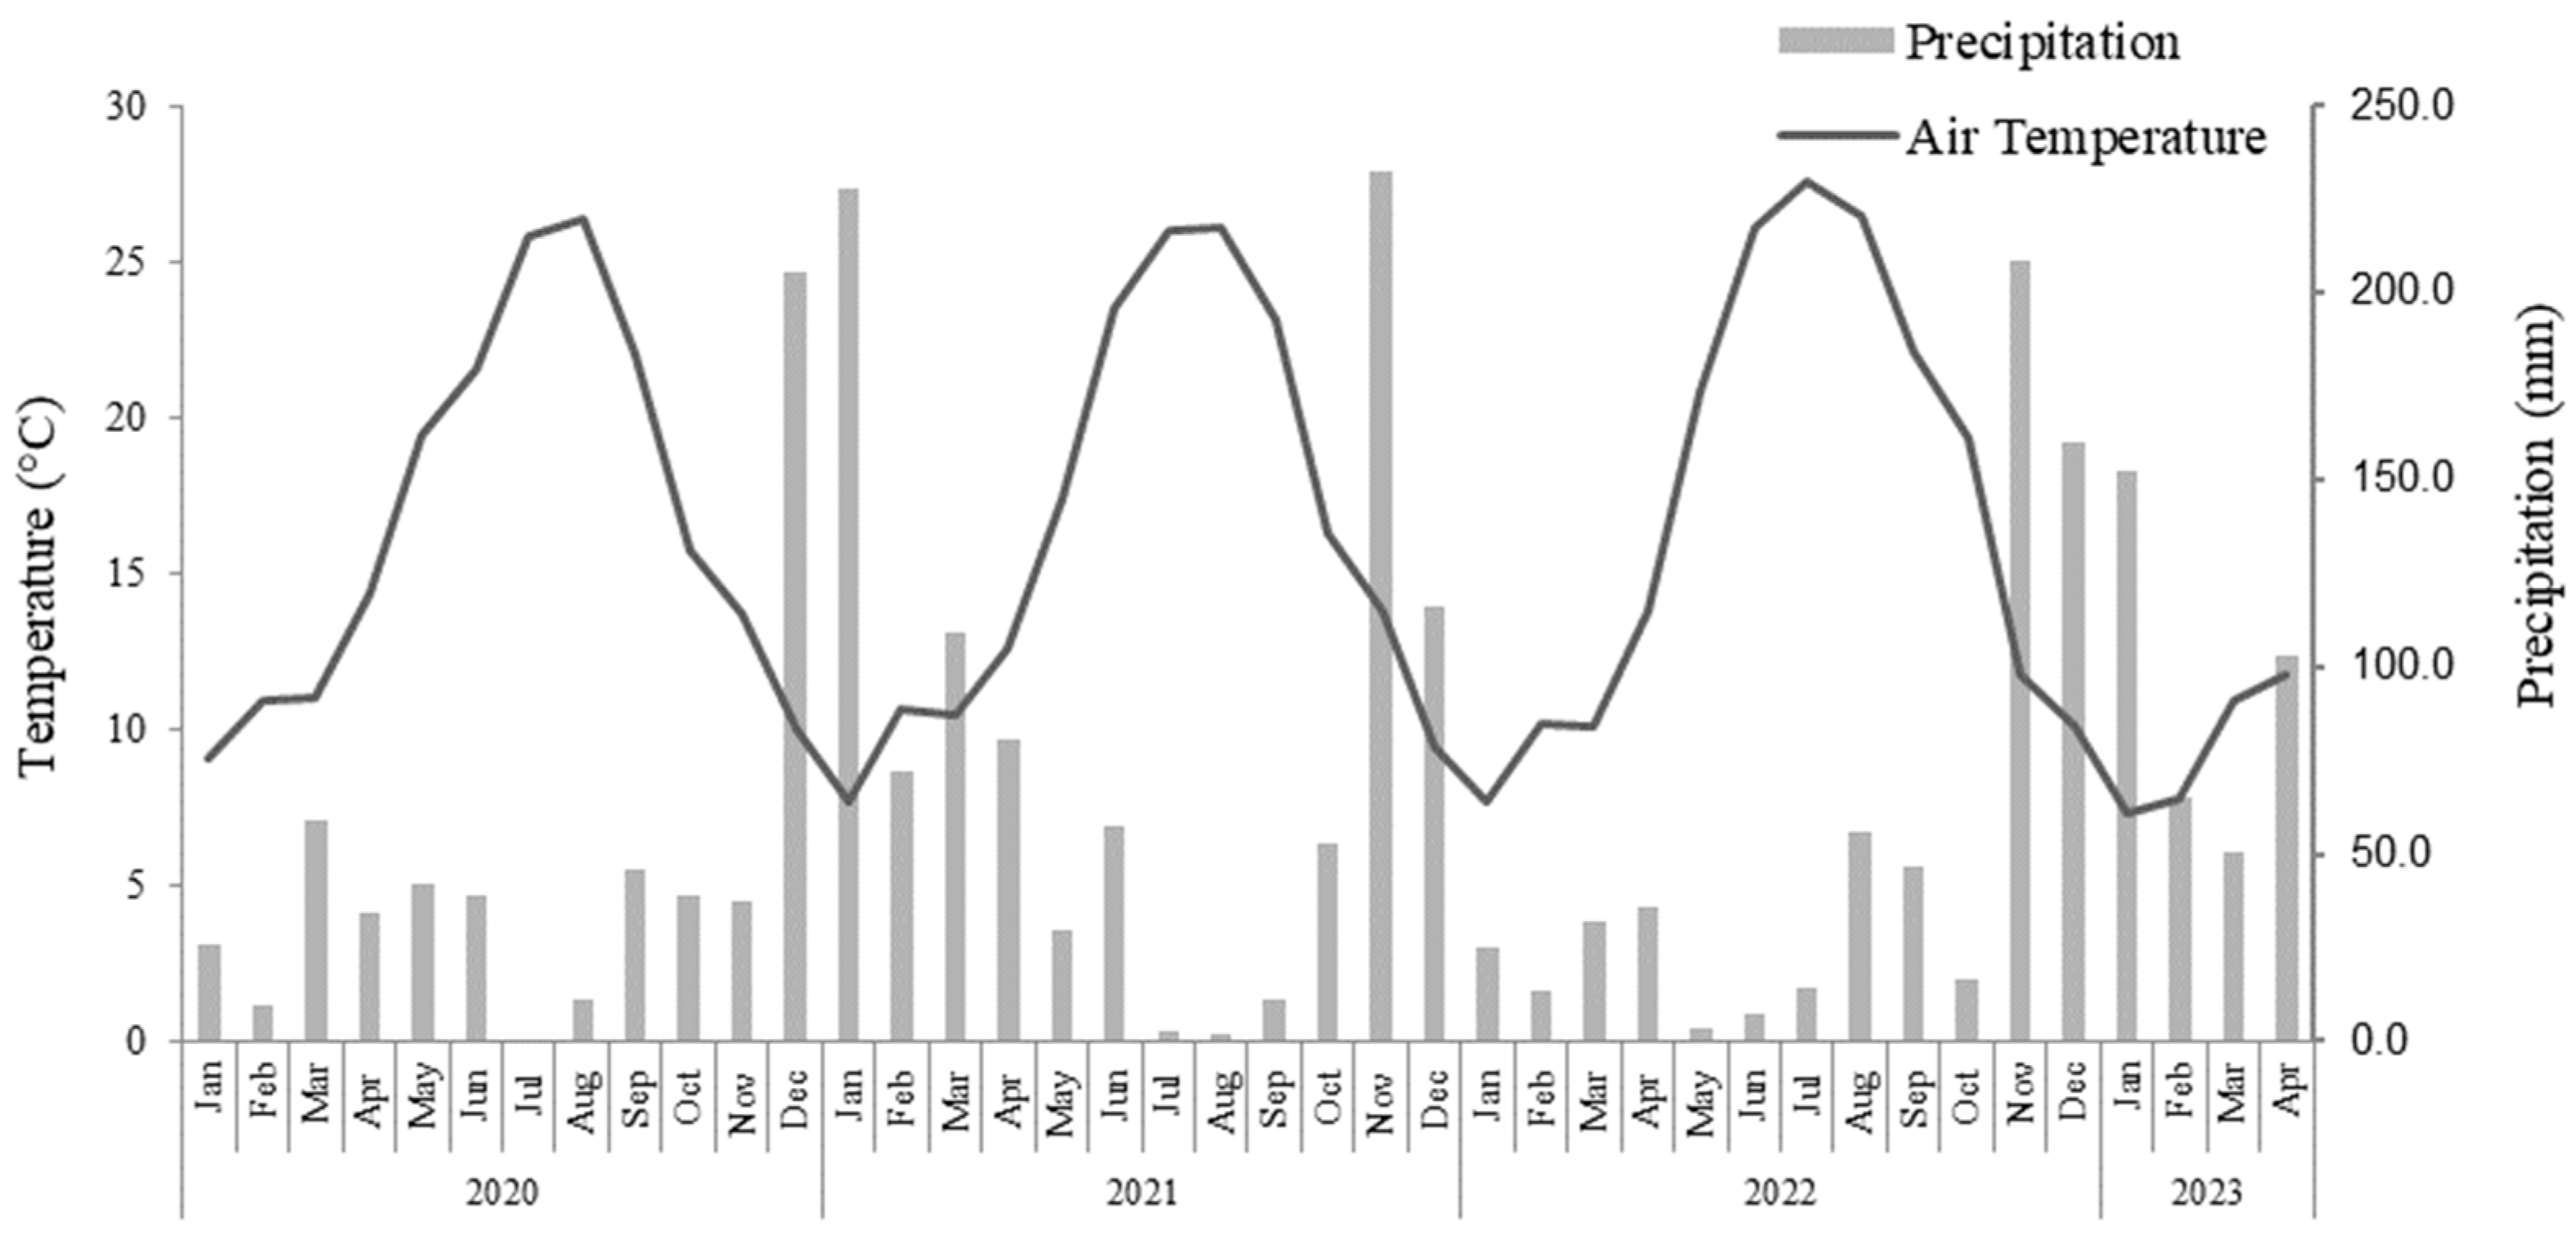
Figure 1. Trend of the monthly mean air temperature and total precipitation during the trial.
Agronomy 14 02051 g001
Figure 2. Compared in-row soil management treatments: synthetic mulching (a) and hoeing (b).
Agronomy 14 02051 g002
Figure 3. Weed cover (%) in the intra-row area of the hoeing treatment in September 2020 (a) and November 2020 (b).
Agronomy 14 02051 g003
Figure 4. Weed soil coverage status along the synthetic mulching row and along hoeing one at (A,D) 35 DAT, (B,E) 69 DAT, and (C,F) 147 DAT.
Agronomy 14 02051 g004
Figure 5. Principal Component Analysis for the February (a,b) and the March (c,d) samplings. TOT = Total coverage (%); R = Richness; e = Evenness; PRN (%) = life form (% of perennials); CH = Canopy heights (m); SW = Seeds weight (g); SLA= Surface Leaf Area; Grass-like % = graminoid species incidence; N-fixing % = leguminous species incidence.
Agronomy 14 02051 g005
Figure 6. Trunk Cross Sectional Area (TCSA) measured at the planting and at the end of each growing season. Data are shown as mean ± standard error of 30 replicates. Different letters indicate significant differences between treatments within each measurement date according to the Tukey–Kramer HSD test (p < 0.05).
Agronomy 14 02051 g006
Figure 7. Canopy volume (m3) calculated at the end of the 2nd and 3rd growing season. Data are shown as mean ± standard error of 30 replicates. Different letters indicate significant differences between treatments within each measurement date according to the Tukey–Kramer HSD test (p <0.05).
Agronomy 14 02051 g007
Figure 8. Root diameter (mm) measured in November 2020, December 2021, and October 2022. Data are shown as mean ± standard error of 8 replicates. Different letters indicate significant differences between the two tested treatments within the same sampling date according to the Tukey–Kramer HSD test (p < 0.05). When the letters are not shown, it indicates no significant differences between treatments within the same sampling date.
Agronomy 14 02051 g008
Figure 9. TCSA/RLD ratio (cm g) evolution from November 2020 to October 2022 for mulching and hoeing. Each point represents the ratio between the average values of TCSA and RLD within each measurement date.
Agronomy 14 02051 g009
Figure 10. The impact of environmental impact categories per each row management strategy (FU = 1 hectare). The values are expressed as percentages in relation to the field management adopted technique with the highest environmental impact, which is expressed as 100%. Legend: AD: Abiotic depletion; Adf: Abiotic depletion-fossil fuels; GWP: Global Warming (GWP100a); ODP: Ozone Layer Depletion; HT: Human Toxicity; FW: Fresh water aquatic ecotox.; ME: Marine Aquatic Eco-Toxicity; TE: Terrestrial Eco-Toxicity; PO: Photochemical Oxidation; AC: Acidification; EU: Eutrophication.
Agronomy 14 02051 g010
Figure 11. The sensitivity results: the impact of environmental impact categories per each row management strategy (FU = 1 Mg of product). The values are expressed as percentages in relation to the field management with the highest environmental impact, which is expressed as 100%. Legend: AD: Abiotic depletion; Adf: Abiotic depletion-fossil fuels; GWP: Global Warming (GWP100a); ODP: Ozone Layer Depletion; HT: Human Toxicity; FW: Fresh water aquatic ecotox; ME: Marine Aquatic Eco-Toxicity; TE: Terrestrial Eco-Toxicity; PO: Photochemical Oxidation; AC: Acidification; EU: Eutrophication.
Agronomy 14 02051 g011
Table 1. Measurements performed during the trial. Date and repetitions for each parameter are indicated.
ParameterMeasurement DateRepetitions per Treatment
Weed evolutionSept 2020
Nov 2020
Dec 2020
Jan 2021
Apr 2021
Feb 2023 (residual effect)
March 2023 (residual effect)
9 positions along each row (treatment)
Tree and canopy biometrics
(height, widths, volume, TCSA)
Nov 2019
Oct 2020
Dec 2021
Oct 2022
30 trees along each row (treatment)
Fruit yieldNov 2021
Oct 2022
30 trees along each row (treatment)
Root development (RLD, diameter)Nov 2020
Dec 2021
Oct 2022
8 samples along each row (treatment)
Table 2. The life cycle inventory analysis for each strategy.
MulchingHoeing
Agricultural
Operation
MulchingCloth
Removal
I
Phase
II
Phase
III
Phase
IV
Phase
V
Phase
VI
Phase
VII PhaseVIII
Phase
IX
Phase
X
Phase
Tractor power (kW)505050505050505050505050
Tractor weight (kg)180018001800180018001800180018001800180018001800
Fuel or electricity consumption
(l ha−1)
9.009.009.009.009.009.009.009.009.009.009.009.00
Lubricant consumption
(l ha−1)
0.050.050.050.050.050.050.050.050.050.050.050.05
Lifetime (h ha−1)10,00010,00010,00010,00010,00010,00010,00010,00010,00010,00010,00010,000
Machinery used (type)Roll it outHarrowTillageTillageTillageTillageTillageTillageTillageTillageTillageTillage
Machinery power (kW) ----------
Weight
machineries (kg)
6003004500450045004500450045004500450045004500
Lifetime (h)15,00050007000700070007000700070007000700070007000
Product utilized (type)Cloth-----------
Quantity
(kg ha−1)
1050
Product utilized (type)Urea
(N46)
Urea
(N 46)
Urea
(N 46)
Urea
(N 46)
Quantity
(kg ha−1)
20---30--30--30-
Source: Elaboration of the data of our internal survey.
Table 3. Weed community structure before the passage of the hoeing machine (Nov 2020), immediately after the treatment (0 DAT), 35 DAT, 69 DAT, and 147 DAT.
Total Cover (%)RePerennials (%)
Before
hoeing
(Nov 2020)
Hoeing100.006.440.8219.4
0 DAT
(Nov 2020)
Hoeing0.00---
35 DAT
(Dec 2020)
Hoeing9.674.700.8519.15
69 DAT
(Jan 2021)
Hoeing14.04.500.8914.97
147 DAT
(Apr 2021)
Hoeing37.67.50.878.21
R = Richness and e = Evenness.
Table 4. Analysis of the residual effect of hoeing, mulching treatments along the rows, and mowing and chopping treatment in the inter-row area, on the two sampling dates of February 2023 and March 2023. Different letters indicate significantly different weights according to pairwise comparisons between a couple of treatment factors processed by the exact Mann–Whitney post hoc test.
10 February 202321 March 2023
HoeingMulchingChoppingpHoeingMulchingChoppingp
TOT cov (%)90.6 b12.0 c96.8 b0.00086.9 a16.3 b97.8 a0.000
R15 a11 b12 ab0.00918 a13 b14 b0.003
e0.80 b0.94 a0.73 b0.0000.80 b0.93 a0.71 c0.000
Grass-like (%)19.5 a16.1 ab7.6 b0.03134.6 a15.7 ab6.5 b0.004
N-fixing (%)1.8 b10.7 a1.6 b0.0005.3 b23.2 a4.3 b0.000
PRN (%)12.0 b23.4 a24.7 a0.03214.1 b32.9 a8.13 b0.001
CH (m)0.470.490.480.9520.50 a0.46 ab0.36 b0.004
SW (g)3.592.111.560.2382.79 a1.98 b1.44 b0.027
SLA26.5 a25.2 a21.8 b0.00525.9 ab26.7 a24.0 b0.006
Slq (%)////64.4 a49.5 b52.5 ab0.032
TOT cov (%) = Total coverage (%); R = Richness; e = Evenness; PRN (%) = life form (% of annuals or perennials); CH (m) = Canopy heights; SW (g) = Seeds weight; SLA = Surface Leaf Area; Slq (%) = Sorensen similarity index.
Table 5. Principal component analysis (PCA) loadings of the weed community structural parameters and weed traits on the first four axes, capturing 85.97% of the total variance in February 2023, and 86.43% in March 2023. Loadings are scaled by their respective eigenvalues and represent the correlation of each variable with the PCA axes. Correlation values higher than ±0.5 are in bold.
10 February 202321 March 2023
F1F2F3F4F1F2F3F4
Variance31.31%25.46%16.64%12.56%41.49%20.29%14.65%10.00%
Tot cov0.8578780.055373−0.424366−0.0360350.8886330.2641740.158691−0.052396
R0.0704850.080039−0.8193500.4837570.1649440.7456610.1967500.415940
e−0.9141790.084359−0.1816480.039881−0.8563720.020949−0.2232650.128304
Grass-like−0.4636630.520483−0.460866−0.085255−0.0769250.684540−0.5671620.231484
N-fixing−0.848083−0.1209010.2458300.113716−0.878857−0.1324690.006845−0.167181
PRN−0.315697−0.839283−0.207437−0.012275−0.878000−0.1795240.2510050.233256
CH−0.295044−0.688183−0.492588−0.274109−0.4844450.2971940.6992560.270312
SW−0.0648040.348586−0.221271−0.880463−0.1742240.5635390.430597−0.638599
SLA−0.3402780.830625−0.0745960.151707
Tot cov = Total coverage; R = Richness; e = Evenness; PRN = life form (annuals or perennials); CH = Canopy heights; SW = Seeds weight; SLA = Surface Leaf Area.
Table 6. Tree height at planting and at the end of each year of experimentation. Values are mean ± standard error of 30 replicates. Different letters indicate significant differences between treatments within each measurement date according to the Tukey–Kramer HSD test (p < 0.05).
Tree Height at Planting
(cm)
Tree Height at
Oct 2020
(cm)
Tree Height at
Dec 2021
(cm)
Tree Height at
Oct 2022
(cm)
Mulching61.4 ± 2.34130.4 ± 2.65 a207.0 ± 3.08 a239.5 ± 3.10 a
Hoeing60.2 ± 1.9699.9 ± 3.51 b173.2 ± 4.28 b215.8 ± 4.78 b
Table 7. Average fruit yield and estimated number of fruits per tree in the 2nd year (October 2021) and in the 3rd year (October 2022) after planting. Values are shown as mean ± standard error of 30 replicates. Different letters indicate significative differences between treatments according to the Tukey–Kramer HSD test (p <0.05).
2nd Year after Planting (2021)3rd Year after Planting (2022)
Fruit Yield per Tree
(kg)
Number of Fruits per TreeFruit Yield per Tree
(kg)
Number of
Fruits per Tree
Mulching0.30 ± 0.09 a139.0 ± 42.3 a5.84 ± 0.40 a2904.3 ± 242.4 a
Hoeing0.05 ± 0.02 b24.5 ± 8.90 b2.46 ± 0.27 b1085.6 ± 139.9 b
Table 8. GVA and carbon footprint for each row management strategy.
Environmental ImpactUnitsMulchingHoeing
Gross Revenue (EUR/ha−1)(EUR/FU)2.2502.100
Total costs (EUR/ha−1)(EUR/FU)1.7031.750
Total GVA (EUR/ha−1)(EUR/FU)547350
GWP (kg CO2eq/ha−1)(kg CO2eq/1 ha−1)200266
The eco-efficiency ratio (€/kg CO2eq)2.731.32
Sensitivity results
Gross Revenue (EUR/Mg−1)(EUR/FU)600600
Total costs (EUR/Mg−1)(EUR/FU)250270
Total GVA (EUR/Mg−1)(EUR/FU)350330
GWP (kg CO2eq/Mg−1)(kg CO2eq/Mg−1)3.307.79
The eco-efficiency ratio (€/kg CO2eq)106.0642.36
Source: our elaboration on both the survey data and the environmental findings.
Disclaimer/Publisher’s Note: The statements, opinions and data contained in all publications are solely those of the individual author(s) and contributor(s) and not of MDPI and/or the editor(s). MDPI and/or the editor(s) disclaim responsibility for any injury to people or property resulting from any ideas, methods, instructions or products referred to in the content.