Article

Using Multispectral Data from UAS in Machine Learning to Detect Infestation by Xylotrechus chinensis (Chevrolat) (Coleoptera: Cerambycidae) in Mulberries

by
Christina Panopoulou
1,
Athanasios Antonopoulos
1,
Evaggelia Arapostathi
1,
Myrto Stamouli
1,
Anastasios Katsileros
2 and
Antonios Tsagkarakis
1,*
1
Laboratory of Sericulture and Apiculture, Agricultural University of Athens, 11855 Athens, Greece
2
Laboratory of Plant Breeding and Biometry, Agricultural University of Athens, 11855 Athens, Greece
*
Author to whom correspondence should be addressed.
Agronomy 2024, 14(9), 2061; https://doi.org/10.3390/agronomy14092061
Submission received: 26 July 2024 / Revised: 3 September 2024 / Accepted: 3 September 2024 / Published: 9 September 2024
(This article belongs to the Special Issue Pests, Pesticides, Pollinators and Sustainable Farming)

Abstract

:
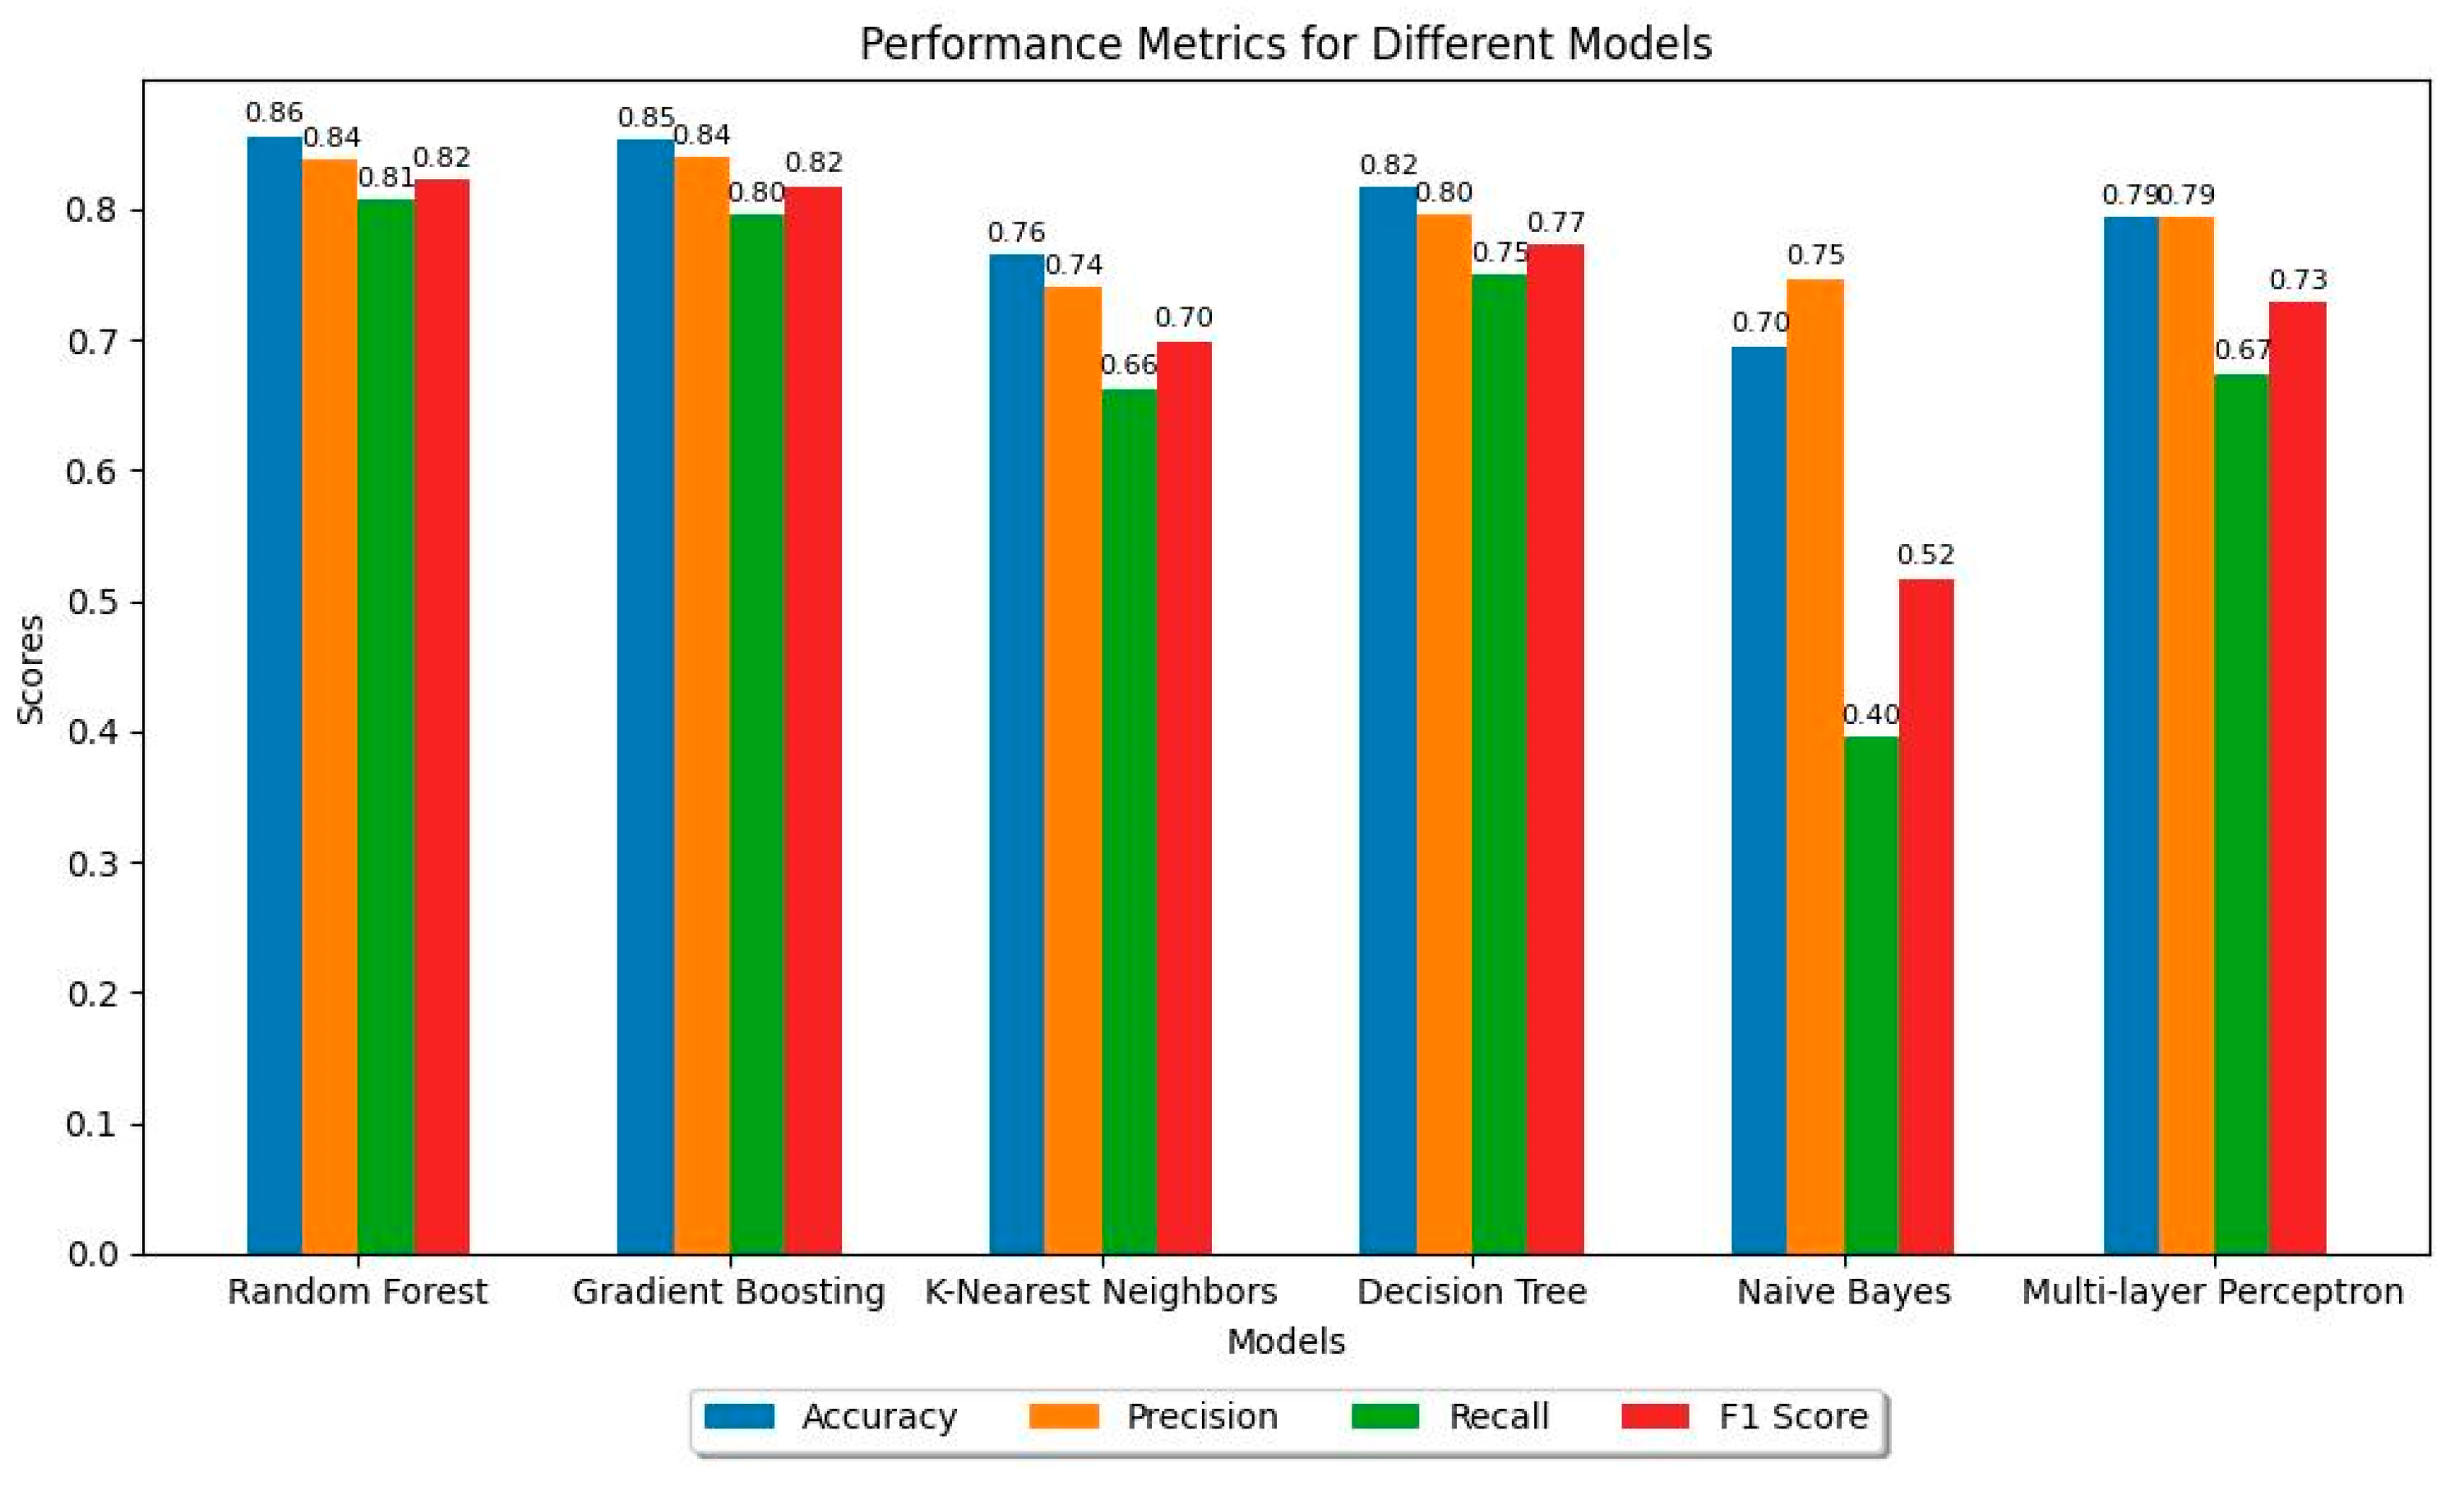
The tiger longicorn beetle, Xylotrechus chinensis Chevrolat (Coleoptera: Cerambycidae), has posed a significant threat to mulberry trees in Greece since its invasion in 2017, which may be associated with global warming. Detection typically relies on observing adult emergence holes on the bark or dried branches, indicating severe damage. Addressing pest threats linked to global warming requires efficient, targeted solutions. Remote sensing provides valuable, swift information on vegetation health, and combining these data with machine learning techniques enables early detection of pest infestations. This study utilized airborne multispectral data to detect infestations by X. chinensis in mulberry trees. Variables such as mean NDVI, mean NDRE, mean EVI, and tree crown area were calculated and used in machine learning models, alongside data on adult emergence holes and temperature. Trees were classified into two categories, infested and healthy, based on X. chinensis infestation. Evaluated models included Random Forest, Decision Tree, Gradient Boosting, Multi-Layer Perceptron, K-Nearest Neighbors, and Naïve Bayes. Random Forest proved to be the most effective predictive model, achieving the highest scores in accuracy (0.86), precision (0.84), recall (0.81), and F-score (0.82), with Gradient Boosting performing slightly lower. This study highlights the potential of combining remote sensing and machine learning for early pest detection, promoting timely interventions, and reducing environmental impacts.

1. Introduction

Global warming exerts strong effects on various organisms, including insects. Abiotic factors such as solar radiation, relative humidity, rainfall, and temperature define the suitable ecosystem for each species to inhabit. Insect populations, physiology, phenology, and abundance tend to be susceptible to changes as climate conditions become warmer [1]. Thus, temperature increases, notably in mid to high latitudes, are responsible for insects’ rapid development, high reproductive potential, survival, and population rearrangement [2,3]. Given that plants cannot spread out in a short period of time, climatic warming may enlarge the range of herbivores poleward, into previously uninhabited, regions of their host plants’ distributions [1].
The tiger longicorn beetle, Xylotrechus chinensis Chevrolat (Coleoptera: Cerambycidae), is a newly invasive woodborer species in Greece that originates from Eastern Asia. It causes severe damage to the mulberry trees (Morus spp.), although there are references for damage in species of the Rosaceae family (Malus spp., Pyrus spp.) and Vitis vinifera in its area of origin [4,5,6]. However, in Europe, it has been shown that this pest so far only attacks Morus spp., with a previous study proving that X. chinensis has not used Vitis vinifera as an alternative host plant under laboratory conditions [6]. Concerning its presence in Europe, initially it has been imported due to international commerce and mainly through wooden packaging materials and objects [4,7,8]. It is possible that its establishment in Spain, France, Italy, and Greece in the EPPO region (Figure 1) was facilitated by the warmer temperature conditions in the Mediterranean area. The first recorded infestation of X. chinensis in Greece was recorded in Heraklion, Crete, in 2017, where 200 infected mulberry trees were observed, and approximately 15% of the mulberry tree population eventually succumbed to the pest’s infestation. Considering the insect’s life cycle, its introduction to Greece probably occurred around 2014–2015 [5,8]. Until 2019, the distribution of the insect in Greece had reached considerable proportions, notably affecting the mulberry tree population in Athens, where 1300 out of 20,000 trees displayed severe damage [4].
Generally, the impacts of the climatic variation on insect phenology are associated with life cycle alterations. In particular, voltinism, emergence, and the duration of the life cycle are likely to be affected [1]. Regarding the influence of temperature rise, especially on bark beetles, the decrease in the duration of the life cycle from 2 years to 1 in the case of Dendroctonus rufipennis is demonstrated (Coleoptera: Curculionidae) [9]. Current data in Greece do not testify any differences concerning the duration of X. chinensis’ life cycle in the areas in which it occurs. Additionally, warm climate conditions correlate with distribution expansion. In the EFSA Panel on Plant Health (2021), after comparing the eight Köppen–Geiger climate types occurring in countries where X. chinensis has been reported and the climate types occurring in the European Union, it is concluded that the pest may be established in the largest part of EU territory [7]. Nevertheless, there is a risk that temperature warming may provoke a population surge in northern regions or may decrease the required period that a generation needs to be completed. Taking into consideration the insects’ outbreaks, [10] note that a warming trend of 3.3 °C in minimum winter temperatures for more than 40 years generated a population burst of Dendroctonus frontalis (Coleoptera: Curculionidae).
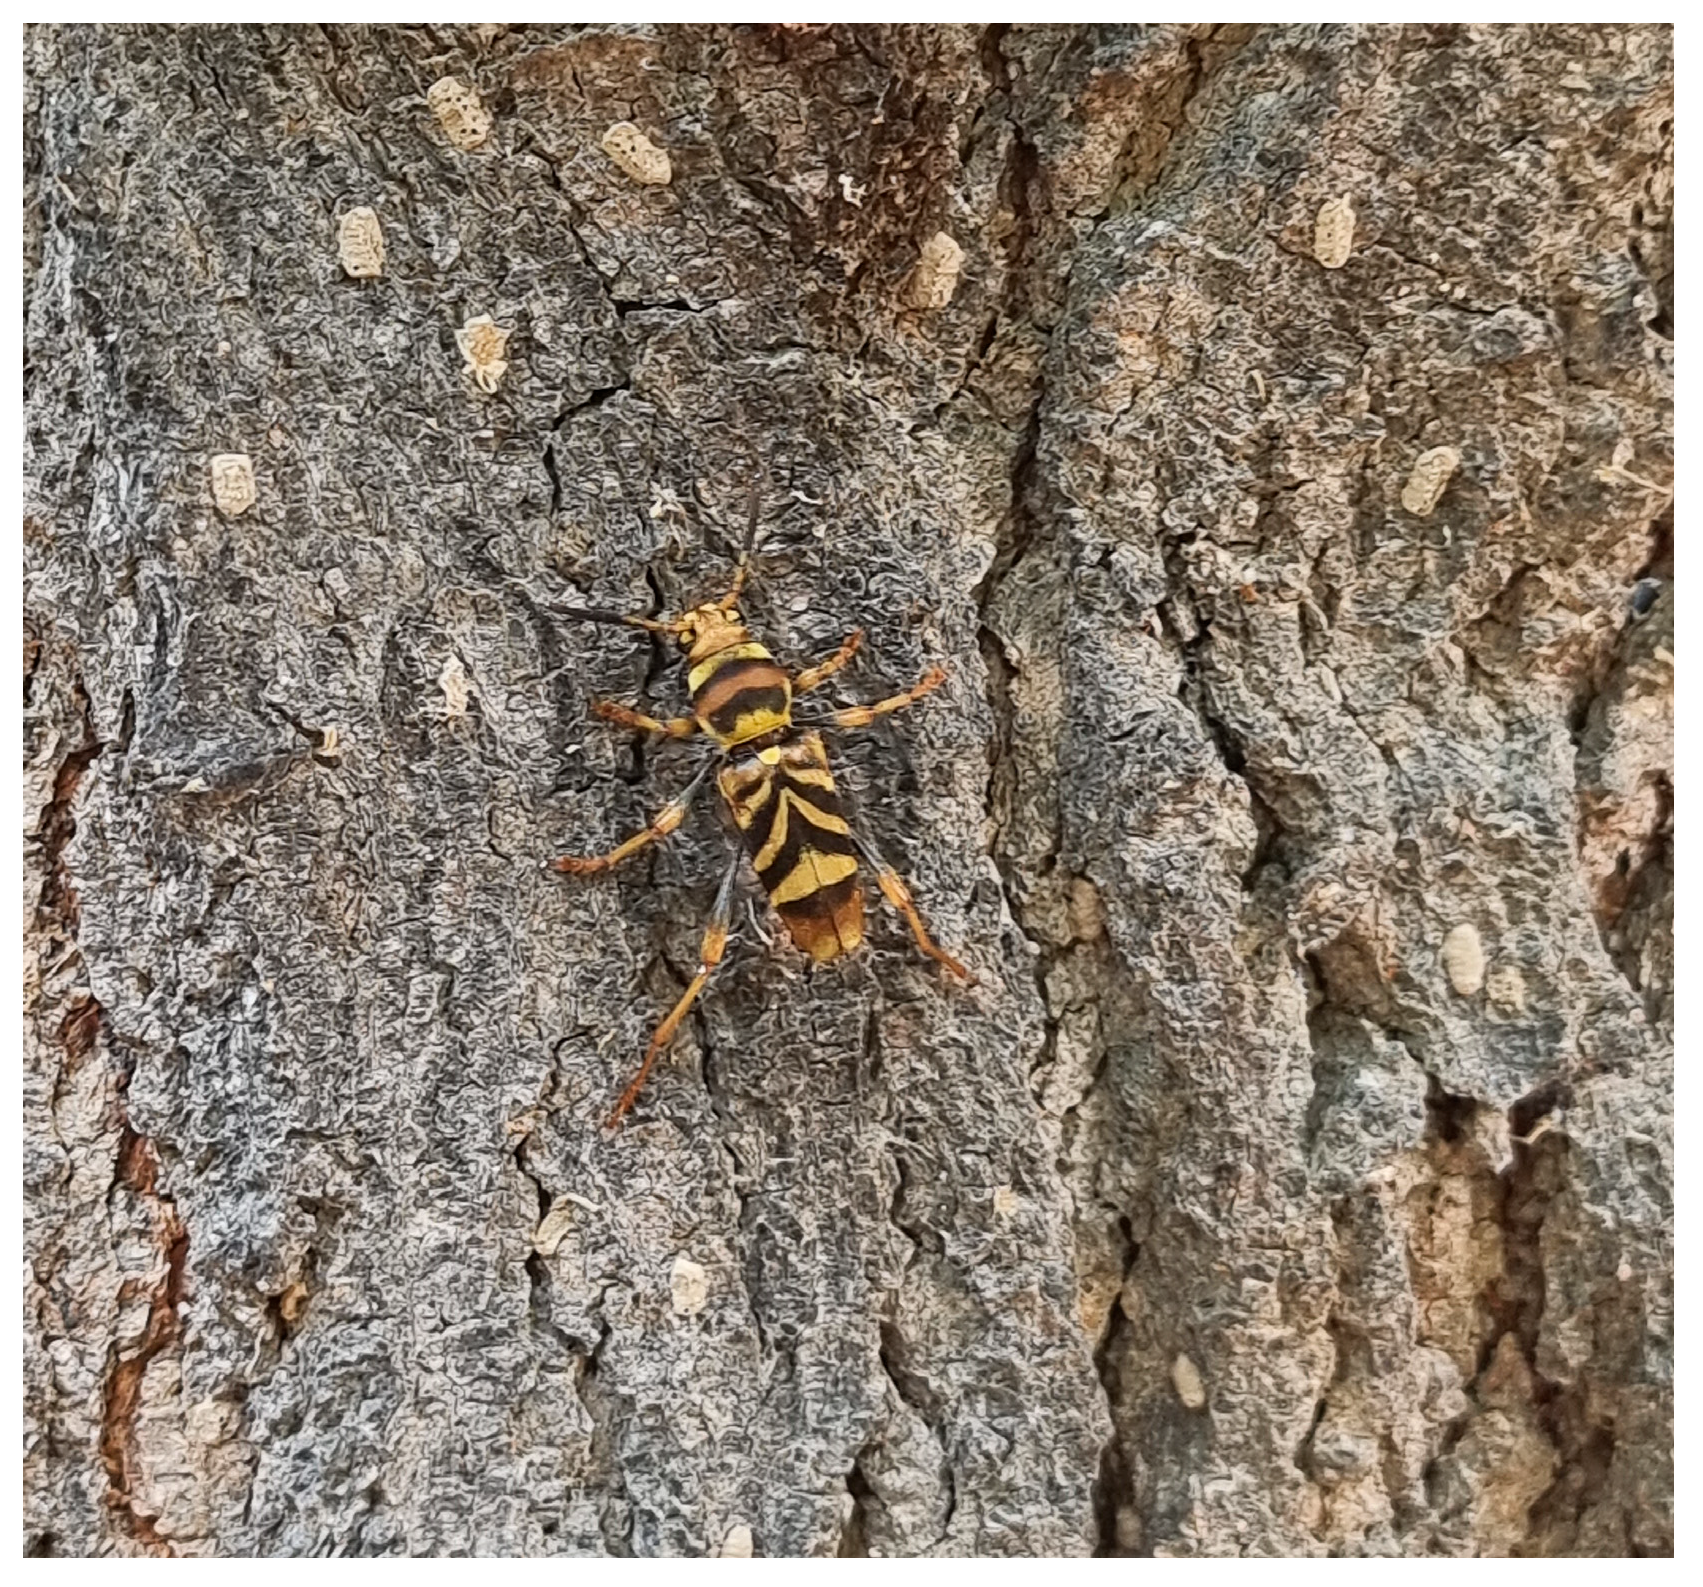
Currently, the insect’s biological cycle consists of four stages: egg, larva, pupa, and adult. Adults (Figure 2) emerge between May and June, feed on leaves and stems of mulberries and after their sexual reproduction, the females deposit their eggs on the bark of the trunk of the trees [4,5,6]. During midsummer, the larvae penetrate the trunk and bore elongated tunnels within the phloem while they are feeding on them. They overwinter as developed larvae and pupate into the xylem [4,5,6,8].
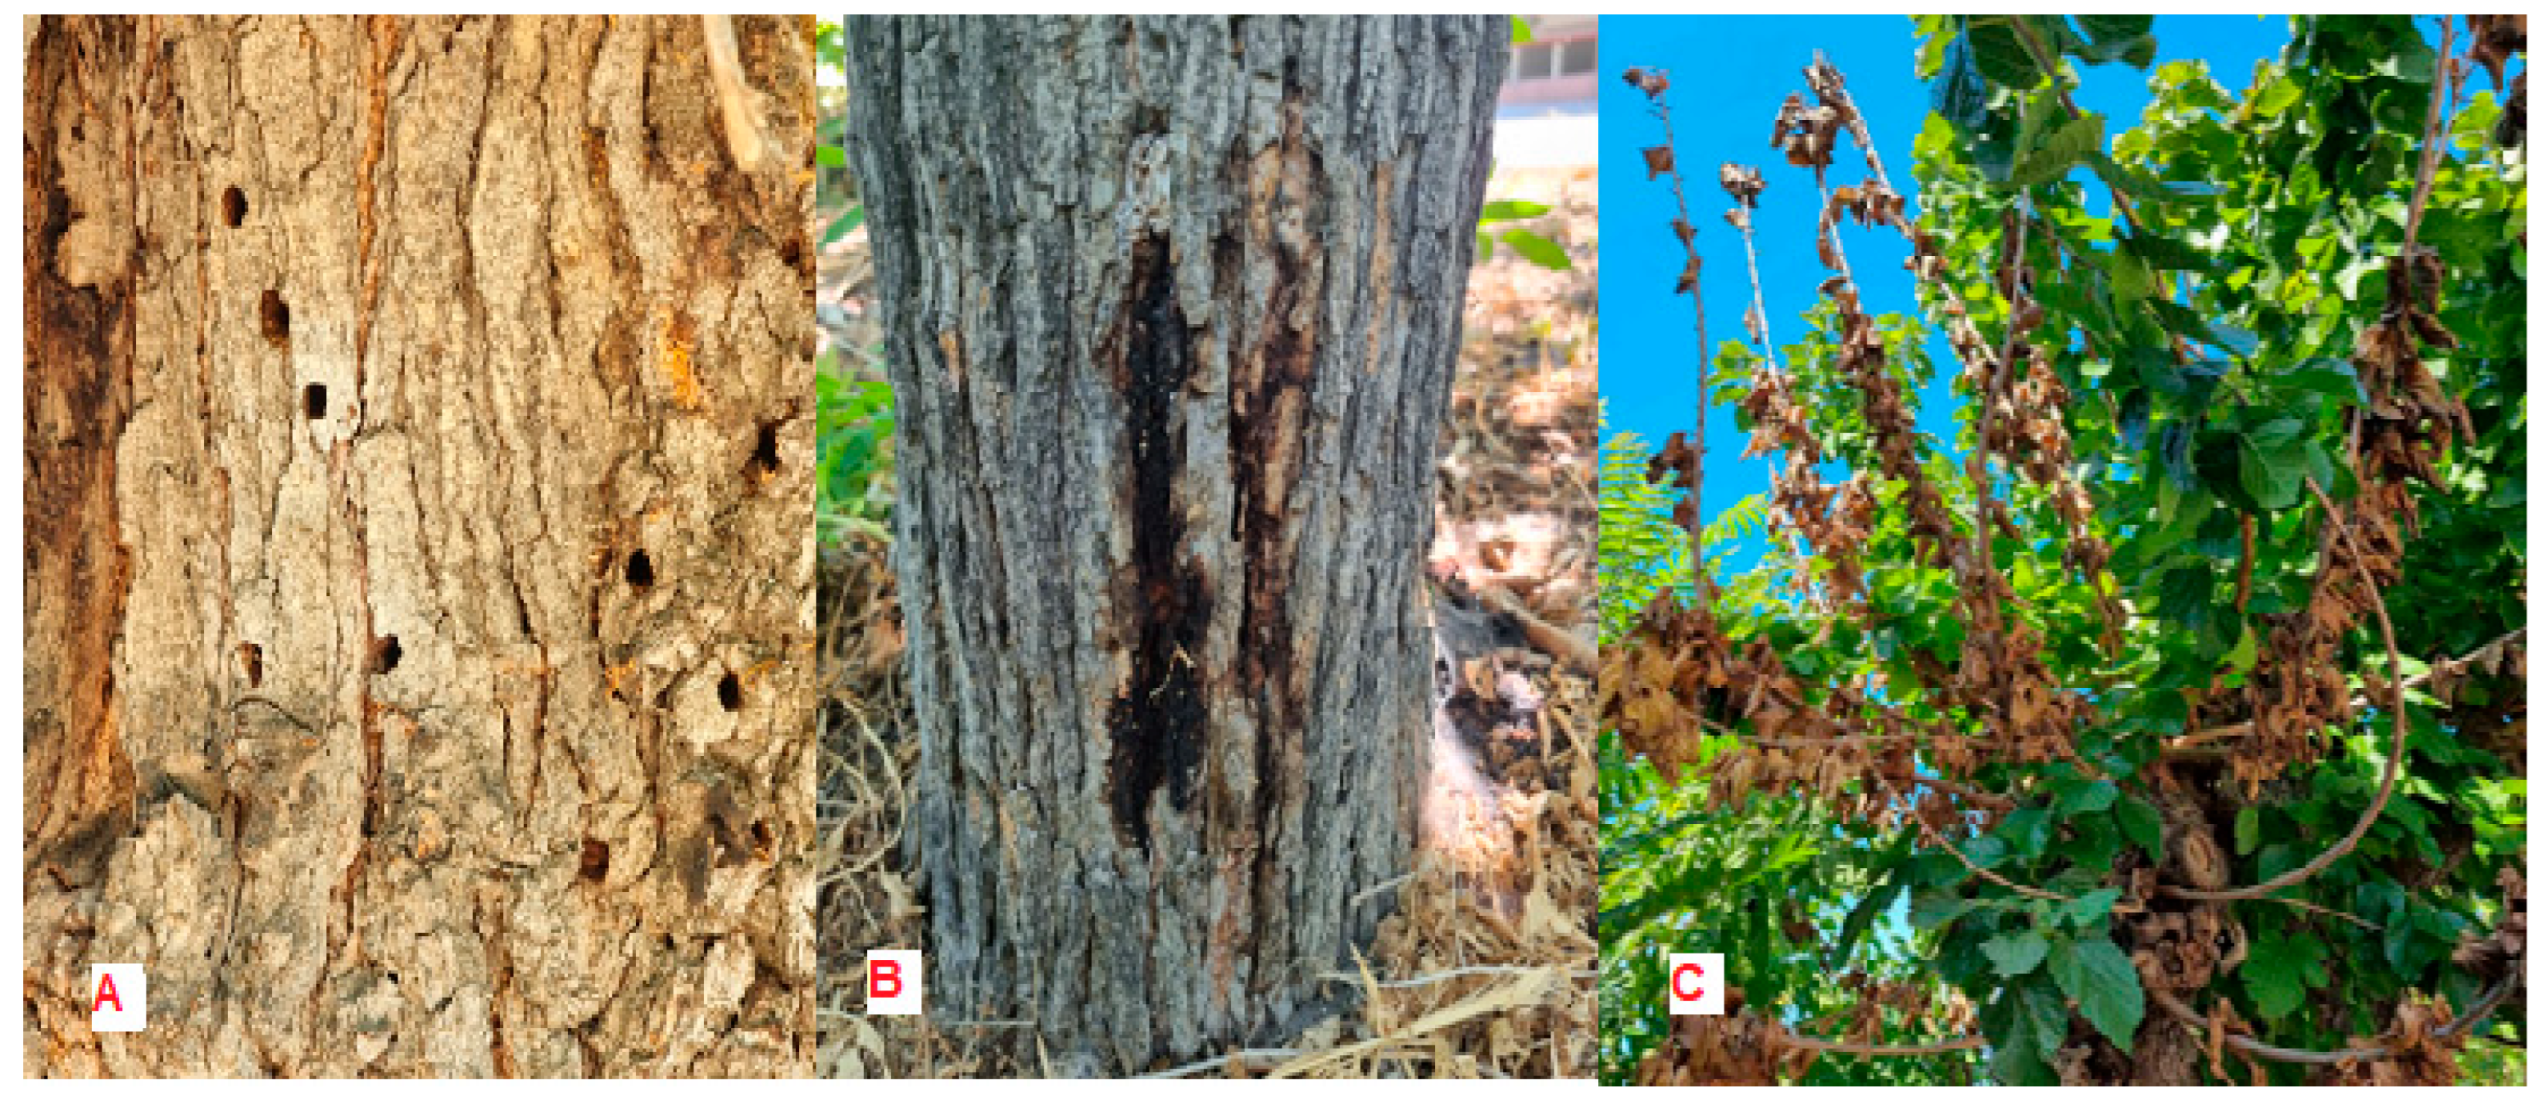
The result of the feeding activity of the larvae is the gradual destruction of the xylem tissue of the trees, so water and inorganic compounds cannot be transported and distributed through it. During spring, adult emergence holes are visible on the bark of the trees in the middle and late stages of the infestation. Eventually, the decline and death of the tree occur (Figure 3) [6,8].
Apart from insects, global warming poses a significant threat for plants. Environmental change, particularly temperature increase, can affect plants’ species range, abundance, and phenology [11,12]. Climatic alteration, primarily temperature augmentation, often leads to drought events and consequently to water deprivation. Water stress restricts hydraulic functions inside the plants and destroys the production, transport, and availability of nonstructural carbohydrates (NSC) [13]. These NSCs are related to plant defense compounds, and as their production decreases, trees are likely to be more vulnerable to insect attacks [13,14,15,16,17,18,19]. Spring drought conditions have been shown to increase infestations of certain insects, such as Ips typographus (Coleoptera: Curculionidae) [14]. Climate warming is also linked to reduced precipitation. Mulberries in Greece are used, mainly, as ornamental plants on the streets or for their shadow-providing role. In these cases, where no economic interest is involved, trees receive little to no irrigation, making rainwater their exclusive water source. Due to drought events and as the water stress rises, mulberries are more likely to be attacked by X. chinensis.
The timing of X. chinensis attacks on mulberry trees does not synchronize with the appearance of the symptoms. Due to the severe damage and the stealth action of the larvae, early detection of the infestation is crucial to take timely control measures and limit the spread [15,16]. This is feasible by using remote sensing for the recording of the spectral signature of a plant. A plant’s spectral signature is the reflectance of electromagnetic radiation by its tissues [17]. Normally, a healthy plant absorbs the radiation of the blue and red bands of the electromagnetic spectrum, using it in photosynthesis, while it reflects the radiation of the green and NIR (near infra-red) radiation of the spectrum [17,18]. Combining the reflectance in different spectral bands, phytosanitary differences can be highlighted. Mathematical relations using the reflectance in different spectral bands, called vegetation indices, have been created, and they provide information on the state of the health of the plants [17,18,19,20].
Remote sensing has already been used for phytosanitary monitoring to minimize crop loss. Besides that, it can forecast favorable conditions that are responsible for pest outbreaks caused by climate warming, thus contributing to pest control optimization [21].
This study presents the methodology for early detection of infestations of tiger longicorn beetle, X. chinensis, in mulberries at the Agricultural University of Athens using remote sensing data and machine-learning models. Multispectral data were captured by attaching a multispectral sensor to a UAV. Mean NDVI, mean NDRE, mean EVI, and tree crown area were calculated and used as predictors in machine learning models, along with mean temperature data and data of the adult emergence holes, to determine whether detection of the infestation by this pest can be successfully achieved.

2. Materials and Methods

2.1. UAV Flight Schedule and On-Site Observations

The study was conducted during 2022 and 2023 in the mulberry orchards of the Agricultural University of Athens. The flight schedule was devised following the biological cycle of X. chinensis, targeting the stages of adult emergence and active larvae. Late spring and early summer corresponded with pupation and adult emergence, marked by the appearance of emergence holes. Summer involved reproduction and oviposition, while late summer and autumn corresponded to the active larval phase, characterized by severe infestation symptoms like weakening and drying of leaves and branches due to sap flow disruption.
Considering the biological cycle and the appearance of the symptoms, four aerial missions with UAV were executed, with two flights per year (July and September of 2022, June and September of 2023). The first flight of each year coincided with the pivotal stage of adult emergence, while the second aligned with the active larvae. Flights were conducted at 13:00 to ensure optimal lighting and minimize shadows. In addition, during the midday hours, the maximum daily temperature was recorded, which increases the evapotranspiration of the plant, amplifying stress symptoms in mulberry trees.
The UAV used was the 2021 model “Mera” (UcanDrone S.A., Koropi Attica, Greece), an EASA Class C2 quadcopter designed for aerial photography and mapping. The RedEdge-MX multispectral camera manufactured by MicaSense (AgEagle Aerial Systems Inc., Wichita, KS, USA) was attached to the “Mera” UAV to acquire the multispectral data from the mulberry trees (Figure 4). UAV data were preferred over satellite imagery due to the high cost and low accuracy of the latter. UAVs offer real-time capabilities, cost efficiency, precise data collection, and extensive data acquisition [22]. All the flight missions were designed and executed in the Mission Planner program (ArduPilot Development Team, New York, NY, USA).
Flight parameters for the four missions included an altitude of 70 m, a speed of 5 m/s, and an 80% image overlap in both forward and backward directions. The RedEdge MX camera (AgEagle Aerial Systems Inc., Wichita, KS, USA) captured multispectral images at one frame every 2 s. All flights were conducted by a certified A2 category pilot, adhering to existing legislation.
Field scouting in the mulberry orchard occurred concurrently with each flight, aiming to observe and document the health status of individual trees, identify potential disease and pest symptoms, and document prevalent weed species. The field scouting extended beyond typical pest and disease considerations to encompass various stress factors affecting the mulberry trees, such as symptoms of nutrient deficiencies. During scouting sessions, adult specimens of X. chinensis, adult emergence holes, galleries, and cracks on the trunk were observed. The emergence holes were tallied for each tree during on-site sessions.
The health status of mulberry trees was categorized into two classes during on-site observations:
  • Healthy tree: maintaining full turgor pressure in leaves during midday, showing no discernible indications of debilitation or abnormal growth.
  • Tree with X. chinensis infestation: displaying generalized weakening, dried shoots, yellow leaves, and adult emergence holes.

2.2. Multispectral Data Processing

Multispectral imagery was processed using Metashape (Version 1.7.3) (Agisoft LLC., St. Petersburg, Russia) for photogrammetric processing and 3D model generation. Two-dimensional pre-georeferenced images were imported, and image alignment discerned shared points for precise relative positioning, resulting in a Dense Point Cloud (X, Y, Z coordinates).
The Dense Point Cloud facilitated the generation of a Digital Surface Model (DSM), representing the Earth’s surface and reflective features. The DSM is a comprehensive representation of the Earth’s surface, encompassing all reflective elements, whether natural or man-made. These elements include vegetation, water bodies, buildings, roads, bridges, and more. The DSM serves as a depiction of the Earth’s topography, providing elevation data for both terrestrial and aquatic features, as well as vegetative and man-made components. Additionally, each pixel of the DSM is embedded with georeferencing, enhancing its geographical and spatial accuracy.
Utilizing the Dense Point Cloud once more, the Digital Terrain Model (DTM) is generated, which delineates the Earth’s surface, providing elevation information pertaining to the topographic features, excluding both natural vegetation and man-made structures. This model represents the elevation characteristics of the bare terrain while imparting additional topographical information, including slope, orientation, and both horizontal and vertical curvature of the terrain.
Orthomosaic maps (Figure 5), created from the DSM and DTM, comprised distortion-free orthophotos for detailed area representation. These maps are composed of smaller orthophotos and are constructed utilizing the spectral bands of the visible spectrum of electromagnetic radiation, specifically the Red, Green, and Blue (RGB). Each small orthophoto is precisely georeferenced, resulting in each pixel in the final map corresponding to a specific geographic point on the Earth’s surface with well-defined coordinates (X, Y, Z). The orthophotos essentially represent aerial images that have undergone correction processes to eliminate distortions induced by various factors, including lens characteristics, capture angles, and the Earth’s topographical variations. Therefore, the orthomosaic maps provide a highly detailed and accurate representation of the Earth’s surface, encompassing both natural and man-made features, all presented with high spatial resolution.
The DSM, DTM, and orthomosaic maps were integrated into QGIS (Version 3.32.0) (QGIS Development Team, London, UK) for further processing and map creation. QGIS enhanced the exhibition and representation of data, making geospatial information more accessible and interpretable.
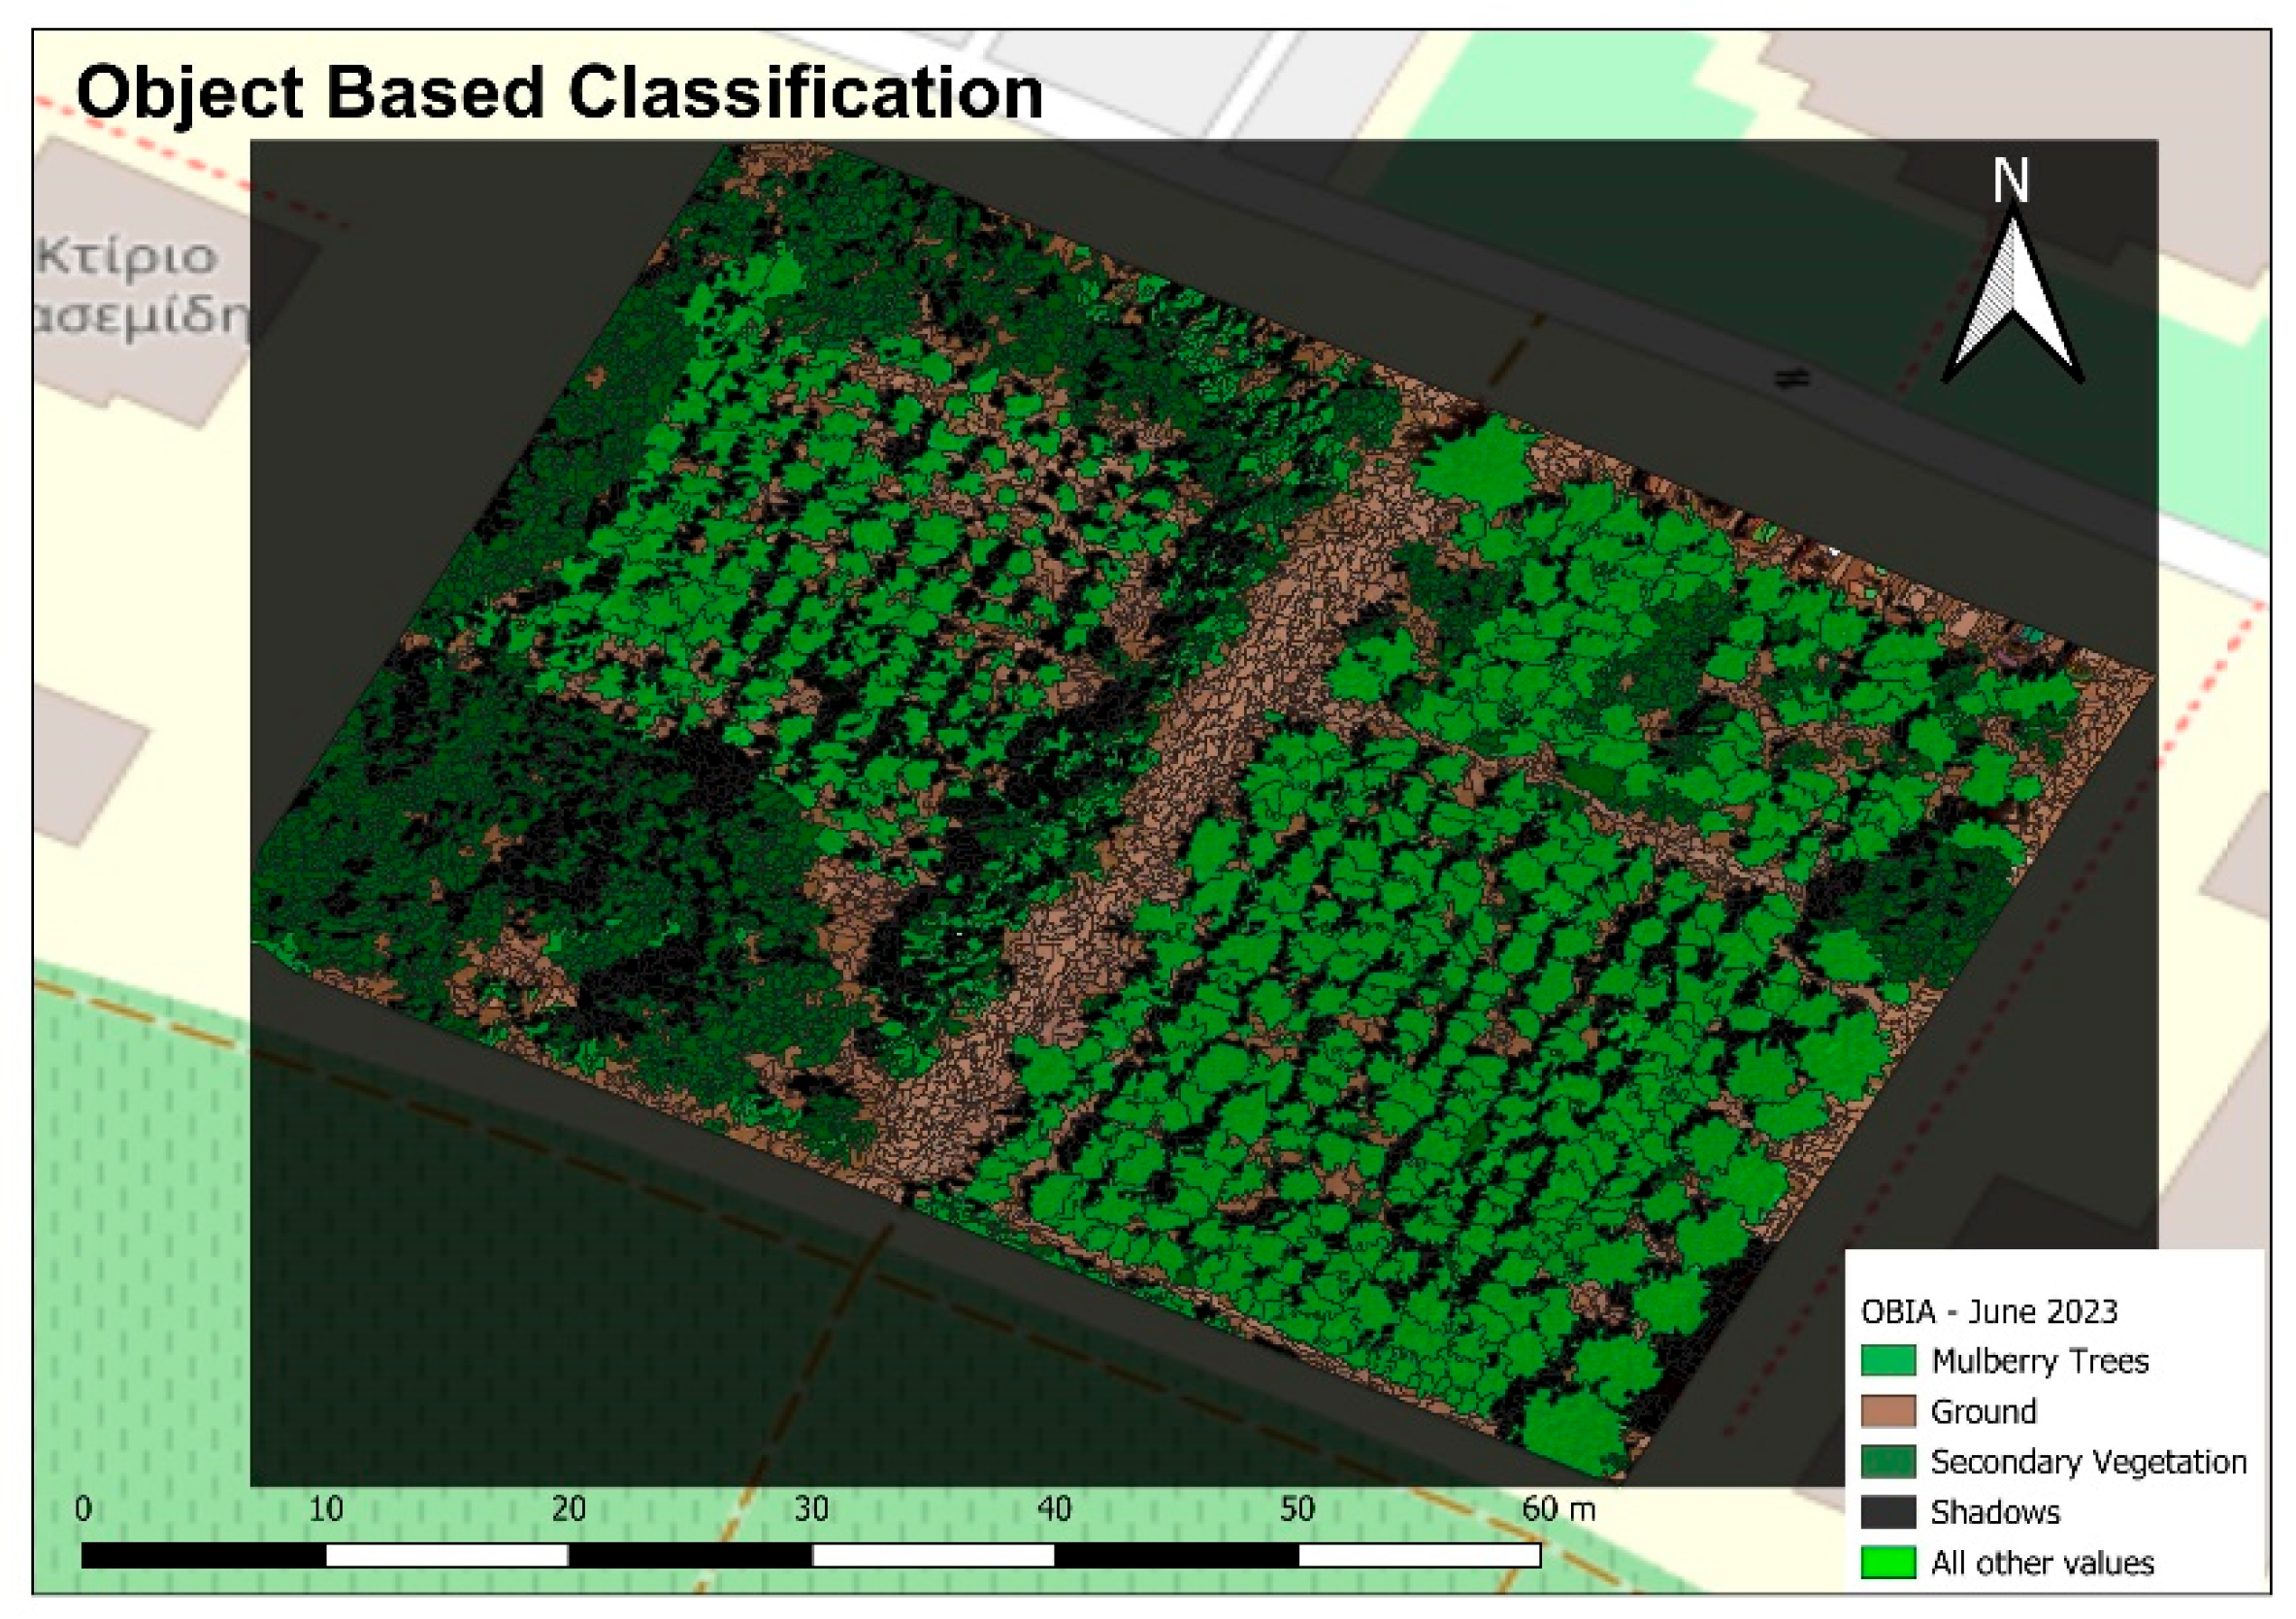
For mulberry tree health assessment, the orthomosaic map was analyzed using Object-Based Classification (OBIA) in the QGIS Orfeo Toolbox (Figure 6). Three vegetation indices (VIs) were applied: Normalized Difference Vegetation Index (NDVI), Normalized Difference Red Edge Index (NDRE), and Enhanced Vegetation Index (EVI). These indices provided insights into tree health based on spectral characteristics.
The NDVI is derived through the mathematical expression [23,24,25]:
NDVI = (RNIR − RRED)/(RNIR + RRED)
In this equation, RNIR represents the reflection of solar radiation within the near infrared band, at 842 nm, while RRED expresses the reflection of solar radiation within the red band, specifically at 668 nm. The NDVI values resulting from this computation range from −1 to +1. Negative values indicate non-vegetated surfaces, encompassing areas such as bare ground, rocky or sandy terrains, water bodies, and urban spaces. A zero NDVI denotes very sparse or stressed vegetation, including dried or aged plants. Positive NDVI values approaching +1 correlate with increasingly healthier and more robust vegetation. Conversely, low positive values suggest vegetation that is sparse or compromised. This calculated NDVI serves as a quantitative metric, offering a precise and standardized measure for the evaluation of vegetation health and distribution based on the unique spectral characteristics of the near infrared and red bands.
The NDRE is calculated using the mathematical formula [24,26,27]:
NDRE = (RNIR − RRED EDGE)/(RNIR + RRED EDGE)
In this formula, RNIR denotes the reflection of solar radiation within the NIR band, specifically at 842 nm, while RRED EDGE signifies the reflection of solar radiation within the red edge band, at 717 nm. The NDRE also ranges from −1 to +1. Higher values indicate good health of the vegetation, while lower NDRE values indicate stressed vegetation.
The EVI is computed through the mathematical expression [28]:
EVI = 2.5 × (RNIR − RRED/(RNIR + 6 × RRED − 7.5 × RBLUE) + 1)
In this mathematical expression, RNIR represents the reflection of solar radiation within the near infrared band, at 842 nm and RRED represents the reflection of solar radiation within the red band, at 668 nm. The blue represents the reflection of solar radiation within the blue band, at 475 nm. This index is suitable for high biomass areas characterized by a dense canopy. The range of values for the EVI spans from −1 to 1, with values indicative of robust vegetation within the range of 0.20 to 0.80.

2.3. Statistical Analysis

Machine learning algorithms were used to construct a predictive model for the identification of the tiger longicorn beetle infestation, X. chinensis, by considering variables such as mean NDVI, mean NDRE, mean EVI, mean temperature, number of adult emergence holes, and the tree crown area (canopy). For the performance evaluation of the model on the aforementioned independent data, preprocessing was performed on the variable data, such as cleaning and scaling. The evaluated models were the following: Random Forest, Decision Tree, Gradient Boosting, Multi-Layer Perceptron, K-Nearest Neighbors, and Naïve Bayes. Training was performed for each model in 70% of the observations, utilizing the remaining 30% of the observations for validation purposes. The performance of the models was evaluated using the following metrics: accuracy, precision, recall, and F-measure.
Accuracy was calculated to determine which model was the most appropriate for utilization in the present study and is defined as follows [29,30,31]:
Accuracy = TP + TN/TP + TN + FP + FN
where TP = true positives, TN = true negatives, FP = false positives, and FN = false negatives.
Precision measures the accuracy of positive predictions made by a model and is defined as [29,30,31]:
Precision = TP/TP + FP
Recall is a metric that measures the ability of a model to capture all the relevant instances of a particular class and is defined as [29,30,31]:
Recall = TP/TP + FN
The F-measure is a metric that combines both precision and recall and is defined as [29,30,31]:
F-measure = 2 × ((Precision × Recall)/(Precision + Recall))
Models were constructed and evaluated using Python (Version 3.10.10) and the libraries Pandas (Version 1.5.1), Scikit-learn (Version 1.1.3), Matplotlib (Version 3.6.2), Numpy (Version 1.23.4), Seaborn (Version 0.13.0), and XGBoost (Version 2.0.1).
The Decision Tree (DT) algorithm in machine learning constructs a tree-like model by recursively selecting the most informative features to partition the input data. It aims to maximize information gain for classification. The process continues until a predefined stopping criterion is met, producing a hierarchical structure of decision rules. Decision trees are interpretable and handle various data types well but may be prone to overfitting, which can be addressed through techniques like pruning [32].
Random Forest (RF) is a supervised machine learning classifier that uses multiple decision trees to make predictions. It is an ensemble learning method that corrects for decision trees’ tendency to overfit their training set. Random Forest is widely used in pest and disease prediction due to its excellent classification results and fast implementation [33,34].
Gradient Boosting (GB) is an ensemble method that iteratively improves predictive performance by combining weak learners, usually decision trees, and correcting errors made by the ensemble. It uses the negative gradient of the loss function to guide the learning process [35].
Naïve Bayes (NB) is a probabilistic classification algorithm that uses Bayes’ theorem with a simplified assumption of feature independence. It calculates class probabilities based on prior information and likelihood of observing features and assigns new instances to the class with the highest probability [36].
Multi-Layer Perceptron (MLP) is a neural network used in machine learning, consisting of input, hidden, and output layers, with nodes applying activation functions to weighted inputs. Trained via backpropagation and optimized using algorithms like stochastic gradient descent, MLPs excel in tasks like image recognition by capturing complex patterns in data [37].
K-Nearest Neighbors (KNN) is a basic machine-learning algorithm for classification and regression. It predicts the outcome for a new data point by considering the majority or average of its K closest neighbors in the training dataset, using a chosen distance metric like Euclidean distance. KNN is a simple and effective algorithm, but its performance can be sensitive to the choice of K and distance metric [38].

3. Results

3.1. Descriptive Statistics

Table 1 provides a summary of the descriptive statistics related to the predictor variables in this study, including the number of holes, mean NDVI, mean NDRE, mean EVI, mean T, and canopy size (m2). Upon an initial inspection of variable values, conducted through both graphical representations and statistical tests, it was observed that there were no missing, duplicate, or extreme outlier values (Table 1).

3.2. Correlation Analysis

Figure 7 illustrates the correlation matrix, showing the relationships among the variables. The most notable statistically significant correlation was identified between the variables mean NDVI and mean NDRE (r = 0.74, p-value < 0.001). Following this, the Pearson correlation coefficients between the canopy and mean NDVI and mean NDRE were 0.27 and 0.25, respectively, both demonstrating statistical significance (p-value < 0.001). The absence of significantly strong correlations (greater than 0.9) among the predictors in a machine learning context is crucial because such strong correlations can lead to multicollinearity, which can negatively impact the performance of algorithms like Random Forest (Figure 7).

3.3. Model Performance

Figure 8 displays the metrics of the various algorithms employed. In terms of accuracy, the Random Forest model demonstrated the highest performance at 0.86, closely followed by the Gradient Boosting model with an accuracy of 0.85. The Decision Tree and Multi-Layer Perceptron models achieved accuracy values of 0.82 and 0.79, respectively. For the F-1 score, both the Random Forest and Gradient Boosting models achieved the top score at 0.82, while the Decision Tree model scored 0.77. Regarding precision, the Random Forest and Gradient Boosting models led with the highest values of 0.84, followed by the Decision Tree model at 0.80. According to the recall metric, the Random Forest model attained the highest value at 0.81, followed by the Gradient Boosting and Decision Tree models at 0.80 and 0.79, respectively. The K-nearest Neighbors and Naïve Bayes models exhibited the lowest metric values compared to the other models (Figure 8).

3.4. Variable Importance

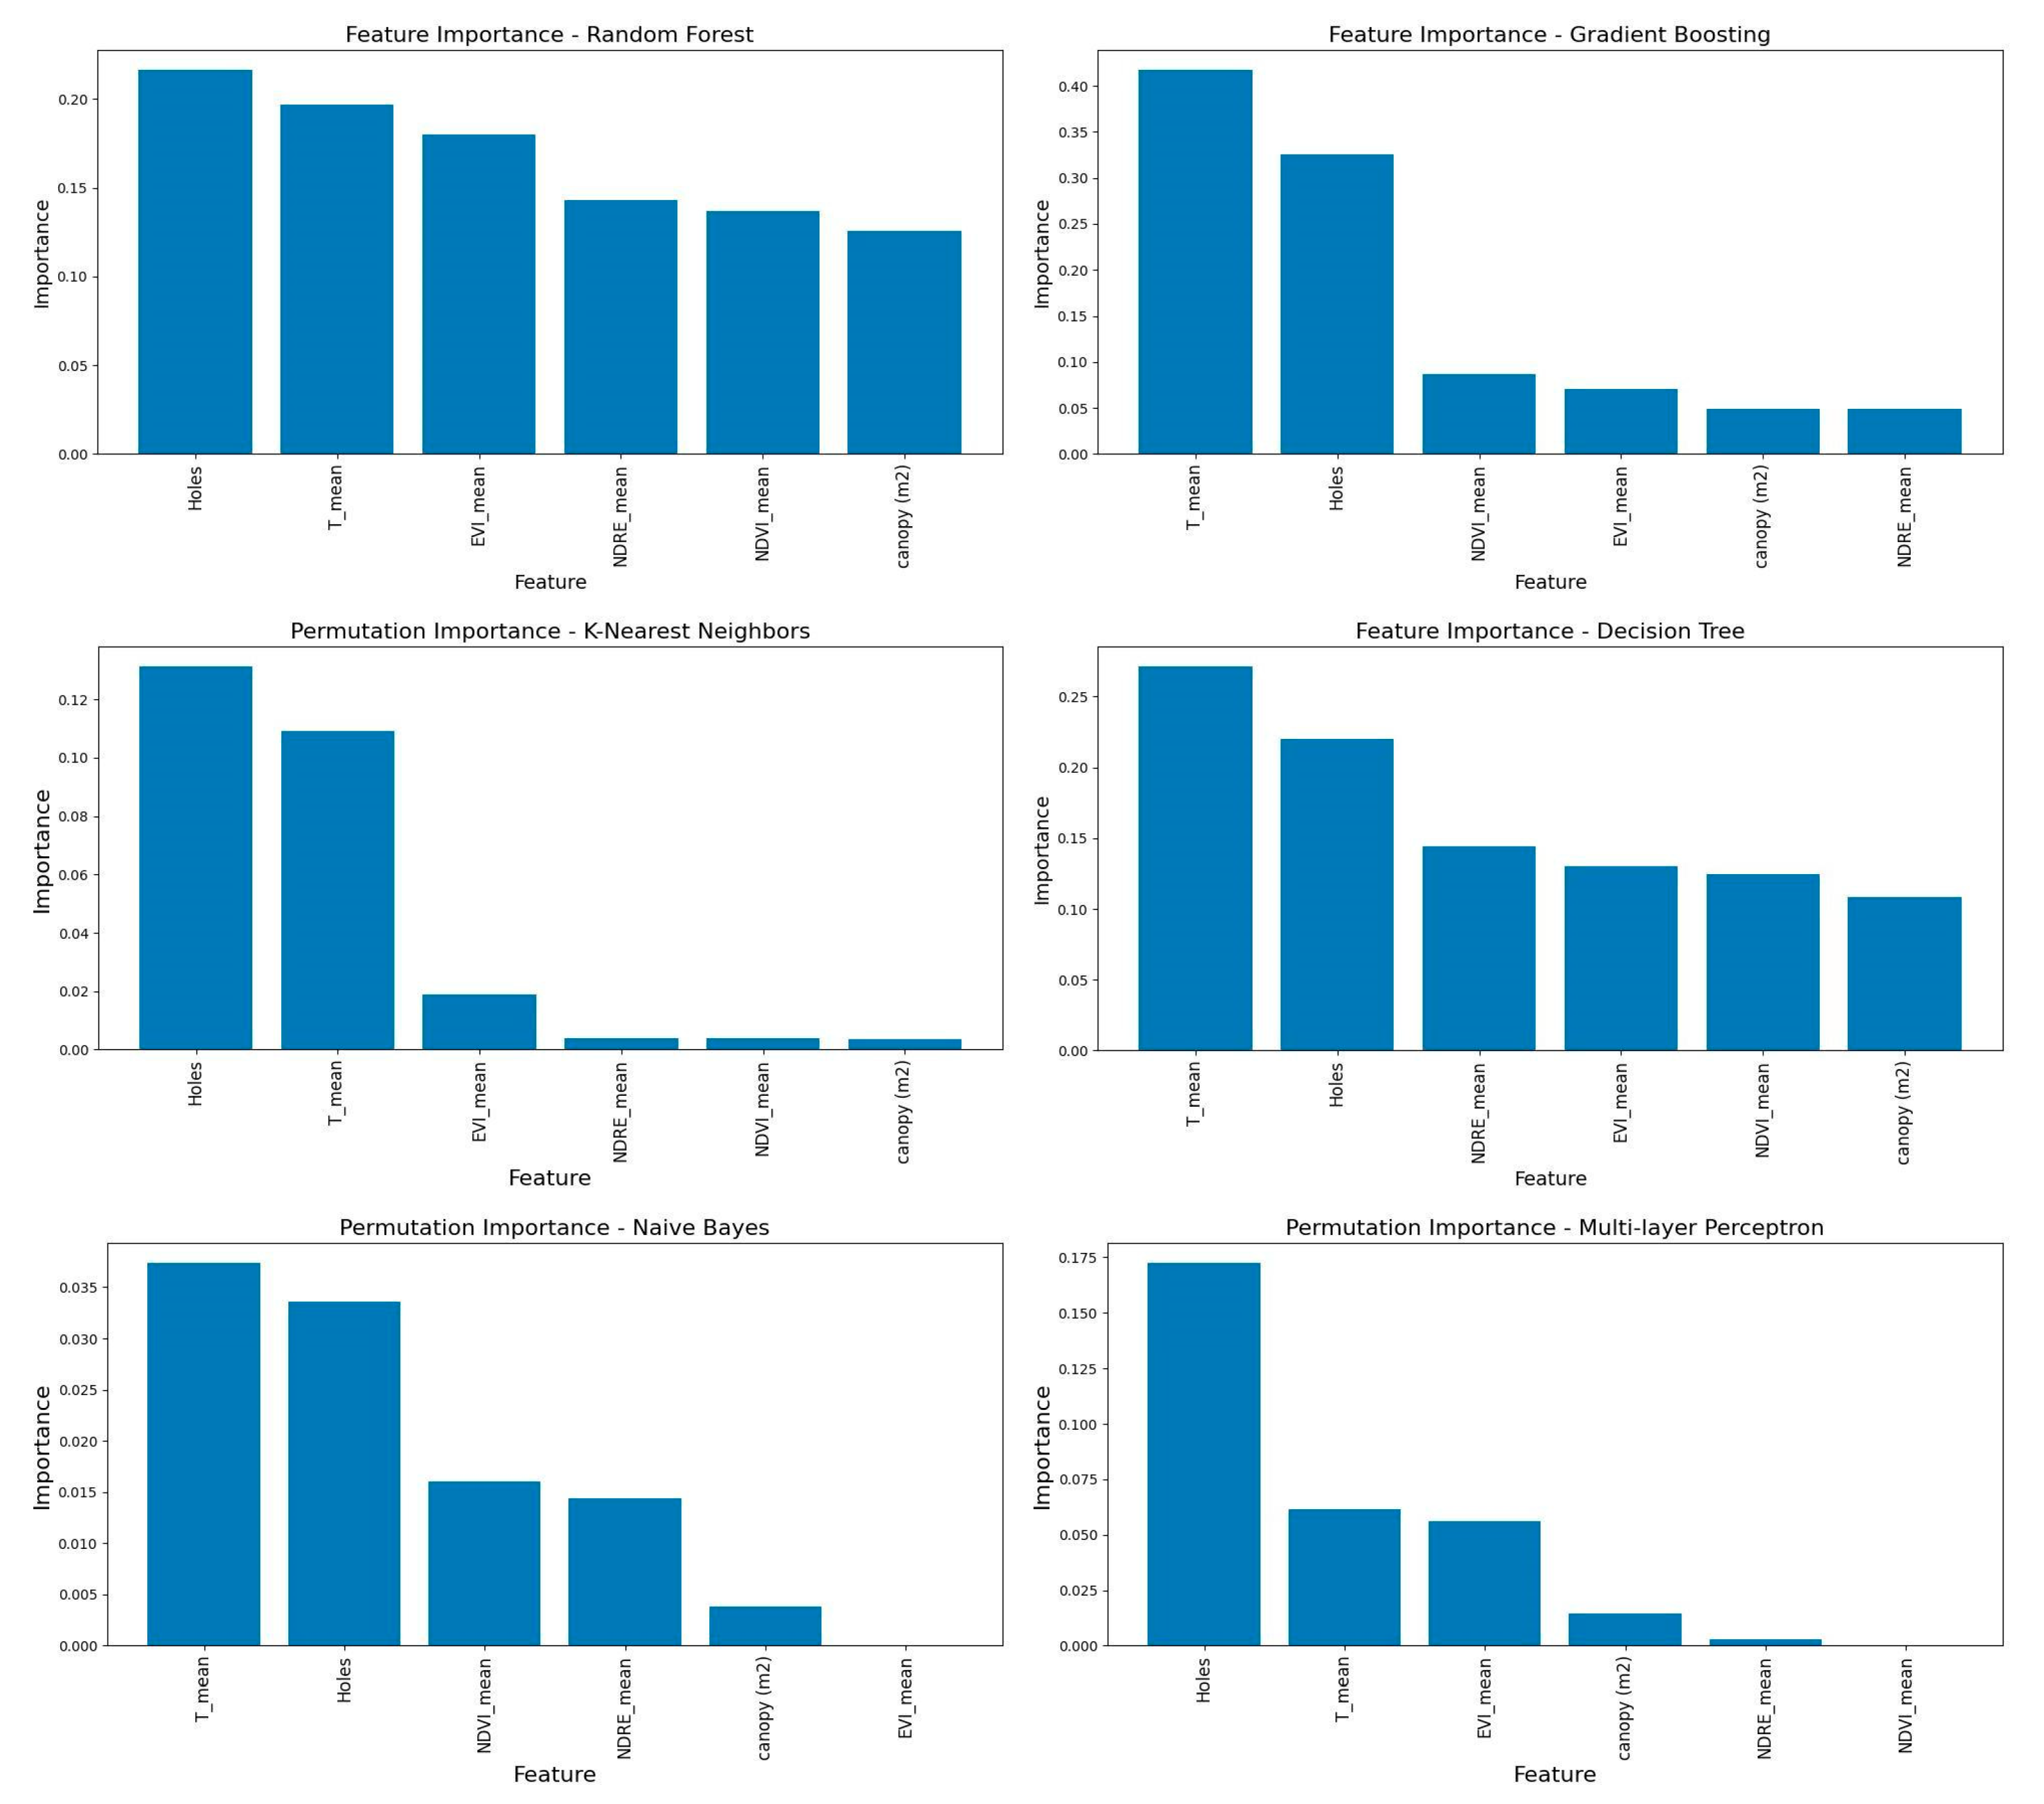
The plots in Figure 9 suggest that the number of holes and mean temperature are the most crucial explanatory variables across all six models. When examining the Random Forest model, a significant degree of importance is attributed to all the variables used in the prediction, in contrast to the Gradient Boosting model, where only the number of holes and mean temperature were considered particularly important (Figure 9).

3.5. Confusion Matrices

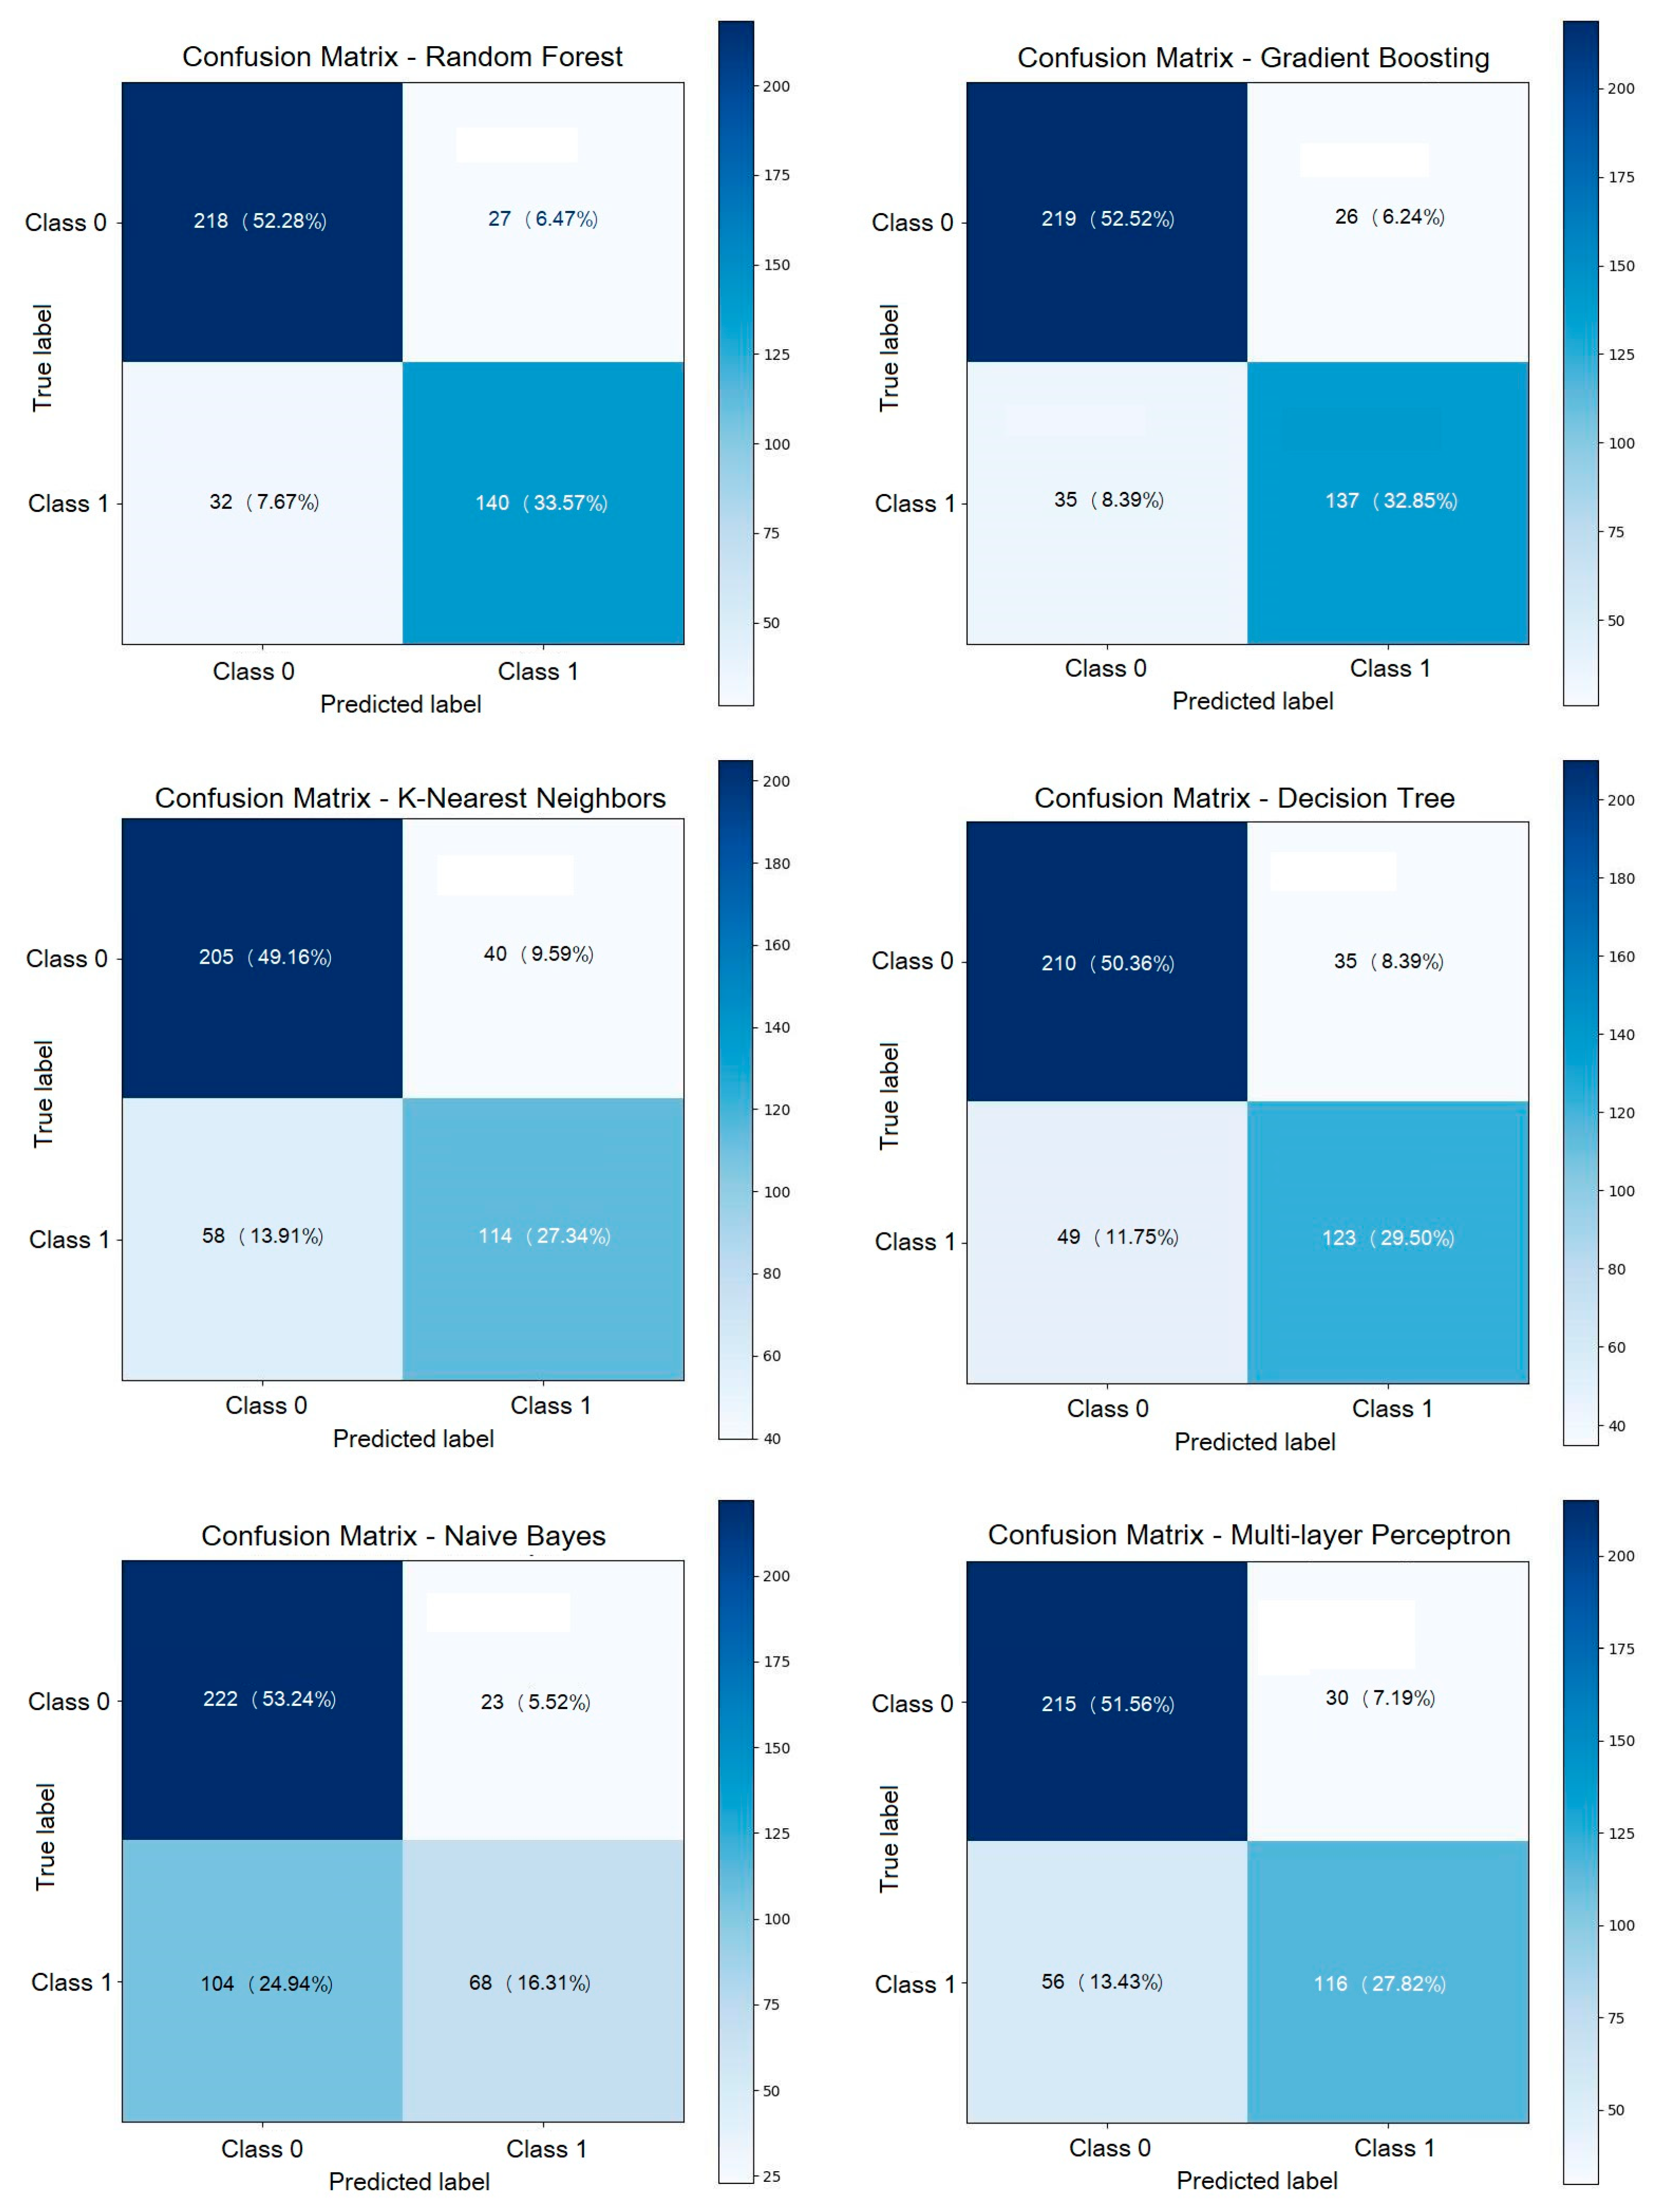
To assess the performance of the classification model, confusion matrices were employed (Figure 10). In these matrices, we observe that the percentages of the evaluated models ranged for true negatives from 49.16 to 53.24, while true positives ranged from 16.31 to 33.57. In both cases, the Random Forest and Gradient Boosting models exhibited the highest percentages.

3.6. ROC Curves

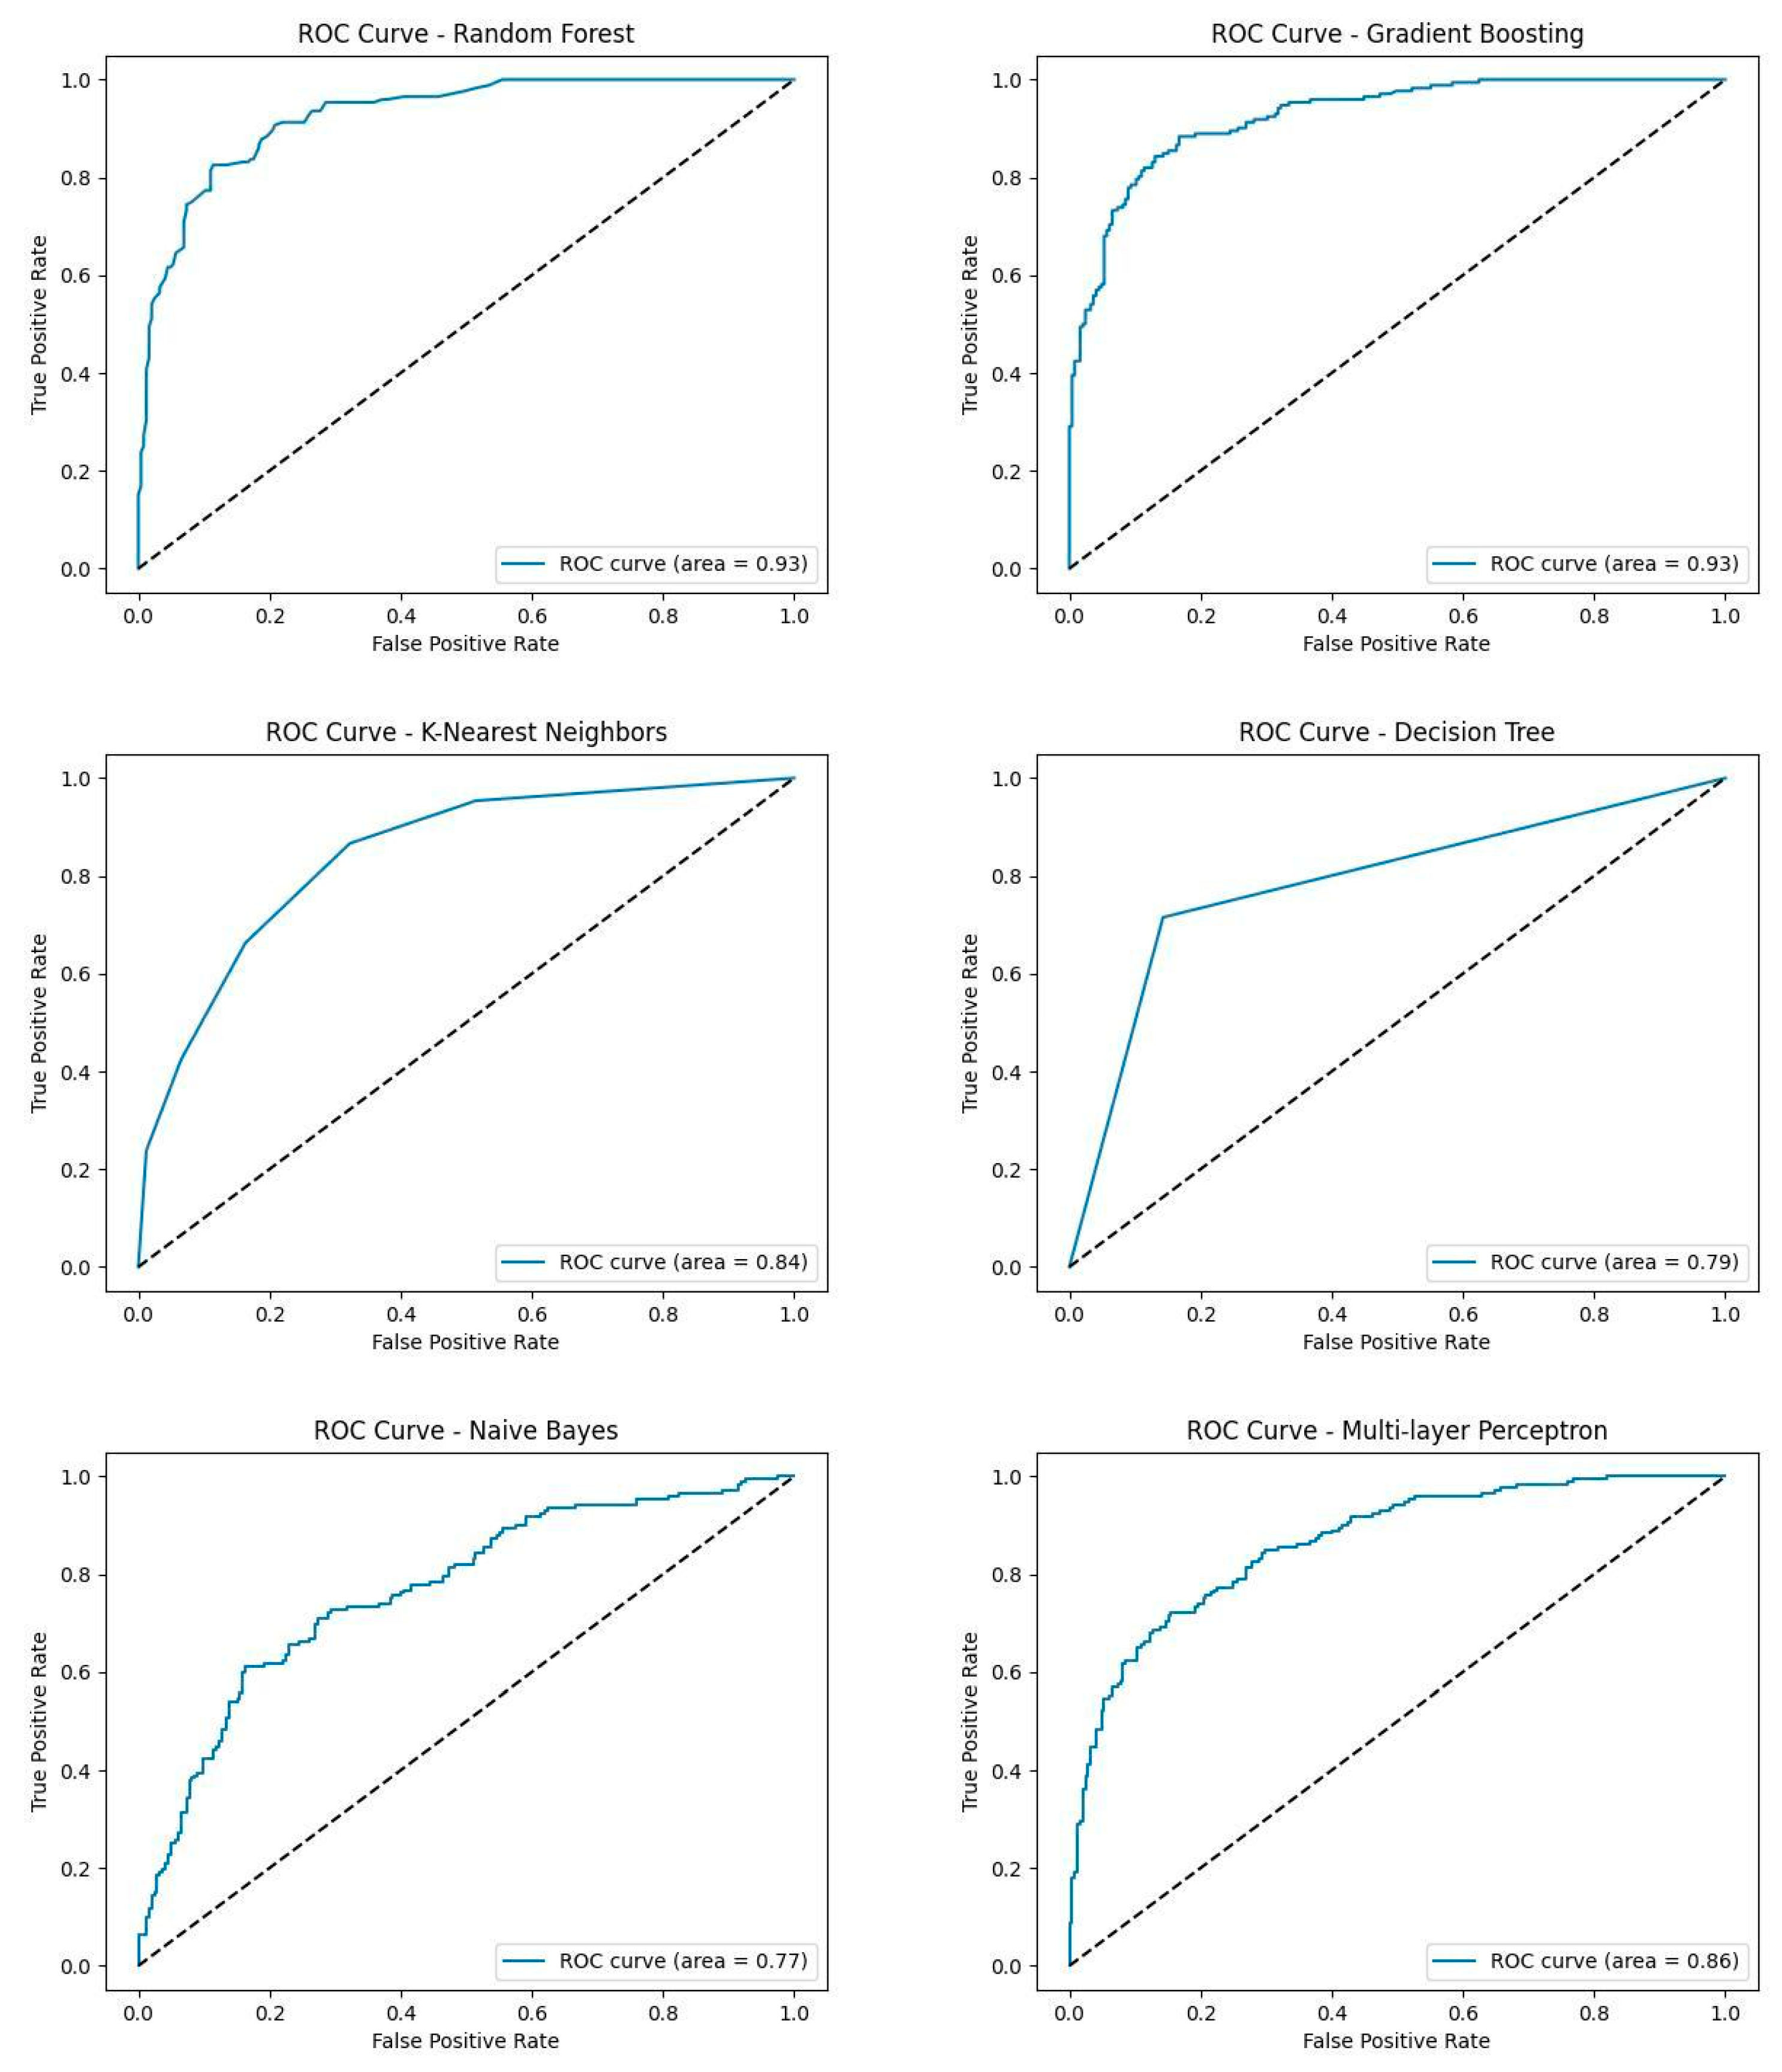
To assess and compare the performance of classifiers, Receiving Operating Characteristic (ROC) curves are employed (Figure 11). The closer the ROC curve is to the upper left corner of the graph, the higher the accuracy of the test because the greater the area underneath it, with the ideal ROC curve having Area Under the Curve (AUC) = 0.1. The dotted line shows the ROC curve of a random classification so below this line, the performance of the test is worse than random. In the graphical plots, it is apparent that the Random Forest and Gradient Boosting models demonstrated the highest area with a value of 0.93, followed by the Multi-Layer Perceptron and K-Nearest Neighbors models with areas of 0.86 and 0.84, respectively. The Decision Tree and Naïve Bayes models exhibit the smallest areas with 0.79 and 0.77, respectively.

4. Discussion

According to the Annual Global Climate Report of the National Oceanic and Atmospheric Administration (NOAA), the average global surface temperature in 2023 was the highest since 1850 and 1.18 °C above the average of the 20th century. In Europe, 2023 was the second warmest year on record. These increased temperatures were often accompanied by extreme weather phenomena, such as hurricanes, wildfires, and cyclones [39]. This ever-deteriorating situation has unpredictable effects on ecosystems and their organisms. The effects on crops and their pests are complex and far-reaching. The geographical distribution and biological cycle of both crops, crop pests, and their natural enemies, as well as their multiple interactions, will become increasingly difficult to predict to prevent future infestations and outbreaks [1,11,12].
Moreover, pests that complete most of their life cycle within their hosts, such as woodborers, are even more challenging to detect in time before they do irreversible damage to crops and spread significantly over an area. The tiger longicorn beetle, X. chinensis, is one such insect that attacks mulberry trees, destroying their vascular bundles while they are feeding on them [4,5,6,8]. Considering that this insect has invaded the European continent, attacking mulberries in four European Mediterranean countries and causing the death of many trees, early detection is vital to limit its spread across Europe and to control it in time.
Phytosanitary surveillance has been facilitated, expedited, and become more effective owing to the utilization of remote sensing technology. Through remote sensing, changes in absorption and reflectance of the electromagnetic radiance by the plants can be detected even before visible symptoms of the infestation appear, minimizing crop losses [17,21]. Remote sensing has proven effective in early pest detection by identifying subtle changes in plant health indicators such as chlorophyll content and water stress [16,24].
The prediction of the existence of infestation by X. chinensis in mulberries utilizing multispectral data, deriving from UAV remote sensing, was the aim of the present study. Six machine learning models were used for the detection of the infestation, with Random Forest and Gradient Boosting models having the best performance with slight differences. Random Forest has proven to be a very effective model for the prediction of pest infestations, achieving high overall performance [16,40,41,42,43].
In this study, mean temperature and the number of adult emergence holes were crucial factors for all six prediction models. This emphasizes that ground truth data are crucial for the construction of a prediction model to achieve high classification accuracy. Adult emergence holes are a symptom of either an ongoing or a past infestation by X. chinensis. Like other woodboring pest infestations, such as by Capnodis tenebrionis (Coleoptera: Buprestidae), where weakened or already infested trees are more susceptible to new infestations by woodborers, infestations by X. chinensis are also more likely to be repeated in trees that have been previously infected by the insect [44]. Therefore, the results show that even past adult emergence hole data can be used as an important predictor for future infestations.
Remote sensing data from which vegetation indices were computed were also important factors for the prediction models. Among the models, EVI was the most important vegetation index predictor in three of them (Random Forest, K-Nearest Neighbors, Multi-Layer Perceptron), NDVI was the second most important in two of the models (Gradient Boosting, Naïve Bayes), and NDRE was the most important vegetation index predictor only in one model (Decision Tree). The main disadvantage of NDVI is its saturation in areas with high biomass and dense vegetation, which does not occur with EVI, making it more useful in such areas like the one in this study [45,46]. NDRE is more useful for detecting subtle changes in chlorophyll content, but NDVI is more efficient in large areas with dense vegetation [47]. In the Random Forest model, all the vegetation indices (EVI, NDVI, and NDRE) played an important role, without significant differences from the mean temperature and adult emergence hole factors. Moreover, the factor of tree crown area (canopy) had few differences from the NDVI factor. NDVI is correlated with crop biomass, so it makes sense that if NDVI plays an important role as a predictor in a model, the same will apply to the tree crown area (m2 of canopy) [40].
UAV remote sensing data have been used successfully for the detection of infestation by other woodborers or wood-eating pests in previous studies, mostly for pest infestations in forests [15,42,48,49,50]. Unfortunately, there are no studies about X. chinensis, which seems to be a rising threat to mulberry trees in Mediterranean countries of Europe. This study fills a crucial gap in the literature and provides a foundation for further research into the early detection and control of this invasive pest.
Climate change unpredictably affects the geographical distribution, life cycle, and hosts of many pests. Hence, frequent, easy, and quick monitoring of plants is more essential than ever. Remote sensing is a promising technology that can be used for the early detection of pest infestations and timely control of the spread of the pests. This approach aligns with the principles of Integrated Pest Management (IPM), which aims to reduce pesticide use and mitigate environmental impact by facilitating early intervention and precise pest control measures [17,21].

5. Conclusions

In summary, this study aimed to detect infestations by X. chinensis in mulberries using UAV remote sensing multispectral data and six classification models. The key factors identified were mean temperature, number of adult emergence holes, and mean EVI. Among the models, Random Forest demonstrated the best performance, closely followed by Gradient Boosting. Our findings confirm that classifying healthy and infested mulberry trees is feasible through remote sensing data. However, the inclusion of ground truth data is crucial for achieving high classification accuracy. Models such as Random Forest and Gradient Boosting achieved high overall performance (0.93), making them ideal for this application. Early detection of pest infestations facilitates timely interventions, leading to reduced pesticide use and mitigating negative environmental impacts, aligning with the principles of Integrated Pest Management (IPM). This study lays important groundwork for the use of UAV remote sensing in pest detection, but further research is needed to refine these methods and differentiate between various pest infestations more accurately.

Author Contributions

Conceptualization, A.T.; methodology, C.P., E.A. and A.A.; software, E.A., C.P. and A.A.; validation, C.P. and E.A.; formal analysis, A.K., A.A. and E.A.; investigation, E.A., A.A. and C.P.; data curation, C.P., E.A. and A.A.; writing—original draft preparation, C.P., E.A., A.A., M.S. and A.T.; writing—review and editing, C.P., E.A., A.A. and A.T.; visualization, C.P. and E.A.; supervision, A.T.; project administration, A.T. and E.A. All authors have read and agreed to the published version of the manuscript.

Funding

This research received no external funding.

Data Availability Statement

The data presented in this study are available on request from the corresponding author. The data are not publicly available due to also forming part of an ongoing study.

Conflicts of Interest

The authors declare no conflicts of interest.

References

  1. Stange, E.E.; Ayres, M.P. Climate Change Impacts: Insects; Wiley: Hoboken, NJ, USA, 2010. [Google Scholar] [CrossRef]
  2. Gillooly, J.; West, G.; Savage, V.; Brown, J. Effects of Size and Temperature on Developmental Time. Nature 2002, 417, 70–73. [Google Scholar] [CrossRef] [PubMed]
  3. Sharpe, P.J.H.; DeMichele, D.W. Reaction Kinetics of Poikilotherm Development. J. Theor. Biol. 1977, 64, 649–670. [Google Scholar] [CrossRef]
  4. Kavallieratos, N.G.; Boukouvala, M.C.; Skourti, A.; Nika, E.P.; Papadoulis, G.T. Trunk Injection with Insecticides Manages Xylotrechus chinensis (Chevrolat) (Coleoptera: Carambycidae). Insects 2022, 13, 1106. [Google Scholar] [CrossRef]
  5. Leivadara, E.; Leivadaras, I.; Vontas, I.; Trichas, A.; Simoglou, K.; Roditakis, E.; Avtzis, D.N. First Record of Xylotrechus chinensis (Coleoptera: Cerambycidae) in Greece and in the EPPO Region. EPPO Bull. 2018, 48, 277–280. [Google Scholar] [CrossRef]
  6. Sarto i Monteys, V.; Torras i Tutusaus, G. A New Alien Invasive Longhorn Beetle, Xylotrechus chinensis (Cerambycidae), Is Infesting Mullberries in Catalonia (Spain). Insects 2018, 9, 52. [Google Scholar] [CrossRef]
  7. Bragard, C.; Baptista, P.; Chatzivassiliou, E.; Di Serio, F.; Gonthier, P.; Jaques Miret, J.A.; Justesen, A.F.; Magnusson, C.S.; Milonas, P.; Navas-Cortes, J.A.; et al. Pest Categorisation of Xylotrechus chinensis. EFSA J. 2021, 19, e07022. [Google Scholar] [CrossRef]
  8. Sarto i Monteys, V.; Costa Ribes, A.; Savin, I. The Invasive Longhorn Beetle Xylotrechus chinensis, Pest of Mullberries, in Europe: Study on Its Local Spread and Efficacy of Abamectin Control. PLoS ONE 2021, 16, e0245527. [Google Scholar] [CrossRef] [PubMed]
  9. Logan, J.A.; Régnière, J.; Powell, J.A. Assessing the Impacts of Global Warming on Forest Pest Dynamics. Front. Ecol. Environ. 2003, 1, 130–137. [Google Scholar] [CrossRef]
  10. Trần, J.K.; Ylioja, T.; Billings, R.F.; Régnière, J.; Ayres, M.P. Impact Of Minimum Winter Temperatures On The Population Dynamics of Dendroctonus frontalis. Ecol. Appl. 2007, 17, 882–899. [Google Scholar] [CrossRef]
  11. Peñuelas, J.; Filella, I.; Comas, P. Changed Plant and Animal Life Cycles from 1952 to 2000 in the Mediterranean Region. Glob. Chang. Biol. 2002, 8, 531–544. [Google Scholar] [CrossRef]
  12. Sykes, M.T. Climate Change Impacts: Vegetation. In Encyclopedia of Life Sciences; Wiley: Hoboken, NJ, USA, 2009; ISBN 978-0-470-01617-6. [Google Scholar]
  13. McDowell, N.G. Mechanisms Linking Drought, Hydraulics, Carbon Metabolism, and Vegetation Mortality. Plant Physiol. 2011, 155, 1051–1059. [Google Scholar] [CrossRef] [PubMed]
  14. Faccoli, M. Effect of Weather on Ips typographus (Coleoptera Curculionidae) Phenology, Voltinism, and Associated Spruce Mortality in the Southeastern Alps. Environ. Entomol. 2009, 38, 307–316. [Google Scholar] [CrossRef]
  15. Lehmann, J.R.; Nieberding, F.; Prinz, T.; Knoth, C. Analysis of Unmanned Aerial System-Based CIR Images in Forestry—A New Perspective to Monitor Pest Infestation Levels. Forests 2015, 6, 594–612. [Google Scholar] [CrossRef]
  16. Luo, Y.; Huang, H.; Roques, A. Early Monitoring of Forest Wood-Boring Pests with Remote Sensing. Annu. Rev. Entomol. 2023, 68, 277–298. [Google Scholar] [CrossRef]
  17. Iost Filho, F.H.; Heldens, W.B.; Kong, Z.; De Lange, E.S. Drones: Innovative Technology for Use in Precision Pest Management. J. Econ. Entomol. 2020, 113, 1–25. [Google Scholar] [CrossRef]
  18. Roman, A.; Ursu, T. Multispectral Satellite Imagery and Airborne Laser Scanning Techniques for the Detection of Archaeological Vegetation Marks. In Landscape Archaeology on the Northern Frontier of the Roman Empire at Porolissum: An Interdisciplinary Research Project; Mega Publishing House: Cluj-Napoca, Romania, 2016; pp. 141–152. [Google Scholar]
  19. Acharya, M.C.; Thapa, R.B. Remote Sensing and Its Applications in Agricultural Pest Management. J. Agric. Environ. 2015, 16, 43–61. [Google Scholar] [CrossRef]
  20. Wójtowicz, M.; Wójtowicz, A.; Piekarczyk, J. Application in Remote Sensing Methods in Agriculture. Commun. Biometry Crop Sci. 2016, 11, 31–50. [Google Scholar]
  21. Prasad, Y.G.; Prabhakar, M. Pest Monitoring and Forecasting. In Integrated Pest Management: Principles and Practice; Abrol, D.P., Shankar, U., Eds.; CABI: Wallingford, UK, 2012; pp. 41–57. ISBN 978-1-84593-808-6. [Google Scholar]
  22. Yue, J.; Lei, T.; Li, C.; Zhu, J. The Application of Unmanned Aerial Vehicle Remote Sensing in Quickly Monitoring Crop Pests. Intell. Autom. Soft Comput. 2012, 18, 1043–1052. [Google Scholar] [CrossRef]
  23. Bannari, A.; Morin, D.; Bonn, F.; Huete, A. A Review of Vegetation Indices. Remote Sens. Revies 1995, 13, 95–120. [Google Scholar] [CrossRef]
  24. Dash, J.P.; Watt, M.S.; Pearse, G.D.; Heaphy, M.; Dungey, H.S. Assessing Very High Resolution UAV Imagery for Monitoring Forest Health during a Simulated Disease Outbreak. ISPRS J. Photogramm. Remote Sens. 2017, 131, 1–14. [Google Scholar] [CrossRef]
  25. Rouse, J.W.; Haas, R.H.; Schell, J.A.; Deering, D.W. Monitoring Vegetation Systems in the Great Plains with ERTS. NASA Spec. Publ. 1974, 351, 309. [Google Scholar]
  26. Gitelson, A.; Merzlyak, M.N. Spectral Reflectance Changes Associated with Autumn Senescence of Aesculus hippocastanum L. and Acer platanoides L. Leaves. J. Plant Physiol. 1994, 143, 286–292. [Google Scholar] [CrossRef]
  27. Sims, D.A.; Gamon, J.A. Relationships between Leaf Pigment Content and Spectral Reflectance across a Wide Range of Species, Leaf Structures and Developmental Stages. Remote Sens. Environ. 2002, 81, 337–354. [Google Scholar] [CrossRef]
  28. Justice, C.O.; Vermote, E.; Townshend, J.R.; Defries, R.; Roy, D.P.; Hall, D.K.; Salomonson, V.V.; Privette, J.L.; Riggs, G.; Strahler, A.; et al. The Moderate Resolution Imaging Spectroradiometer (MODIS): Land Remote Sensing for Global Change Research. IEEE Trans. Geosci. Remote Sens. 1998, 36, 1228–1249. [Google Scholar] [CrossRef]
  29. Altman, D.G.; Bland, J.M. Diagnostic Tests 1: Sensitivity and Specificity. BMJ 1994, 308, 1552. [Google Scholar] [CrossRef] [PubMed]
  30. Altman, D.G.; Bland, J.M. Diagnostic Tests 2: Predictive Values. BMJ 1994, 309, 102. [Google Scholar] [CrossRef]
  31. Velez, D.R.; White, B.C.; Motsinger, A.A.; Bush, W.S.; Ritchie, M.D.; Williams, S.M.; Moore, J.H. A Balanced Accuracy Function for Epistasis Modeling in Imbalanced Datasets Using Multifactor Dimensionality Reduction. Genet. Epidemiol. Off. Publ. Int. Genet. Epidemiol. Soc. 2007, 31, 306–315. [Google Scholar] [CrossRef]
  32. Quinlan, J.R. Induction of Decision Trees. Mach. Learn. 1986, 1, 81–106. [Google Scholar] [CrossRef]
  33. Belgiu, M.; Drăguţ, L. Random Forest in Remote Sensing: A Review of Applications and Future Directions. ISPRS J. Photogramm. Remote Sens. 2016, 114, 24–31. [Google Scholar] [CrossRef]
  34. Skawsang, S.; Nagai, M.K.; Tripathi, N.; Soni, P. Predicting Rice Pest Population Occurence with Satellite-Derived Crop Phenology, Ground Meterological Observation, and Machine Learning: A Case Study for the Central Plain of Thailand. Appl. Sci. 2019, 9, 4846. [Google Scholar] [CrossRef]
  35. Friedman, J.H. Greedy Function Approximation: A Gradient Boosting Machine. Ann. Stat. 2001, 29, 1189–1232. [Google Scholar] [CrossRef]
  36. Webb, G.I. Naïve Bayes. In Encyclopedia of Machine Learning; Sammut, C., Webb, G.I., Eds.; Springer: Boston, MA, USA, 2010; pp. 713–714. ISBN 978-0-387-30164-8. [Google Scholar]
  37. Haykin, S.S. Neural Networks and Learning Machines, 3rd ed.; Prentice-Hall: New York, NY, USA; Munich, Germany, 2009; ISBN 978-0-13-147139-9. [Google Scholar]
  38. Mucherino, A.; Papajorgji, P.J.; Pardalos, P.M. K-Nearest Neighbor Classification. In Data Mining in Agriculture; Mucherino, A., Papajorgji, P.J., Pardalos, P.M., Eds.; Springer Optimization and Its Applications; Springer: New York, NY, USA, 2009; pp. 83–106. ISBN 978-0-387-88615-2. [Google Scholar]
  39. NOAA. Annual 2023 Global Climate Report; NOAA National Centers for Environmental Information: Washington, DC, USA, 2024. [Google Scholar]
  40. Arapostathi, E.; Panopoulou, C.; Antonopoulos, A.; Katsileros, A.; Karellas, K.; Dimopoulos, C.; Tsagkarakis, A. Early Detection of Potential Infestation by Capnodis tenebrionis (L.) (Coleoptera: Buprestidae), in Stone and Pome Fruit Orchards, Using Multispectral Data from a UAV. Agronomy 2024, 14, 20. [Google Scholar] [CrossRef]
  41. Bozzini, A.; Francini, S.; Chirici, G.; Battisti, A.; Faccoli, M. Spruce Bark Beetle Outbreak Prediction through Automatic Classification of Sentinel-2 Imagery. Forests 2023, 14, 1116. [Google Scholar] [CrossRef]
  42. Junttila, S.; Näsi, R.; Koivumäki, N.; Imangholiloo, M.; Saarinen, N.; Raisio, J.; Holopainen, M.; Hyyppä, H.; Hyyppä, J.; Lyytikäinen-Saarenmaa, P.; et al. Multispectral Imagery Provides Benefits for Mapping Spruce Tree Decline Due to Bark Beetle Infestation When Acquired Late in the Season. Remote Sens. 2022, 14, 909. [Google Scholar] [CrossRef]
  43. Sumido, E.C.; Feliscuzo, L.S.; Aliac, C.J.G. Pest classification and prediction: Analyzing the impact of weather to pest occurrence through machine learning. J. Eng. Sci. Technol. 2023, 18, 124–138. [Google Scholar]
  44. Rodríguez-González, Á.; Sánchez-Maíllo, E.; Peláez, H.J.; González-Núñez, M.; Hall, D.R.; Casquero, P.A. Field Evaluation of 3-Hydroxy-2-Hexanone and Ethanol as Attractants for the Cerambycid Beetle Pest of Vineyards, Xylotrechus Arvicola. Pest Manag. Sci. 2017, 73, 1598–1603. [Google Scholar] [CrossRef]
  45. Huete, A. Vegetation Indices, Remote Sensing and Forest Monitoring. Geogr. Compass 2012, 6, 513–532. [Google Scholar] [CrossRef]
  46. Huete, A.; Didan, K.; Miura, T.; Rodriguez, E.P.; Gao, X.; Ferreira, L.G. Overview of the Radiometric and Biophysical Performance of the MODIS Vegetation Indices. Remote Sens. Environ. 2002, 83, 195–213. [Google Scholar] [CrossRef]
  47. Boiarskii, B.; Hasegawa, H. Comparison of NDVI and NDRE Indices to Detect Differences in Vegetation and Chlorophyll Content. J. Mech. Contin. Math. Sci. 2019, 4, 20–29. [Google Scholar] [CrossRef]
  48. Cessna, J.; Alonzo, M.G.; Foster, A.C.; Cook, B.D. Mapping Boreal Forest Spruce Beetle Health Status at the Individual Crown Scale Using Fused Spectral and Structural Data. Forests 2021, 12, 1145. [Google Scholar] [CrossRef]
  49. Safonova, A.; Tabik, S.; Alcaraz-Segura, D.; Rubtsov, A.; Maglinets, Y.; Herrera, F. Detection of Fir Trees (Abies sibirica) Damaged by the Bark Beetle in Unmanned Aerial Vehicle Images with Deep Learning. Remote Sens. 2019, 11, 643. [Google Scholar] [CrossRef]
  50. Stoyanova, M.; Kandilarov, A.; Koutev, V.; Nitcheva, O.; Dobreva, P. Potential of Multispectral Imaging Technology for Assessment Coniferous Forests Bitten by a Bark Beetle in Central Bulgaria. MATEC Web Conf. 2018, 145, 01005. [Google Scholar] [CrossRef]
Figure 1. Distribution of X. chinensis in Europe. The species is present in Spain, Italy, and Greece (yellow dot), while in France it is transient (purple dot) (EPPO Global Database, 2023, www.gd.eppo.int, accessed on 30 June 2024).
Agronomy 14 02061 g001
Figure 2. Adult of X. chinensis on the trunk of a mulberry tree in Agricultural University of Athens.
Agronomy 14 02061 g002
Figure 3. Symptoms of the pest damage in mulberry trees in the orchard of the Agricultural University of Athens, Greece. (A). Adult emergence holes of X. chinensis on the bark of a mulberry tree (B). Bark discoloration by the activity of the larvae of the pest (C). Dried sprouts on a mulberry tree in the orchard of Agricultural University of Athens.
Agronomy 14 02061 g003
Figure 4. Quadcopter “Mera” (UcanDrone S.A., Koropi Attica, Greece) with the attached multispectral camera, MicaSense RedEdge MX (AgEagle Aerial Systems Inc., Wichita, KS, USA).
Agronomy 14 02061 g004
Figure 5. Orthomosaic map of the mulberry orchard (flight of 28 June 2023).
Agronomy 14 02061 g005
Figure 6. Classified output of the Object-Based Classification for the airborne data of the 28 June 2023 flight.
Agronomy 14 02061 g006
Figure 7. Correlation matrix of the variables depicting the relationship between them. The most statistically significant linear correlation is found between the two vegetation indices, NDVI and NDRE (r = 0.74).
Agronomy 14 02061 g007
Figure 8. Evaluation of the six algorithms based on accuracy, precision, recall, and F1 Score.
Agronomy 14 02061 g008
Figure 9. Importance of variables per learning algorithm based on the training data.
Agronomy 14 02061 g009
Figure 10. Confusion matrices for the machine-learning algorithms.
Agronomy 14 02061 g010
Figure 11. ROC curves of the six models.
Agronomy 14 02061 g011
Table 1. Descriptive statistics of the six predictors that were used in the models.
HolesCanopyMean NDVIMean NDREMean EVIMeanT (°C)
Mean5.132.220.860.432.2825.70
Std9.971.630.080.102.962.00
Min0−1.300.03−0.03−87.5923.06
25%01.280.840.382.1424.34
Median21.890.890.452.3427.23
75%62.670.910.502.4427.94
Max9517.400.940.66100.0827.94
N208120812081208120814
Disclaimer/Publisher’s Note: The statements, opinions and data contained in all publications are solely those of the individual author(s) and contributor(s) and not of MDPI and/or the editor(s). MDPI and/or the editor(s) disclaim responsibility for any injury to people or property resulting from any ideas, methods, instructions or products referred to in the content.