Article

Alterations in Suitable Cultivation Area for Scutellaria baicalensis under Future Climatic Scenarios in China: Geodetector-Based Prediction

1
State Key Laboratory of Earth Surface Process and Resource Ecology, Beijing Normal University, Beijing 100875, China
2
Institute of Science and Technology Education, Beijing Union University, Beijing 100011, China
3
Faculty of Geographical Science, Beijing Normal University, Beijing 100875, China
4
State Key Laboratory of Desert and Oasis Ecology, Key Laboratory of Ecological Safety and Suitable Development in Arid Lands, Xinjiang Institute of Ecology and Geography, Chinese Academy of Sciences, Urumqi 830011, China
5
State Key Laboratory of Efficient Production of Forest Resources, Beijing Forestry University, Beijing 100083, China
6
Academy of Plateau Science and Sustainability, People’s Government of Qinghai Province & Beijing Normal University, Xining 810008, China
*
Authors to whom correspondence should be addressed.
Agronomy 2024, 14(9), 2065; https://doi.org/10.3390/agronomy14092065
Submission received: 16 July 2024 / Revised: 11 August 2024 / Accepted: 15 August 2024 / Published: 10 September 2024
(This article belongs to the Section Horticultural and Floricultural Crops)

Abstract

:
The dried roots of Scutellaria baicalensis (S. baicalensis) have been widely used as a traditional medicine. Recently, climate change and human activities have caused the degeneration of its wildlife habitat. However, there is rare knowledge on the effect and interactive effect of different variables on the spatial heterogeneity of S. baicalensis and how the pattern of suitable cultivation area in China would shift in response to climate change. Based on the Geodetector and Habitat Suitability Index (HSI) method, we proposed an assessment model to identify the critical environmental variable(s) affecting the distribution of suitable cultivation area for S. baicalensis in China and to project its shift under climate change. The results showed that soil and mean annual temperature are two determining variables in its spatial heterogeneity in China. Compared to 1981–2010, future climate change may result in a decrease in its suitable area, and yet may result in an increase in the extremely suitable area (about 1.00–1.35 million km2). S. baicalensis in the southern and northwestern part of its current distribution and the southwestern part and small area of northern China may experience expansion during the 21st century, while S. baicalensis in southern China, the Huang-Huai-Hai plain, and the midwest of northwestern China may experience contractions. Meanwhile, climate warming is expected to shift its distribution northwest through an expansion at the northern (at least 84 km) and western (at least 62 km) boundary and contraction at the southern (at least 529 km) boundary, respectively. These results could provide valuable information to policy-makers for the conservation and scientific introduction of S. baicalensis.

1. Introduction

Scutellaria baicalensis Georgi (S. baicalensis), also known as Huang-Qin or Chinese skullcap, belongs to the Lamiaceae family and has been widely used as a traditional medicine for more than 2000 years [1,2]. The plant is a perennial herb and flourishes in dry and sandy soils and on sunny grassy slope land at an altitude of 60–2000 m. In China, it is indigenous to Hebei, Shanxi, Gansu, Inner Mongolia Autonomous Region, Liaoning, Gansu, Ningxia, Sichuan, etc. [2,3]. The main chemical components of S. baicalensis, such as wogonoside, baicalin, and their aglycones baicalein wogonin, have curative effects toward the treatment of a wide range of diseases, particularly diarrhea, hypertension, dysentery, hemorrhaging, high blood pressure, and respiratory infections [2]. According to both the huge and persisting commercial market demand for S. baicalensis herbs and climate change [4], its wildlife habitat has been fragmented and the cultivation of S. baicalensis herbs has been steadily growing in China.
There is unequivocal evidence that Earth is warming at an unprecedented rate by the reason that greenhouse gas emissions are unprecedented in modern records. The average global temperature has increased by a little more than 1 °C since 1880. And it is likely to increase by a minimum of 1.0–1.8 °C under the very-low-GHG-emission scenario considered (SSP1-1.9) to a maximum of 3.3–5.7 °C under the very-high-GHG-emission scenario (SSP5-8.5) at the end of the 21st century relative to 1850–1900 [5]. Climate change is a major challenge for the distribution of the herbs used in traditional Chinese medicine. Previous studies indicate that climate change may lead herbs to a poleward expansion and equatorward contraction of ranges [6,7,8,9], and the herbs in the main growing region may face increased risk of habitat degeneration and extinction [10,11]. Thus, climate change substantially threatens the production of herbs and Chinese herbal medicine market [12]. Therefore, the analysis of the shift in habitat suitability of herbs is essential information for government policy-makers and investors.
The Habitat Suitability Index (HSI) method has been widely used in suitability assessment of cultivation area for herbs. The method uses the environmental variables and expert knowledge to quantify the suitability of herbs [13,14,15]. This method is simple and independent of occurrence points, but often relies on expert knowledge [16] and cannot explicitly illustrate spatial heterogeneity of the herbs. However, a geographical detector (Geodetector), as a statistical tool to measure Spatial Stratified Heterogeneity (SSH, the phenomena of a partition that within strata is more similar than between strata) [17] and to make attributions for or by SSH, can detect the spatial heterogeneity of occurrences of herbs, and captures well the effects of environmental variables on the herbs’ habitat by quantifying the influences of driving variables and their interactions [18]. Therefore, the combination of both the HSI method and Geodetector method could capture the effects of environmental variables on the distribution of herbs, but could quantitatively calculate the suitability regardless of expert knowledge.
Many studies have addressed the relationship between environmental variables (e.g., climatic, topographic, soil) and the distribution of S. baicalensis herbs [19,20,21,22]. However, the overwhelming majority of these studies focus on chemical composition, clinical application, pharmacology, and artificial cultivation [21,23,24,25]. Only a few studies have been undertaken on the shift of suitable cultivation area in response to climate change based on the MaxNET model [26,27], whereas the spatial heterogeneity of occurrences of S. baicalensis herbs was not detected, and the interactive effect of different variables on the spatial heterogeneity of S. baicalensis was not investigated. The objectives of this study were to (i) develop and verify an assessment method to simulate the suitable cultivation area for S. baicalensis in China; (ii) to identify the critical environmental variable(s) affecting the spatial heterogeneity of S. baicalensis; (iii) to investigate possible changes in suitability and its cultivation area under historical and future climate change conditions; (iv) to detect the distribution boundaries of S. baicalensis and investigate the shift of the boundaries. The results of this study will enhance the understanding of the climate change impact on the suitable cultivation area of S. baicalensis, and will provide scientific support for conservation and domestication, and scientific introduction.

2. Materials and Methods
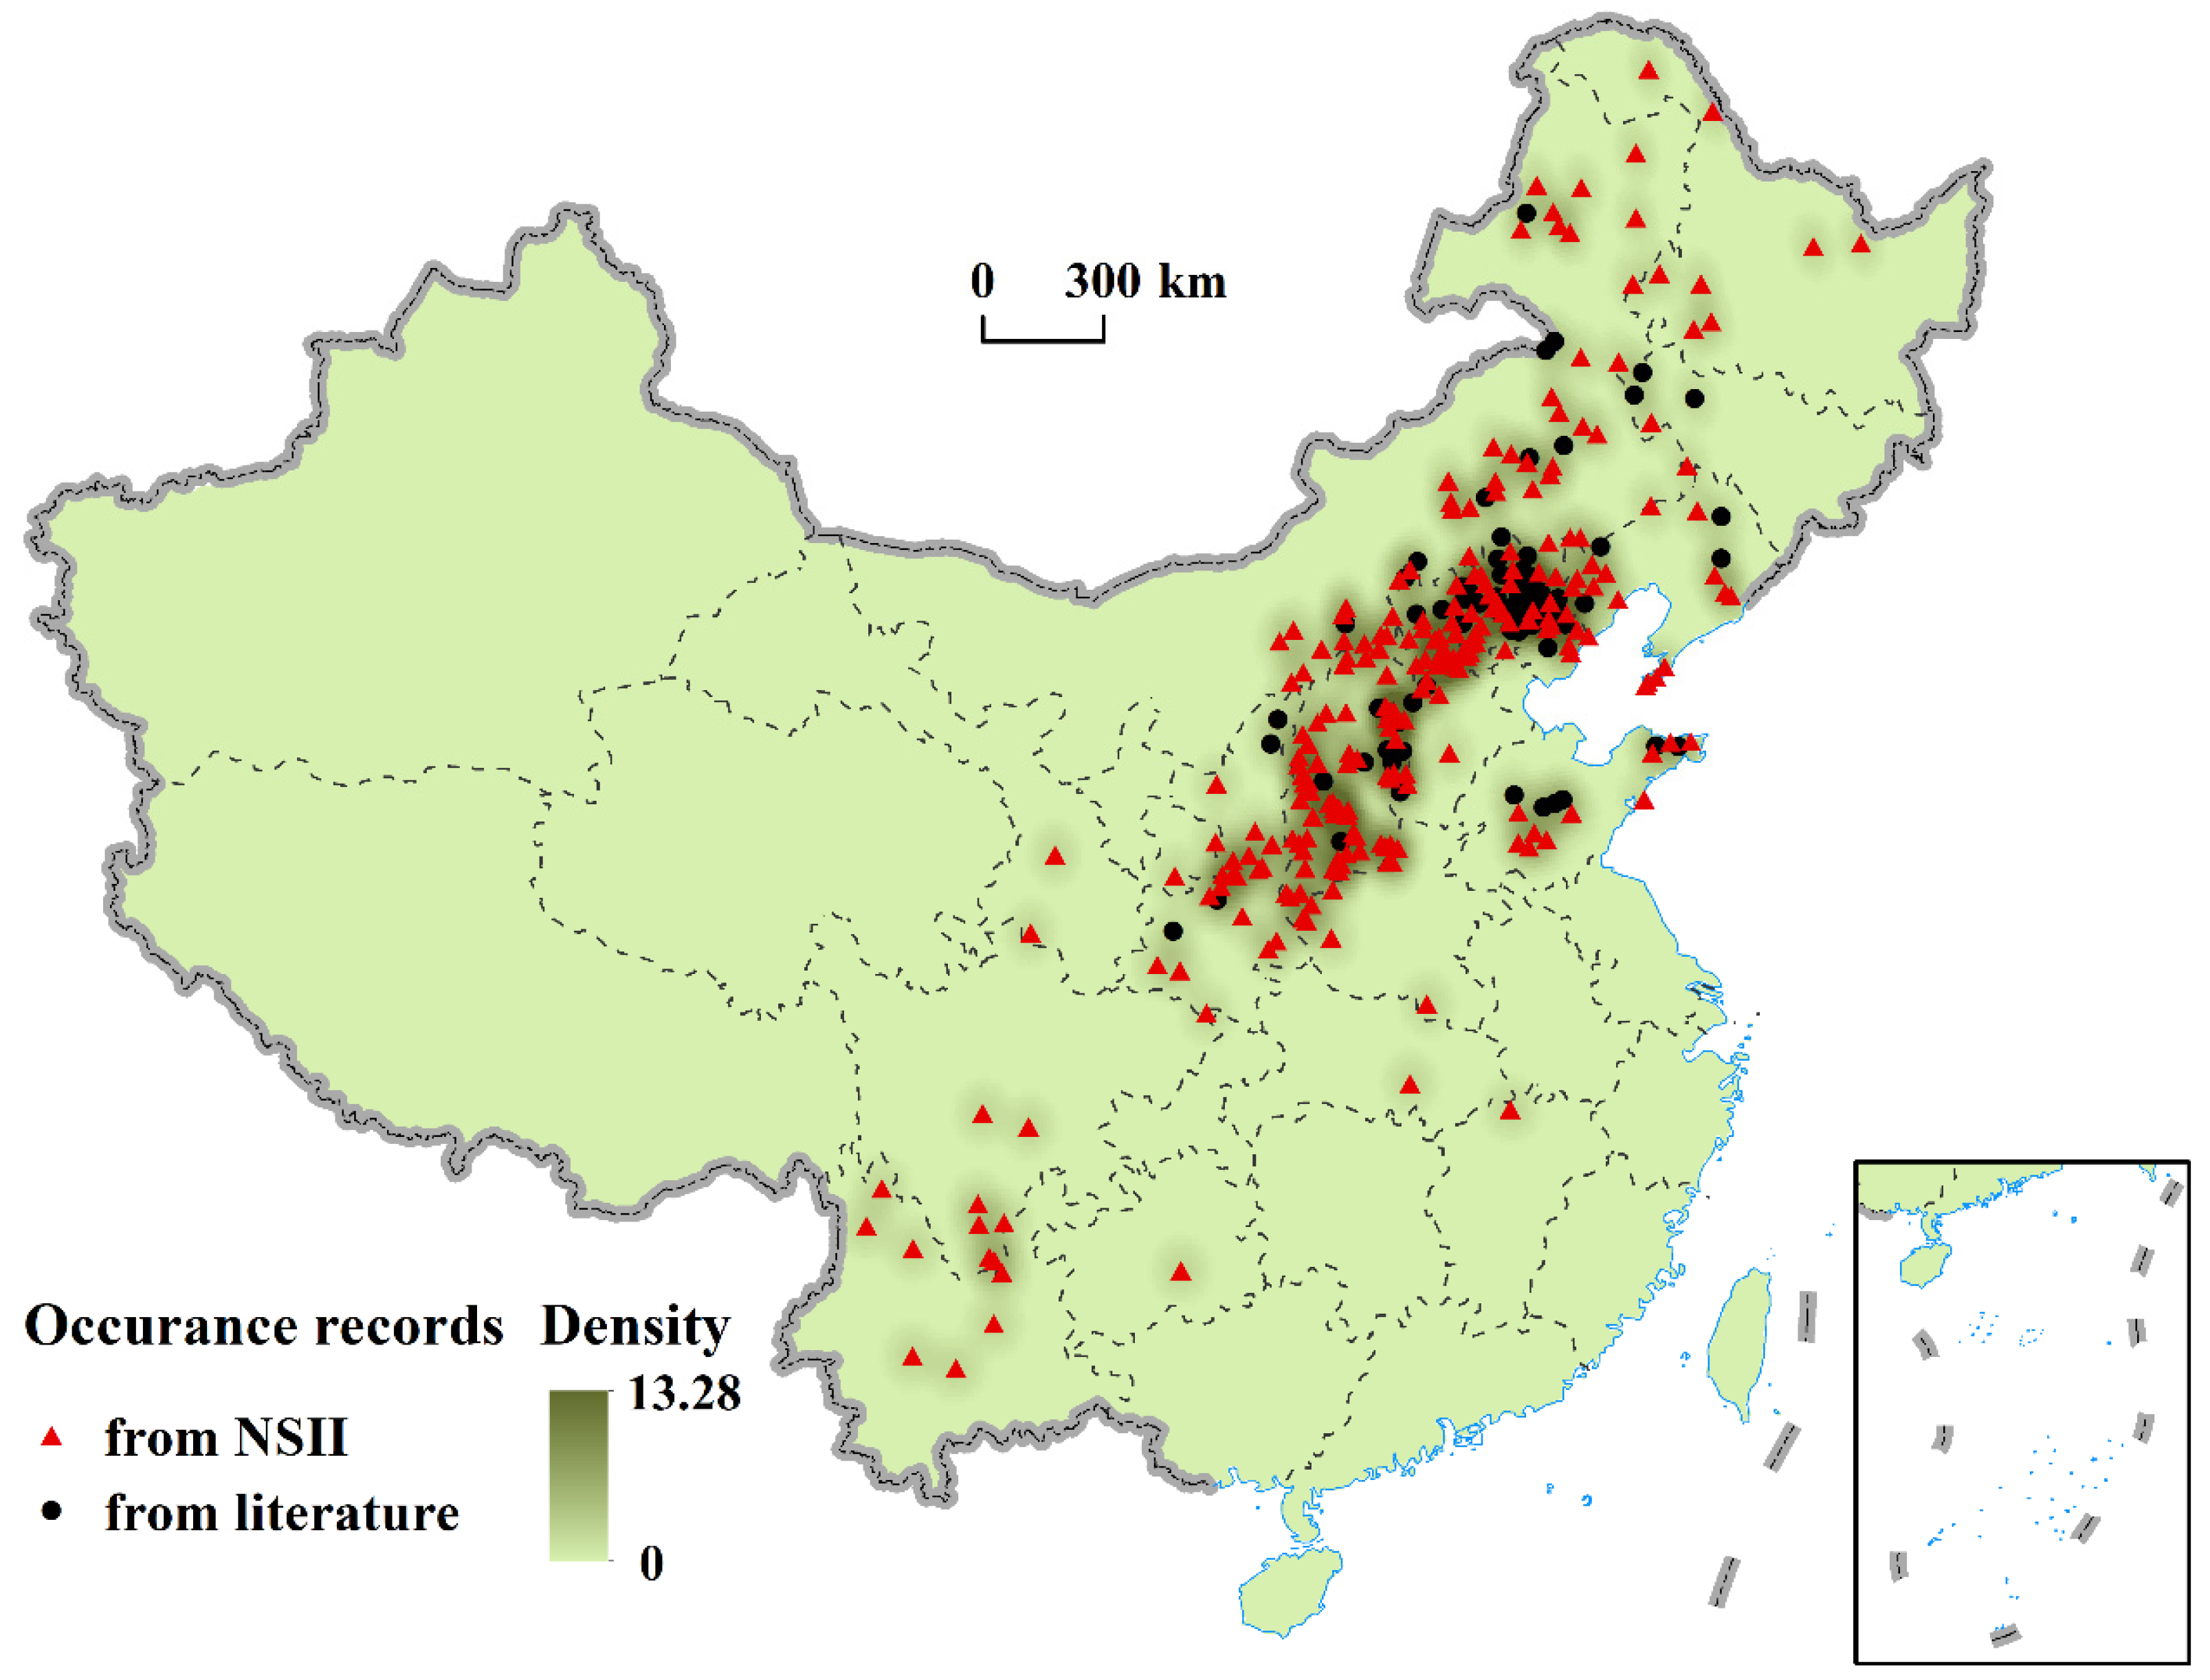
2.1. Data Sources

The data used in this study included occurrence of S. baicalensis, historical and projected temperature and precipitation data, topography (Figure S1), soil types (Figure S2), and vegetation (Figure S3). Occurrence records of S. baicalensis were retrieved from China National Specimen Information Infrastructure (NSII, http://www.nsii.org.cn/2017/home.php, accessed on 14 October 2022), and the relevant literature [10,21,22,28]. A total of 386 occurrence records were collected, including 304 records from NSII, and 82 records through a literature survey. To avoid the overprediction and reduce bias and errors, the ‘thin()’ function in the spThin package in R [29] was used to resample the records with the thinning distance of 10 km. Ultimately, a total of 321 records of S. baicalensis were used in this study (Figure 1).
The historical temperature and precipitation data (1981–2010) were obtained from National Tibetan Plateau Data Center (http://data.tpdc.ac.cn/en/, accessed on 14 October 2022) with a temporal resolution of three hours and a horizontal spatial resolution of 0.1 arc-degree [30]. Both datasets were used to further calculate the average annual precipitation and temperature. Projected average annual temperature and precipitation data with a spatial resolution of 5 arc-minutes for four time periods, 2021–2040 (2030s), 2041–2060 (2050s), 2061–2080 (2070s), and 2081–2100 (2090s), for three Shared Socio-economic Pathways (SSPs), SSP1-2.6, SSP3-7.0, and SSP5-8.5, were downloaded from the WorldClim data website (https://www.worldclim.org/data/index.html, accessed on 25 October 2022). In this study, 21 CMIP6 (Coupled Model Intercomparison Project Phase 6) global climate models (GCMs) were used (Table S1). These data were further resampled to 0.1 arc-degree resolution.
Global topography data with 5 arc-minutes from the WorldClim database [31] (https://worldclim.org/data, accessed on 25 October 2022) were used to extract elevation and aspect for China. The 1:1,000,000 soil map of the People’s Republic of China was provided by National Earth System Science Data Center, National Science and Technology Infrastructure of China. The 1:1,000,000 vegetation map of the People’s Republic of China was obtained from Institute of Botany, Chinese Academy of Sciences. To maintain consistency, we resampled these data to a 0.1 arc-degree resolution.

2.2. Methods

Based on the Geodetector and Habitat Suitability Index (HSI) method, we proposed an assessment model to identify the critical environmental variable(s) affecting the distribution of suitable cultivation area for S. baicalensis in China and to project its shift under climate change. The detailed research framework is shown in Figure S4.

2.2.1. Indices for Suitability Assessment

Both temperature and precipitation are the most important factors for S. baicalensis. The optimal average annual temperatures and precipitation for S. baicalensis in China are 2–10 °C and 400–600 mm [32]. Meanwhile, soil type and vegetation type also have an important effect on growth on S. baicalensis [26,27]. The plant flourishes on sunny slope land at an altitude of 60–2000 m [2]. Therefore, average annual temperatures, average annual precipitation, DEM, slope, soil type, and vegetation type were used to simulate the suitability of S. baicalensis in China under historical and future climate conditions. The selected six environmental variables include four continuous variables and two categorical variables. Four continuous variables were annual temperature, annual precipitation, DEM, and aspect [15,32]. And two categorical variables were soil and vegetation [15,32]. Since the Geodetector method is only suitable for dealing with discrete or categorical variables [33] (2017), the four continuous variables were reclassified into 4 discrete grades according to the expert knowledge and relevant literature [15,32]. Table 1 shows the limitation values and spatial suitability score: extremely suitable (4); moderately suitable (3); marginally suitable (2); and unsuitable (1). The soil and vegetation data included 51 categories (Table S2) and 49 categories (Table S3), respectively. We also converted both data into 4 discrete grades (Tables S2 and S3) according to relevant studies.

2.2.2. Geodetector Model

We used the Geodetector, which was developed by Wang et al. [17], to quantify the influence of six contributing variables on the spatial heterogeneity of S. baicalensis. The software can be freely obtained from the website http://www.geodetector.cn/, accessed on 3 November 2022. In Geodetector, the dependent variable Y was used to represent the spatial heterogeneity of S. baicalensis. Given that the original data of S. baicalensis records are points, the kernel density method was used to calculate Y (Figure 1). The independent variable X was introduced to represent the contributing variable that contributes to the spatial distribution of suitability of S. baicalensis. Geodetector includes 4 aspects of detection: the variable detector; ecological detector; risk detector; and interaction detector. In this study, we used the variable and interaction detector to evaluate the effect of contributing variables on the spatial heterogeneity of S. baicalensis.
The variable detector was used to quantify the degree to which our explanatory variables influence the spatial heterogeneity of S. baicalensis, without the assumption of linearity of these variables. The explanatory degree of each variable is measured by the q-statistic value [17] (Equation (1)). The value of q indicates that X explains 100 × q% of Y, and is strictly within [0, 1]. If the q = 0, there is no correlation between the contributing variable and the spatial heterogeneity of S. baicalensis. And if the q = 1, the spatial heterogeneity of S. baicalensis is completely determined by the contributing variable.
q = 1 h = 1 L N h σ h 2 N σ 2
where q is the explanatory degree of each variable on the spatial heterogeneity of S. baicalensis; σ2 and N are the variance and the sample size; and σ h 2 and N h are the variance and sample size of the hth layer.
The interaction detector was used to investigate whether the interaction between two contributing variables is enhanced, weakened, or independent of each other. Firstly, the q values of two contributing variables for density of S. baicalensis were calculated (q(X1) and q(X2)); secondly, the q value of interaction was calculated (q(X1X2)); thirdly, we compared the q(X1X2) with q(X1) and q(X2) to identify the interaction type between two contributing variables using the criteria in Table 2 [17].

2.2.3. Suitability Assessment of Cultivation Area

Suitability for S. baicalensis in China was calculated using the classified thematic maps and the weights determined by the explanatory degree of each variable. The following equation was used to estimate the suitability for S. baicalensis (Equation (2)).
S = i = 1 N w i × S F i
where S is the suitability index of S. baicalensis; w i is the weight of contributing variable i; S F i is the suitability score of contributing variable i; and N is the number of the contributing variables.
In this study, five variables exerting a significant effect on density of S. baicalensis (p < 0.05) were selected to calculate the suitability index (Figure 2). To calculate the weight of contributing variables, the explanatory degrees (q) of the five selected contributing variables were normalized. The weights for annual temperature, annual precipitation, DEM, soil type, and vegetation type were 0.30, 0.12, 0.14, 0.39, and 0.05, respectively. The calculated suitability index ranges from 1 to 4, and a larger suitability index indicates more suitability. The suitability index was classified to four levels: 1–2.1, unsuitable; 2.1–2.6, marginally suitable; 2.6–3.1, moderately suitable; and 3.1–4, extremely suitable. We used the accuracy and the error rate [34] to investigate the performance of the assessment model.
To illustrate the suitability difference within each eco-region, the mean, inter-quartile range (range between the 25th and 75th percentiles), and distribution of the suitability indices of the grids were calculated for 4 different eco-regions in China under current climatic conditions and four different RCPs (Figure 3), the boundary of which was adopted from Zheng [35].

2.2.4. Spatial Analysis

To demonstrate the contraction/expansion and indicate the likelihood of the assessment results, the simulated suitability indices of each future scenario (Table S1) were converted to presence/absence maps. All grids with a suitability index less than 2.1 were considered unsuitable, whereas the remaining grids were considered suitable. Overlap of unsuitable areas under the current environmental condition and suitable areas under the future environmental condition was identified as potential expansion, meaning that S. baicalensis does not occur currently but will occur in the future. Overlap of suitable areas under the current environmental condition and unsuitable areas under the future environmental condition was defined as potential contraction, indicating that S. baicalensis under the current condition will be outside its environmental optimum in the future. Overlap area of suitability between current and future environmental conditions presents that S. baicalensis under the current condition still will be in its environmental niche in the future. Furthermore, the potential shifts of geographical centroids of suitable areas of S. baicalensis under climate change were examined following Zhang et al. [36]. Based on the binary distribution maps of suitability for each period, we used the approach proposed by Liang et al. [37] to map the distribution boundaries of S. baicalensis and analyzed the latitudinal and longitudinal dynamics of the boundaries using a Fishnet analysis. Meanwhile, based on the binary distribution maps of suitability for each SSP scenario, we used the approach proposed by IPCC-AR6 [5] to indicate the likelihood of the outcomes and deal with the uncertainty. The following terms were used in this study: virtually certain, 99–100%; very likely, 90–99%; likely, 66–90%; as likely as not, 33–66%; unlikely, 0–33%.

3. Results

3.1. Performance of the Assessment Model

According to the 321 records of S. baicalensis used in this study, 63.86% of the total records (205 records) have a suitability index between 3.1 and 4 under current climatic conditions (1981–2010) (Table 3), 22.12% (71 records) have a suitability index between 2.6 and 3.1, 9.66% (31 records) have a suitability index between 2.1 and 2.6, and finally 4.63% (14 records) have a suitability index between 1 and 2.1. In other words, the accuracy of these assessment results is 95.64%, and the error rate is 4.36%.

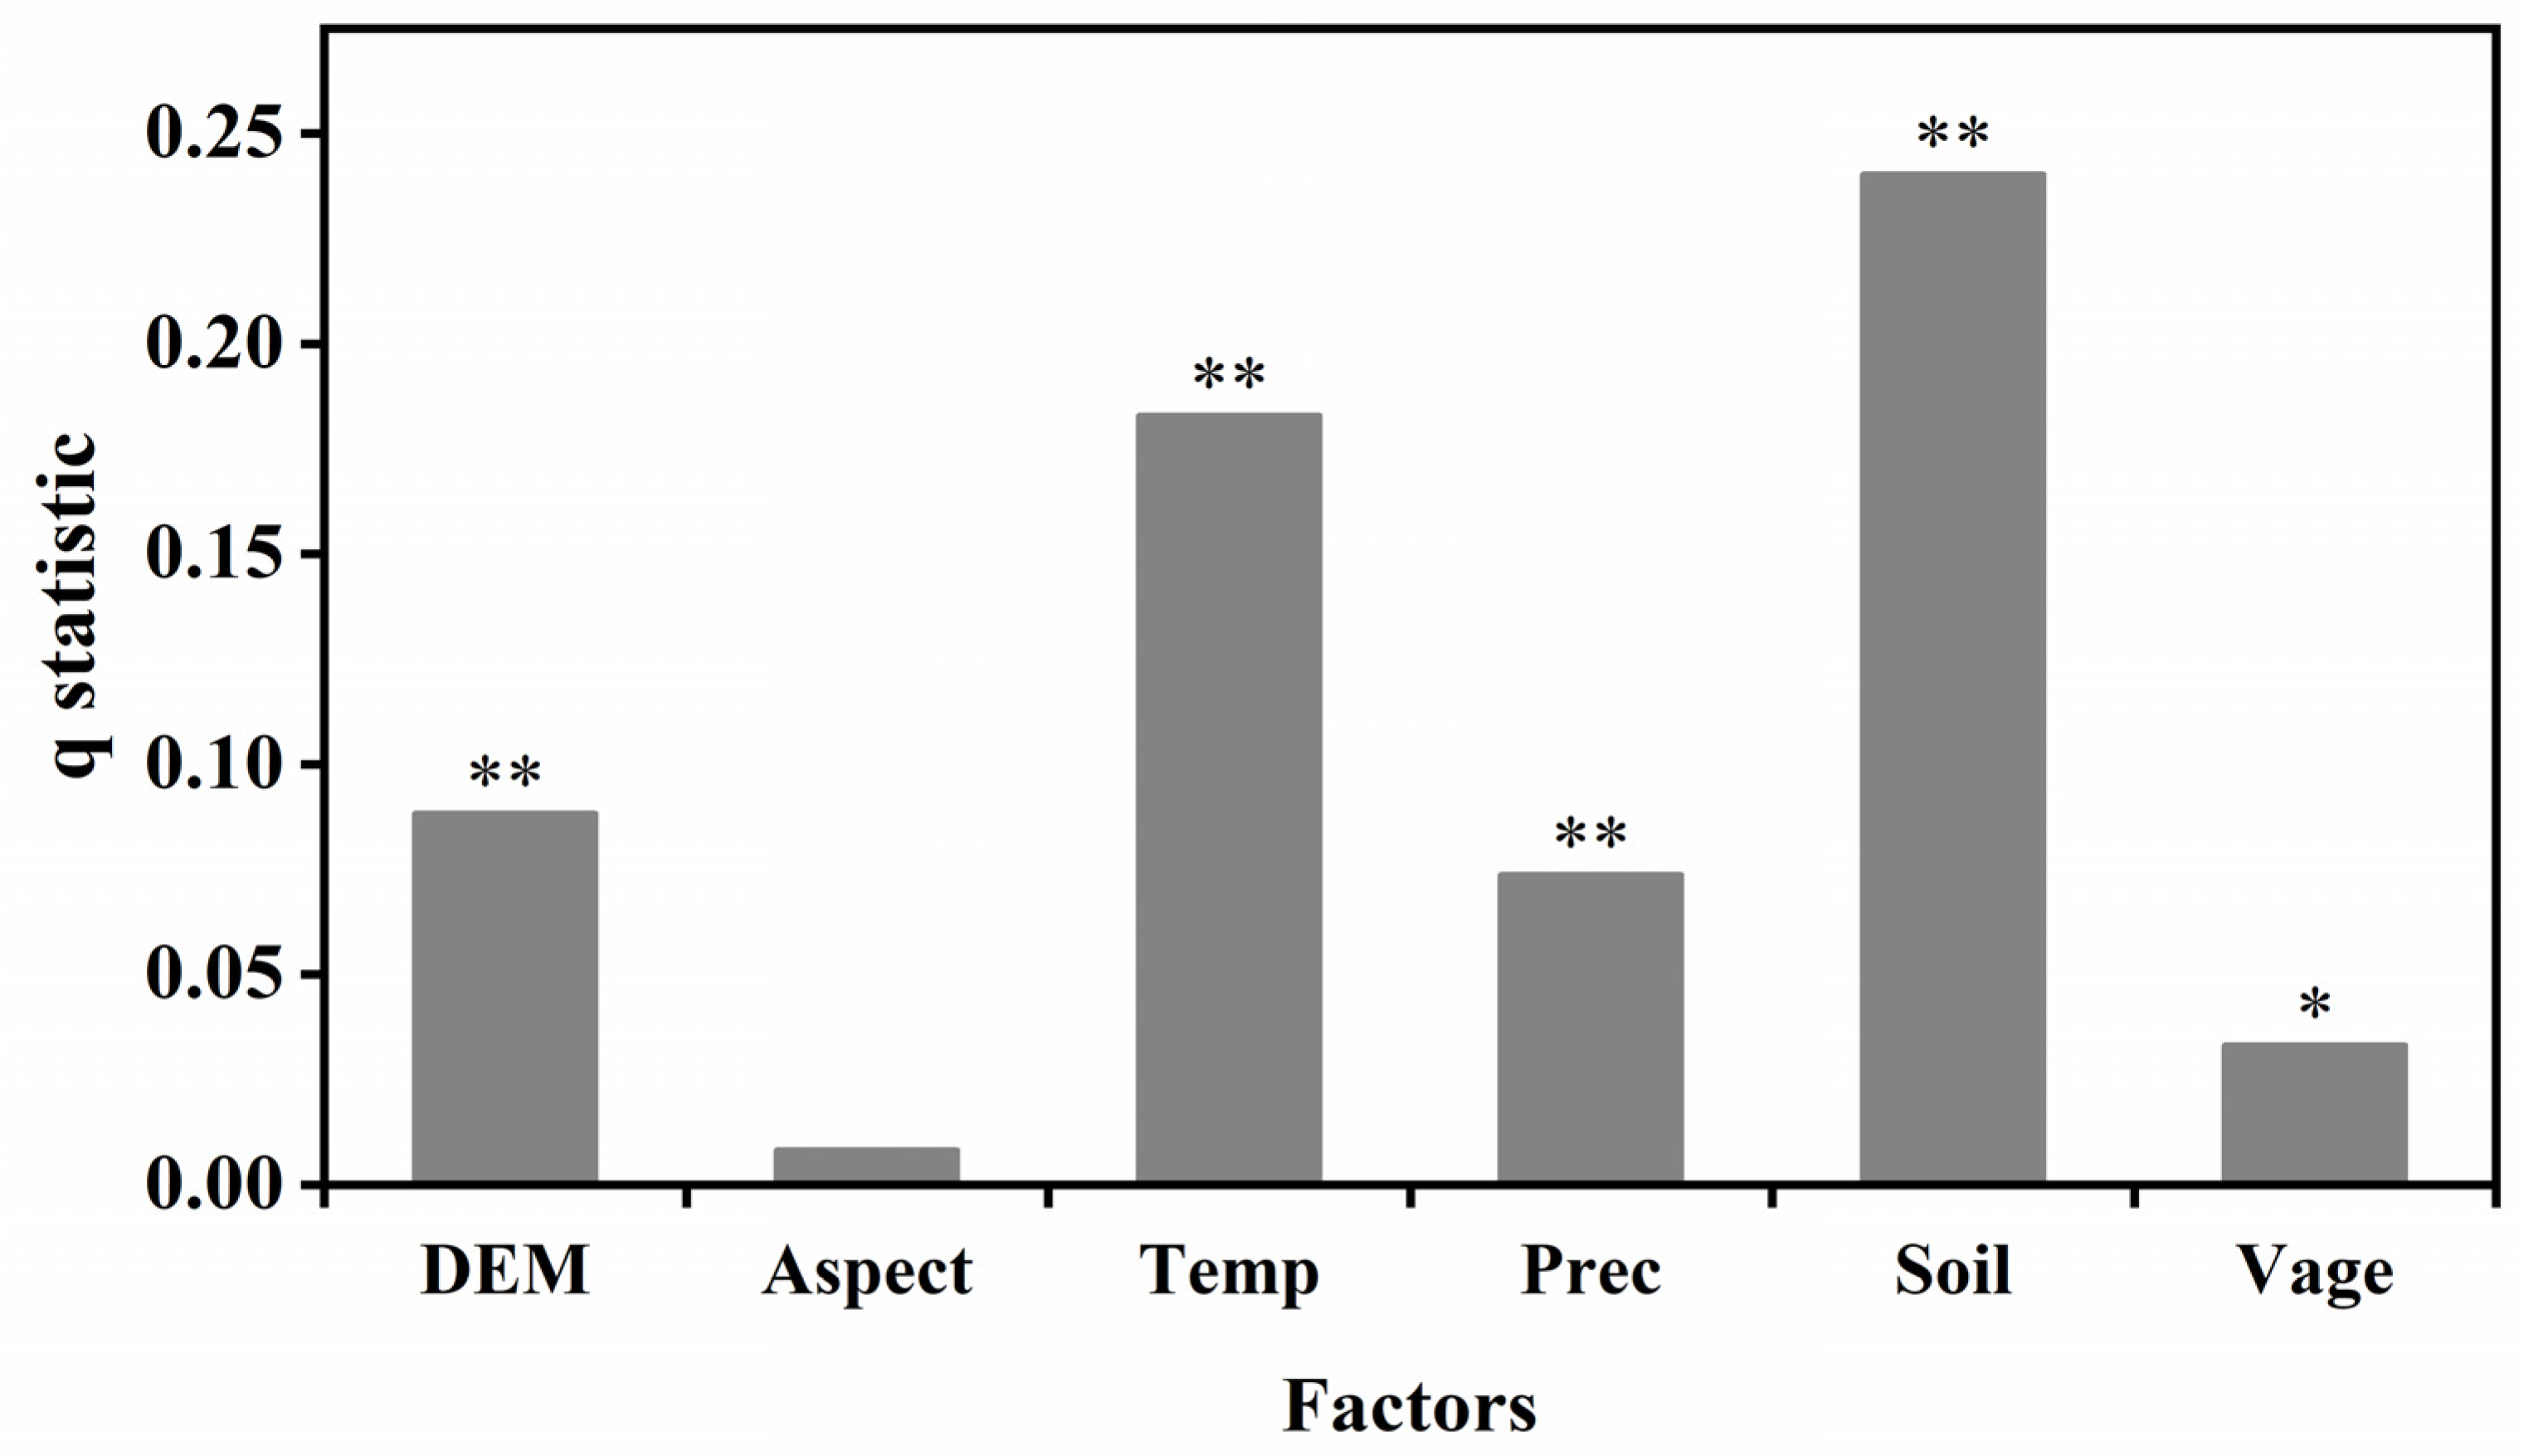
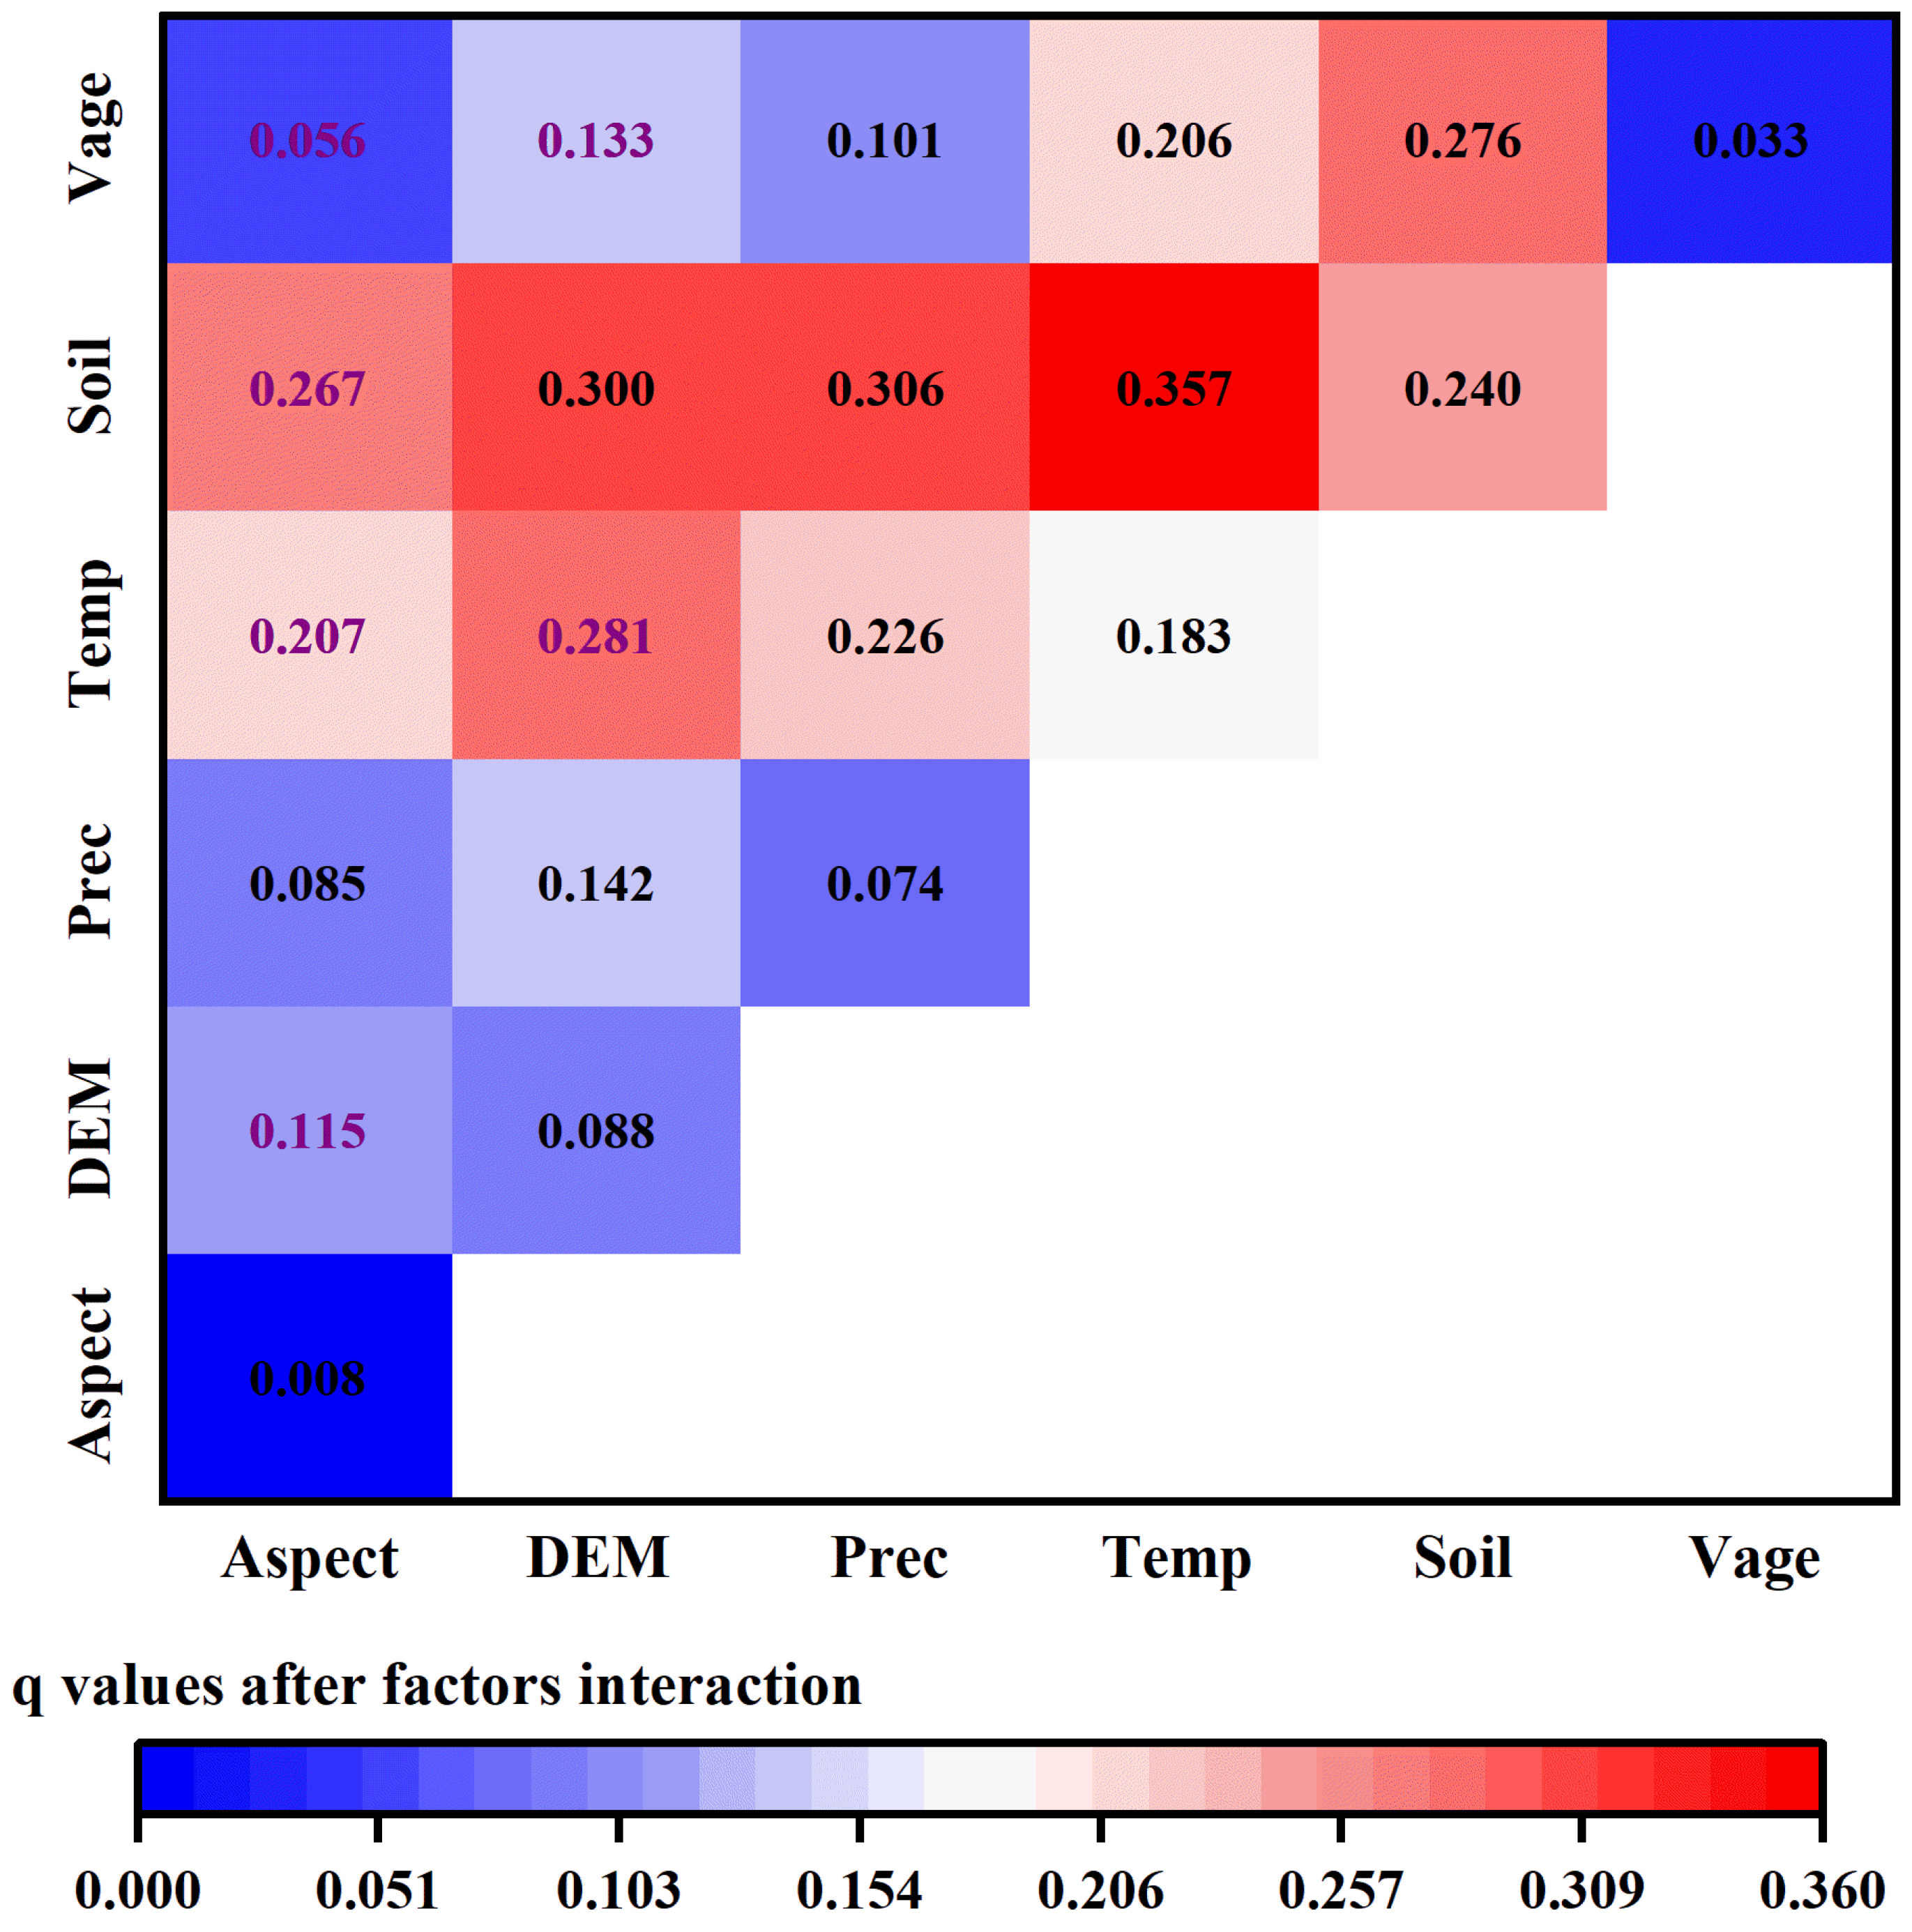
3.2. Influence of Contributing Variables on Spatial Heterogeneity of S. baicalensis

Among six selected variables, besides aspect, the other five variables exerted a significant effect on density of S. baicalensis (p < 0.05) (Figure 2). The variable soil had the largest influence, which explained 24.03% of spatial heterogeneity of S. baicalensis. The following variable was mean annual temperature, whose contribution was 18.29%. The variables DEM and mean annual precipitation explained 8.83% and 7.37%, respectively. The contribution of vegetation was the lowest (only 3.32%). Hence, the soil and mean annual temperature were the main contributing variables to the distribution of S. baicalensis.

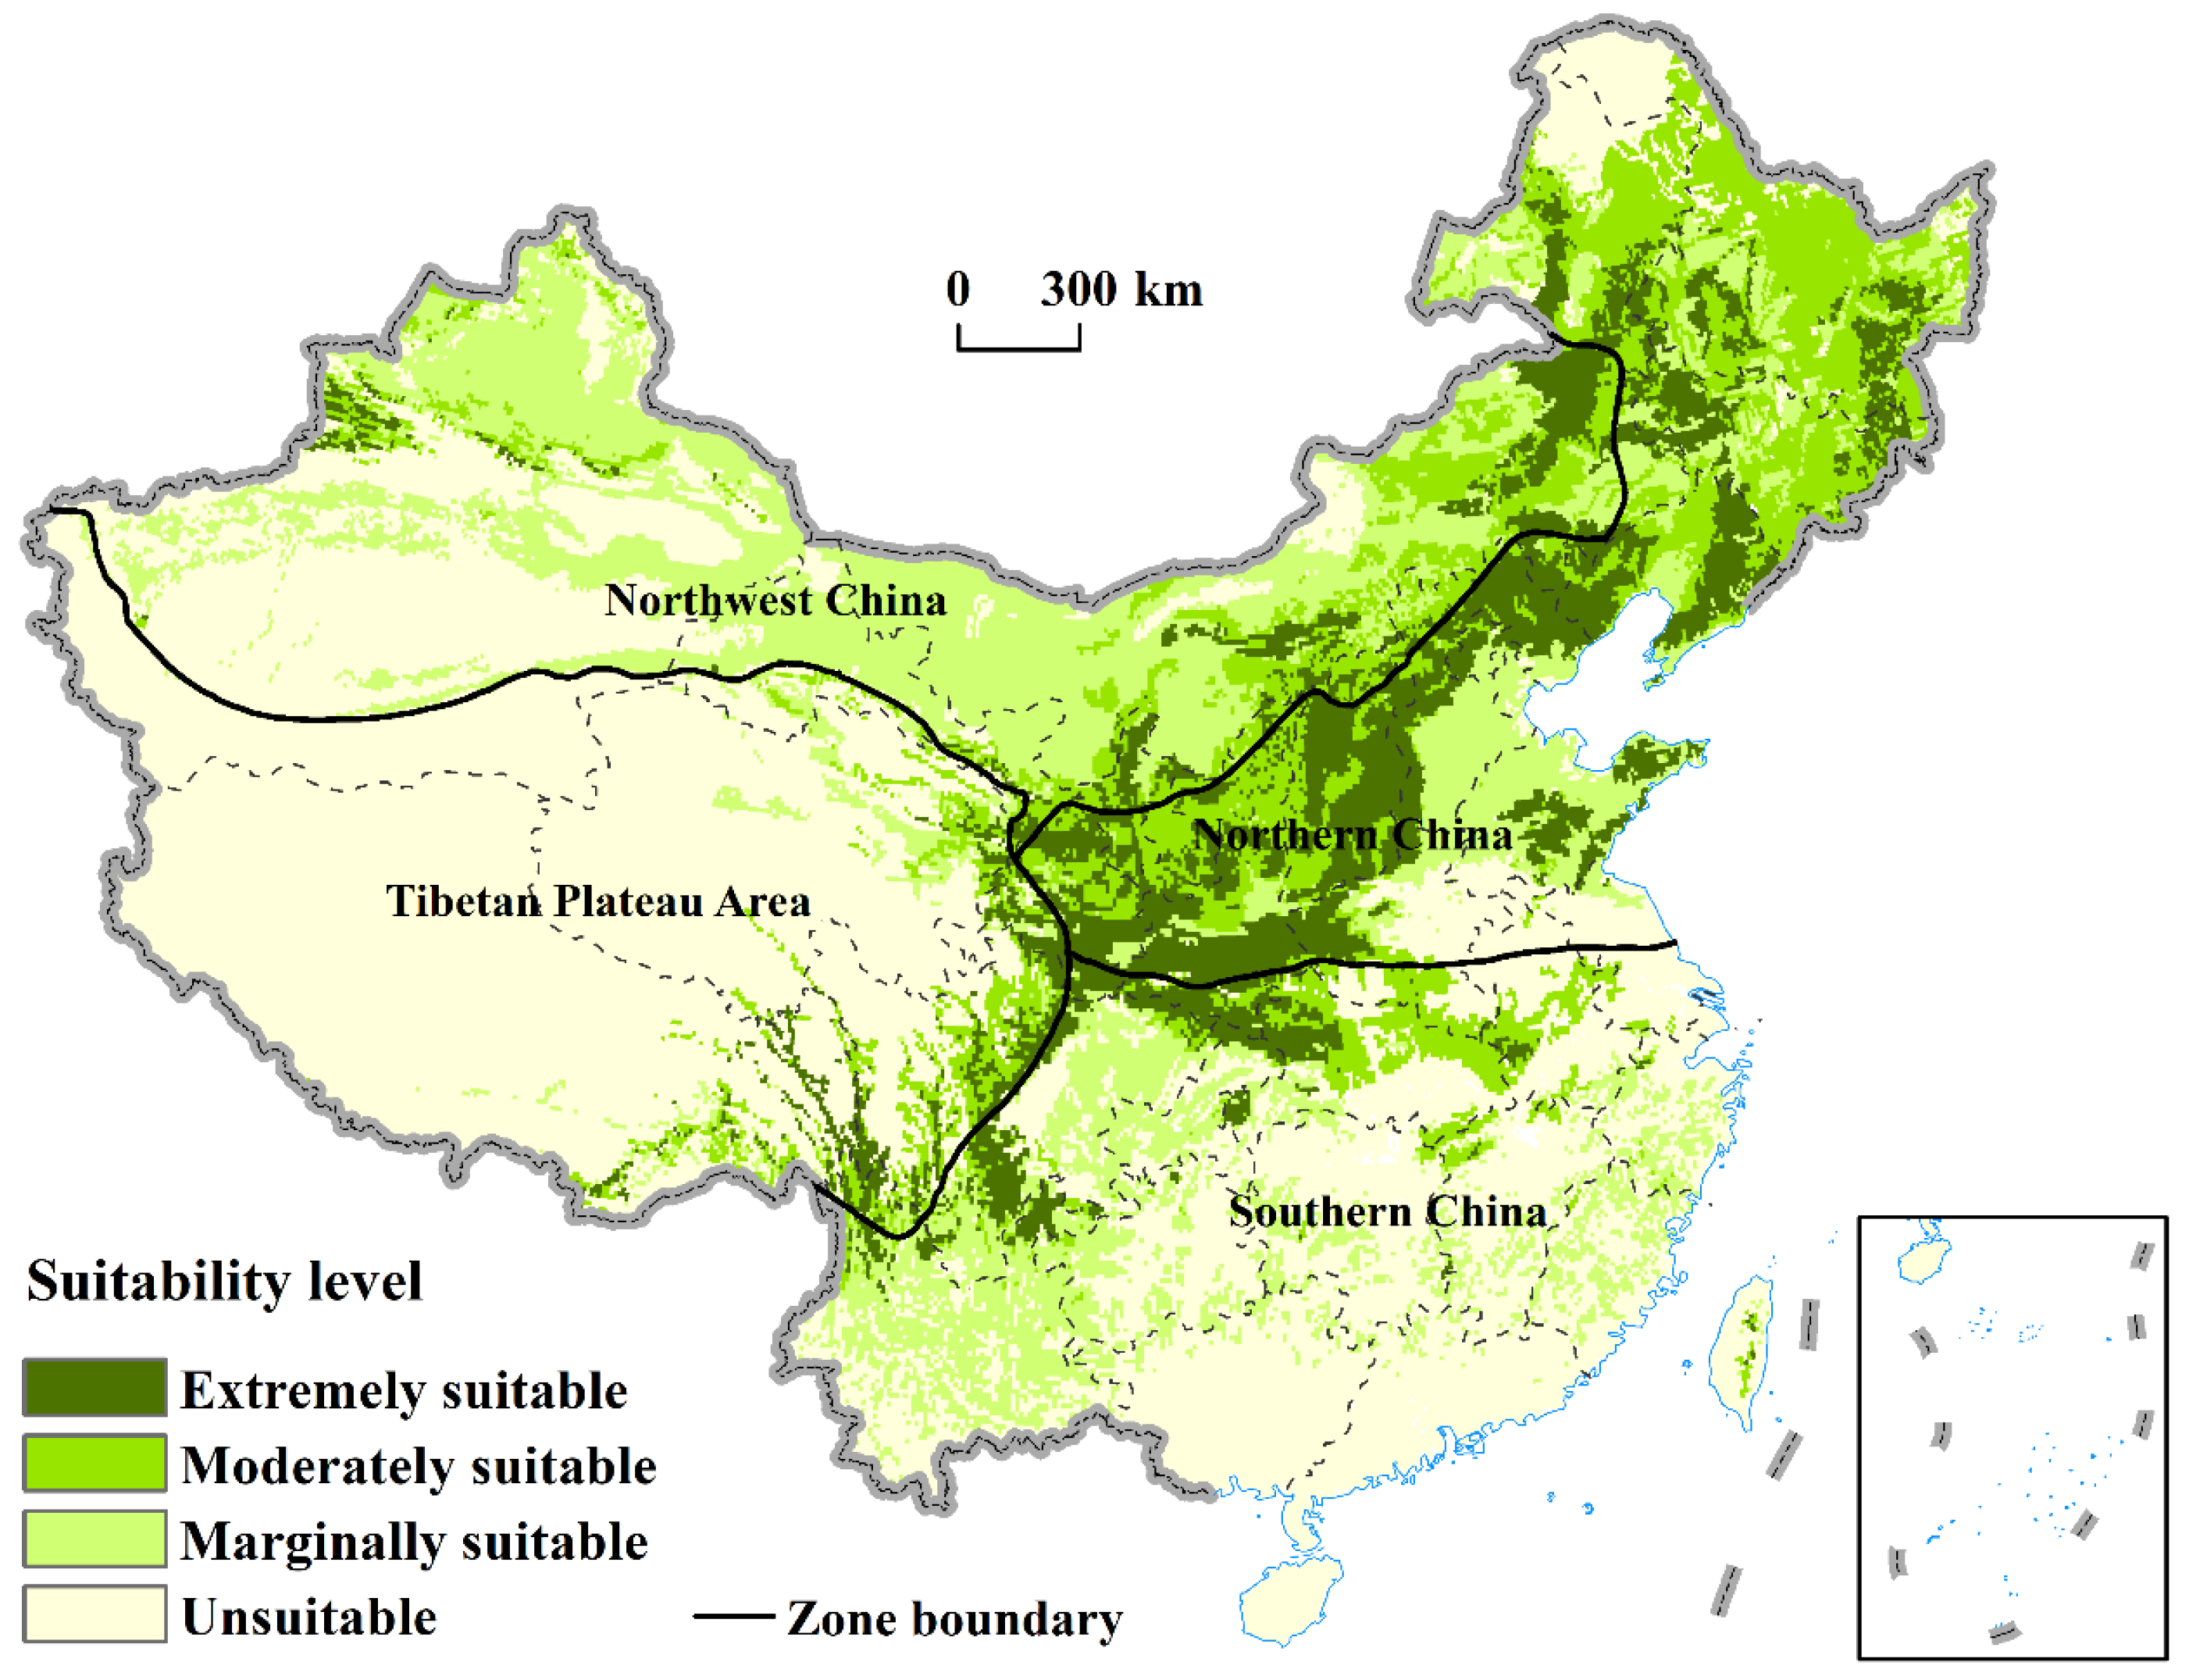
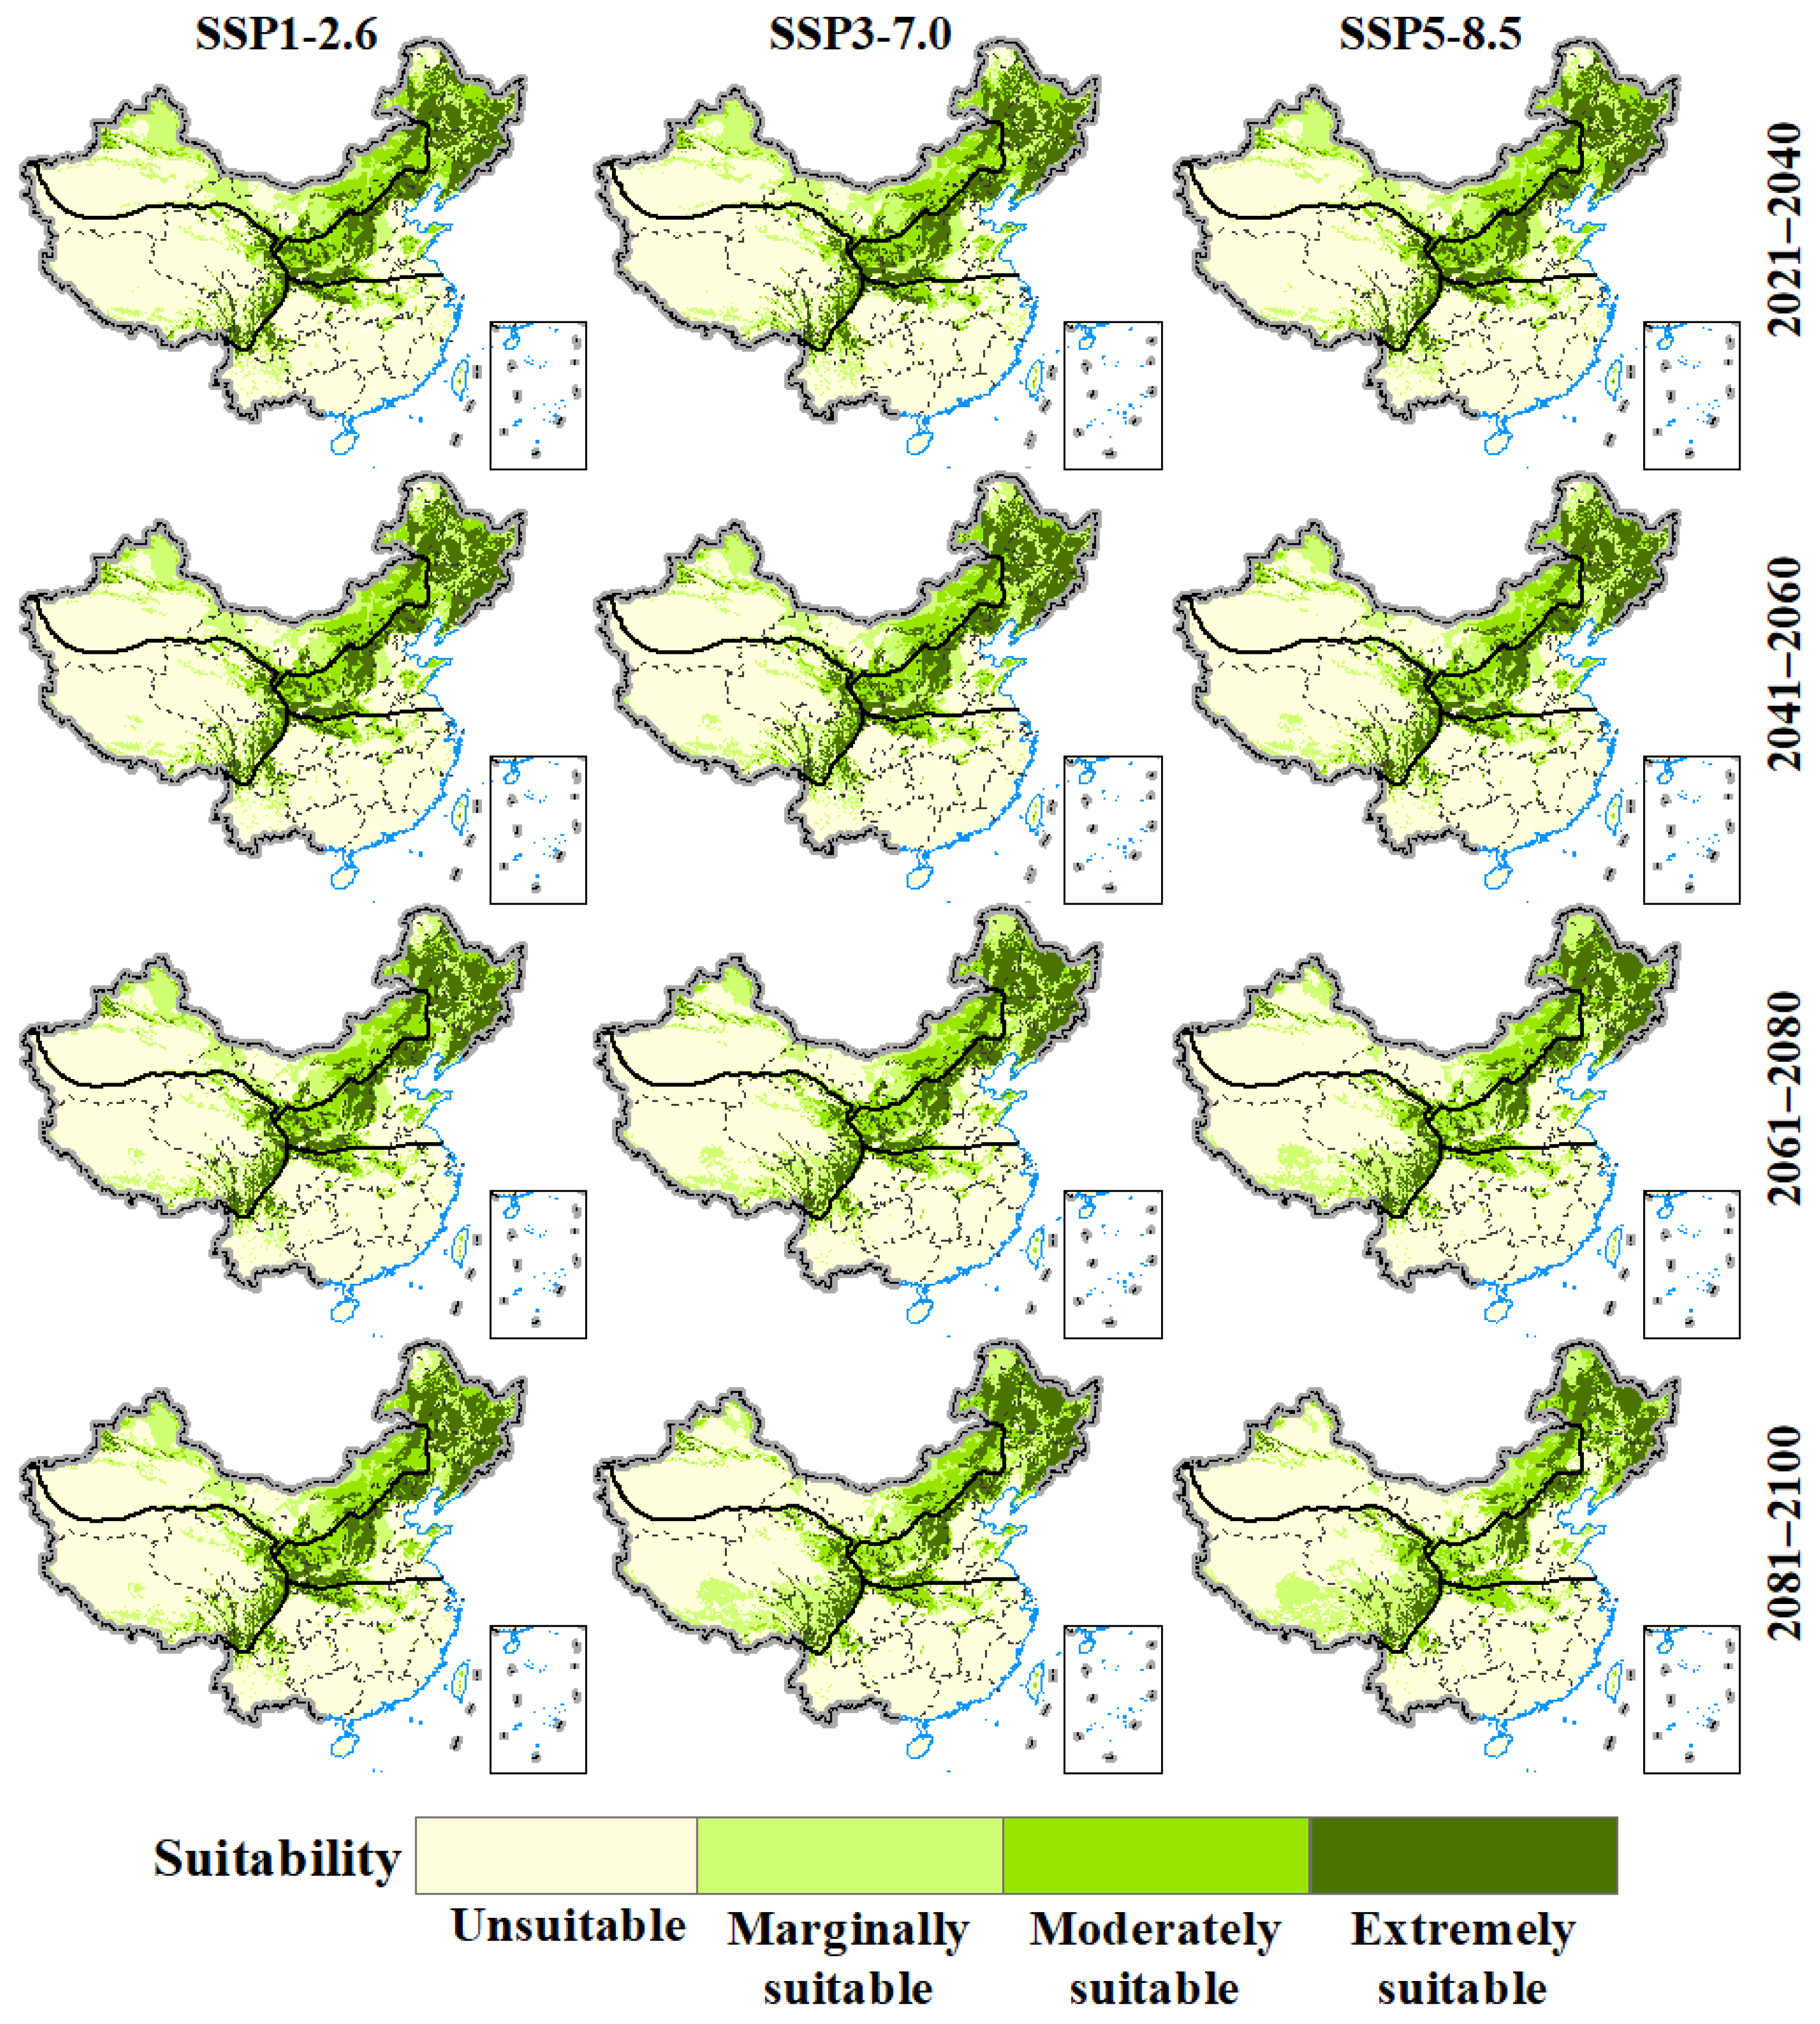
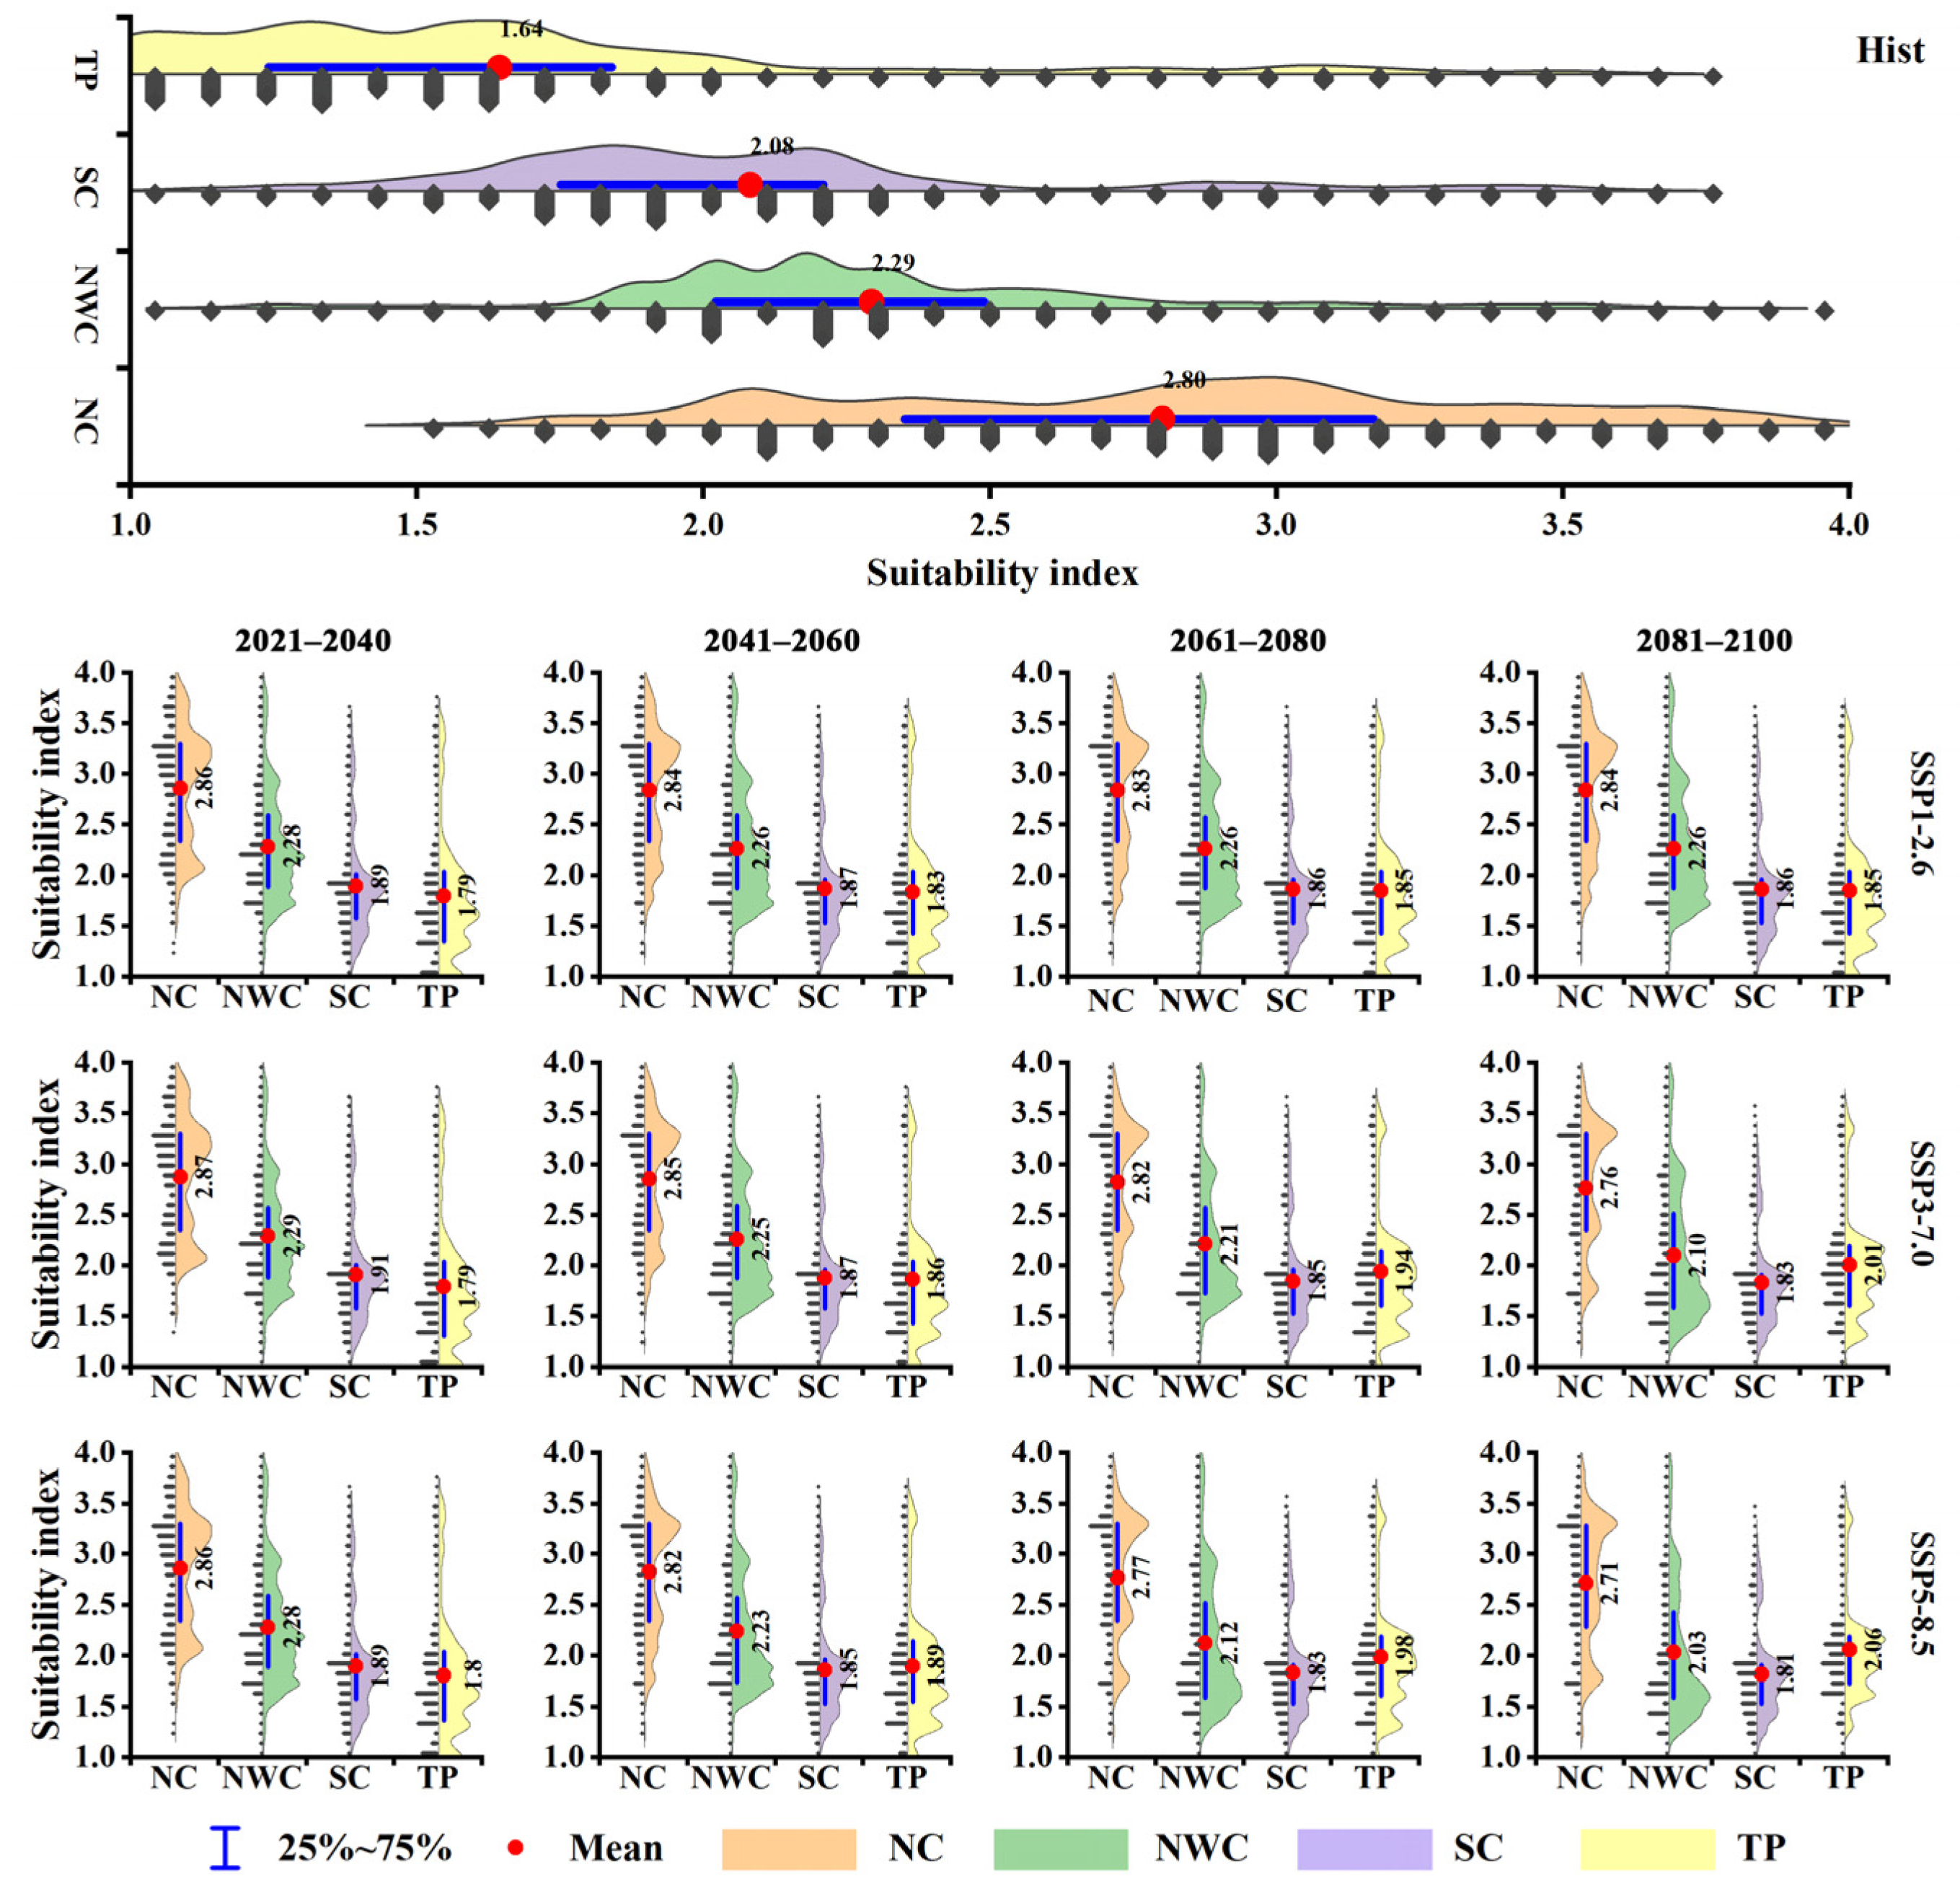
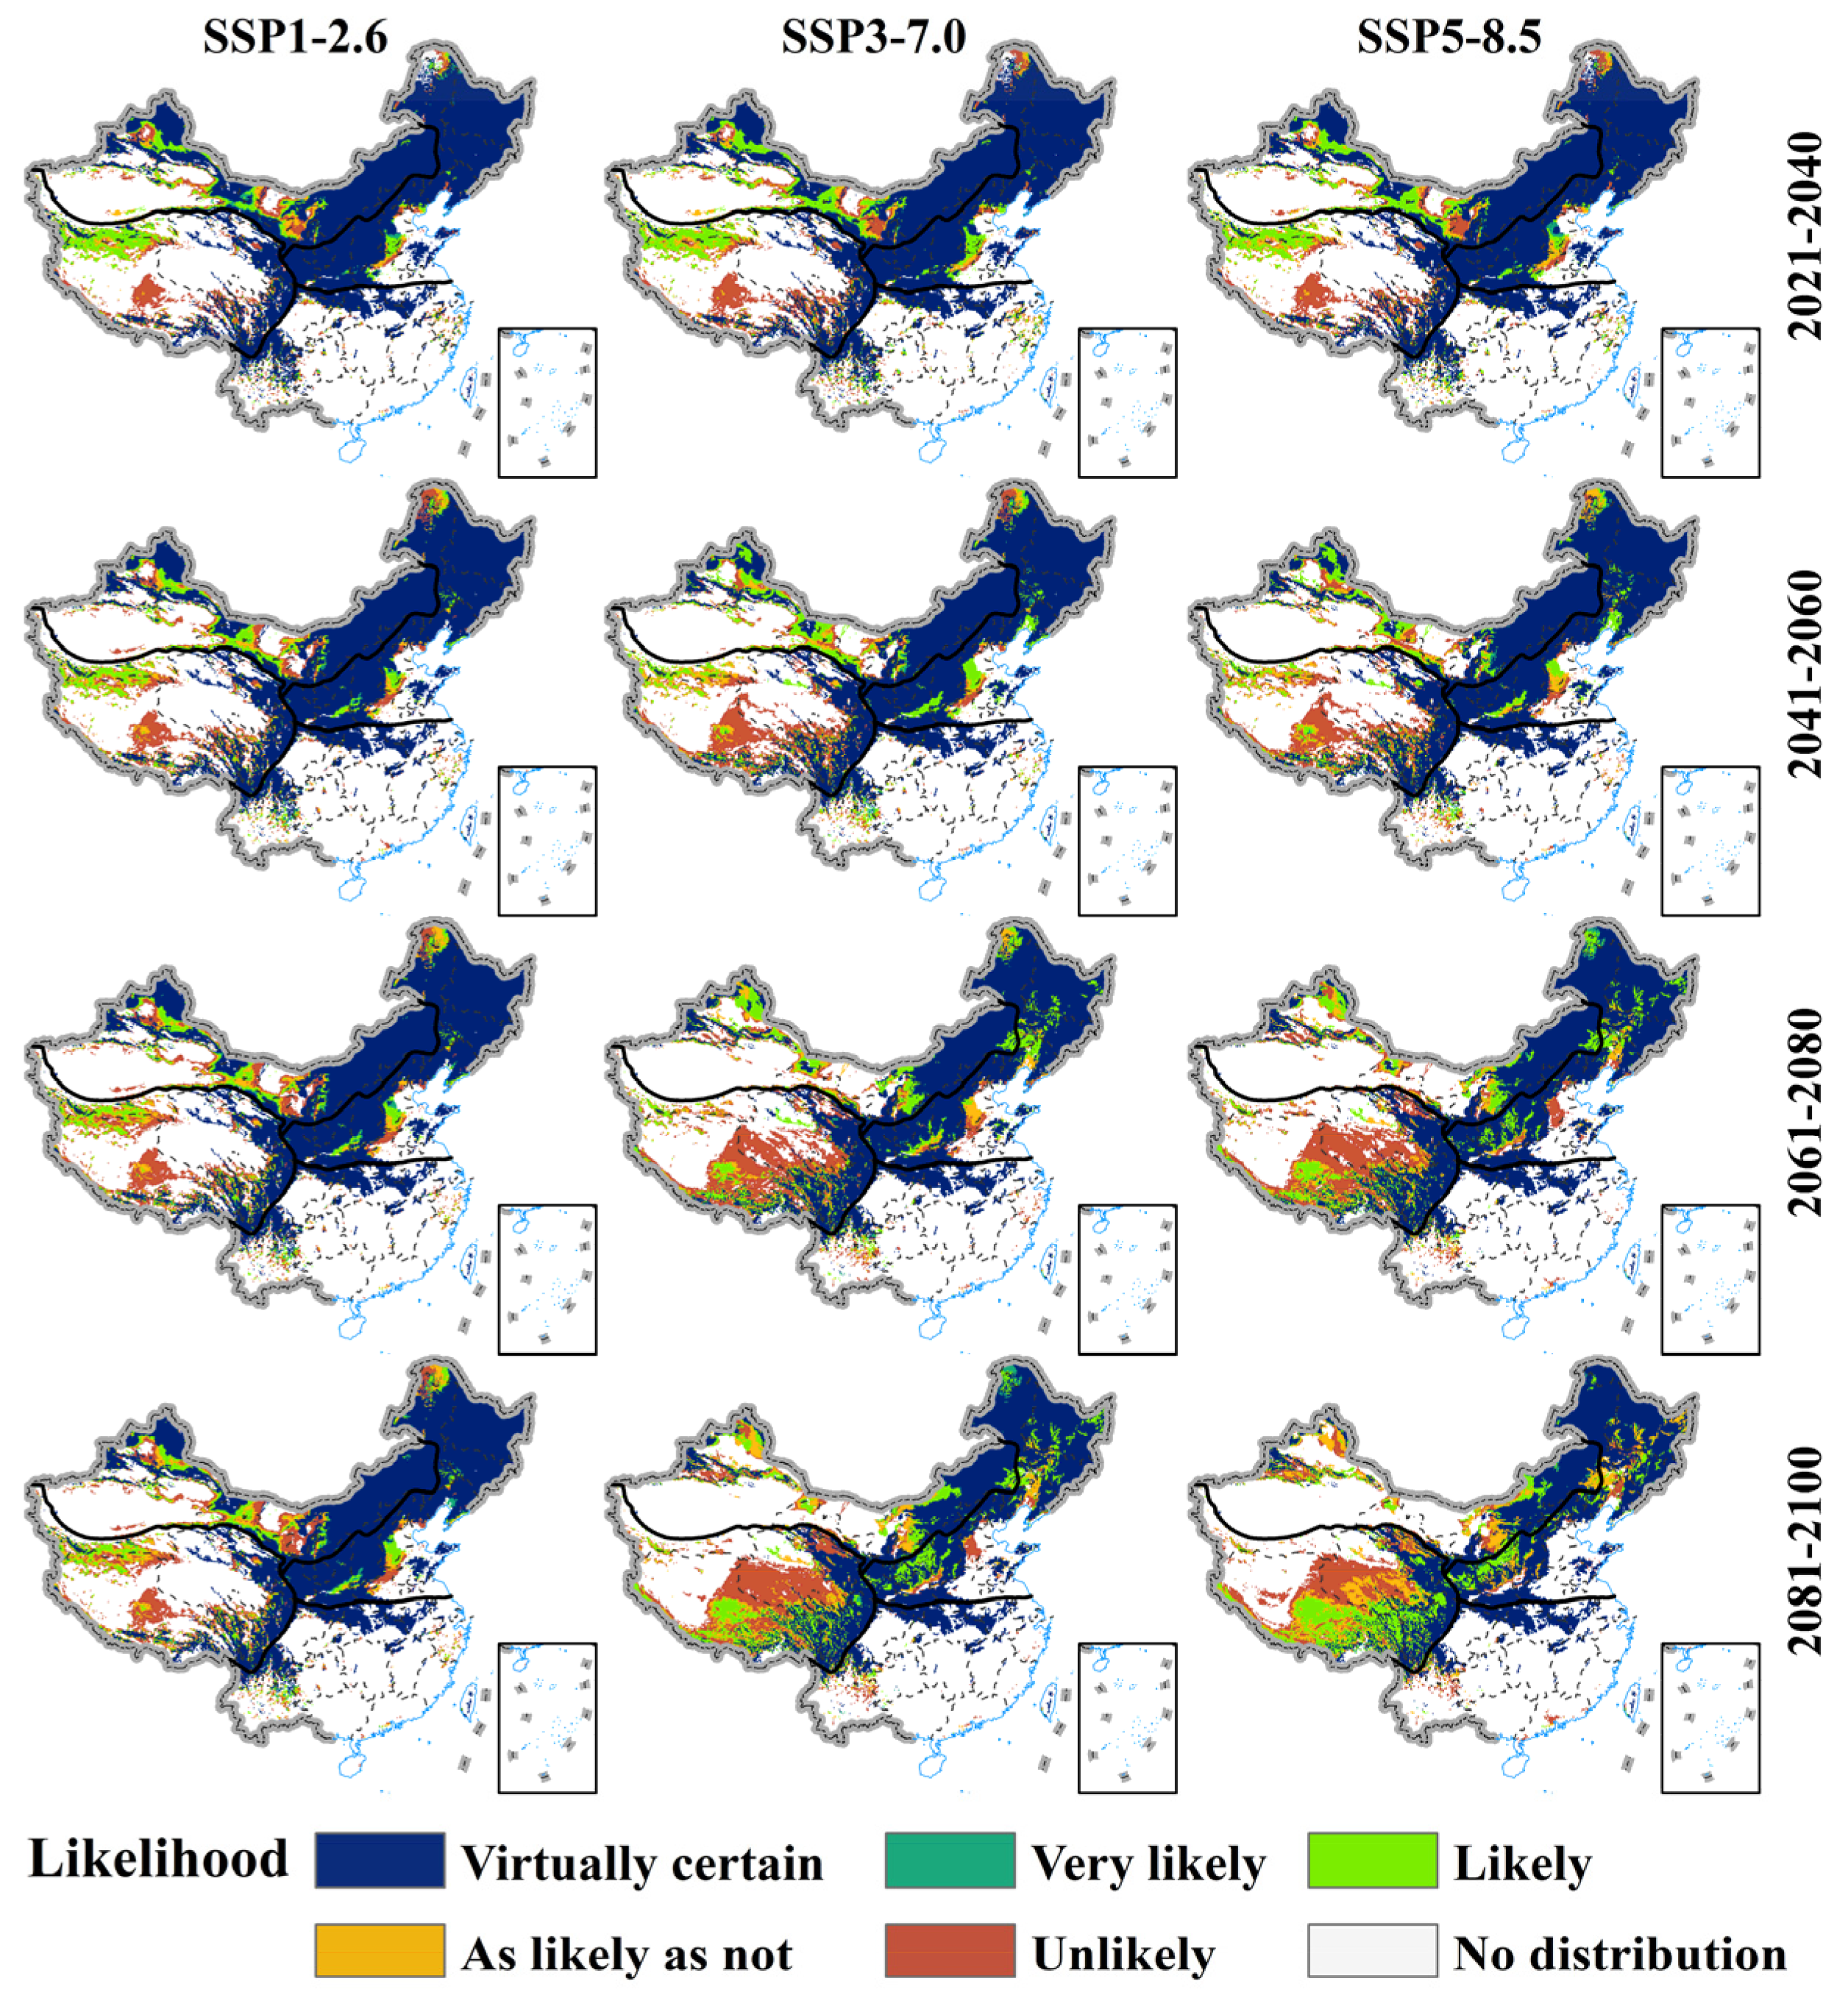
3.3. Distribution Pattern of Suitability under Current and Future Climatic Condition

Under current climatic conditions (1981–2010), the suitability of S. baicalensis under current conditions is projected to be high in the east and north of China but low in the west and south of China (Figure 3). Current unsuitable area for S. baicalensis is mainly distributed in the Tibetan Plateau Area, some regions of southern China, and the southwestern part of Northwest China, and is 4.68 million km2 in China, accounting for 50.76 percent of the total areas (Table 4). The areas of marginally and moderately suitable cultivation area are 2.24 million km2 and 1.30 million km2, respectively. The extremely suitable environmental conditions for S. baicalensis are mainly concentrated in northern China, the eastern part of Northwest China, the western part of southern China, and a smaller area in the eastern part of Tibetan Plateau Area, which are the country’s major S. baicalensis production areas, and are 1.00 million km2 in China, accounting for 10.89% of the total areas. Northeastern Inner Mongolia, southern Heilongjiang, west of Jilin and Henan, part of Liaoning and Hebei, central and eastern parts of Shandong, most areas of Shanxi and Ningxia, south of Shaanxi and Gansu, and west of Yunnan and Guizhou were found to be extremely suitable for cultivating S. baicalensis in China. The distribution pattern of suitability for S. baicalensis in China under current climatic conditions is similar to the pattern simulated by GMPGIS [27] and MaxEnt [38,39], indicating that our result is reliable.
Suitable-level maps for S. baicalensis across China during 2021–2040, 2041–2060, 2061–2080, and 2081–2100 under SSP1-2.6, SSP3-7.0, and SSP5-5.8 are shown in Figure 4. Compared with 1981–2010, patterns of suitability for S. baicalensis during the 21st century under the three SSP scenarios are projected to be very similar. The suitable area for S. baicalensis is projected to be mainly distributed in northern China, the southeastern part of Northwest China, the northern part of southern China, and the eastern regions of the Tibetan Plateau Area. The extremely suitable regions for S. baicalensis are projected to be mainly concentrated in some areas north of the Qinling–Huaihe River and a smaller area in the eastern part of Tibetan Plateau Area, which could be the country’s major S. baicalensis production areas in the 21st century, and the area is projected to increase under the three scenarios. Average areas of both marginal and moderate suitability are projected to decrease. Compared to current climatic conditions, average unsuitability areas are projected to increase to 5.21 million km2 (accounting for 56.49% of the total areas) during 2021–2040 and 5.42 million km2 (accounting for 58.73% of the total areas) during 2081–2100 (Table 4). The trend of coverage area of each suitability level during the 21st century for all SSPs is similar; nevertheless, changes under a higher-emission scenario are larger than those under a lower-emission scenario.
Figure 5 shows the mean, inter-quartile range, and distribution of the suitability indexes in the four eco-regions of China under current climatic conditions and during 2021–2040, 2041–2060, 2061–2080, and 2081–2100 under different RCPs. Under current climatic conditions, the mean of the suitability indexes in the northern China region is the highest (2.80), indicating that northern China is the most suitable for S. baicalensis. And the suitability indexes are greater than 2.1 for most grids (more than 75%). The mean of the suitability indexes in the northwestern China region is 2.29, and more than 75% of grids in northwestern China have marginal and moderate suitability. The means of the suitability indexes in the southern China region and Tibetan Plateau Area are 2.08 and 1.64, respectively, indicating that both regions have an unsuitability for S. baicalensis. The suitability indexes in the southern China region are between 1.5 and 2.5 for the vast majority of the grids. The suitability indexes in the Tibetan Plateau Area are smaller than 2.10 for most grids (more than 75%), indicating that over three quarters of the grids in the Tibetan Plateau region are unsuitable for S. baicalensis.
The distribution of the suitability indexes in each one of the four eco-regions during 2021–2040, 2041–2060, 2061–2080, and 2081–2100 under different SSPs would be similar with distribution under current climatic conditions. However, the mean of the suitability indexes of each eco-region is projected to increase or decrease compared with the mean under current climatic conditions. The change in the mean of the suitability indexes is generally large under a high-emission scenario, while the change becomes smaller under lower-emission scenarios but the degree of changes varies for different regions and under different SSPs. In the Tibetan Plateau region, the mean of the suitability indexes during 2021–2040 under three SSPs is projected to be about 1.80, increasing by 0.16 compared with the mean under current climatic conditions. During 2081–2100, the means of the suitability indexes under SSP1-2.6, SSP8370, and SSP5-5.8 are projected to be 1.85, 2.01, and 2.06, respectively, increasing by 0.21, 0.37, and 0.42, respectively, during the 21st century. The mean of the suitability indexes of northern China during the 21st century is projected to increase first and then decrease. During 2081–2100, the means of the suitability indexes under SSP1-2.6, SSP8370, and SSP5-5.8 are projected to be 2.81, 2.71, and 2.71, respectively, increasing by 0.04, −0.09, and −0.09, respectively, during the 21st century. The means of the suitability indexes of both northwestern China and southern China are all projected to decrease in the 21st century. The means of the suitability indexes under SSP1-2.6, SSP3-7.0, and SSP5-5.8 in northwestern China are projected to be 2.26, 2.10, and 2.03, respectively, while the means in southern China are projected to be 1.90, 1.83, and 1.81, respectively.

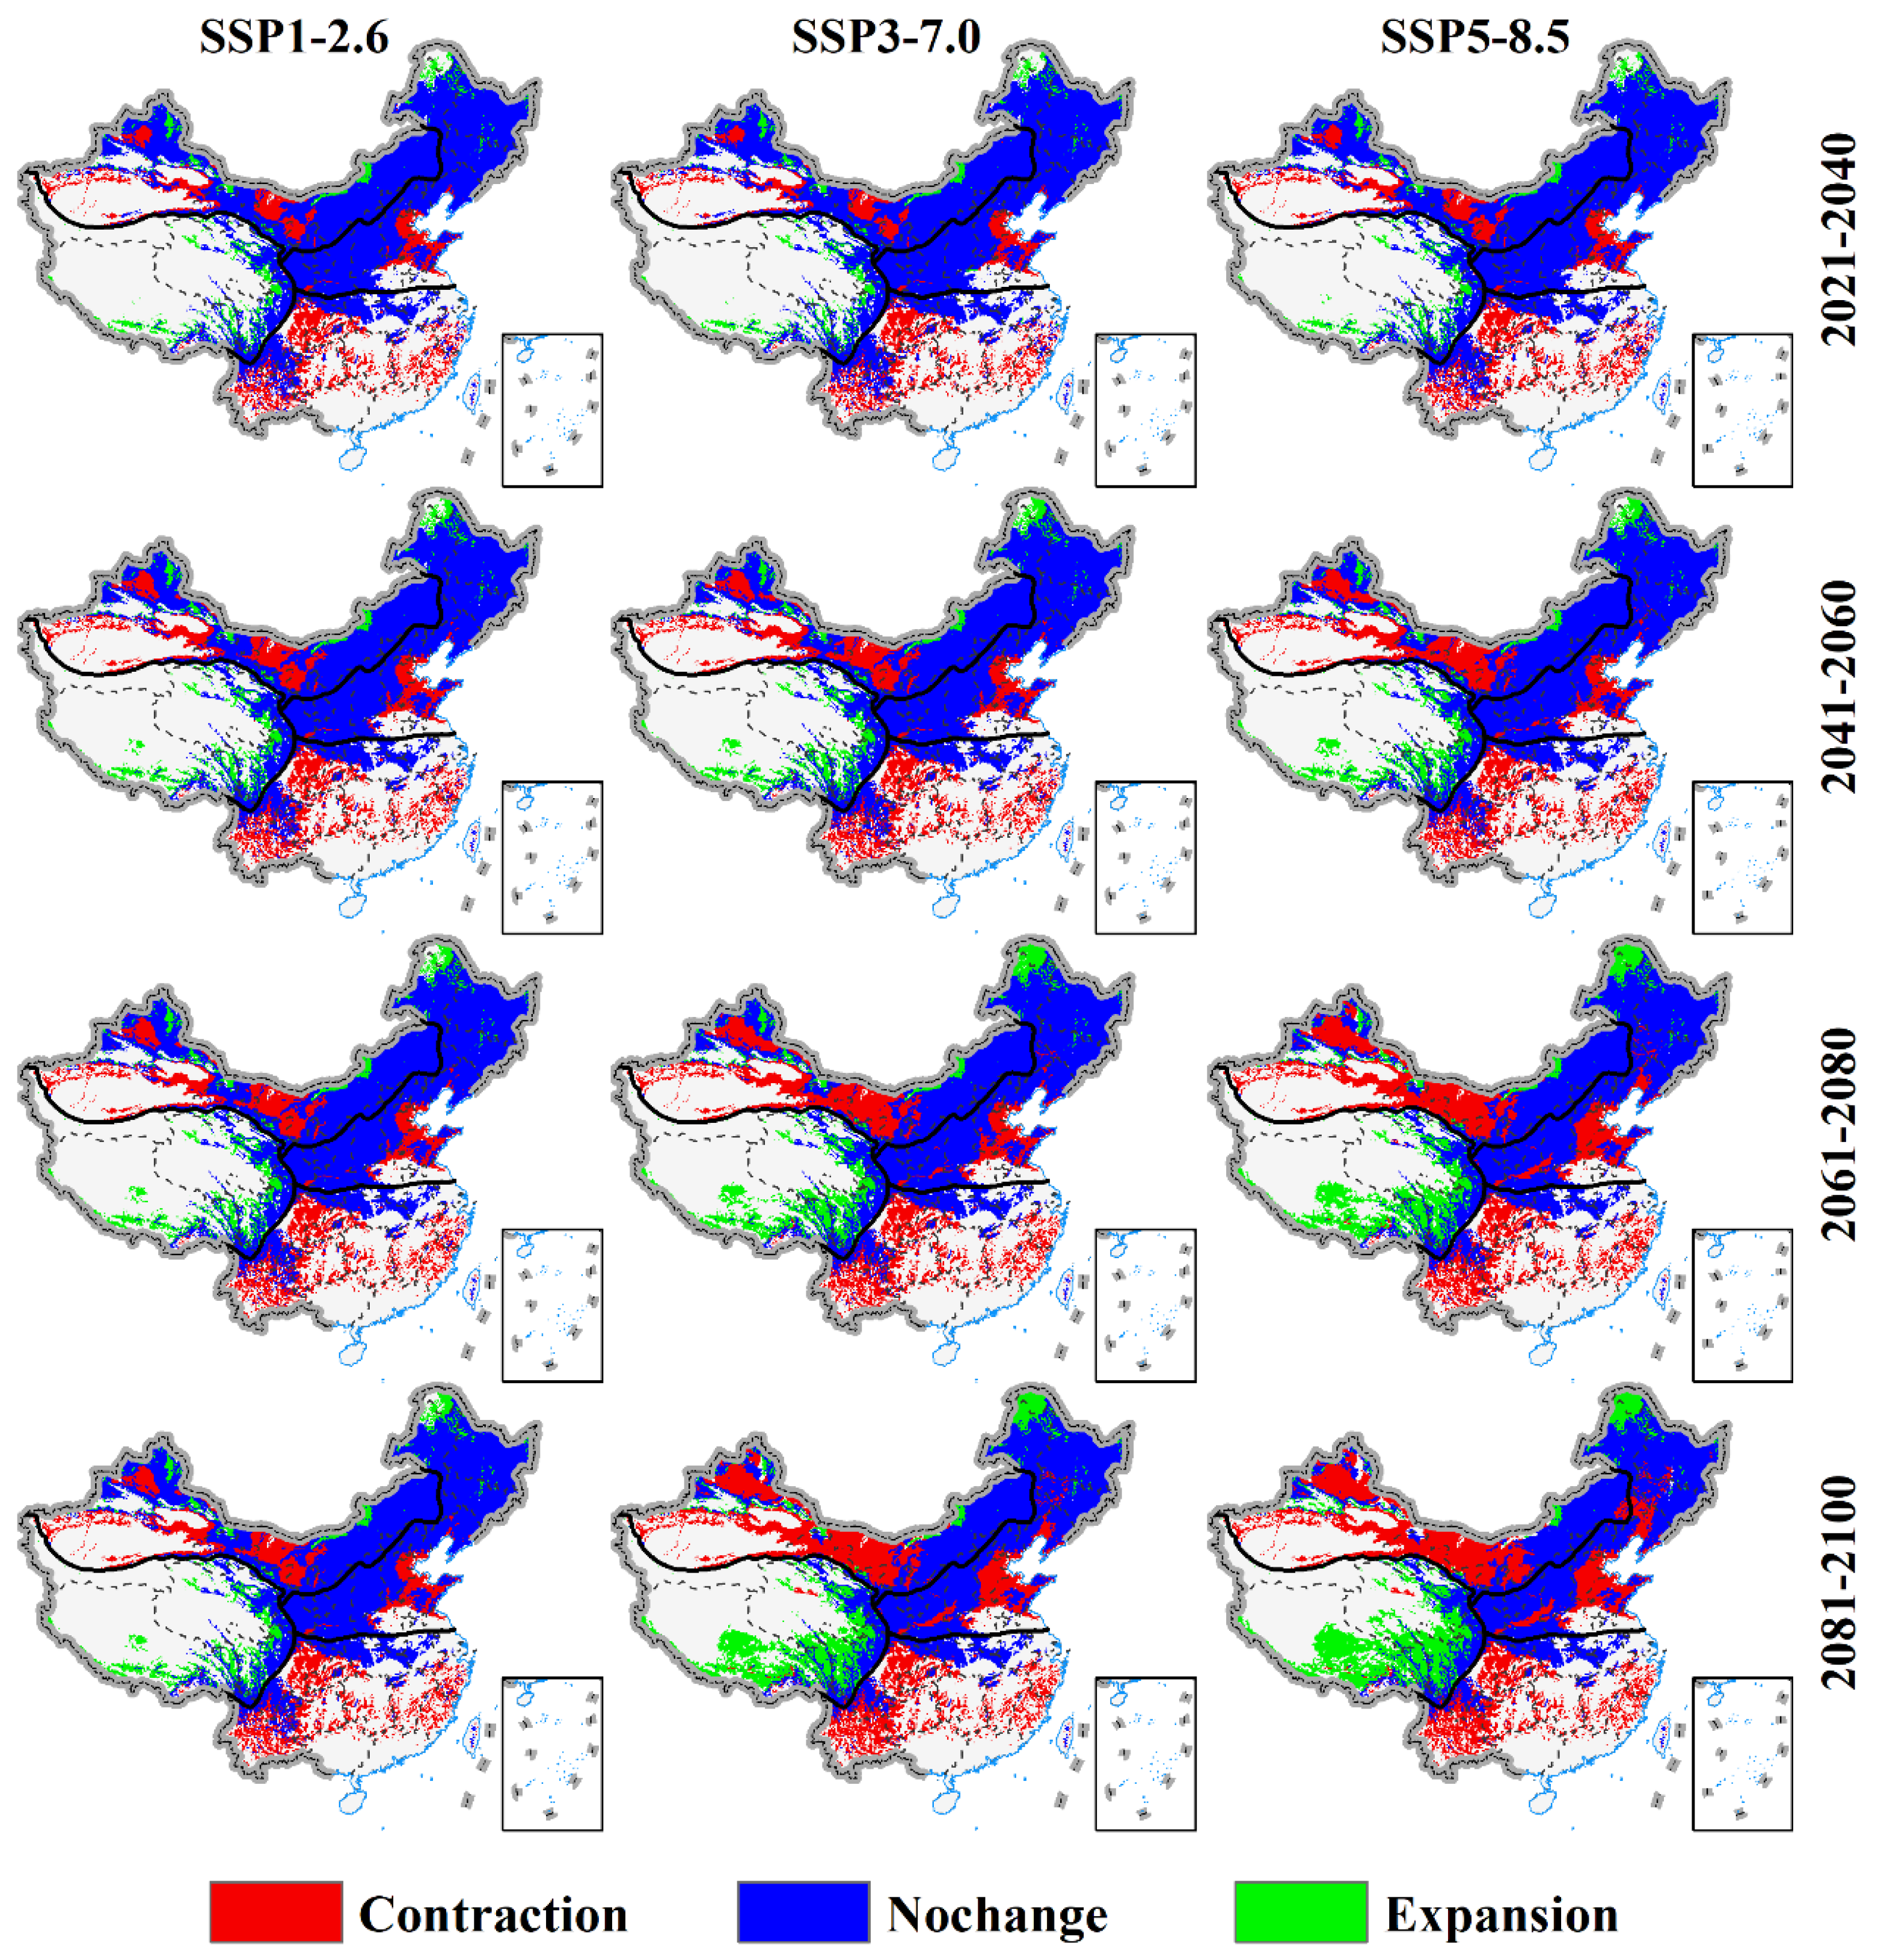
3.4. Shifts of Suitable Cultivation Area under Climate Change

The S. baicalensis would adjust its potential distribution northward and westward in response to climate warming with varying magnitudes of shifts during the 21st century (Figure 6). The S. baicalensis is projected to experience the expansion of suitable cultivation area in the southeastern part of the Tibetan Plateau region with some areas in the northern part of northern China and of northwestern China. Compared to current climatic conditions, the average suitable areas of expansion during 2021–2040, 2041–2060, 2061–2080, and 2081–2100 are 0.38, 0.52, 0.67, and 0.78 million km2 (Table 5), respectively. And the expansion area under a lower-emission scenario is smaller than that under a higher-emission scenario (Table 3). The S. baicalensis is projected to experience an accelerated contraction of a suitable habitat, and a major contraction will occur in southern China, the Huang-Huai-Hai plain, and the midwest of northwestern China. The average suitable areas of contraction are 0.90, 1.17, 1.37, and 1.51 million km2 during 2021–2040, 2041–2060, 2061–2080, and 2081–2100, respectively. And the higher-emission scenarios would lead to a larger contraction of suitable areas of the S. baicalensis than the lower-emission scenario (Table 3). Our model indicates that climate change could pose a threat to the S. baicalensis in the southern and northwestern part of its current distribution, and the southwestern part and small area of northern China will benefit from climate changes.
The geographical centroid of the potential suitable cultivation area of the S. baicalensis is located in Inner Mongolia Autonomous Region (Figure 7). The centroid under current climatic conditions is located at 109.62° E/39.13° N (Table S4), and throughout the 20th century, the core of the potential shifted towards the north and the east under future emission trajectories. By the 2030s (2021–2040), the centroids under the three SSP scenarios will shift northeastward, and the average shift distance is projected to be about 131.8 km. Compared to the 2021–2040 period, the centroids under SSP1-2.6 and SSP3-7.0 are projected to shift northeastward 25.2 km and 40.3 km by the 2050s (2041–2060), respectively, while the centroid under SSP5-5.8 will shift southeastward 40.2 km. Compared to the 2041–2060 period, the centroids under SSP1-2.6, SSP3-7.0, and SSP5 will shift northeastward, southeastward, and southwestward by the 2070s (2061–2080), respectively. By the end of the 21st century, the simulated centroid under SSP1-2.6 will shift to 110.51° E/40.30° N in the northeast with a distance of 1.3 km, while the simulated centroids under SSP3-7.0 and SSP5-5.8 will shift to 110.56° E/39.87° N and 110.08° E/39.58° N in the southwest with the distances of 40.1 km and 69.9 km.

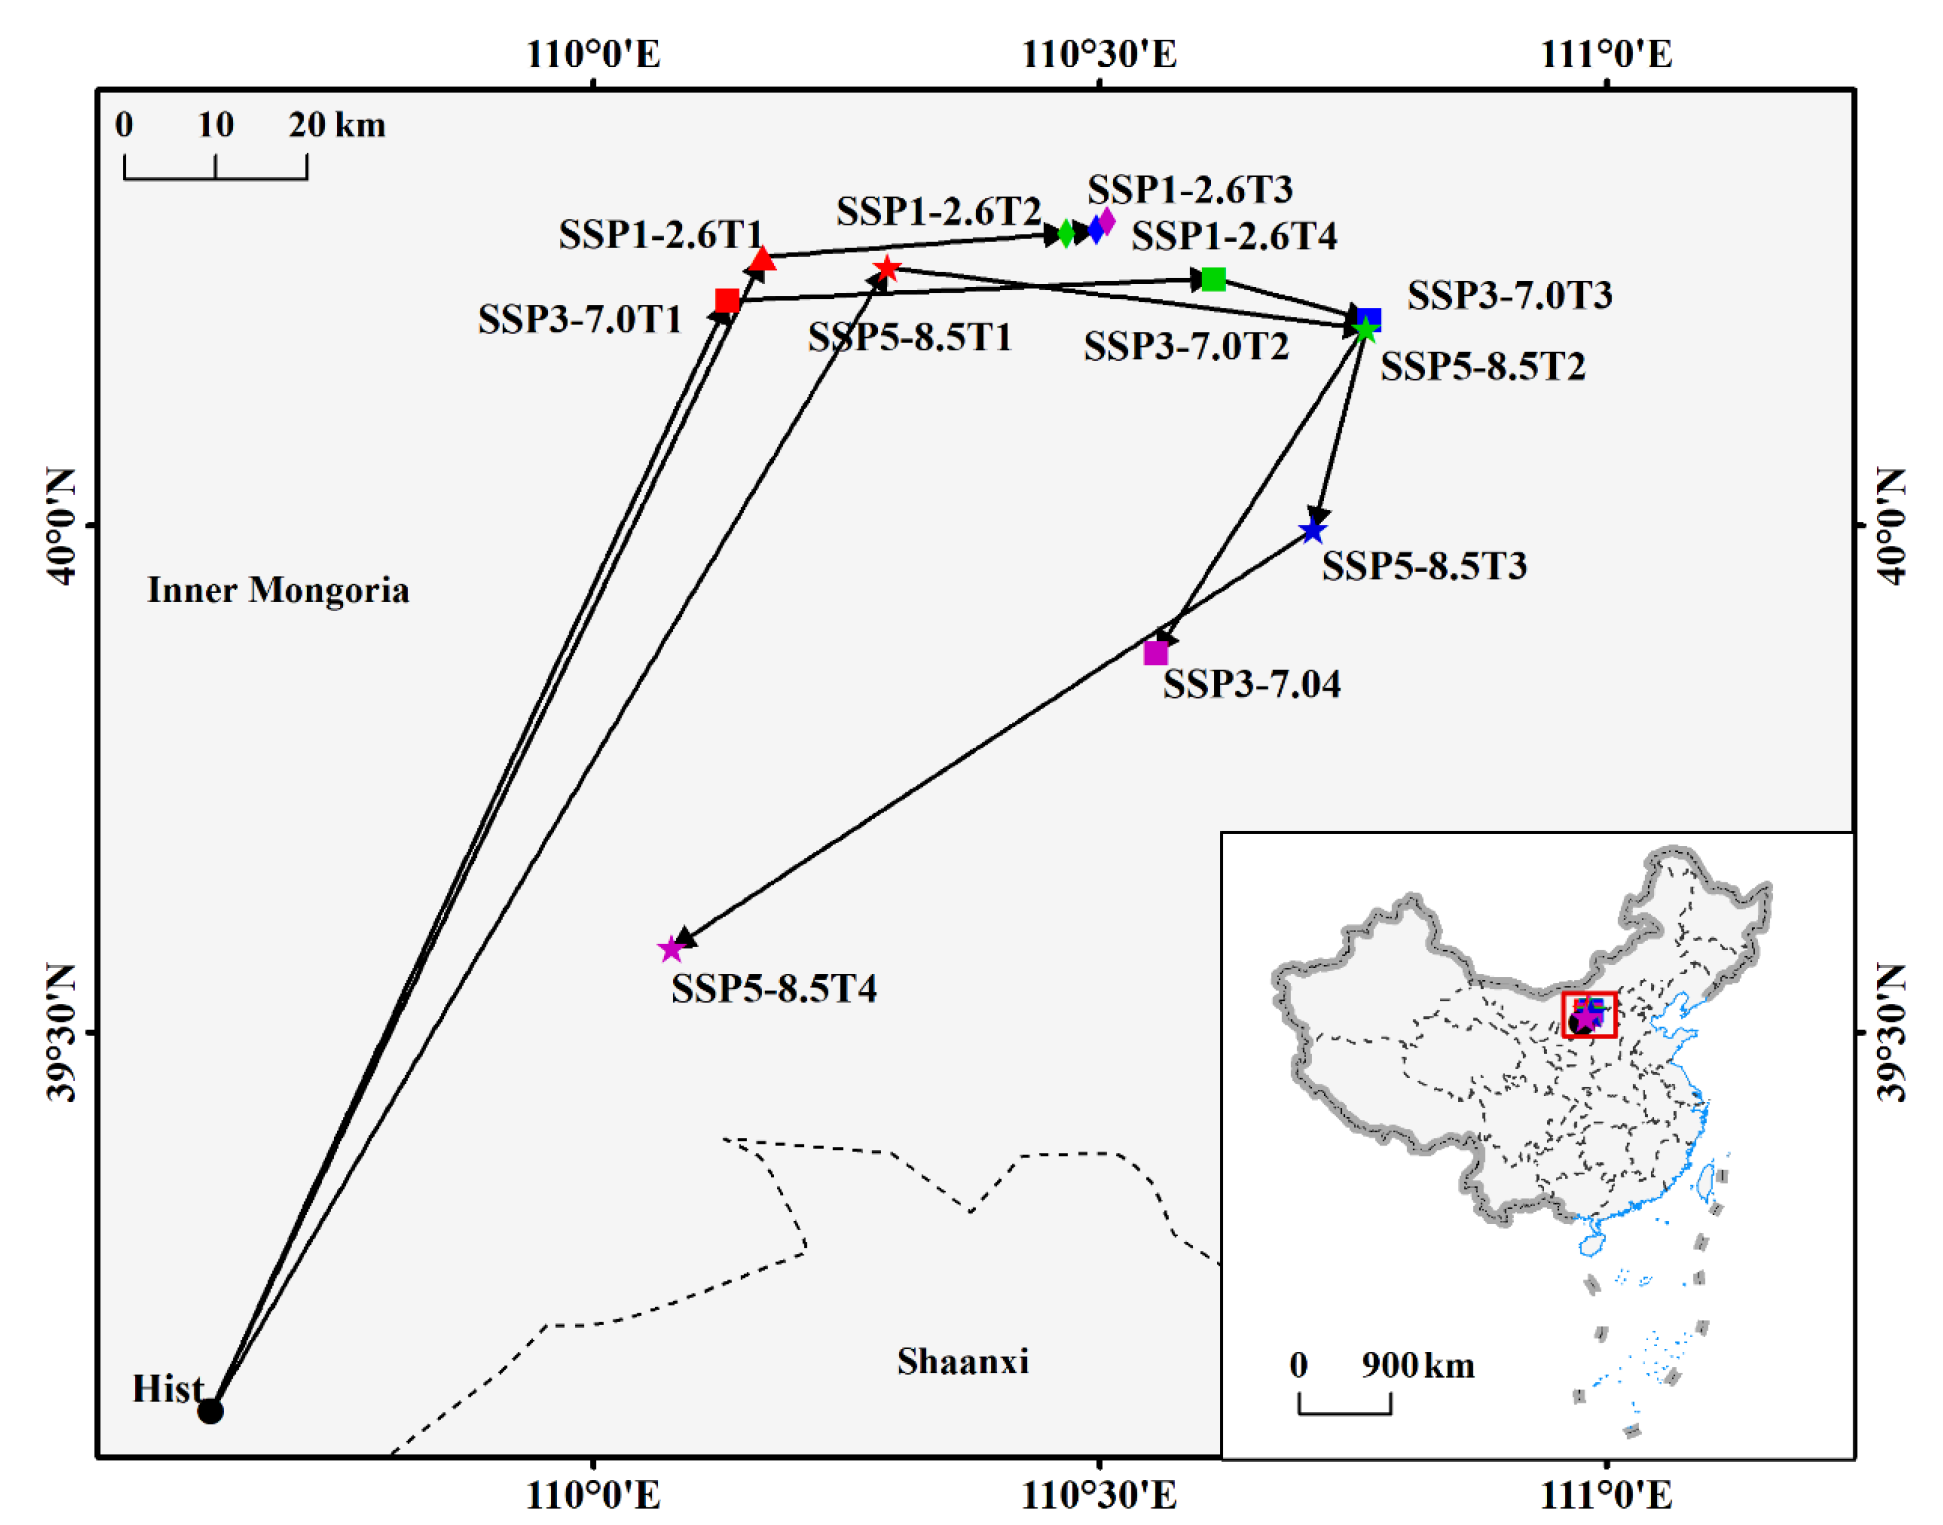
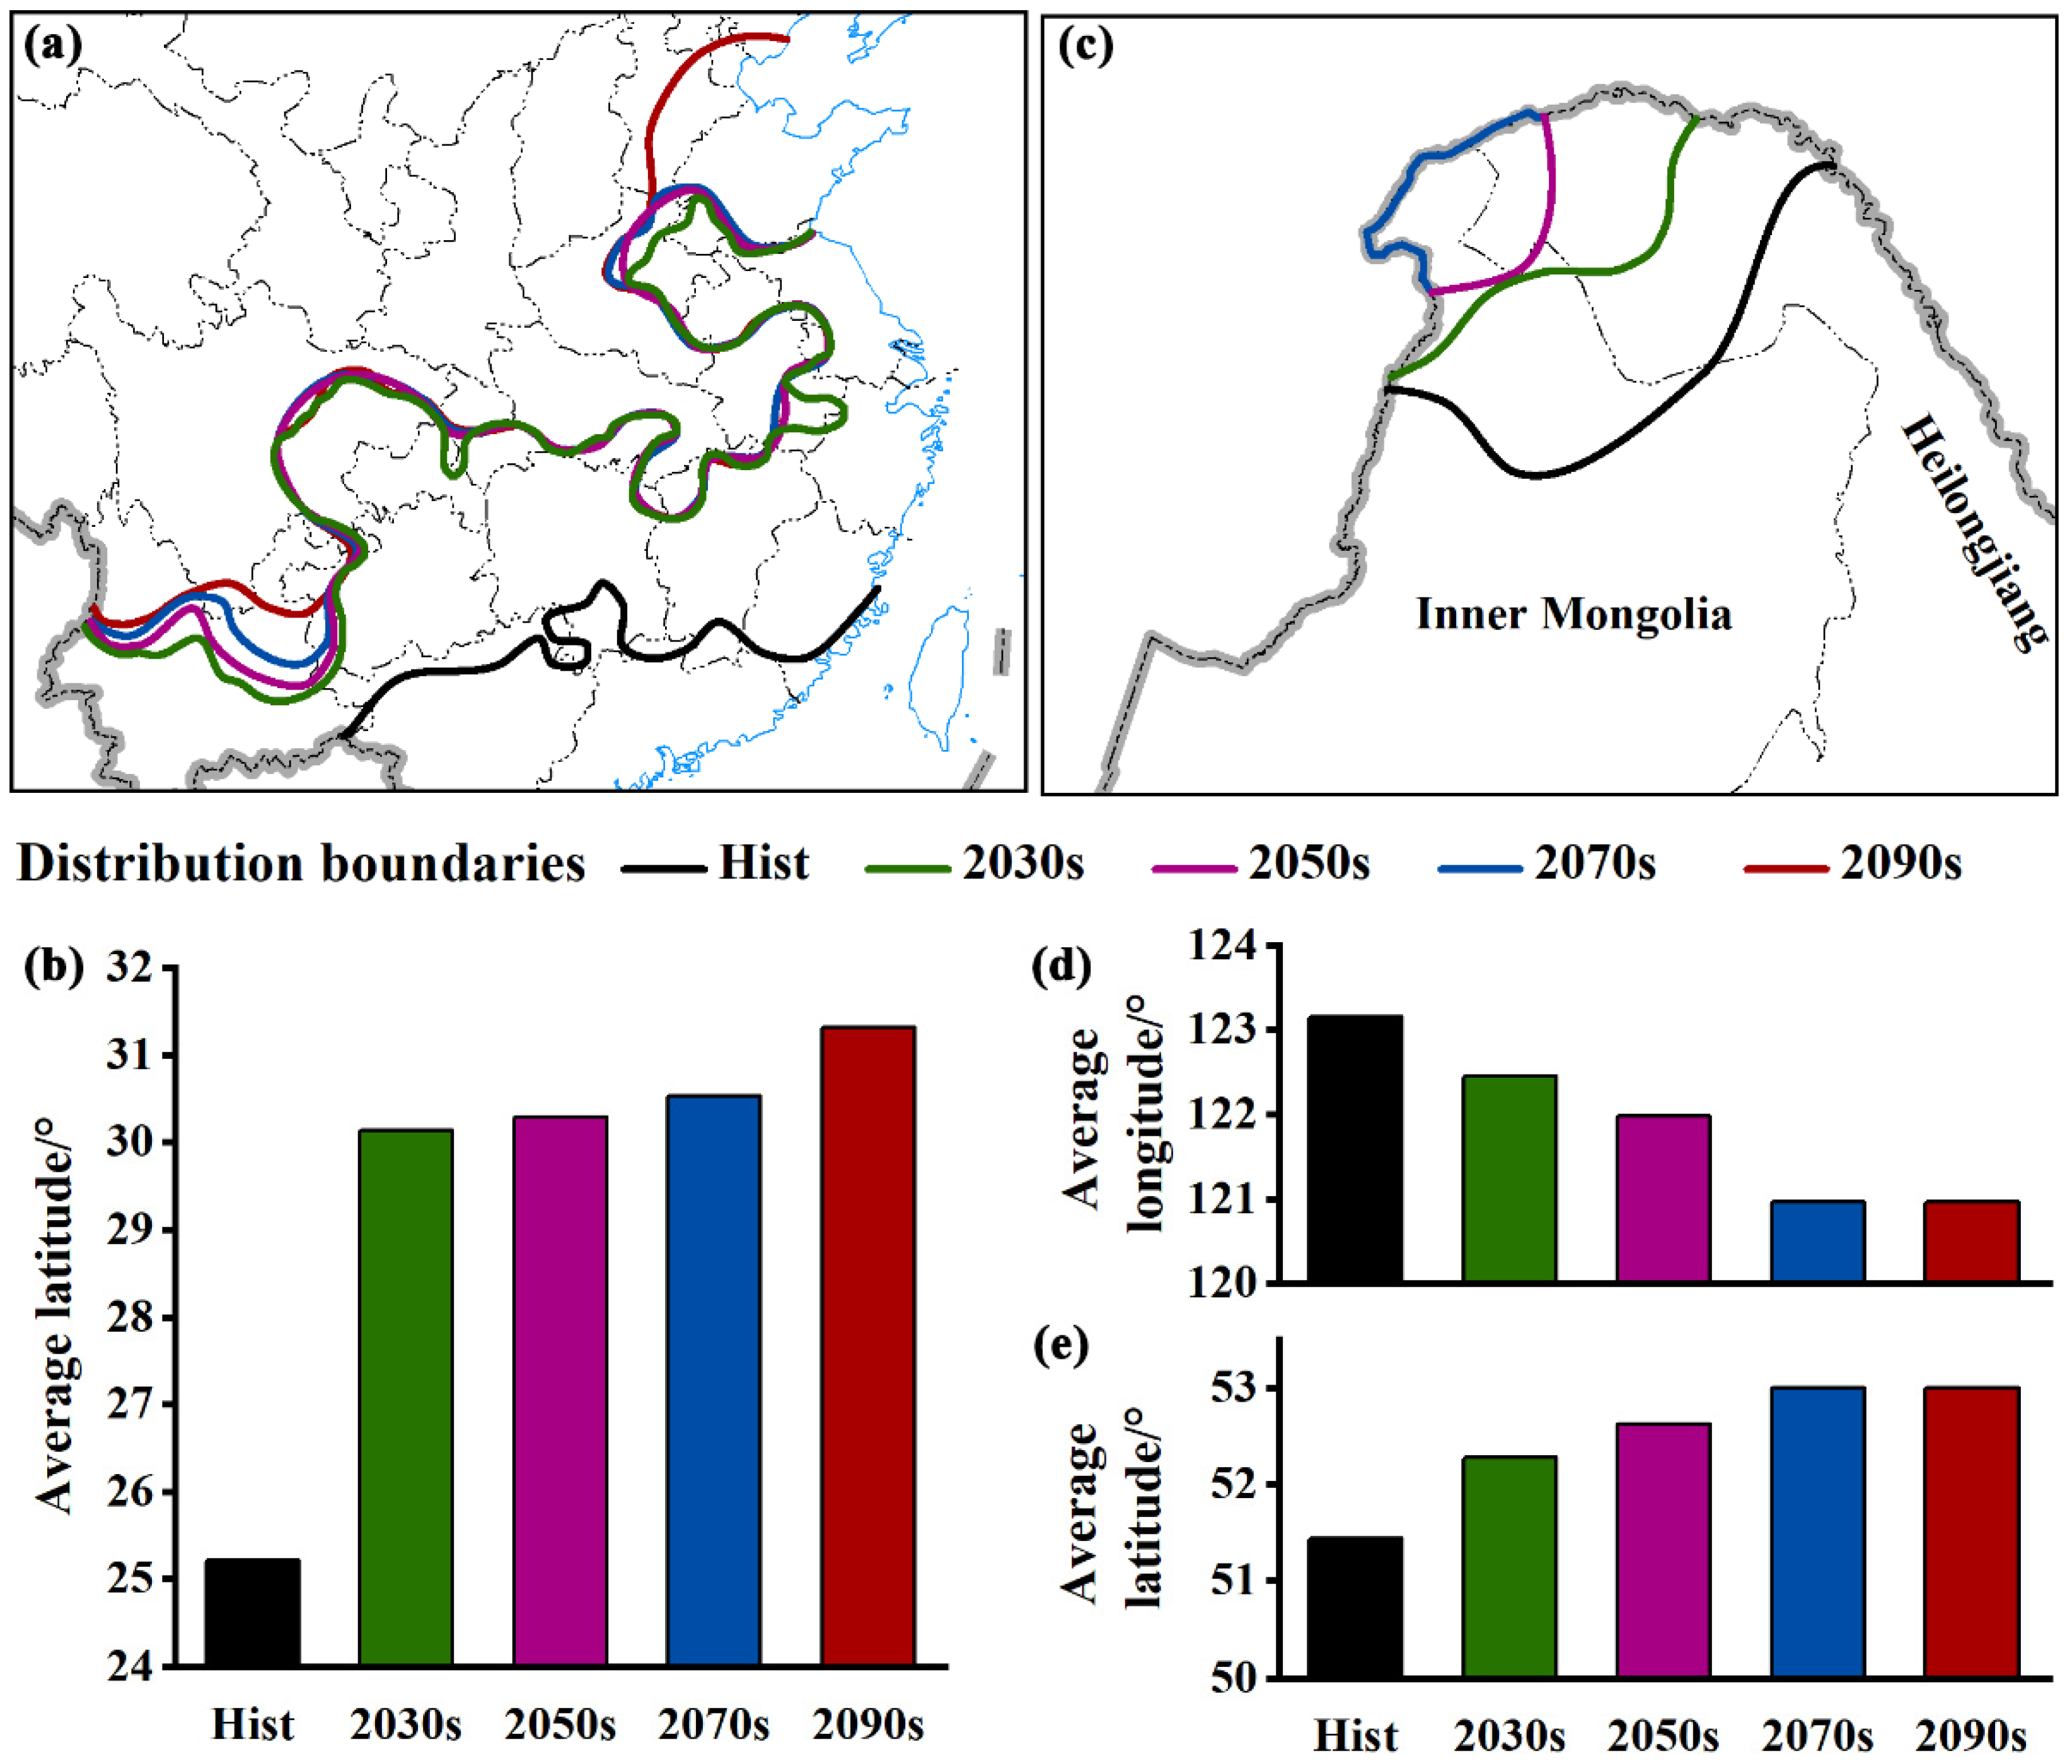
3.5. Distribution Boundaries of S. baicalensis in China under Climate Change

Climate warming is expected to shift the distribution of S. baicalensis in China northward through an expansion at the northern and contraction at the southern boundary, respectively (Figure 8). The south boundary under current climate spread along southeastern Yunnan–northern Guangxi–southwestern Hunan–southern Jiangxi–southern Fujian (Figure 8a), and the average latitude of the boundary was approximately 25.21° N (Figure 8b). Compared with 1981–2010, the southern boundary is projected to move northward by more than 529 km during the 21st century, and the average latitudes will increase to 30.13, 30.29, 30.53, and 31.31° N in the 2030s, 2050s, 2070s, and 2090s, respectively. The north boundary under current climate spread along northern Inner Mongolia–northern Heilongjiang (Figure 8c), and the average latitude and longitude of the boundary were approximately 25.21° N (Figure 8d) and 123.15° E (Figure 8e). Compared with 1981–2010, the northern boundary shows a remarkable northward and westward extension under the impact of climate change. The mean northward and westward extension shift distances of the northern boundary are projected to be at least 84 km and 62 km.

4. Discussion

In this study, based on the Geodetector and Habitat Suitability Index (HSI) method, we proposed an assessment model to identify the critical environmental variable(s) affecting the distribution of suitable cultivation area for S. baicalensis in China and to project its shift under climate change. The proposed method not only inherits the advantages of the HIS method, but also cannot rely on expert knowledge and can explicitly illustrate spatial heterogeneity of the herbs. The accuracy of our assessment results is 95.64%. According to the criterion suggested by Swets [40], our proposed model is adequate and robust for simulating suitability of S. baicalensis in China. Soil and mean annual temperature are two determining variables in its spatial heterogeneity in China. However, the main contributing variables to the distribution of S. baicalensis in this study are inconsistent with those of many previous studies [39,40]. The overwhelming majority of suitability assessments of S. baicalensis focused on the bioclimatic variables [19,39,40]. Yet, a sprinkling of assessments considering soil show that soil type is a critical environmental variable affecting the distribution of S. baicalensis in China. Furthermore, we also investigated whether the interaction between two contributing variables is enhanced.

4.1. Interactive Effect of Different Variables on the Density of S. baicalensis

We used the interaction detector of the Geodetector model to quantify the effects of a two-variable interaction on the distribution of S. baicalensis. The effects of a two-variable interaction on the density of S. baicalensis were greater than effects of a single variable (Figure 9), denoting that the variable interactions showed enhancement. Although aspect and elevation did not contribute ideally to the density of S. baicalensis, their explanatory degree could be enhanced when interacting with others, especially mean annual temperature and vegetation type. The interaction effect values for mean annual temperature and DEM, soil type and aspect, and mean annual temperature and aspect were 0.281, 0.267, and 0.207, respectively, denoting that soil type and mean annual temperature, especially them combined with other variables, played a critical role in the distribution of S. baicalensis.

4.2. Uncertainty in the Projection of Future Suitability

GCMs, as an effective tool for predicting the impact of future climate change, was used to simulate the suitability of S. baicalensis in this study. However, owing to the climate model uncertainty, scenario uncertainty, and internal variability, the quantitative projections from GCMs are highly uncertain [6,41]. According to IPCC terminology, a series of maps for each time horizon were generated and then combined into a final map, which shows the future likelihood of suitability [5]. There are 19, 20, and 18 maps for 2061–2080 under SSP3-7.0, 2081–2100 under SSP1-2.6, and 2081–2100 under SSP5-5.8. Meanwhile, there are 21 maps for each time horizon except those three time horizons. Figure 10 shows the future likelihood suitability for the S. baicalensis across China under SSP1-2.6, SSP3-7.0, and SSP5-5.8 scenarios. Gray areas indicate that the S. baicalensis would not be suitable for growing, while chromatic colors indicate the magnitude of likelihood for future climate-driven suitability. The figure shows unlikely outcomes (suitability predicted by less than 33% GCMs) for the S. baicalensis located mainly in the Tibetan Plateau region and partially in the west of northwestern China and the north of northern China. And the number of grids with unlikely outcomes under a higher-emission scenario is larger than the number under a lower-emission scenario. The virtually certain outcomes (suitability predicted by more than 99% GCMs) are found in the north of southern China and the east of the Tibetan Plateau region, and in the vast majority of grids in northern China and the east of northwestern China under SSP1-2.6. However, the likelihood of suitability in the north of Xijing Uygur Autonomous Region and the west of northern China drastically decreases in the SSP 585 scenario.
The uncertainty of the result is not only from the climate models, but also from the bias correction methods, the precision of the observational data used for bias correction [42], and the periods used for calibration [43]. The projected average annual temperature and precipitation data used in this study were bias-corrected by Fick and Hijmans [31] using data from between 9000 and 60,000 weather stations for 1970–2000. However, these observational data used for bias correction are sparse in China. In a future study, based on the in situ observations provided by China Meteorological Administration, we will further bias-correct the projected climate data.

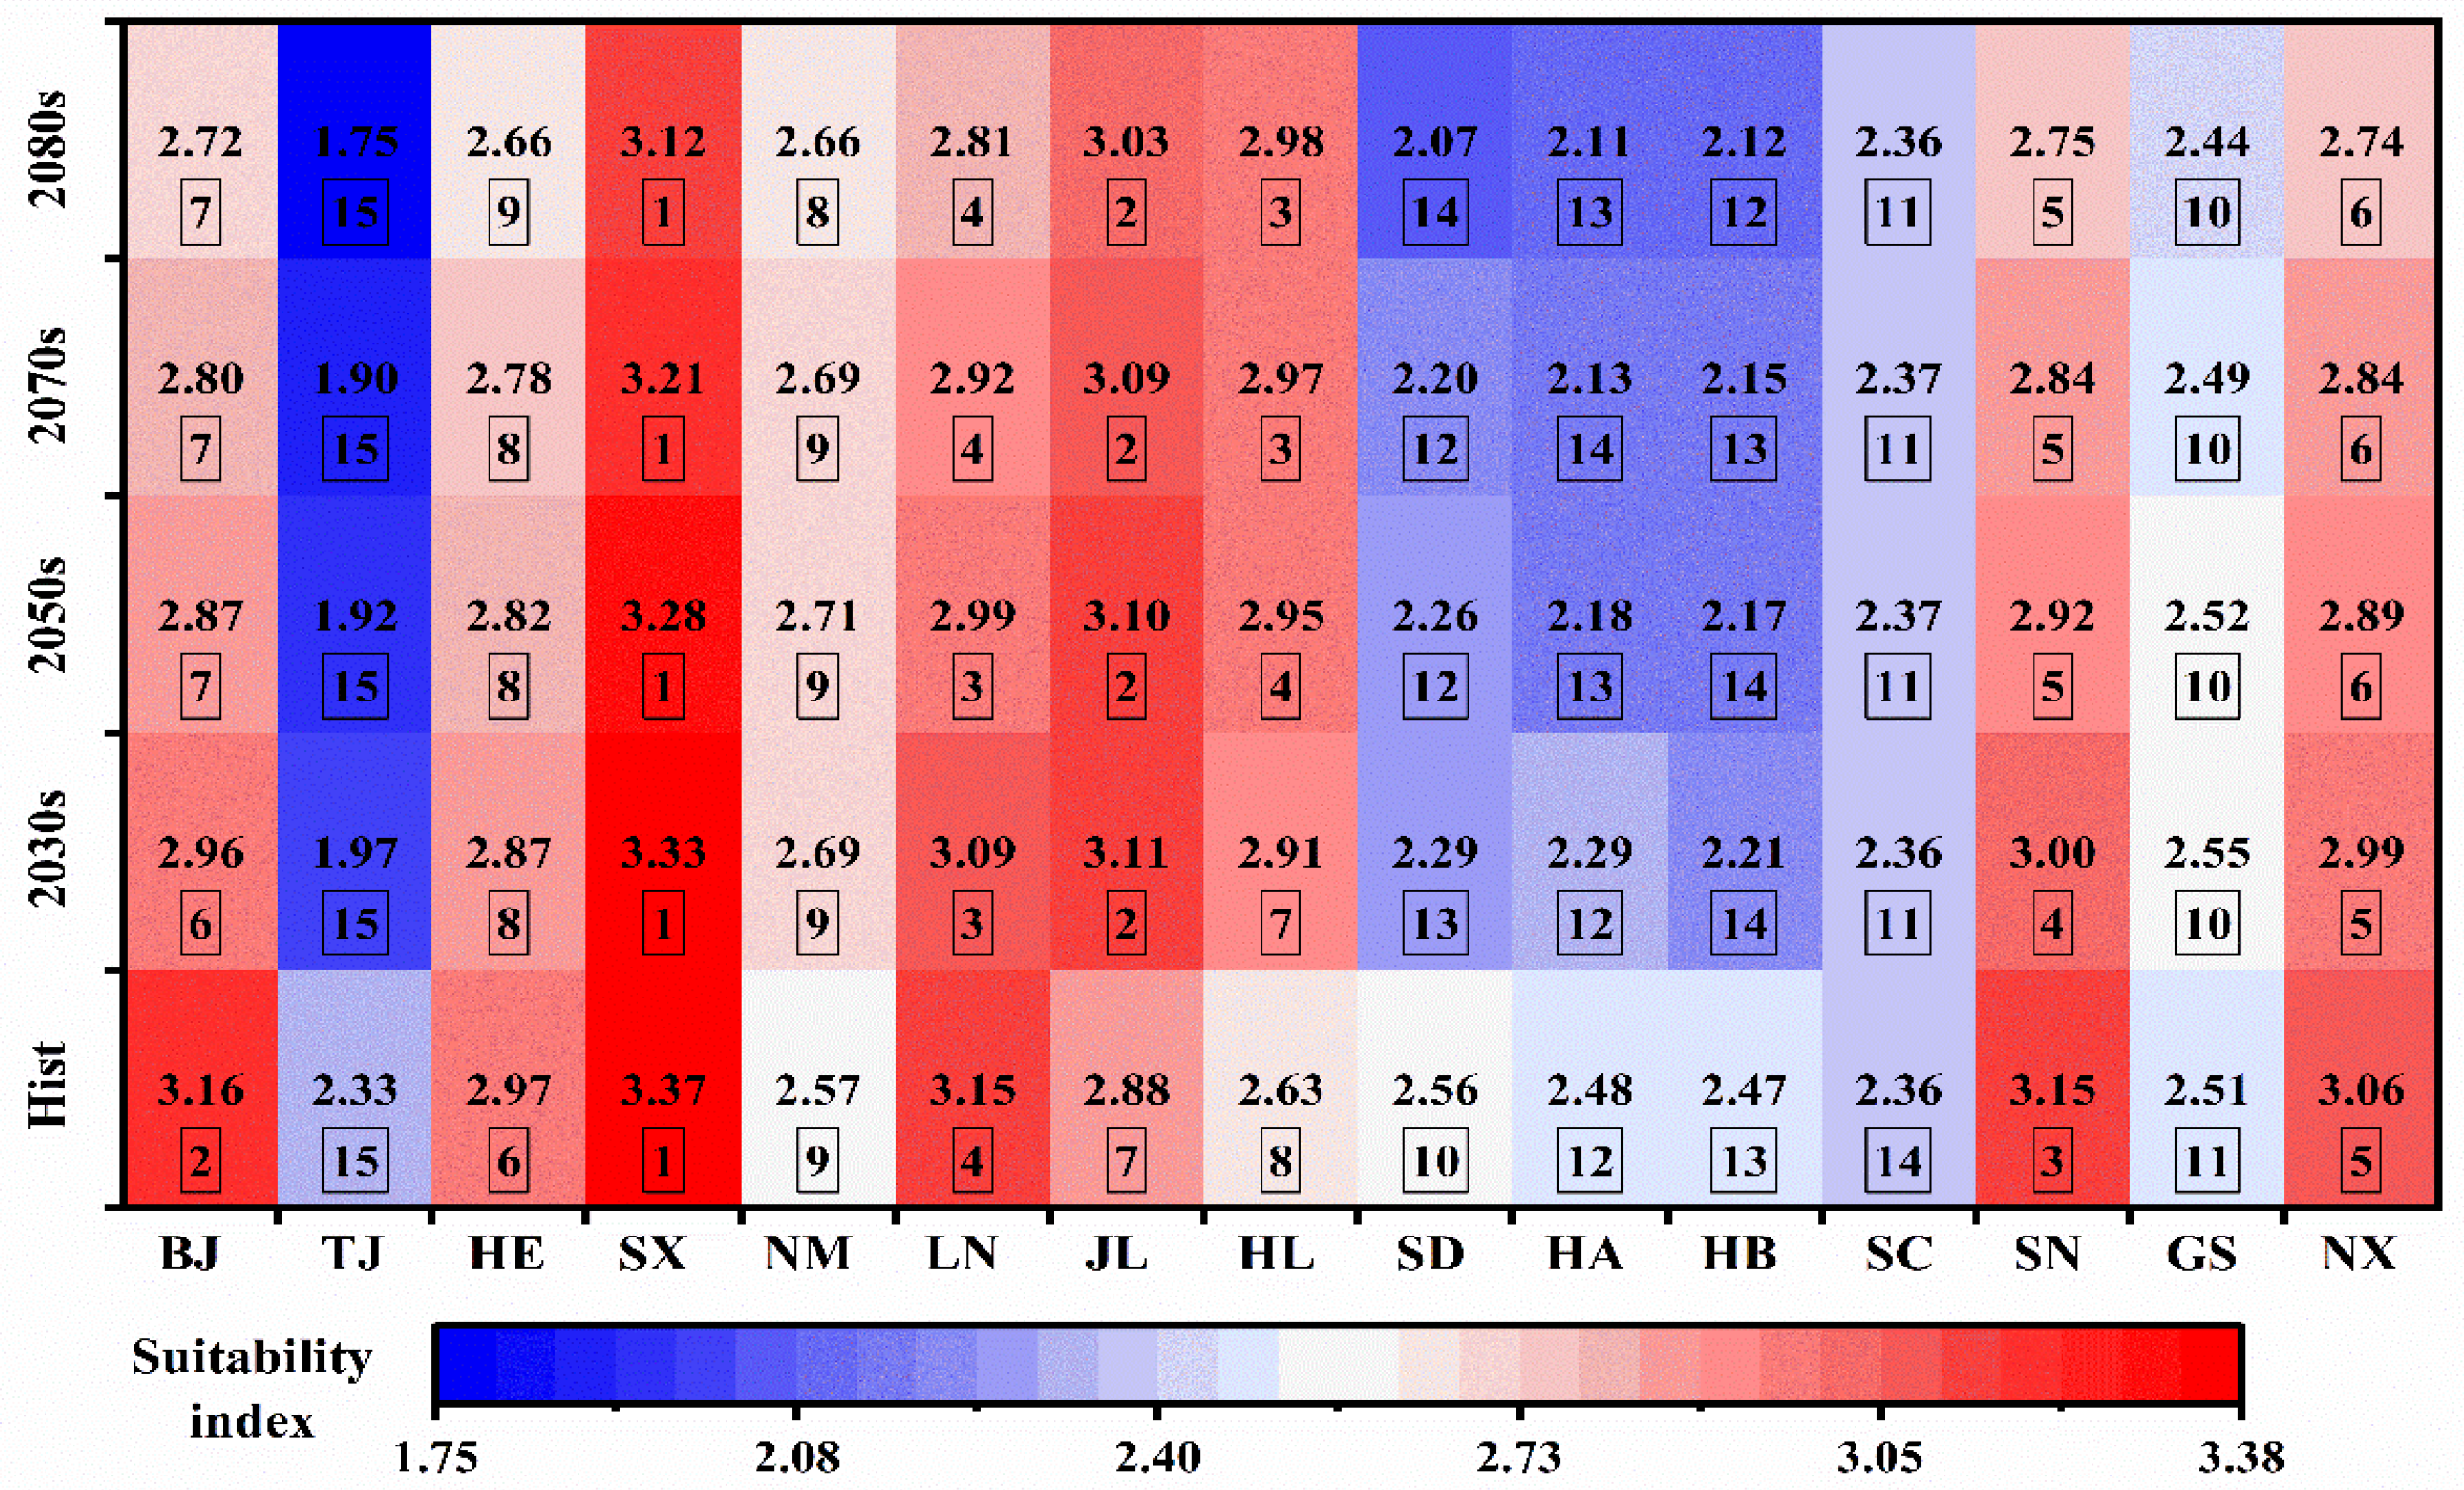
4.3. Suitability at the Province Scale

Planting of the traditional Chinese medicine is an efficacious way to meet the huge market demand and eventual reduction in pressure on its wildlife habitat [4,44,45,46]. By the end of 2020, the planting area reached about 66.2 million acres, and is currently concentrated in Jilin, Liaoning, Hebei, Guangxi, Guangdong, etc. However, blind introduction has hindered the suitable development of Chinese materia medica agriculture [4]. The plan for the planting and introduction of traditional Chinese medicine is carried out in administrative units in China. Therefore, quantifying the suitability of S. baicalensis at the provincial level could provide useful information for the policy-makers.
The multi-model-ensemble median (MMEM) of the suitability index for each province was calculated. There were 63 SSP-GCM combinations during 2021–2040 and 2041–2060, 61 combinations during 2061–2080, and 59 combinations during 2081–2100. By zonal statistics of the MMEM of the suitability index, the mean suitability index of the S. baicalensis at the province scale was derived and ranked. From the perspective of the mean suitability index, the variation of the mean suitability under warming conditions could be divided into two types (Figure 11 and Figure S5). On the one hand, global warming would bring a favorable impact on the mean suitability. The mean suitability in Shanxi, Inner Mongolia Autonomous Region, Liaoning, Jilin, and Heilongjiang is projected to gradually climb up with rising temperature. Among the top 15 S. baicalensis-producing provinces in China, the mean suitability of the Shanxi province stands out, exceeding 3.1. On the other hand, rising temperature would impose an adverse impact on the other provinces such as Beijing, Hebei, and Shannxi, whose mean suitability would fall during the 21st century. For example, the mean suitability of Beijing under current climate conditions is 3.16, ranking second; nevertheless, the mean suitability under future climate change is projected to be less than 2.96, ranking sixth or seventh. Thus, the planner should pay more attention to some provinces in northern China, e.g., Shanxi, Inner Mongolia Autonomous Region, Liaoning, Jilin, Heilongjiang, and so on.

5. Conclusions

In this study, a suitability assessment model based on the Geodetector and Habitat Suitability Index (HSI) method was proposed to identify the critical environmental variable(s) affecting the spatial heterogeneity of 386 occurrences of S. baicalensis and to simulate the suitability of S. baicalensis in China. The results showed that among the six selected variables, soil and mean annual temperature play pronounced roles in the spatial heterogeneity of S. baicalensis in China. The suitability of S. baicalensis under current and future climatic conditions is projected to be high in the east and north of China but low in the west and south of China. Future climate change may result in a decrease in the suitable area of S. baicalensis, and yet may result in an increase in the extremely suitable area. The extremely suitable habitats are about 1.00 million km2, which are mainly concentrated in northern China, the eastern part of Northwest China, the western part of southern China, and a smaller area in the eastern part of Tibetan Plateau Area. Future climate change could pose a threat to the S. baicalensis in the southern and northwestern part of its current distribution, and the southwestern part and small area of northern China will benefit from climate changes. Compared to current climatic conditions, the average suitable areas of expansion and contraction will be 0.78 and 1.51 million km2 by the late 21st century. Meanwhile, climate warming is expected to shift the distribution of S. baicalensis northward through an expansion at the northern and western boundary and contraction at the southern boundary, respectively. During the 21st century, the mean northward shift distance of the southern boundary is projected to be more than 529 km, while the mean northward and westward extension shift distances of the northern boundary are projected to be at least 84 km and 62 km. However, besides environmental variables, other factors including extreme weather and human activity are key to the formation of metabolites in medicinal plants. Further suitability assessment research incorporating these factors would further enhance predictions about likely changes in the distribution of S. baicalensis in China under future climate conditions.

Supplementary Materials

The following supporting information can be downloaded at: https://www.mdpi.com/article/10.3390/agronomy14092065/s1, Figure S1. DEM (a), aspect (b), mean annual temperature (1981-2010) (c), and annual precipitation (1981-2010) (d). Aspect is the orientation of slope, measured clockwise in degrees from 0 to 360, where 0-22.5° and 337.5-360° are north, 22.5-67.5° is northeast, 67.5-112.5° is east, 112.5-157.5° is southeast, 157.5-202.5° is south, 202.5-247.5° is southwest, 247.5-292.5° is west, and 292.5-337.5° is northwest. Figure S2. The 1:1,000,000 soil map of China. Figure S3. The 1:1,000,000 vegetation map of China. Figure S4. Research framework for the study. Figure S5. The administrative division map of China. Table S1. Dataset used in this study. Table S2. Details of the CMIP6 models used in this study. Table S3. Soil suitability classes for Radix Scutellariae. Table S4. Vegetation suitability classes for Radix Scutellariae. Table S5. The predicted shift in centroids of the potential suitable cultivation area of Radix Scutellariae under different future climate scenarios.

Author Contributions

Y.Y.: Conceptualization, Methodology, Writing—original draft, Visualization, Data curation, Funding acquisition; J.W. and W.Z.: Writing—review and editing, Investigation; B.Y.: Writing—review and editing, Investigation; J.H.: Methodology, Writing—review and editing, Investigation, Supervision; Z.Z.: Data curation, Writing—review and editing. All authors have read and agreed to the published version of the manuscript.

Funding

This work was supported by the State Key Laboratory of Earth Surface Process and Resource Ecology (No. 2023-KF-11), National Natural Science Foundation of China (No. 42377461), and National Key Research and Development Program of China (No. 2019YFA0606600).

Data Availability Statement

The historical (1981–2010) temperature and precipitation data are available in National Tibetan Plateau Data Center (http://data.tpdc.ac.cn/en/, accessed on 14 October 2022). The bias-corrected projection data of phase 6 of the Coupled Model Intercomparison Project (CMIP6) are obtained from the WorldClim data website (https://www.worldclim.org/data/index.html, accessed on 25 October 2022). The 1:1,000,000 soil map of the People’s Republic of China was provided by National Earth System Science Data Center, National Science and Technology Infrastructure of China. The 1:1,000,000 vegetation map of the People’s Republic of China was obtained from Institute of Botany, Chinese Academy of Sciences.

Conflicts of Interest

The authors declare no conflict of interest.

References

  1. Committee of Flora of China. Flora of China; Science Press: Beijing, China, 1977; Volume 65. (In Chinese) [Google Scholar]
  2. Chinese Pharmacopoeia Committee. Pharmacopoeia of The Peoples Republic of China; China Medical Science Press: Beijing, China, 2020. [Google Scholar]
  3. Zhao, Q.; Chen, X.Y.; Martin, C. Scutellaria baicalensis, the golden herb from the garden of Chinese medicinal plants. Sci. Bull. 2016, 61, 1391–1398. [Google Scholar] [CrossRef]
  4. Shan, Z.; Zhang, Q.; Qi, Y.; Ye, J.; Hao, D.; Xiao, P.; Cao, L.; Sun, J.; Zhao, L.; Niu, Y.; et al. Production regionalization of commonly used medicinal plants in China based on botanical big data. Ind. Crop. Prod. 2023, 202, 117024. [Google Scholar] [CrossRef]
  5. IPCC (Intergovernmental Panel on Climate Change). Working Group I to the Sixth Assessment Report of the Intergovernmental Panel on Climate Change. In Climate Change 2021: The Physical Science Basis; Masson-Delmotte, V., Zhai, P., Pirani, A., Connors, S.L., Péan, C., Chen, Y., Goldfarb, L., Gomis, M., Gomis, M.I., Berger, S., et al., Eds.; Cambridge University Press: Cambridge, UK; New York, NY, USA.
  6. Wu, D.; Wang, P.; Hou, Z.; Yuan, X.; Jiang, H.; Yang, J.; Tang, J.; Ma, Y. Changes in climate suitability for oil-tea (C. oleifera Abel) production in China under historical and future climate conditions. Agric. For. Meteorol. 2022, 316, 108843. [Google Scholar] [CrossRef]
  7. Prevéy, J.; Parker, L.; Harrington, C.; Lamb, C.; Proctor, M. Climate change shifts in habitat suitability and phenology of huckleberry (Vaccinium membranaceum). Agric. For. Meteorol. 2020, 280, 107803. [Google Scholar] [CrossRef]
  8. Jayasinghe, S.; Kumar, L. Modeling the climate suitability of tea [Camellia sinensis (L.) O. Kuntze] in Sri Lanka in response to current and future climate change scenarios. Agric. For. Meteorol. 2019, 272–273, 102–117. [Google Scholar]
  9. Davis, M.; Shaw, R. Range shifts and adaptive responses to quaternary climate change. Science 2001, 292, 673–679. [Google Scholar] [CrossRef] [PubMed]
  10. Li, F. Effects of Heredity and Environment on Yield and Quality of Scutellaria baicalensis and Its Mechanism; Beijing University of Chinese Medicine: Beijing, China, 2011. [Google Scholar]
  11. Summers, D.M.; Bryan, B.A.; Crossman, N.D.; Meyer, W.S. Species vulnerability to climate change: Impacts on spatial conservation priorities and species representation. Glob. Chang. Biol. 2012, 18, 2335–2348. [Google Scholar] [CrossRef]
  12. Wu, Y.; Miao, C.; Fan, X.; Gou, J.; Zhang, Q.; Zheng, H. Quantifying the uncertainty sources of future climate projections and narrowing uncertainties with bias correction techniques. Earth’s Future 2022, 10, e2022EF002963. [Google Scholar] [CrossRef]
  13. Roloff, G.J.; Kernohan, B.J. Evaluating reliability of habitat suitability index models. Wildl. Soc. Bull. 1999, 27, 973–985. [Google Scholar]
  14. Yang, F.; Zhou, W.; Zhao, X.; Zhang, J.; Shao, Z. Habitat suitability evaluation for Angelica dahurica planting in Yanting county, Sichuan province based on GIS. China J. Chin. Meteria. Medica 2019, 44, 3705–3710. (In Chinese) [Google Scholar]
  15. Zhang, W.; Wang, J.; Yin, Y. Theory and Practice of Digital Regional Cartridge for Authentic Medicinal Material; Science Press: Beijing, China, 2014. (In Chinese) [Google Scholar]
  16. Muhammed, K.; Anandhi, A.; Chen, G. Comparing methods for estimating habitat suitability. Land 2022, 11, 1754. [Google Scholar] [CrossRef]
  17. Wang, J.; Li, X.; Christakos, G.; Liao, Y.; Zhang, T.; Zheng, X. Geographical detectors-based health risk assessment and its application in the neural tube defects study of the Heshun Region, China. Int. J. Geogr. Inf. Sci. 2010, 24, 107–127. [Google Scholar] [CrossRef]
  18. Liao, Y.; Wang, X.Y.; Zhou, J.M. Suitability assessment and validation of giant panda habitat based on geographical detector. J. Geogr. Sci. 2016, 18, 767–778. (In Chinese) [Google Scholar]
  19. Jiang, Y.; Zhao, Z.; Xiao, Y.; Xu, H. Identifying the habitat quality of Scutellaria baicalensis based on baicalin content using the fuzzy matter element model. Ecol. Indic. 2022, 141, 109033. [Google Scholar] [CrossRef]
  20. Cheng, L.; Han, M.; Yang, L.M.; Yang, L.; Sun, Z.; Zhang, T. Changes in the physiological characteristics and baicalin biosynthesis metabolism of Scutellaria baicalensis Georgi under drought stress. Ind. Crop. Prod. 2018, 122, 473–482. [Google Scholar] [CrossRef]
  21. Zhou, G.; Liu, J.; Li, X.; Xu, N.; Zhu, W.; Meng, F. Evaluation for ecological adaptability of Scutellariae Radix and effects of environmental variables on chemical components. Chin. J. Exp. Tradit. Med. Form. 2016, 22, 28–32. (In Chinese) [Google Scholar] [CrossRef]
  22. Guo, L.; Wang, S.; Zhang, J.; Yang, G.; Zhao, M.; Ma, W.; Zhang, X.; Li, X.; Han, B.; Chen, N.; et al. Effects of ecological factors on secondary metabolites and inorganic elements of Scutellaria baicalensis and analysis of geoherblism. Sci. China Life Sci. 2013, 56, 1047–1056. [Google Scholar] [CrossRef]
  23. Costine, B.; Zhang, M.; Chhajed, S.; Pearson, B.; Chen, S.; Nadakuduti, S. Exploring native Scutellaria species provides insight into differential accumulation of flavones with medicinal properties. Sci. Rep. 2022, 12, 13201. [Google Scholar] [CrossRef] [PubMed]
  24. Sun, W.; Zeng, W.; Jia, X.; Zhang, Y.; Liu, Y. A comprehensive study on the differences between Scutellaria Baicalensis Georgi metabolism at different latitudes and longitudes. Chin. Pharm. J. 2023, 58, 1554–1562. (In Chinese) [Google Scholar]
  25. Wang, X.; Zhang, S.; Duan, Y.; Wang, Y.; Ma, Y.; Ke, S.; Shen, Y. Investigation and analysis on difference of cultivation technique situation of Scutellaria baicalensis in the main production areas of China. For. Ecol. Sci. 2024, 39, 34–40. (In Chinese) [Google Scholar]
  26. Xu, X.; Lu, Y.; Zhu, Y.; Zhu, H.; Zhang, X.; Jin, L. Study on ecological suitability of Scutellaria baicalensis Georgi. Chin. J. Inf. Tradit. Chin. Med. 2024, 31, 1–5. (In Chinese) [Google Scholar]
  27. Ji, B.; Liu, M.; Pei, L.; Yang, L. Ecologically suitable areas for growing Scutellaria baicalensis worldwide: An analysis based on GMPGIS. China J. Chin. Mater. Med. 2021, 46, 4389–4394. (In Chinese) [Google Scholar]
  28. Wen, M. ISSR Genetic Diversity Analysis and Core Germplasm Construction Method of Scutellaria baicalensis; Shaanxi Normal University: Xian, China, 2012. [Google Scholar]
  29. Aiello-Lammens, M.; Boria, R.; Radosavljevic, A.; Vilela, B.; Anderson, R. spThin: An R package for spatial thinning of species occurrence records for use in ecological niche models. Ecography 2015, 38, 541–545. [Google Scholar] [CrossRef]
  30. He, J.; Yang, K.; Tang, W.; Lu, H.; Qin, J.; Chen, Y.; Li, X. The first high-resolution meteorological forcing dataset for land process studies over China. Sci. Data 2020, 7, 25. [Google Scholar] [CrossRef]
  31. Fick, S.E.; Hijmans, R.J. WorldClim 2: New 1km spatial resolution climate surfaces for global land areas. Int. J. Climatol. 2017, 37, 4302–4315. [Google Scholar] [CrossRef]
  32. Chen, S. (Ed.) Ecological Suitability Regionalization of Medicinal Materials in China, Revised ed.; Science Press: Beijing, China, 2016. (In Chinese) [Google Scholar]
  33. Wang, J.; Xu, C. Geodetector: Principles and prospects. J. Geogr. Sci. 2017, 1, 116–134. [Google Scholar]
  34. Zhou, Z. Machine Learning.; Springer Nature Pte Ltd: Singapore, 2021. [Google Scholar] [CrossRef]
  35. Zheng, D. A Study on the EcoGeographic Regional System of China. In Proceedings of the FAO FRA2000 Global Ecological Zoning Work2shop, Cambridge, UK, 28–30 July 1999; p. 12. [Google Scholar]
  36. Zhang, K.; Yao, L.; Meng, J.; Tao, J. MaxEnt modeling for predicting the potential geographical distribution of two peony species under climate change. Sci. Total Environ. 2018, 634, 1326–1334. [Google Scholar] [CrossRef] [PubMed]
  37. Liang, S.; Wu, W.; Sun, J.; Li, Z.; Sun, X.; Chen, H.; Chen, S.; Fan, L.; You, L.; Yang, P. Climate-mediated dynamics of the northern limit of paddy rice in China. Environ. Res. Lett. 2021, 16, 064008. [Google Scholar] [CrossRef]
  38. Chen, M.; Zhang, L.; Cao, B.; Bai, C. Predictive suitable distributions and principal environment variables of six medicinal plants of Scutellaria based on MaxEnt and GIS. J. Tradit. Chin. Veteri. Med. 2022, 41, 7–11. [Google Scholar]
  39. Xu, N.; Meng, F.; Zhou, G.; Li, Y.; Wang, B.; Lu, H. Assessing the suitable cultivation areas for Scutellaria baicalensis in China using the Maxent model and multiple linear regression. Biochem. Syst. Ecol. 2020, 90, 104052. [Google Scholar] [CrossRef]
  40. Liu, J.; Li, G.; Xia, Y.; Ma, C.; Zhao, C.; Meng, F. Study on estimating reserves of wild Seutellaria baicalensis in Inner Mongolia region based on 3S technology. Chin. Tradit. Herb. Drugs 2016, 47, 997–1003. [Google Scholar]
  41. Swets, J. Measuring the accuracy of diagnostic systems. Science 1988, 240, 1285–1292. Available online: https://www.jstor.org/stable/1701052 (accessed on 16 February 2023). [CrossRef] [PubMed]
  42. Lehner, F.; Deser, C.; Maher, N.; Marotzke, J.; Fischer, E.M.; Brunner, L.; Knutti, R.; Hawkins, E. Partitioning climate projection uncertainty with multiple large ensembles and CMIP5/6. Earth Syst. Dyn. 2020, 11, 491–508. [Google Scholar] [CrossRef]
  43. Kim, K.B.; Kwon, H.H.; Han, D. Bias correction methods for regional climate model simulations considering the distributional parametric uncertainty underlying the observations. J. Hydrol. 2015, 530, 568–579. [Google Scholar] [CrossRef]
  44. Gampe, D.; Schmid, J.; Ludwig, R. Impact of reference dataset selection on RCM evaluation, bias correction, and resulting climate change signals of precipitation. J. Hydrometeorol. 2019, 20, 1813–1828. [Google Scholar] [CrossRef]
  45. Zhang, R.; Zhang, M.; Chen, Y.; Wang, C.; Zhang, C.; Heuberger, H.; Li, H.-T.; Li, M.-H. Future development of Good Agricultural Practice in China under globalization of traditional herbal medicine trade. Chin. Herb. Med. 2021, 13, 472–479. [Google Scholar] [CrossRef]
  46. World Health Organization (WHO). Traditional medicine-growing needs and potential. Medicine 2015, 2, 1–6. [Google Scholar]
Figure 1. Occurrence records and density of S. baicalensis across China. NSII is short for National Specimen Information Infrastructure. The grey and dashed lines are provincial boundary.
Agronomy 14 02065 g001
Figure 2. The q-statistic of environmental variables on the density of S. baicalensis across China. The larger the q-statistic, the greater the explanatory degree of dependent variables by variables. “**” represents 1% significance levels, and “*” represents 5% significance levels.
Agronomy 14 02065 g002
Figure 3. Suitable levels for S. baicalensis across China under current climatic conditions (1981–2010). The boundary of the regions is reproduced with permission from Zheng Du [35], A Study on the Eco-geographic Regional System of China, published by Food Agricultural Organization (FAO), 1999. The grey and dashed lines are provincial boundary.
Agronomy 14 02065 g003
Figure 4. Suitable levels for S. baicalensis across China under three future climate scenarios.
Agronomy 14 02065 g004
Figure 5. Half-violin plots of suitability indexes of S. baicalensis in China under the four SSP scenarios (NC: Northern China; NWC: Northwest China; SC: Southern China; TP: Tibetan Plateau Area).
Agronomy 14 02065 g005
Figure 6. Changes in the potential suitability index of S. baicalensis under three future climate scenarios. The black line is the eco-regions boundary. The grey and dashed lines are provincial boundary.
Agronomy 14 02065 g006
Figure 7. Shifts of centroids of the potential suitable cultivation area of S. baicalensis under different future climate scenarios. A triangle, rectangle, and pentagram denote SSP1-2.6, SSP3-7.0, and SSP5-5.8, respectively. Red, green, blue, and violet represent Time1 (2021–2040), Time2 (2041–2060), Time3 (2061–2080), and Time4 (2081–2100). The dashed lines are provincial boundary.
Agronomy 14 02065 g007
Figure 8. Maps of the southern (a) and northern (c) distribution boundaries of S. baicalensis in China. The histogram shows the average latitude/longitude of the distribution boundaries for each analysis period. (b) shows the average latitude of south boundary. (d,e) shows the longitude and latitude of the north boundary.
Agronomy 14 02065 g008
Figure 9. Results of interaction detectors on the density of S. baicalensis across China. Different colors indicate the q value after the interaction of driving variable 1 and driving variable 2. Prec, Temp, and Vage represent the annual precipitation, the average temperature, and the vegetation, respectively. The purple text denotes non-linear enhancement between two variables.
Agronomy 14 02065 g009
Figure 10. Future likelihood suitability for S. baicalensis across China under SSP1-2.6, SSP3-7.0, and SSP5-5.8 scenarios. The black line is the eco-regions boundary. The grey and dashed lines are provincial boundary.
Agronomy 14 02065 g010
Figure 11. The suitability index of 15 major S. baicalensis-producing provinces. The number without the box is the suitability index, while the number with the box is the rank (BJ: Beijing; TJ: Tianjing; HE: Hebei; SX: Shanxi; NM: Inner Mongolia Autonomous Region; LN: Liaoning; JL: Jilin; HL: Heilongjiang; SD: Shandong; HA: Henan; HB: Hubei; SC: Sichuan; SN: Shaanxi; GS: Gansu; NX: Ningxia).
Agronomy 14 02065 g011
Table 1. The classification of criteria for S. baicalensis suitability assessment.
CriteriaExtremely Suitable, 4Moderately Suitable, 3Marginally Suitable, 2Unsuitable, 1
Mean annual temperature/°C2.95–10.18−0.70–2.95 or 10.18–12.80−4.40–−0.70 or 12.80–16.42<−4.40 or >16.42
Mean annual precipitation/mm400–600300–400 or 600–1400200–300 or 1400–2100<200 or ≥2100
DEM/m900–1300200–900 or 1300–200020–200 or 2000–3500<20 or ≥3500
Aspect/°157.50–202.50112.50–157.50 or 202.50–247.5067.50–112.50 or 247.50–292.500–67.50 or 292.50–360
Table 2. Types of interaction between two driving variables [17].
CriteriaInteraction Type
q(X1X2) < min(q(X1), q(X2))non-linear reduction
min(q(X1), q(X2)) < q(X1X2) < max(q(X1), q(X2))unifactorial non-linearity reduction
q(X1X2) = q(X1) + q(X2)independent
q(X1X2) > max(q(X1), q(X2))bifactorial enhancement
q(X1X2) > q(X1) + q(X2)non-linear enhancement
Note: Reproduced with permission from Wang et al. [17], Geographical detectors-based health risk assessment and its application in the neural tube defects study of the Heshun Region; published by China. J. Geogr. Sci., 2010.
Table 3. Number and proportion of occurrences of S. baicalensis in each suitable level.
Suitable Levels (Suitability Index)Unsuitable (1–2.1)Marginally (2.1–2.6)Moderately (2.6–3.1)Extremely (3.1–4)
Number143171205
Proportion4.369.6622.1263.86
Table 4. Projected coverage area (in million km2) of S. baicalensis under current climatic condition and future climate scenarios. Percentage is shown in brackets.
Climate ScenarioTime PeriodExtremely SuitableModerately SuitableMarginally SuitableUnsuitable
1981–20101.00 (10.89%)1.30 (14.09%)2.24 (24.26%)4.68 (50.76%)
SSP1-2.62021–20401.30 (14.08%)1.08 (11.67%)1.64 (17.73%)5.22 (56.53%)
2041–20601.31 (14.16%)1.05 (11.43%)1.55 (16.78%)5.32 (57.64%)
2061–20801.31 (14.24%)1.04 (11.28%)1.55 (16.81%)5.32 (57.68%)
2081–21001.31 (14.20%)1.05 (11.34%)1.56 (16.93%)5.31 (57.54%)
SSP3-7.02021–20401.31 (14.20%)1.09 (11.77%)1.66 (17.95%)5.18 (56.08%)
2041–20601.35 (14.63%)1.02 (11.05%)1.54 (16.69%)5.32 (57.63%)
2061–20801.31 (14.19%)1.00 (10.88%)1.56 (16.85%)5.36 (58.08%)
2081–21001.19 (12.86%)1.04 (11.25%)1.56 (16.95%)5.44 (58.94%)
SSP5-5.82021–20401.31 (14.19%)1.07 (11.61%)1.60 (17.32%)5.25 (56.87%)
2041–20601.32 (14.33%)1.01 (10.90%)1.51 (16.36%)5.39 (58.41%)
2061–20801.20 (13.02%)1.03 (11.19%)1.54 (16.70%)5.45 (59.09%)
2081–21001.03 (11.17%)1.10 (11.96%)1.58 (17.16%)5.51 (59.70%)
Table 5. Changes in projected coverage area (in million km2) of S. baicalensis under future climate scenarios compared to the current climatic condition.
Climate ScenarioTime PeriodExpansionNo ChangeContraction
2021–2040SSP1-2.60.377.940.90
SSP3-7.00.377.980.86
SSP5-5.80.397.870.95
Average0.387.930.90
2041–2060SSP1-2.60.457.681.08
SSP3-7.00.527.541.15
SSP5-5.80.587.351.28
Average0.527.521.17
2061–2080SSP1-2.60.497.591.13
SSP3-7.00.707.131.38
SSP5-5.80.826.801.59
Average0.677.171.37
2081–2100SSP1-2.60.497.611.11
SSP3-7.00.886.701.63
SSP5-5.80.966.461.79
Average0.786.921.51
Disclaimer/Publisher’s Note: The statements, opinions and data contained in all publications are solely those of the individual author(s) and contributor(s) and not of MDPI and/or the editor(s). MDPI and/or the editor(s) disclaim responsibility for any injury to people or property resulting from any ideas, methods, instructions or products referred to in the content.

