Article

Utilizing Hydrophobic Sand to Construct an Air-Permeable Aquiclude to Enhance Rice Yield and Lodging Resistance

1
School of Architecture, Planning and Environmental Policy, University College Dublin, D14 E099 Dublin, Ireland
2
State Key Laboratory of Silica Sand Resources Utilization, Beijing 100085, China
*
Author to whom correspondence should be addressed.
Agronomy 2024, 14(9), 2085; https://doi.org/10.3390/agronomy14092085
Submission received: 22 July 2024 / Revised: 28 August 2024 / Accepted: 30 August 2024 / Published: 12 September 2024
(This article belongs to the Special Issue Transforming AgriFood Systems under a Changing Climate)

Abstract

:
Global climate change and persistent droughts lead to soil desertification, posing significant challenges to food security. Desertified lands, characterized by high permeability, struggle to retain water, thereby hindering ecological restoration. Sand, a natural resource abundant in deserts, inspired our proposal to design hydrophobic sand and construct Air-permeable Aquicludes (APAC) using this material. This approach aims to address issues related to the ecological restoration of desertified lands, food security, and the utilization of sand resources. Reclamation of desertified land and sandy areas can simultaneously address ecological restoration and ensure food security, with soil reconstruction being a critical step. This study investigated the effects of constructing an Air-permeable Aquiclude (APAC) using hydrophobic sand on rice yield and lodging resistance, using clay aquitard (CAT) and plastic aquiclude (PAC) as control groups. The APAC enhanced soil oxygen content, increased internode strength, and improved vascular bundle density, substantially reducing the lodging index and increasing yield. This research finds that the APAC (a) increased internode outer diameter, wall thickness, fresh weight, and filling degree; (b) enhanced the vascular bundle area by 11.11% to 27.66% and increased density; (c) reduced the lodging index by 37.54% to 36.93% (p < 0.01); and (d) increased yield to 8.09 t·hm−2, a rise of 12.05% to 14.59% (p < 0.05), showing a negative correlation with lodging index. These findings suggest that APAC has very good potential for desertified land reclamation and food security. In conclusion, the incorporation of hydrophobic sand in APAC construction considerably strengthens rice stem lodging resistance and increases yield, demonstrating considerable application potential for the reclamation of desertified and sandy land and ensuring food security.

1. Introduction

Global climate change and persistent drought pose major challenges to land desertification [1] and food security [2]. Rice plays a crucial role in ensuring food security worldwide, and reclaiming desertified and abandoned lands for rice cultivation is an effective measure against desertification and food crises. Lodging is a common issue in rice cultivation, leading to reduced photosynthesis, bent and broken vascular bundles, hindered dry matter transport [3], and ultimately impacting yield and quality [4]. Studies have shown that a 2% increase in lodging can result in a 1% reduction in grain yield [5], with crop yield losses reaching up to 61% when lodging occurs at a 90° angle [6].
Rice lodging includes stem lodging and root lodging. Stem lodging resistance in rice is generally associated with plant height, internode length and diameter, stem wall thickness, dry mass of internodes, and panicle weight [7,8,9]. Stem lodging typically occurs at the first to third internodes of the stem base. Reducing the length of these basal internodes effectively enhances lodging resistance [10]. Increasing the stem wall thickness and diameter of the second and third internodes and reducing plant height can significantly improve lodging resistance [9,10,11]. Stem wall thickness and bending resistance are positively correlated with K2O content and influenced by nitrogen [12]. Additionally, oxygen content in paddy fields is crucial for rice growth, significantly affecting soil enzyme activity [13,14,15] and microbial diversity [16]. Soil oxygen levels of 3–5% are required for normal root respiration [17]. Adequate oxygenation can enhance crop antioxidant systems, promote growth metabolism [13,14], and improve nutrient uptake efficiency [16]. Studies show that aeration irrigation can reduce N2O emissions and nitrogen loss [3,18]. Through surface and underground aerated drip irrigation, N2O cumulative emissions can be reduced by 37% and 14%, respectively, thereby reducing nitrogen fertilizer losses [19]. However, the effect of soil oxygen content on rice stem lodging resistance has been rarely studied.
Researchers have proposed the use of subsurface water retention technology (SWRT) to convert sandy land into arable land. This involves creating an impermeable layer below the root zone using plastic film to reduce water and fertilizer leakage, thereby improving water retention and increasing crop yields compared to untreated sandy soils [20,21]. By 2020, the usage of plastic film in Inner Mongolia, China, reached 83,000 tons, covering 143,000 hectares [22]. However, these plastic films, being non-biodegradable, can disrupt soil ecology and create anaerobic conditions detrimental to crop growth [23,24,25]. While clay treatment can also enhance water retention [26], its high cost makes it impractical for large-scale applications.
In recent years, the use of hydrophobic sand for surface water retention in sandy soils has been proposed [27,28,29,30,31,32]. The primary component of raw sand is silicon dioxide. Its polar oxygen atoms form hydrogen bonds with water molecules, resulting in a contact angle of 0° with water, demonstrating super hydrophilicity and easy water absorption [33]. This makes it difficult for the desert to store and transport water without loss. In 1997, Barthlott et al. [34] first discovered the hydrophobic interface phenomenon by examining the surface characteristics of natural lotus leaves. They found that on hydrophobic rough surfaces, water will not spread but instead form spherical droplets, demonstrating water repellency. This property of lotus leaves has been replicated by coating raw sand with hydrophobic materials to create modified hydrophobic sand. A 2 cm thick hydrophobic sand layer can support a 35 cm high water column [28,29]. Constructing a hydrophobic sand layer effectively reduces water leakage and maintains soil structure stability [35]. Studies by Salem et al. have shown that such layers save irrigation water and promote root and plant growth in arid sandy areas [36,37]. Myrzabaeva et al. [38] found that hydrophobic sand layers inhibit the upward migration of heavy metals in soil.
In this study, we utilized aeolian sand as the raw material and implemented coating modification technology to apply hydrophobic materials such as epoxy resin, phenolic resin, and polyurethane resin to the sand surface to create hydrophobic sand [39]. An Air-permeable Aquiclude (APAC) was constructed using 2 cm thick hydrophobic sand to enhance the sand structure layer, reduce soil permeability, and improve soil suitability. The continuous pores created by the accumulation of loose particles form free airflow channels, making APAC more air-permeable than plastic film. Enhanced air permeability can facilitate gas exchange at the soil–atmosphere interface, thus increasing soil oxygen content [40]. A rice field experiment was conducted in the sandy lands of Inner Mongolia to compare the effects of APAC with those of plastic film. The findings indicated that rice grown with APAC demonstrated superior root growth, effective tiller number, thousand-grain weight, grain number, and grains per panicle compared to those using plastic film [41]. However, the study did not evaluate the impact of APAC on soil performance. Furthermore, the research on the physiological characteristics of rice was confined to root systems and certain yield indicators, lacking an investigation into overall yield measurement and lodging resistance.
There are few studies on the effects of soil permeability and oxygen content on rice lodging resistance. This research investigates the impact of soil permeability and oxygen content on rice lodging resistance. This study utilized hydrophobic sand to create APAC and convert sandy land into rice fields, aiming to enhance air permeability, water retention, and fertilizer retention in the fields. A small-scale control experiment was conducted to assess the oxygenation effect of three anti-seepage layers (APAC, plastic aquiclude (PAC), and clay aquiclude (CAT)) on soil, as well as their influence on lodging performance and rice yield, including stem morphology, anatomical structure, and mechanical indicators. The proposal involves modifying aeolian sand through hydrophobicity, enhancing the soil structure of sandy land by constructing APAC and converting the land into rice fields. The technology is anticipated to address issues related to the ecological restoration of desertified land, global food security, and sand resource utilization.

2. Materials and Methods

2.1. Study Area and Materials

The experiments took place at a pilot farm in Miyun District, Beijing, China (40°37′ N, 116°82′ E), from June to October 2022. Beijing is located in a region characterized by a semi-humid and semi-arid climate, featuring a continental monsoon climate with four distinct seasons marked by noticeable variations in dryness, wetness, and coldness. The multi-year average temperature ranges between 9 and 10 °C, and the multi-year average precipitation is about 479.37 mm. The majority of the rainfall occurs from June to September. Temperature and rainfall data throughout the entire growth period of rice are shown in Figure 1. The total rainfall during the entire growth period in 2022 was 355.5 mm. The soil in the test area is sandy soil, with a moisture content of 2.22%, a saturated water holding capacity of 43.27%, a pH value of 8.17, organic matter of 17.4 g/kg, cation exchange capacity of 10.78 cmol/kg, available phosphorus of 42.8 mg/kg, total nitrogen content of 1.1 g/kg, and available potassium content of 116 mg/kg.
Hydrophobic sand, also as known as “Breathable Sand”, is sourced from Beijing Rechsand Science & Technology Group Co., Ltd. (Beijing, China). It boasts an air permeability of 6.08 L/(m2·s) when using a 2 cm thickness of the material. This air permeability is approximately 57.09% of that of regular sand soil and 2.85 times higher than that of a 20 cm thick clay aquitard.

2.2. Experiments and Methods

2.2.1. Experimental Setup

In this study, three groups of control experiments were established with identical areas and conducted simultaneously to simulate three typical rice field anti-seepage methods (Figure 2): Air-permeable Aquiclude (APAC) is created by laying 2 cm thick “Breathable Sands” with high air-permeability and hydrophobicity; plastic aquiclude (PAC) entails laying a 2-layer Poly Ethylene (PE) plastic mulch, approximately 0.12 mm thick, with a lifespan of about 3 to 5 years, to create an airtight and waterproof barrier; clay aquitard (CAT) involves laying clay with a thickness of 20 cm, compacting and leveling it to create a micro-permeable water-holding barrier. The clay aquitard exhibits micro air-permeable and micro-leakage features. All paving materials are placed beneath the planting soil, which has a thickness of 45 cm.
Each method was concurrently repeated three times under identical environmental conditions, resulting in a total of 9 experiment areas. The field ridges surrounding the community were constructed using bricks and waterproofed with cement. Anti-lateral seepage measures were implemented to prevent the flow of water and fertilizer. An overflow hole was set 10 cm from the ground surface to facilitate shallow water irrigation. Following the laying of anti-seepage layer, water was injected into each community to a depth of 50 cm, and the leakage of the bottom layers of the three plows was assessed by allowing them to stand for 72 h. Using the sandy soil in the test area as a control, the air permeability of the three anti-seepage methods under a pressure difference of 200 pa was tested with an air permeability tester (YG461E-II type). The average test results are summarized in Table 1. Subsequently, the planting soil (45 cm thick) was backfilled.
The rice variety used in the trial is Jingxi Rice. The seedlings were procured from Shangzhuang Town, Beijing, China, and transplanted in mid-June 2022, with harvest taking place at the end of October. The planting density was set at 22.5 cm × 15 cm, with 3 to 5 seedlings per hole. Each area received separate fertilization treatments. The fertilizers used were controlled-release compound fertilizer and potassium dihydrogen phosphate, applied at a standard rate of nitrogen (N) 168 kg·hm−2, phosphorus (P) 15 kg·hm−2, and potassium (K) 30 kg·hm−2. Additionally, each group of experiments was given four times, following the base fertilizer, tillering fertilizer, jointing fertilizer, and panicle fertilizer ratio of 10:4:3:3, respectively. Potassium dihydrogen phosphate (applied at a rate of 4 kg/hm2) was applied during the booting stage. Each area was drained and irrigated individually. The research employed an intermittent irrigation system with alternating shallow and submerged water levels, as outlined in Table 2. Irrigation was halted one week prior to harvest, and the water consumption during the rice growth period in each area was documented. Pest, disease, and weed control measures were rigorously implemented throughout the growth period.

2.2.2. Rice Dissolved Oxygen Model

Under natural conditions, the presence of dissolved oxygen in rice fields primarily results from atmospheric reoxygenation and radial oxygen loss from rice roots. When the water’s dissolved oxygen is not saturated, atmosphere oxygen diffuses into the water, a process influenced by environmental factors such as atmospheric pressure, water temperature, and water quality. The equation for atmospheric reoxygenation of the water body is typically provided by [42],
d O d t = k Q s O ,
where k is the reoxygenation coefficient, Q s is the saturated concentration of dissolved oxygen, and O is the dissolved oxygen concentration. The atmospheric re-aeration process of a static water body was employed to simulate and evaluate the difference in oxygen content in rice fields under two treatments: the bottom layer of a breathable and anti-seepage ecological plow and the plastic aquiclude. The experimental setup is depicted in Figure 3, featuring two cylindrical acrylic tubes labeled A and B, each measuring 75 cm in height and 20 cm in diameter. Tube A is equipped with a bottom wrapped in non-woven fabric and placed on a ventilated plate, while tube B’s bottom is affixed to an acrylic plate to ensure no leakage. Tubes A and B simulate the APAC and PAC of the rice field, respectively. To eliminate environmental factors’ interference, such as water quality, a sequence of 3 cm of original sand and 2 cm of hydrophobic sand were added to tubes A and B, followed by a covering of 2 cm of original sand. The addition of sand aimed to prevent disturbance of hydrophobic sand layer during the water injection process. Subsequently, 60 cm of tap water was injected, and nitrogen filling and oxygen removal were employed to reduce the dissolved oxygen in the water to 0.9 mg/L. A portable dissolved oxygen meter (HACH HQ30d) was used to measure the dissolved oxygen, saturation, and water temperature at 10 cm, 30 cm, and 50 cm distances from the liquid surface over a 3-day experimental period, during which samples were taken.

2.3. Sampling and Measurements

Five holes were randomly selected in each area to track and monitor the plant height from the seedling stage to the yellow maturity stage. At the maturity stage, five holes were selected from each area, and three main stems were randomly chosen. The roots were cut off, and the leaf sheaths, leaves, and ears were retained without losing water in order to measure relevant indicators. The stem was cut according to its nodes and named the first elongated internode (N1), the second internode (N2), and the third internode (N3) from the root of the stem upward. All samples were measured for the length (l) of each internode, fresh weight, ear length, and ear fresh weight.
Rice stem lodging commonly occurs in the 1st to 3rd internodes at the base of the stem 10). The 3rd internode at the base of the plant was selected to measure related lodging characteristics. The maximum breaking resistance (F, N) of the N3 internode (including the leaf sheath) was measured using a microcomputer-controlled electronic universal testing machine CMT4204 (Meters Industrial Systems (China) Co., Ltd., Shenzhen Branch, procured from Shenzhen, China). The bending load at breaking of the basal third elongated internode with the leaf sheath was measured at a distance of 5 cm between two supporting points (the distance between fulcra, L, cm) using a universal testing machine (CMT4204).
The length from the base of N3 to the panicle tip and its fresh weight were also measured. Using a digital vernier caliper, the outer diameter of the long axis and the outer diameter of the short axis were measured after removing the leaf sheath, and the average value was taken as the internode outer diameter. Then, the N3 internode was cut from the middle, and the thickness at the four intersections of the long axis and short axis with the stem wall was measured, with the average value taken as the internode wall thickness. Each internode, leaf sheath, and ear were placed in an oven, cured at 105 °C for 30 min, and dried at 70 °C until a constant weight was achieved. The dry mass of each internode was then measured.
From each model, two plants were selected, and from each plant, three main stems were chosen. The middle part of the third internode at the base of the main stem was sliced using the freehand sectioning method. Observation and examination were conducted using a microscope (LEICA DVM6, Leica Microsystems GmbH, Wetzlar, Germany) at 4× magnification, and photos were taken under the lens. Subsequently, Adobe Photoshop CC 2018 was used to stitch the photos together to obtain a complete cross-section image of the internode. The large vascular bundle was marked using the lasso tool, and software Image J 2 was used to measure the vascular bundle area (VBA) and transverse section. The cross-section area (CSA) and medullary cavity area (MCA) were also measured, and the stem wall area (SWA, Figure 4) was calculated by
S W A = C S A M C A
At the maturity stage, the five randomly selected rice hills were sampled for testing. Parameters such as the effective number of rice grains, number of grains per panicle, thousand-grain weight, number of filled grains, and seeding setting rate were measured. All remaining rice plants in the plot were harvested, threshed, dried at 70 °C to constant weight, and weighed to determine the actual yield based on dry weight.

2.4. Data Processing and Analyzing

In this section, the calculation of the relative parameters will be presented.
Internodal fullness, F i N (g·cm−1), is given by
F i N = W d , i N L i N ,
where W d , i N (g) is the dry weight of the internode, and L i N (cm) is the length of the internode.
The bending moment of the whole plant, T B M W (N·cm), is given by
T B M W = L B T · M B T · ε 1 · ρ ,
where L B T (cm) is the length from the base of the plant internode to the top of the panicle, and M B T (g) is the mass from the base of the plant internode to the top of the panicle. ε 1 and ρ are the constants of unit (from g to kg, 0.001) and gravity coefficient (9.8 N/kg), respectively.
The lodging index, I L I (%), is given by
I L I = T B M W T B M B · 100 % ,
where T B M B (N·cm) is the bending moment at breaking, which is given by
T B M B = 1 4 F × L ,
where F (N) is the maximum breaking resistance of N3 (including the leaf sheath), and L (cm) is the distance between fulcra, which is set at 5 cm according to Section 2.3.
The cross-section modulus, Wt (mm3), is given by
W t = π D 3 32 1 α 4 ,
where D (mm) is the outer diameter of the plant internode, and α is the ratio of the inner diameter to the outer diameter of the internode.
The maximum stress on the cross-section, F m a x C S (N·mm−2), is given by
F m a x C S = T B M W W t .
Origin 2021 was employed to process and analyze the experimental data and generate graphics, while SPSS 24.0 was utilized for significance analysis using the F-test and the least significant difference (LSD) method. The means were compared using the least significant difference test at a significance level of p < 0.05 (LSD 0.05).

3. Results

3.1. The Oxygen-Increasing Effect of the Breathable and Anti-Seepage Plow Bottom on Rice

Atmospheric reoxygenation is a crucial method for oxygenating natural water bodies. A point with a water depth of 30 cm was selected to represent the reoxygenation level near the rice roots, and the average concentration represented the overall reoxygenation level in the experimental rice fields. As shown in Figure 5, under stagnant water conditions, the dissolved oxygen (DO) concentration and saturation in areas A and B at a depth of 30 cm reached 2.04 mg/L, 1.78 mg/L, 24.8%, and 21.7%, respectively, after 24 h. The DO and saturation in A are superior to those in B, with A being 14.61% and 14.29% higher than in B, respectively. The average dissolved oxygen concentration in A and B is 2.04 mg/L and 1.64 mg/L, with an average saturation of 24.9% and 20%, respectively. A is 14.61% and 14.29% higher than B, indicating a higher reoxygenation rate in A compared to B. The average dissolved oxygen and average saturation in A are 24.39% and 24.50% higher than in B, respectively, further demonstrating the superior reoxygenation rate in A.
Furthermore, it can be observed from Formula (1) that the atmospheric reoxygenation rate is proportional to Q s O . Larsen et al. [43] found that the oxygen in the soil is continuously consumed by the rice root system and soil respiration, often resulting in the rhizosphere being in an anoxic state. This leads to a prolonged period of low dissolved oxygen (DO) concentration, and the changes in oxygen deficit Q s O are lower than ideal.
As shown in Figure 3, in tube A, a 3 cm thick layer of raw sand is used to simulate the leveling layer using raw sand in APAC. A “2 cm thick layer of hydrophobic sand, non-woven fabric, and acrylic perforated plate” is used to simulate the plow pan in APAC. In tube B, a “non-leaking, airtight acrylic plate” at the bottom is used to simulate the plow pan in PAC. The CAT has strong permeability, so it is impossible to carry out simulation experiments simultaneously. The above experimental results indicate that the APAC has a significant oxygenation effect on the rice fields compared to the PAC. Elad et al. showed that improving soil permeability can promote gas exchange at the soil–atmosphere interface and increase soil oxygen content [40], which is consistent with the results of this study. In addition, the soil permeability of the APAC is about 3.85 times higher than that of the CAT (Table 1). The above results indicate that under rice field conditions, the reoxygenation rate of the APAC can be maintained for a longer period compared to that of the PAC and CAT, making the soil oxygen content of the APAC higher than that of the PAC and CAT.

3.2. Lodging Resistance and Morphological Characteristics of the N3 Internode

Based on existing research (see Section 1, “Introduction”, for more details), the lodging resistance of rice stems is closely linked to the N3 internode. This section specifically examines the culm morphology and anatomy structure of the N3 internode and their influence on lodging resistance.

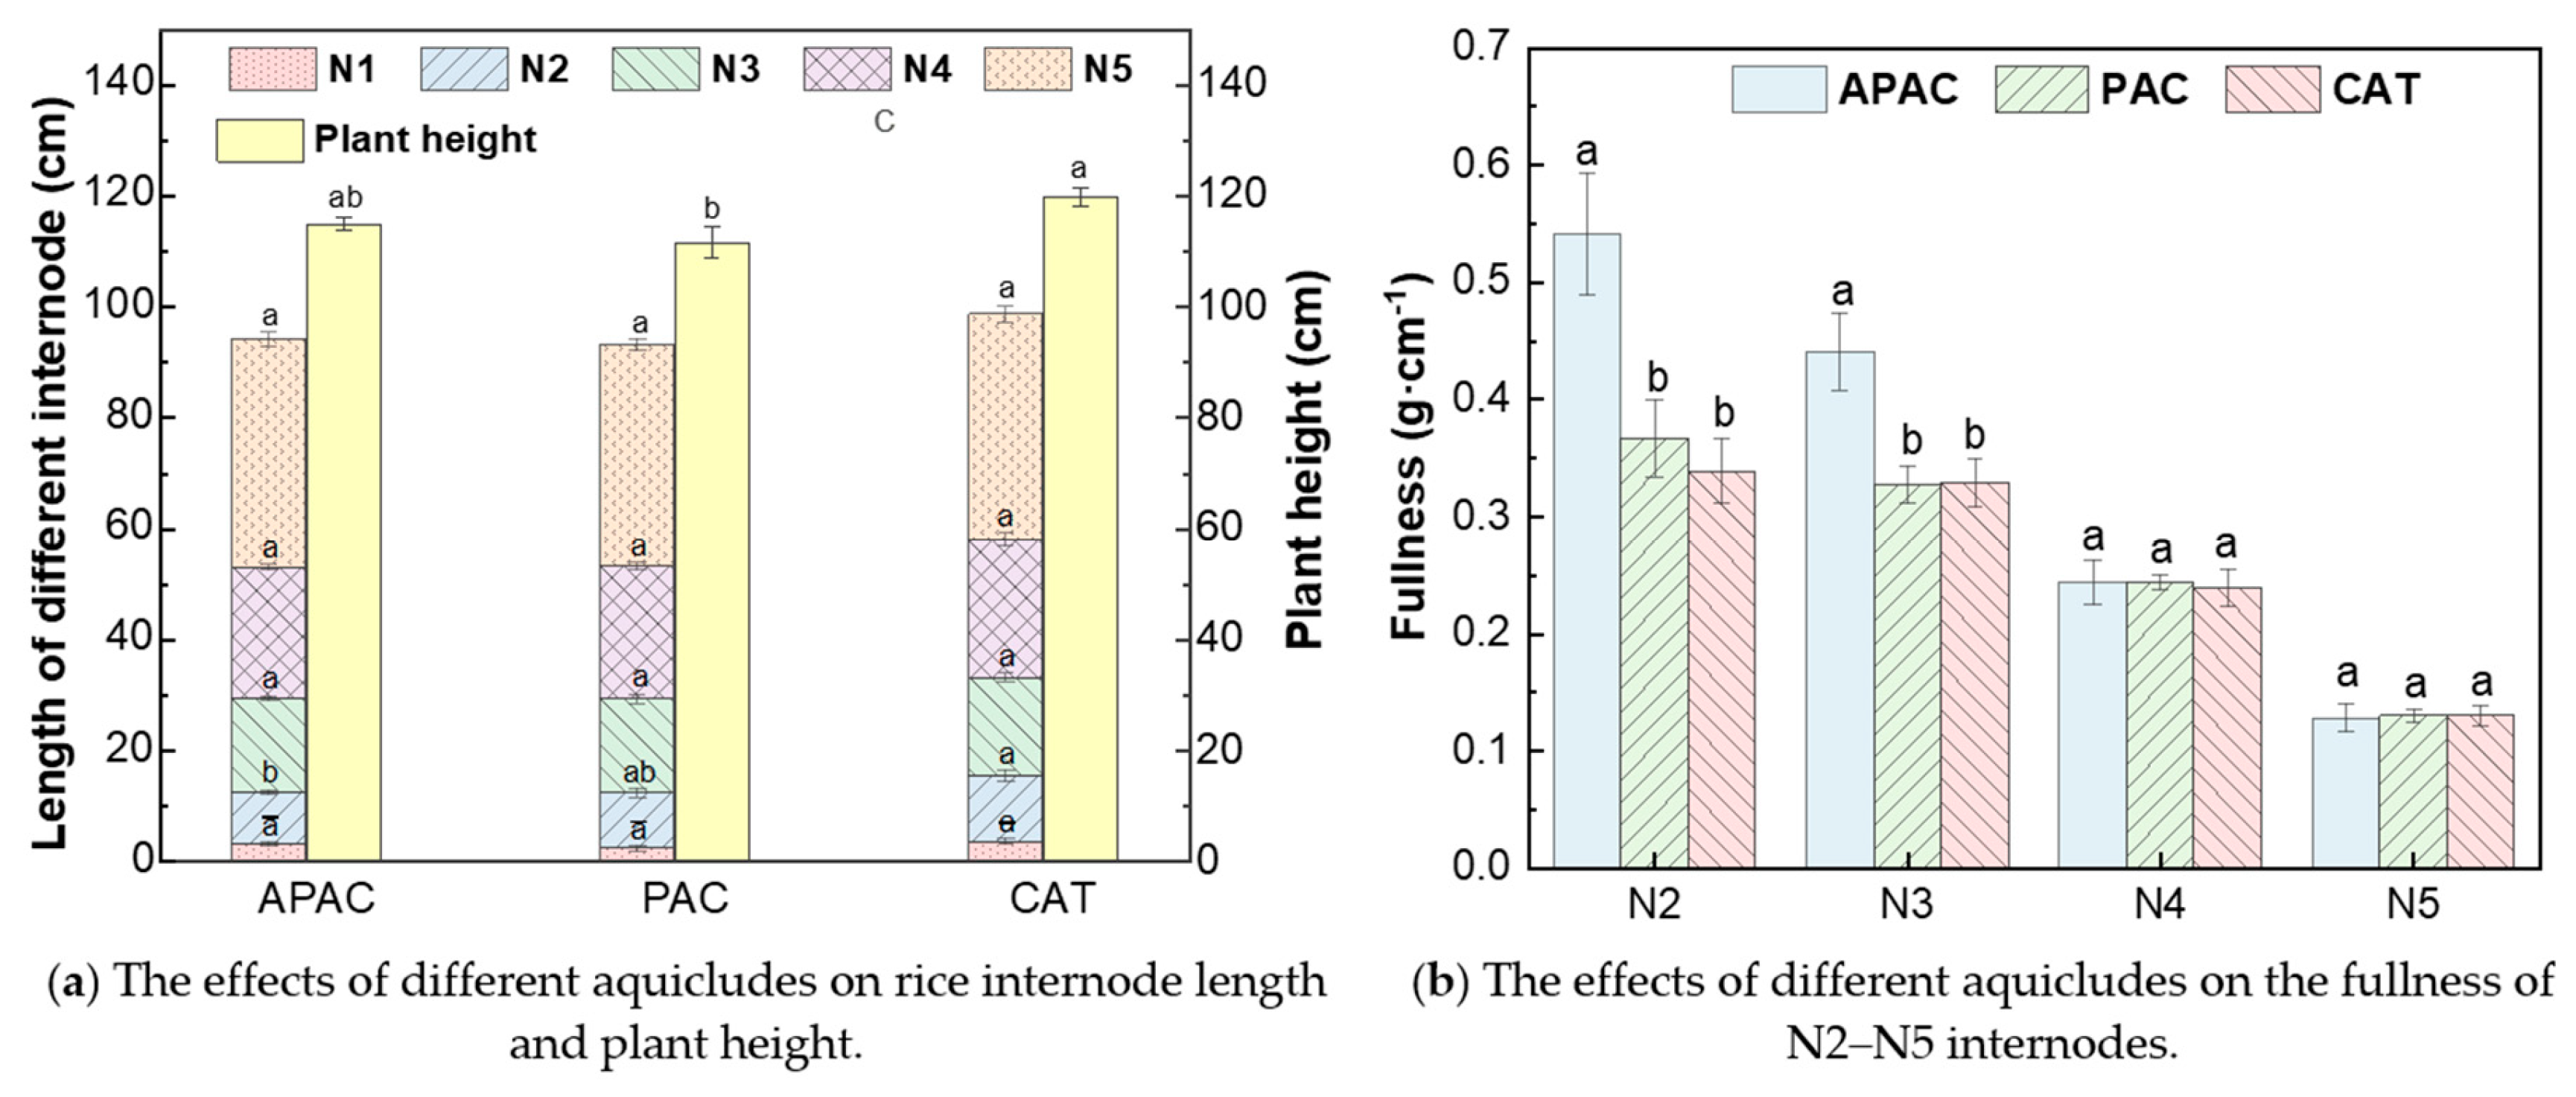
3.2.1. Culm Morphology Parameters and Lodging-Related Traits of N3

Different aquicludes have significant effects on the morphological characteristics and lodging characteristics of the third internode (N3) at the base of rice (Table 3 and Table 4). Regarding the morphological characteristics of the N3 at the base of rice, the APAC has a significant impact on the internodal stem wall thickness, internodal fresh weight, internodal fullness, and the fresh weight from the base of the internode to the top of the ear. Among these, there is a significant effect on the fresh weight and the fullness of the internode at p < 0.01, with no significant difference between the PAC and the CAT. Compared with the PAC and the CAT, (a) the stem wall thickness of APAC increased by 18.18% and 15.32%, (b) the fresh weight of internodes in APAC increased by 38.81% and 37.56%, (c) the fullness of APAC enhanced by 34.97% and 34.15%, and (d) the fresh weight from base to ear top increased by 17.20% and 20.31%. The APAC has no significant effect on the internode length, internode outer diameter, and the length from the base to the top of the ear. In general, the APAC can significantly improve the stem wall thickness of the N3, the fresh weight of the internodes, and the fresh weight from the base to the top of the ear.
In terms of lodging properties, the APAC significantly influences the lodging index and bending moment at breaking at the p < 0.01 level, with no significant difference between the PAC and the CAT. The lodging index of APAC, PAC, and CAT are 68.60%, 109.83%, and 108.76%, respectively. The lodging index of APAC is 37.54% and 36.93% lower than that of the PAC and the CAT, respectively. The breaking bending moment is 86.68% and 85.88% higher than that of the PAC and the CAT, respectively. The APAC has little influence on the bending moment, bending section modulus, and the maximum stress on the section. Among these, the bending moment of APAC is 17.83% and 17.37% higher than that of the PAC and the CAT, respectively; the bending section modulus of APAC is 29.01% and 52.27% higher than that of the PAC and the CAT, respectively; the maximum stress on the section of APAC is 4.42% and 21.45% lower than the PAC and the CAT, respectively.
The primary factor contributing to the difference in lodging index among different aquicludes is the bending moment at breaking rather than the bending moment itself (Table 4). The lodging index shows a negative correlation with the bending moment at breaking and no correlation with the bending moment, internode length, and internode outer diameter (Figure 6). Additionally, the lodging index exhibits a significant negative correlation with the internode fresh weight and internodal fullness but no relationship with the cross-section modulus and the maximum stress on the cross-section. However, the bending moment at breaking is closely and positively correlated with the fresh weight of the internodes. It is also significantly positively correlated with the bending moment, cross-section modulus, outer diameter of the internodes, stem wall thickness of the internodes, internodal fullness, and the internodal length from the base to the ear (Figure 6).

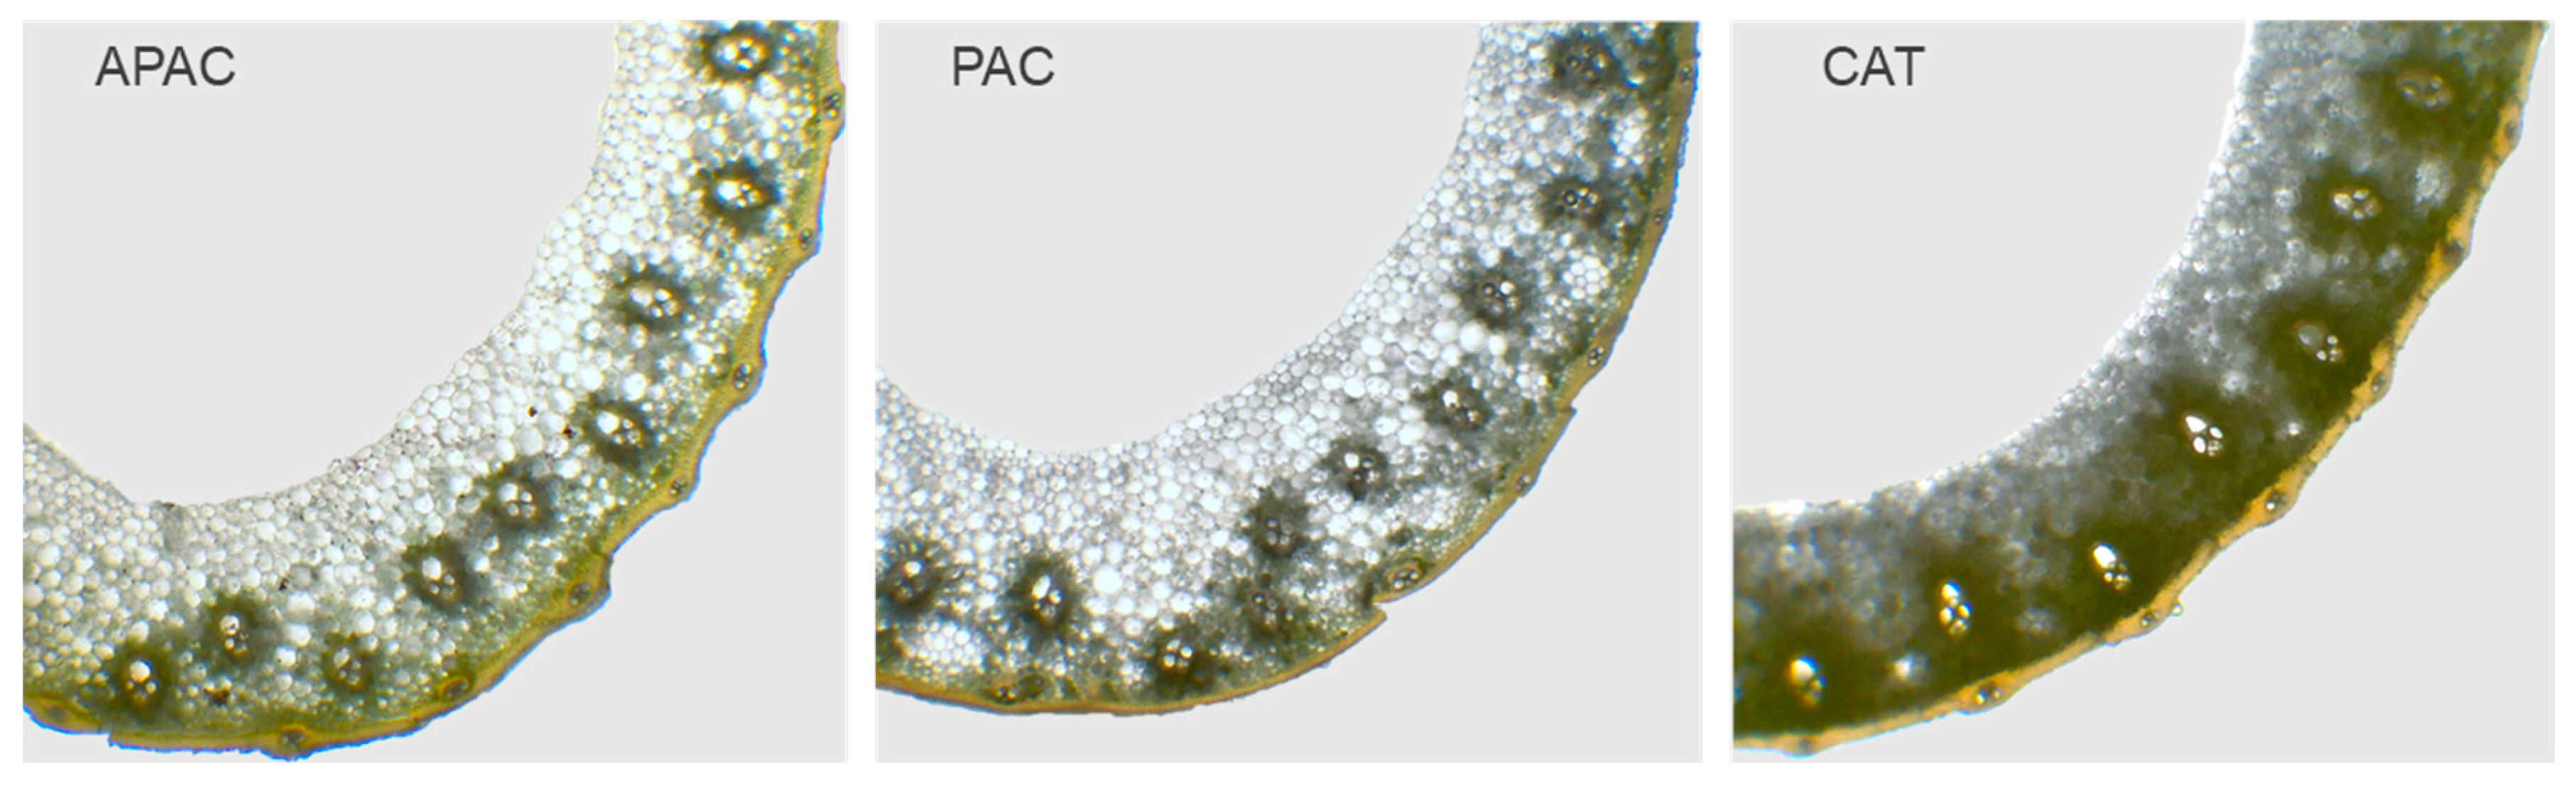
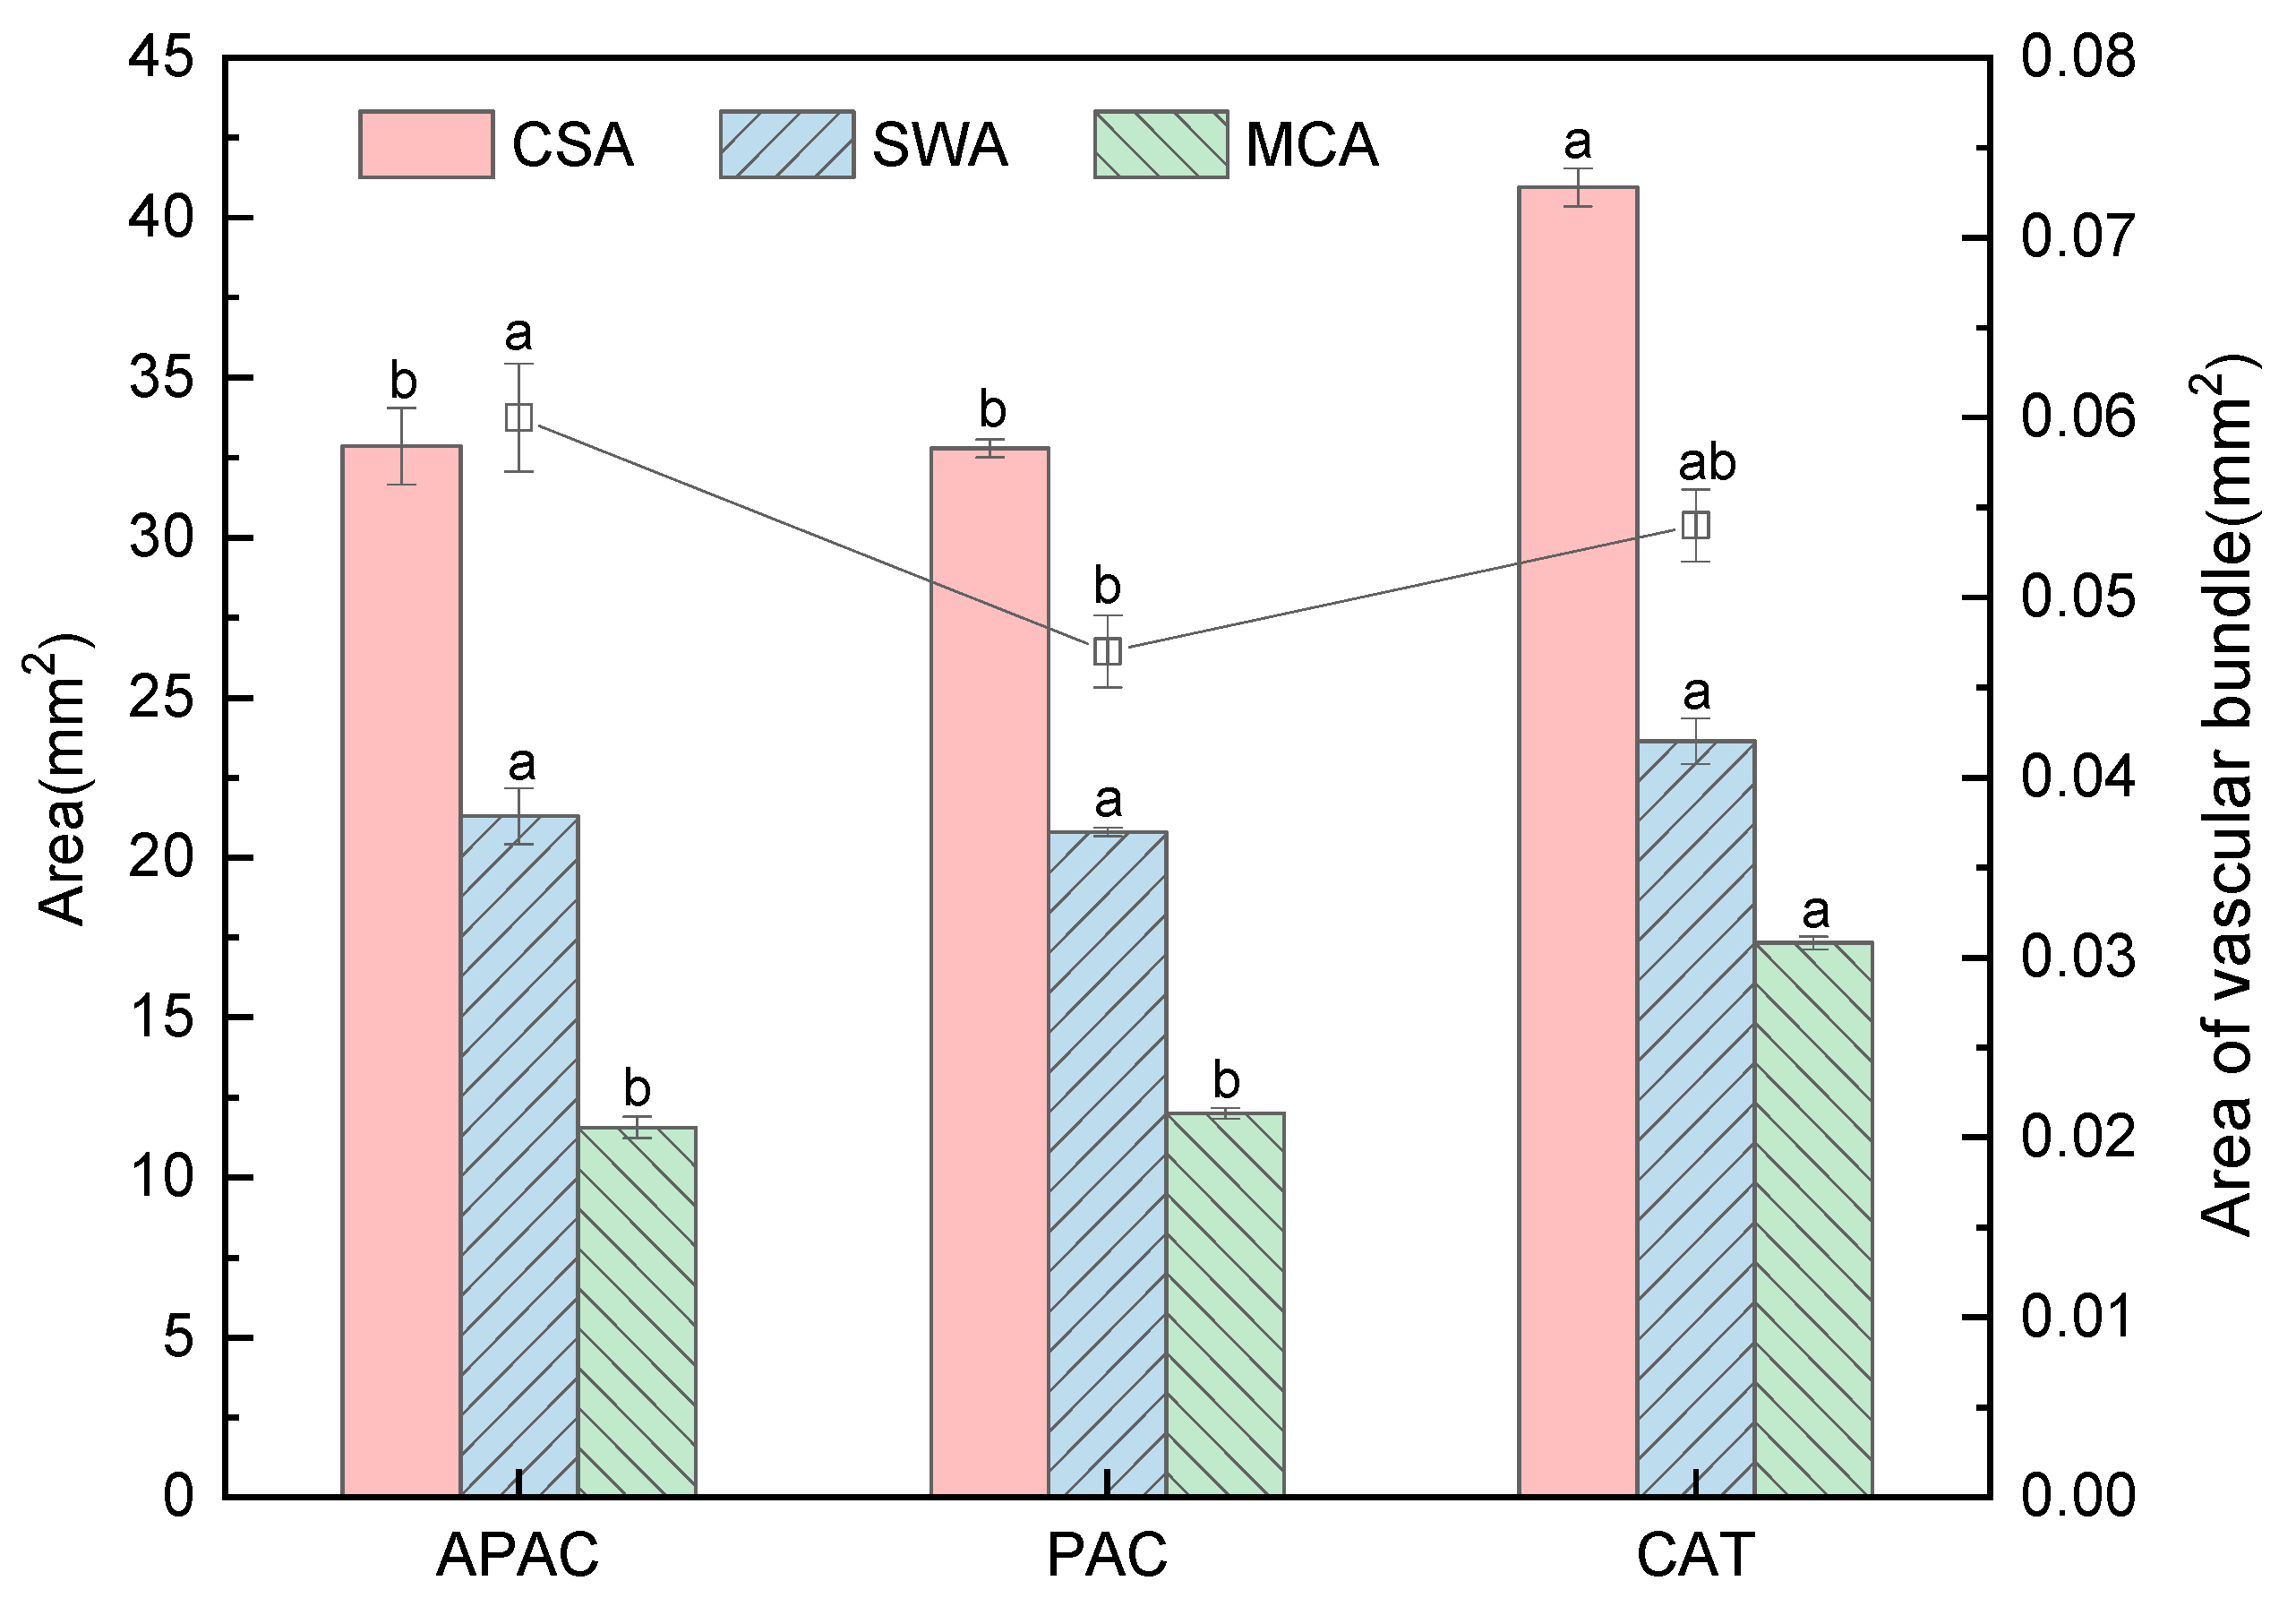
3.2.2. The Anatomy Structure of the N3

From the analysis of vascular bundles (Figure 7 and Figure 8), it is evident that different aquicludes have significant effects on the vascular (VBA), cross-section area (CSA), and medullary cavity area (MCA) (p < 0.01).
From Figure 7, it is evident that the arrangement tightness of the vascular bundles follows the order of APAC > PAC > CAT. The arrangement density of the large vascular bundles is lower than that in APAC and PAC. Compared with PAC, the large vascular bundles in APAC and CAT are relatively long and narrow.
From Figure 8, the overall trend of the VBA is APAC > PAC > CAT. The VBA of APAC was significantly higher than that of PAC and CAT, being 27.66% and 11.11% higher than PAC and CAT, respectively. The MCA and CSA of CAT were significantly higher than those of APAC and PAC. The MCA of APAC is 3.67% and 33.29% lower than PA and CAT, respectively. The CSA of APAC is 0.18% higher than PAC and 19.76% lower than CAT. There was no significant difference in SWA, showing an overall trend of CAT > APAC > PAC, with APAC being 2.36% higher than PAC and 9.90% lower than CAT.

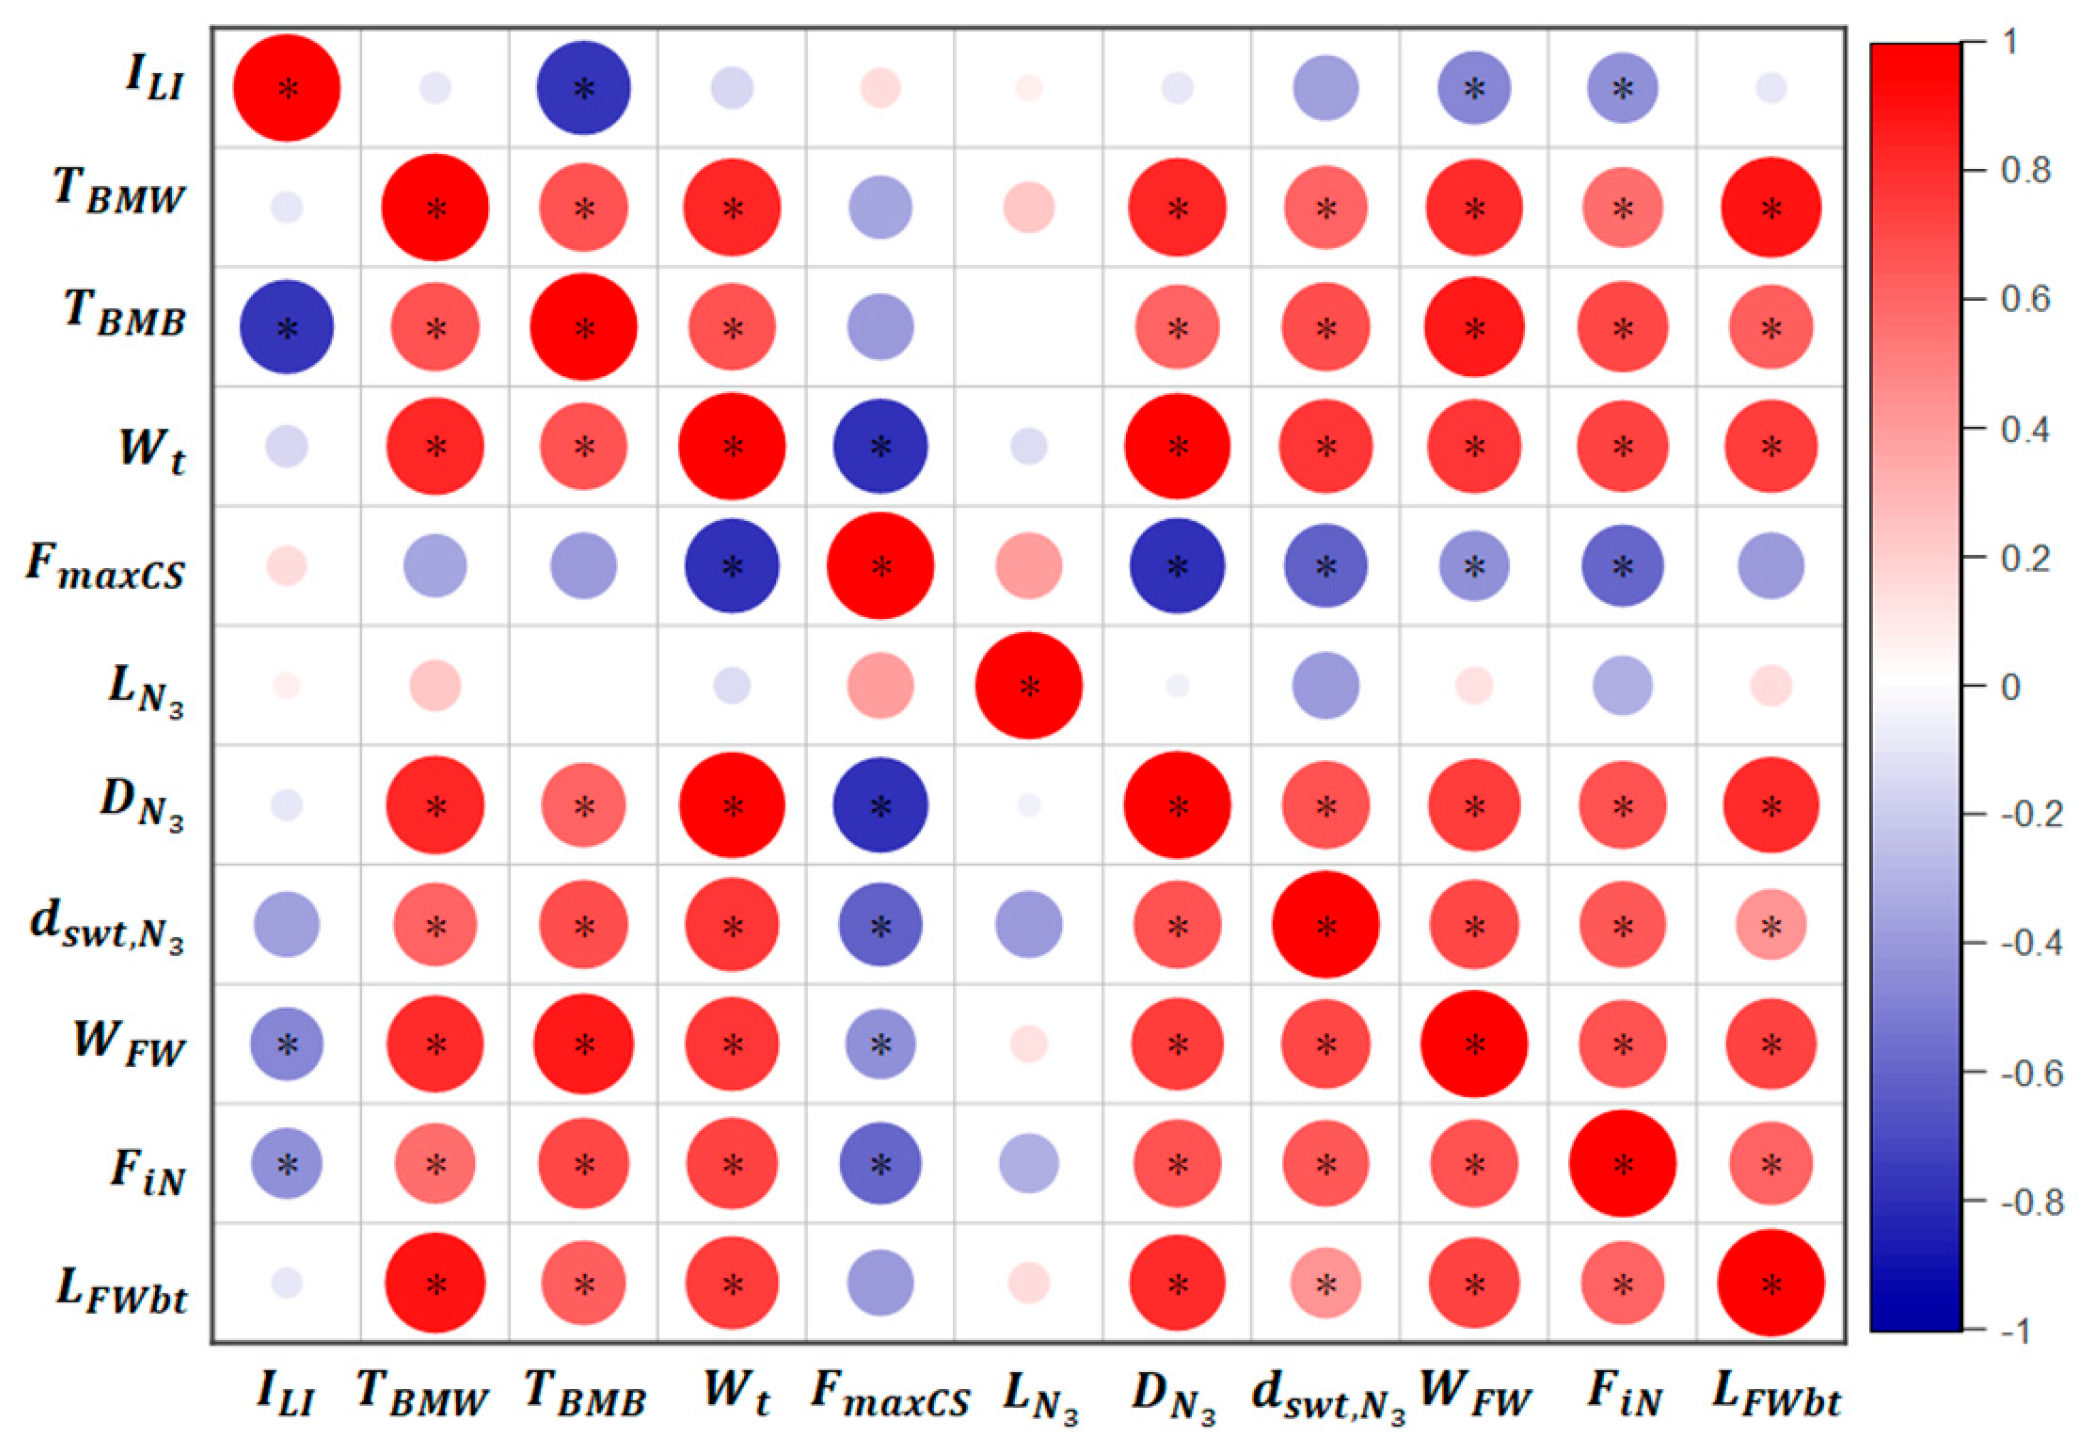
3.3. Culm Morphology Parameters and Yield

Figure 9 illustrates the effects of different aquicludes on the configuration of rice internodes and yield. In Figure 9a, it can be observed that APAC significantly influences the length of the internode N2, being 7.46% and 21.72% shorter than PAC and CAT, respectively. The differences in length between N1, N3, N4, and N5 in different aquicludes are small. As shown in Figure 9b, APAC significantly affects the fullness of the N2 and N3 internodes (p < 0.01) but has no significant impact on the fullness of the internodes N4 and N5. Specifically, the fullness of N2 in APAC is significantly higher than that of N2 in PAC and CAT, increasing by 47.54% and 59.76%, respectively.
Throughout the rice growth period, the APAC has a minor impact on plant height, while the CAT significantly affects rice plant height during the tillering stage, with no noticeable impact during the rest of the growth period (Figure 10). During the rice greening stage, there is a trend of APAC > CAT > PAC in plant height, with a significant difference, indicating that the APAC can promote rapid seeding growth. In the tillering stage, plant height in CAT increased faster than in APAC and PAC. Following the jointing and grain-filling stage, overall plant height showed a trend of CAT > APAC > PAC. Plant height in APAC was about 2.97% higher than in PAC and approximately 4.07% shorter than in CAT (Figure 9). During the yellow ripening stage, there were significant differences in plant height among different aquicludes. Figure 11a also indicates that the lodging index of different aquicludes is not correlated with plant height during the yellow maturity stage.
The APAC significantly influences yield, as depicted in Table 5. Yields for APAC, PAC, and CAT are 8.09 t·hm−2, 7.22 t·hm−2, and 7.06 t·hm−2, respectively. Compared with PAC and CAT, APAC increased yield by 12.05% and 14.59%, respectively. The lodging index of rice stem showed a close negative correlation with rice yield (Figure 11b).

4. Discussion

4.1. Effects of APAC on Rice Yield and Clum Morphology Characteristics

The APAC enhances the reoxygenation rate of the water body by improving air permeability. Results from simulated rice field reoxygenation experiments demonstrate that the APAC can achieve a reoxygenation rate of 14.61% to 24.39% higher than that of the CAT. This improvement in dissolved oxygen concentration benefits rice yields by increasing oxygen levels. Additionally, Baram et al. [19] observed that micro-nano aeration drip irrigation effectively enhances soil aeration, particularly in clay soils irrigated with wastewater over extended periods. Studies have shown that the APAC can significantly increase rice yields. Zhu et al. [44], for example, raised dissolved oxygen levels through aerobic irrigation, resulting in significantly higher rice yields, a finding consistent with the outcomes of this study.
In this study, it was observed that the APAC significantly enhanced seeding growth during the green stage. Furthermore, after the yellow ripening stage, the APAC notably reduced the length of the N2 internode length and the N1, N3, N4, and N5 internodes, although the effect on plant height was negligible. Additionally, the APAC significantly increased the stem wall thickness and fresh weight of the N3 internode, as well as the fresh weight from the base of the internode to the top of the ear. These improvements were attributed to enhanced air permeability and increased oxygen content in the rice field.
This study also observed that the APAC significantly enhances seeding growth during the greening stage. After the yellow maturity stage, the APAC notably reduces the length of the N2 internode while showing no significant effect on the lengths of N1, N3, N4, and N5. There is no evident impact on plant height, indicating a shorter basal internode. Zhang et al. [45] found that a shorter basal internode is beneficial for reducing the height of the plant’s center of gravity and increasing its resistance to lodging. In addition, the APAC significantly increases the stem wall thickness and fresh weight of the N3 internode, as well as the fresh weight from the base of the internode to the top of the ear, by improving the air permeability and increasing the oxygen content in the rice field. Moreover, the APAC significantly improves the fullness of the N2 and N3 internodes.

4.2. The APAC Is Beneficial to Enhance the Lodging Resistance of Rice

For different aquicludes, the lodging index of rice stems is related to the breaking bending moment but not to the bending moment. This relationship between the lodging index and the breaking bending moment is closer than that of the bending moment, as noted by Islam et al. [46], which aligns with the findings of this study. The breaking bending moment was closely related to the fresh weight of the internodes, and the lodging index was significantly associated with both the fresh weight of the internodes and the fullness of the internodes. Therefore, in the conditions of this study, the fresh weight and the fullness of internodes are the most important traits affecting the lodging index. Additionally, the breaking bending moment is positively correlated with the outer diameter of the internode, the internode stem wall thickness, and the fresh weight of the internode, indicating that the breaking bending moment is related to the morphology of the base internode, which is consistent with the research conclusions of Zhang et al. [45] and Islam et al. [46].
Rice vascular bundles serve a structural support function, and increasing the area and density of the vascular bundle mechanical tissue is crucial for improving the mechanical strength of crop stems. This improvement is beneficial for enhancing rice lodging resistance and reducing the risk of lodging [47]. Anatomical observations in this study revealed that the bottom layer of the APAC can significantly increase the area of vascular bundles and their closer arrangement, which promotes the development of mechanical tissue and enhances rice lodging resistance. This finding aligns with the research by Gao et al. [47]. Additionally, the study found that the CAT can significantly increase the internode cross-sectional area, medullary cavity area, and stem wall area, resulting in a significantly higher lodging index compared to the APAC. The lodging index shows a positive correlation with the internode cross-sectional area, medullary cavity area, and stem wall area, which is consistent with the findings of Han et al. [48].
In this study, the lodging index showed no correlation with plant height but was closely associated with yield. Several studies have demonstrated that lodging can significantly reduce crop canopy photosynthesis by 60% to 80% compared to upright plants, promoting fungal growth and ultimately leading to yield reduction [7]. Lodging can also decrease yields by limiting nutrient and water uptake [9], highlighting the importance of enhancing rice stem lodging resistance for increased yield. Numerous studies have indicated that reducing plant height can enhance lodging resistance [9,10,14,46], with some scholars successfully improving rice lodging resistance by cultivating shorter varieties. However, since plant height is positively correlated with yield, excessively reducing it can result in lower rice yields [49]. Therefore, enhancing lodging resistance through improvements in basal internode morphology remains essential for increasing rice yield.

4.3. Economic Feasibility Analysis of APAC

The high initial capital and labor investment costs of this technology are the main obstacles to its promotion among farmers, costing at least $3 per square meter. However, the ecological restoration and reclamation of desertified land, such as sandy land and abandoned open-pit mines, mainly rely on government promotion and compensation to participants. Taking China as an example, a survey and analysis of remote sensing data from 2021 organized by the Ministry of Natural Resources of China in 2022 showed that China’s abandoned open-pit mines accounted for 827,400 square kilometers of mining land, occupying 26,283.80 square kilometers of basic farmland, and the ecological restoration rate was only 38.67% [50]. This not only destroyed the mining area ecosystem but also caused a serious shortage of arable land resources. From 2016 to 2018, China deployed 25 ecological protection and restoration pilot projects in 24 provinces with a total investment of approximately RMB 283 billion. Current research on ecological restoration technology mainly includes soil restoration [51], plant restoration [52], and rewilding [53], while research on rice field reclamation is relatively rare. Guangyang Island in Chongqing, China, applied this technology to reclaim rice terraces and achieved the goal of ecological restoration of fertile fields. The Guangyang Island Ecological Restoration Project has been rated as a “National Ecological Environment Science Popularization Base” [54], and in 2024, it will be selected as an outstanding case by the “United Nations Decade on Ecosystem Restoration”.
Furthermore, some scholars have suggested the industrialization of ecological product value. The primary approach to achieve this is by conducting ecological property rights transactions and leveraging ecological resources through ecological restoration and compensation to enhance sustainability [55]. Ecological products encompass ecological agricultural products and ecological tourism services. In Chongqing, China, a market-based trading mechanism for ecological resource indicators has been established, focusing on horizontal compensation for forest coverage, “forest tickets”, and ecological “land tickets”, with Guangyang Island serving as a pilot project [56].

5. Conclusions

The APAC enhances both the air permeability and anti-seepage properties of the paddy soil, thereby increasing the oxygen and water content in the rice field. It significantly improves the lodging resistance and yield of rice under alternating shallow-wet irrigation conditions. Compared with the PAC and CAT, the APAC reduces the lodging index by 37.54% and 36.93%, respectively, and increases the yield by 12.05% and 14.59%, respectively, with rice yields reaching 8.09 t·hm−2.
Under the conditions of this study, the breaking bending moment has a greater impact on the lodging index than the bending moment. This influence is mainly achieved by increasing the outer diameter, stem wall thickness, fresh weight, and fullness of the internodes, thereby enhancing the morphological characteristics of the base internode to improve lodging resistance. The APAC enhances the development of stem vascular bundles, significantly increasing their area and tightness, which in turn improves stem mechanical strength and lodging resistance. Moreover, the lodging index is closely related to yield but has little correlation with plant height, suggesting that there is no need to consider reducing plant height to improve lodging resistance at the expense of yield. In conclusion, constructing an APAC with hydrophobic sand in newly reclaimed rice fields is beneficial for enhancing the morphological characteristics of the base internode, thereby significantly improving the lodging resistance and yield of rice stalks.
This paper proposes to utilize aeolian sand as a resource by designing hydrophobic sand, which is subsequently used to construct APAC for the reclamation of sandy land into rice fields. This study confirms that APAC has significant application potential and research value in the ecological restoration of desertified land, ensuring food security and optimizing sand resource utilization. It provides novel theoretical and practical support for local governments, policymakers, and stakeholders in addressing ecological restoration, food security, and resource utilization challenges associated with desertified lands.

Author Contributions

Conceptualization, X.M. and J.W.; methodology, X.M. and J.W.; software, J.W.; validation, X.M., J.W., Y.S., S.Q. and F.P.; formal analysis, X.M. and J.W.; investigation, X.M. and J.W.; resources, S.Q. and F.P.; data curation, X.M. and J.W.; writing—original draft preparation, X.M., J.W. and F.P.; writing—review and editing, Y.S., S.Q. and F.P.; visualization, X.M. and J.W.; supervision, S.Q. and F.P.; project administration, S.Q.; funding acquisition, S.Q. and F.P. All authors have read and agreed to the published version of the manuscript.

Funding

This research received no external funding.

Data Availability Statement

The original contributions presented in this study are included in the article; further inquiries can be directed to the corresponding author.

Conflicts of Interest

The authors declare no conflicts of interest.

References

  1. Meng, X.; Li, S.; Akhmadi, K.; He, P.; Dong, G. Trends, turning points, and driving forces of desertification in global arid land based on the segmental trend method and SHAP model. GIScience Remote Sens. 2024, 61, 2367806. [Google Scholar] [CrossRef]
  2. Ahmed, S.M. Impacts of drought, food security policy and climate change on performance of irrigation schemes in sub-saharan Africa: The case of Sudan. Agric. Water Manag. 2020, 232, 106064. [Google Scholar] [CrossRef]
  3. Li, Y.; Niu, W.; Wang, J.; Liu, L.; Zhang, M.; Xu, J. Effects of Artificial Soil Aeration Volume and Frequency on Soil En-zyme Activity and Microbial Abundance when Cultivating Greenhouse Tomato. Soil Sci. Soc. Am. J. 2016, 80, 1208. [Google Scholar] [CrossRef]
  4. Yoshinaga, S.; Takai, T.; Arai-Sanoh, Y.; Ishimaru, T.; Kondo, M. Varietal differences in sink production and grain-filling ability in recently developed high-yielding rice (Oryza sativa L.) varieties in Japan. Field Crops Res. 2013, 150, 74–82. [Google Scholar] [CrossRef]
  5. Setter, T.L.; Laureles, E.V.; Mazaredo, A.M. Lodging reduces yield of rice by self-shading and reductions in canopy photosynthesis. Field Crops Res. 1997, 49, 95–106. [Google Scholar] [CrossRef]
  6. Berry, P.M.; Spink, J. Predicting yield losses caused by lodging in wheat. Field Crops Res. 2012, 137, 19–26. [Google Scholar] [CrossRef]
  7. Niu, Y.; Chen, T.; Zhao, C.; Zhou, M. Lodging prevention in cereals: Morphological, biochemical, anatomical traits and their molecular mechanisms, management and breeding strategies. Field Crops Res. 2022, 289, 108733. [Google Scholar] [CrossRef]
  8. Zhang, S.; Yang, Y.; Zhai, W.; Tong, Z.; Shen, T.; Li, Y.C.; Zhang, M.; Sigua, G.C.; Chen, J.; Ding, F. Controlled-release nitrogen fertilizer improved lodging resistance and potassium and silicon uptake of direct-seeded rice. Crop Sci. 2019, 59, 2733–2740. [Google Scholar] [CrossRef]
  9. Zhang, W.; Wu, L.; Ding, Y.; Yao, X.; Wu, X.; Weng, F.; Li, G.; Liu, Z.; Tang, S.; Ding, C.; et al. Nitrogen fertilizer application affects lodging resistance by altering secondary cell wall synthesis in japonica rice (Oryza sativa). J. Plant Res. 2017, 130, 859–871. [Google Scholar] [CrossRef]
  10. Khush, G.S. Green revolution: Preparing for the 21st century. Genome 1999, 42, 646–655. [Google Scholar] [CrossRef]
  11. Aya, K.; Hobo, T.; Sato-Izawa, K.; Ueguchi-Tanaka, M.; Kitano, H.; Matsuoka, M. A novel AP2 -type transcription factor, Small Organ Size1, controls organ size downstream of an auxin signaling pathway. Plant Cell Physiol. 2014, 55, 897–912. [Google Scholar] [CrossRef] [PubMed]
  12. Yang, C.; Yang, L.; Yan, T.; Ouyang, Z. Effects of nutrient and water regimes on lodging resistance of rice. China J. Appl. Ecol. 2004, 15, 646–650. [Google Scholar] [CrossRef]
  13. Wang, C.; Blagodatskaya, E.; Dippold, M.A.; Dorodnikov, M. Keep oxygen in check: Contrasting effects of short-term aeration on hydrolytic versus oxidative enzymes in paddy soils. Soil Biol. Biochem. 2022, 169, 108690. [Google Scholar] [CrossRef]
  14. WaWang, C.; Dippold, M.A.; Blagodatskaya, E.; Dorodnikov, M. Oxygen matters: Short- and medium-term effects of aeration on hydrolytic enzymes in a paddy soil. Geoderma 2022, 407, 115548. [Google Scholar] [CrossRef]
  15. Xu, C.; Xiao, D.; Chen, S.; Chu, G.; Liu, Y.; Zhang, X.; Wang, D. Changes in the activities of key enzymes and the abundance of functional genes involved in nitrogen trans-formation in rice rhizosphere soil under different aerated conditions. J. Integr. Agric. 2023, 22, 923–934. [Google Scholar] [CrossRef]
  16. Qian, Z.; Zhuang, S.; Gao, J.; Tang, L.; Harindintwali, J.D.; Wang, F. Aeration increases soil bacterial diversity and nutrient transformation under mulching-induced hypoxic conditions. Sci. Total Environ. 2022, 817, 153017. [Google Scholar] [CrossRef]
  17. Zhou, W.; Yi, Y.; Tu, N.; Tan, Z.; Wang, H.; Yang, Y.; Wang, C.; Ti, Z. Research progresses in the effects of rhizosphere oxygen-increasing on rice root morphology and physiology. Chin. J. Eco-Agric. 2018, 26, 367–376. [Google Scholar] [CrossRef]
  18. Campos, A.C.; Etchevers, J.B.; Oleschko, K.L.; Hidalgo, C.M. Soil microbial biomass and nitrogen mineralization rates along an altitudinal gradient on the cofre de perote volcano (Mexico): The importance of landscape position and land use. Land Degrad. Dev. 2014, 25, 581–593. [Google Scholar] [CrossRef]
  19. Baram, S.; Evans, J.F.; Berezkin, A.; Ben-Hur, M. Irrigation with treated wastewater containing nanobubbles to aerate soils and reduce nitrous oxide emissions. J. Clean. Prod. 2021, 280, 124509. [Google Scholar] [CrossRef]
  20. Guber, A.K.; Smucker, A.J.M.; Berhanu, S.; Miller, J.M.L. Subsurface Water Retention Technology Improves Root Zone Water Storage for Corn Production on Coarse-Textured Soils. Vadose Zone J. 2015, 14, 1–13. [Google Scholar] [CrossRef]
  21. Nkurunziza, L.; Chirinda, N.; Lana, M.; Sommer, R.; Karanja, S.; Rao, I.; Romero Sanchez, M.A.; Quintero, M.; Kuyah, S.; Lewu, F.; et al. The Potential Benefits and Trade-Offs of Using Sub-surface Water Retention Technology on Coarse-Textured Soils: Impacts of Water and Nutrient Saving on Maize Production and Soil Carbon Sequestration. Front. Sustain. Food Syst. 2019, 3, 71. [Google Scholar] [CrossRef]
  22. Inner Mongolia Statistical Yearbook. 2021. Available online: http://tj.nmg.gov.cn/files_pub/content/PAGEPACK/83e5521da4e94d50ab45483b58e5fa7e/zk/indexch.htm (accessed on 22 July 2024).
  23. Lozano, Y.M.; Lehnert, T.; Linck, L.T.; Lehman, A.; Rillig, M.C. Microplastic Shape, Polymer Type, and Concentration Affect Soil Properties and Plant Biomass. Front. Plant Sci. 2021, 424, 127283. [Google Scholar] [CrossRef] [PubMed]
  24. Shi, R.; Liu, W.; Lian, Y.; Wang, Q.; Zeb, A.; Tang, J. Phytotoxicity of polystyrene, polyethylene and polypropylene microplastics on tomato (Lycopersicon esculentum L.). J. Environ. Manag. 2022, 317, 115441. [Google Scholar] [CrossRef]
  25. Lin, H.; Cui, G.; Jin, Q.; Liu, J.; Dong, Y. Effects of microplastics on the uptake and accumulation of heavy metals in plants: A review. J. Environ. Chem. Eng. 2024, 12, 111812. [Google Scholar] [CrossRef]
  26. Ismail, S.M.; Ozawa, K. Improvement of crop yield, soil moisture distribution and water use efficiency in sandy soils by clay application. Appl. Clay Sci. 2007, 37, 81–89. [Google Scholar] [CrossRef]
  27. Ray, S.S.; Soni, R.; Kim, I.-C.; Park, Y.I.; Lee, C.Y.; Kwon, Y.N. Surface innovation for fabrication of superhydrophobic sand grains with improved water holding capacity for various environmental applications. Environ. Technol. Innov. 2022, 28, 102849. [Google Scholar] [CrossRef]
  28. Chen, L.; Si, Y.; Guo, Z.; Liu, W. Superhydrophobic sand: A hope for desert water storage and transportation projects. J. Mater. Chem. A 2017, 5, 6416–6423. [Google Scholar] [CrossRef]
  29. Atta, A.M.; Abdullah, M.M.S.; Al-Lohedan, H.A.; Mohamed, N.H. Coating Sand with New Hydrophobic and Superhydrophobic Silica/Paraffin Wax Nanocapsules for Desert Water Storage and Transportation. Coatings 2019, 9, 124. [Google Scholar] [CrossRef]
  30. González-Peñaloza, F.A.; Zavala, L.M.; Jordán, A.; Bellinfante, N.; Bárcenas-Moreno, G.; Mataix-Solera, J.; Granged, A.J.P.; Granja-Martins, F.M.; Neto-Paixão, H.M. Water repellency as conditioned by particle size and drying in hydrophobized sand. Geoderma 2013, 209, 31–40. [Google Scholar] [CrossRef]
  31. Sun, X.; Liu, Y.; Mopidevi, S.; Meng, Y.; Huang, F.; Parisi, J.; Nieh, M.-P.; Cornelius, C.; Suib, S.L.; Lei, Y. Super-hydrophobic “smart” sand for buried explosive detection. Sens. Actuators B Chem. 2014, 195, 52–57. [Google Scholar] [CrossRef]
  32. Mitzel, M.R.; Sand, S.; Whalen, J.K.; Tufenkji, N. Hydrophobicity of biofilm coatings influences the transport dynamics of polystyrene nanoparticles in biofilm-coated sand. Water Res. 2016, 92, 113–120. [Google Scholar] [CrossRef] [PubMed]
  33. Tschapek, M.; Wasowksi, C.; Falasca, S. Character and change in the hydrophilic properties of quartz sand. Z. Pflanzenernährung Bodenkd. 1983, 146, 295–301. [Google Scholar] [CrossRef]
  34. Barthlott, W.; Neinhuis, C. Purity of the sacred lotus, or escape from contamination in biological surfaces. Planta 1997, 202, 1–8. [Google Scholar] [CrossRef]
  35. Zhou, Z.; Leung, A.K. Modifying the mechanical properties of sand by using different hydrophobic conditions. Acta Geotech. 2022, 17, 3783–3797. [Google Scholar] [CrossRef]
  36. Salem, M.A.; Al-Zayadneh, W.; Schulze, H.F.; Cheruth, A. Effect of nano-hydrophobic sand layer on Bermudagrass (Cynodon spp.) in urban landscaping. Urban Water J. 2014, 11, 167–173. [Google Scholar] [CrossRef]
  37. Salem, M.A.; Al-Zayadneh, W.; Cheruth, A.J. Water Conservation and Management with Hydro-phobic Encapsulation of Sand. Water Resour. Manag. 2010, 24, 2237–2246. [Google Scholar] [CrossRef]
  38. Myrzabaeva, M.; Insepov, Z.; Boguspaev, K.K.; Faleev, D.G.; Nazhipkyzy, M.; Lesbayev, B.T.; Mansurov, Z.A. Investigation of Nanohydrophobic Sand as an Insulating Layer for Cultivation of Plants in Soils Contaminated with Heavy Metals. Eurasian Chem.-Technol. J. 2017, 19, 91–98. [Google Scholar] [CrossRef]
  39. Qin, S. Hydrophobic Particle, Its Preparation Method, Air-Preamble and Hydrophobicity Structure and Its Formation Method. CN Patent CN101838116A, 11 February 2015. [Google Scholar]
  40. Elad, L.; Maria, I.D.; Noam, W. Impact of wind speed and soil permeability on aeration time in the upper vadose zone. Agric. For. Meteorol. 2019, 269–270, 294–304. [Google Scholar] [CrossRef]
  41. Meng, Q.; Qin, S.; Yu, F.; Liu, J.; Li, Y.; Liu, C.; Ren, G. Effects of Different Anti-seepage Treatments on Root Growth of Rice. J. Anhui Agric. Sci. 2018, 46, 179–181. [Google Scholar] [CrossRef]
  42. Hu, P.; Yang, Q.; Yang, Z.; Han, K.; Pan, J. Experimental study on dissolved oxygen content in water and its physical influence factors. J. Hydraul. Eng. 2019, 50, 679–686. [Google Scholar] [CrossRef]
  43. Morten, L.; Jakob, S.; Eva, O.; Walter, W.W.; Ronnie, G. O2 dynamics in the rhizosphere of young rice plants (Oryza sativa L.) as studied by planar optodes. Plant Soil 2015, 390, 279–292. [Google Scholar] [CrossRef]
  44. Zhu, L.; Yu, S.; Jin, Q. Effects of Aerated Irrigation on Leaf Senescence at Late Growth Stage and Grain Yield of Rice. Rice Sci. 2012, 19, 44–48. [Google Scholar] [CrossRef]
  45. Islam, M.S.; Peng, S.B.; Visperas, R.M.; Ereful, N.; Bhuiya, M.S.U.; Julfiquar, A.W. Lodging-related morphological traits of hybrid rice in a tropical irrigated ecosystem. Field Crops Res. 2007, 101, 240–248. [Google Scholar] [CrossRef]
  46. Zhang, J.; Li, G.; Song, Y.; Liu, Z.; Yang, C.; Tang, S.; Zheng, C.; Wang, S.; Ding, Y. Lodging resistance characteristics of high-yielding rice populations. Field Crops Res. 2014, 161, 64–74. [Google Scholar] [CrossRef]
  47. Gao, H.; Dou, Z.; Chen, L.; Lu, Y.; Sun, D.; Xu, Q.; Sun, R.; Chen, X. Effects of semi-deep water irrigation on hybrid indica rice lodging resistance. Front. Plant Sci. 2022, 13, 1038129. [Google Scholar] [CrossRef]
  48. Han, L.; Zhou, R.; Zhou, T.; Lin, C.; Gan, Q.; Ni, D.; Shi, Y.; Song, F. Correlation analysis and QTLs mapping of lodging resistance and yield traits in rice. J. Biol. 2023, 40, 65–70. [Google Scholar] [CrossRef]
  49. Wang, X.; Xu, L.; Li, X.; Yang, G.; Wang, F.; Peng, S. Grain yield and lodging-related traits of ultrashort-duration varieties for direct-seeded and double-season rice in Central China. J. Integr. Agric. 2022, 21, 2888–2899. [Google Scholar] [CrossRef]
  50. Xing, Y.; Wang, J.Y.; Yang, J.Z.; Chen, D.; Du, X.; Guo, J.; Song, L. Distribution and existing problems of mining land for abandoned open-pit mines in China. Remote Sens. Nat. Resour. 2024, 36, 21–26. Available online: https://link.cnki.net/urlid/10.1759.P.20231109.1011.004 (accessed on 10 November 2023).
  51. Khalid, S.; Shahid, M.; Niazi, N.K.; Murtaza, B.; Bibi, I.; Dumat, C. A comparison of technologies for remediation of heavy metal contaminated soils. J. Geochem. Explor. 2017, 182, 247–268. [Google Scholar] [CrossRef]
  52. Yu, H.; Zahidi, I.; Liang, D. Mine land reclamation, mine land reuse, and vegetation cover change: An intriguing case study in Dartford, the United Kingdom. Environ. Res. 2023, 225, 115613. [Google Scholar] [CrossRef]
  53. Lorimer, J.; Sandom, C.; Jepson, P.; Doughty, C.; Barua, M.; Kirby, K.J. Rewilding: Science, Practice, and Politics. Annu. Rev. Environ. Resour. 2015, 40, 39–62. [Google Scholar] [CrossRef]
  54. Yong, L. The Transformation of Guangyang Island in Chongqing. Sci. Technol. Dly. 2023, 8, 1–2. [Google Scholar] [CrossRef]
  55. Zhang, E. Promoting the realization of the value of ecological products by means of ecological restoration—Qualitative comparative analysis of fuzzy sets based on multiple cases. Prices Mon. 2024, 8, 1–11. Available online: https://link.cnki.net/urlid/36.1006.f.20240614.1126.002 (accessed on 1 March 2024).
  56. Zhang, L.; Zhou, Y. Research on the path and mechanism improment of ecological product value realization. Acta Ecol. Sin. 2021, 41, 7893–7899. [Google Scholar] [CrossRef]
Figure 1. Temperature and precipitation measurements during the rice-growing season in Miyun District, Beijing, China.
Agronomy 14 02085 g001
Figure 2. Schematic diagram of the plow pans structure of the paddy field.
Agronomy 14 02085 g002
Figure 3. Experimental design for simulation test of rice field oxygen content. Tube A: simulating APAC; Tube B: simulating APC.
Agronomy 14 02085 g003
Figure 4. Cross-section and area measurement of the internode N3 at the base. (a) Illustration of the cross-section in the middle of the third internode at the base; (b) Illustration of the measurement content using Image J software.
Agronomy 14 02085 g004
Figure 5. Comparison of reoxygenation rates of water bodies A and B, as shown in Figure 3. (a) represents the point at 30 cm, and (b) represents the average of three points.
Agronomy 14 02085 g005
Figure 6. Correlation analysis between rice lodging characteristics and morphological indicators of the internode N3. (*, significant difference at the 0.05 level).
Agronomy 14 02085 g006
Figure 7. Microstructure diagram of the internode N3.
Agronomy 14 02085 g007
Figure 8. Effects of different aquicludes on the CSA, SWA, and MCA of the internode N3. (N3, the third internode. Different letters represent significant differences at the 0.05 level. Different letters (a, b, and ab) represent significant differences at the 0.05 level).
Agronomy 14 02085 g008
Figure 9. Effects of different aquicludes on configuration of rice internodes and plant height. (N1, the first internode; N2, the second internode; N3, the third internode; N4, the fourth internode; N5, the fifth internode. Different letters (a, b, and ab) represent significant differences at the 0.05 level).
Agronomy 14 02085 g009
Figure 10. Plant heights change with time under different aquicludes.
Agronomy 14 02085 g010
Figure 11. The relationship of lodging index with plant height (a) and grain yield (b). Data were pooled from research conducted by the APAC, PAC, and CAT during yellow maturity stage. ns, not significant at the 0.05 probability level; **, significant at the 0.01 probability level.
Agronomy 14 02085 g011
Table 1. Comparison table of impermeability and air permeability of different aquicludes.
CategoryThickness (cm)Air Permeability (L·m−2·s−1)Leakage (mm·d−1)
Sandy soil2010.655760
APAC26.080
PAC-00
CAT201.585
Table 2. Water management during each growth period of rice field.
Control IndexR-S 1PTT-S 2LT-S 3JB-S 4F-S 5M-S 6
Upper limit of rain storage (mm)5060D&S-F 78080D-C 8
Upper limit of irrigation (mm)4015D&S-F3015D-C
Lower limit of rain storage (mm)00D&S-F00D-C
1 R-S: recovery stage; 2 PTT-S: peak time of tillering stage; 3 LT-S: latter tillering stage; 4 JB-S: jointing–booting stage; 5 F-S: filling stage; 6 M-S: maturity stage; 7 D&S-F: draining and sunning the fields; 8 D-C: drought conditions.
Table 3. Culm morphology of N3.
L N 3  1 (cm) D N 3  2 (mm) d s w t , N 3  3 (mm) W F W  4 (g) F i N (g·cm−1) W F W b t  5 (g) L F W b t  6 (cm)
APAC16.96 ± 0.44 a4.774 ± 0.217 a1.014 ± 0.060 a1.8979 ± 0.1502 a0.440 ± 0.033 a8.822 ± 0.473 a102.58 ± 1.94 a
PAC17.03 ± 0.85 a4.517 ± 0.129 ab0.858 ± 0.029 b1.3673 ± 0.0688 b0.326 ± 0.016 b7.527 ± 0.322 b101.99 ± 2.71 a
CAT17.71 ± 0.73 a4.181 ± 0.207 b0.857 ± 0.032 b1.3797 ± 0.0785 b0.328 ± 0.021 b7.333 ± 0.484 b104.49 ± 3.26 a
ANOVA
ns 7ns******ns
The data correspond to the mean ± standard error. Values followed by different letters are significantly different (a, b, and ab) according to LSD (0.05). 1  L N 3 : the length of internode N3; 2  D N 3 : the culm diameter of internode N3; 3  d s w t , N 3 : stem wall thickness; 4  W F W : fresh weight of the internode N3; 5  W F W b t : fresh weight from the base of the internode N3 to the top of the ear; 6  L F W b t : the length of the culm from the base of the internode (N3) to the top of the ear; 7 ns: not significant at the 0.05 probability level; * and **: significant at the 0.05 and 0.01 probability levels, respectively.
Table 4. Lodging-related traits of N3.
Model T B M B (N·cm) T B M W (N·cm) I L I (%)Wt (mm3) F m a x C S (N·mm−2)
APAC13.03 ± 0.83 a8.92 ± 0.62 a68.6 ± 2.63 b10.05 ± 1.32 a9.52 ± 0.78 b
PAC6.98 ± 0.41 b7.57 ± 0.51 a109.83 ± 6.66 a7.79 ± 0.64 ab9.96 ± 0.74 ab
CAT7.01 ± 0.65 b7.60 ± 0.71 a108.76 ± 4.37 a6.60 ± 0.97 b12.12 ± 0.79 a
ANOVA
**ns 1**nsns
The data correspond to the mean ± standard error. Values followed by different letters (a, b, and ab) are significantly different according to LSD (0.05). 1 ns, not significant at the 0.05 probability level; **, significant at the 0.01 probability levels, respectively.
Table 5. Effects of different treatments on rice yield.
APACPACCATANOVA
Grain yield
( t · h m 2 )
8.09 ± 0.26 b7.22 ± 0.17 a7.06 ± 0.16 a*
The data correspond to the mean ± standard error. Values followed by different letters (a and b) are significantly different according to LSD (0.05). *: significant at the 0.05 probability level.
Disclaimer/Publisher’s Note: The statements, opinions and data contained in all publications are solely those of the individual author(s) and contributor(s) and not of MDPI and/or the editor(s). MDPI and/or the editor(s) disclaim responsibility for any injury to people or property resulting from any ideas, methods, instructions or products referred to in the content.

