Article

Activation of ABA Signaling Pathway and Up-Regulation of Salt-Responsive Genes Confer Salt Stress Tolerance of Wheat (Triticum aestivum L.) Seedlings

1
School of Earth Sciences, Yangtze University, Jingzhou 434025, China
2
Schoole of Civil Engineering, Guilin University of Technology, Guilin 541004, China
3
Activities and Stress Adaptations, School of Life Sciences, Lanzhou University, Lanzhou 730000, China
4
Remote Sensing Center of Guangxi, Guilin 541004, China
5
Guangxi Guiyu Engineering Consulting Co., Nanning 530000, China
*
Authors to whom correspondence should be addressed.
These authors contributed equally to this work.
Agronomy 2024, 14(9), 2095; https://doi.org/10.3390/agronomy14092095
Submission received: 4 August 2024 / Revised: 21 August 2024 / Accepted: 9 September 2024 / Published: 13 September 2024
(This article belongs to the Section Plant-Crop Biology and Biochemistry)

Abstract

:
Salt is a potent abiotic stress that arrests plant growth by impairing their physio-biochemical and molecular processes. However, it is unknown how the ABA signaling system and vacuolar-type Na+/H+ antiporter proteins induce stress tolerance in wheat (Triticum aestivum L.) seedlings. The present study aimed to identify salt-responsive proteins and signaling pathways involved in the resistance of wheat to salt stress. We explored the proteome profile, 20 amino acids, 14 carbohydrates, 8 major phytohormones, ion content, and salt tolerance genes in wheat (Triticum aestivum L., cv.) under 200 mM NaCl with control plants for six days. The results showed that amino acids such as alanine, serine, proline, glutamine, and aspartic acid were highly expressed under salt stress compared with control plants, suggesting that amino acids are the main players in salinity tolerance. The ABA signaling system was activated in response to salinity stress through the modulation of protein phosphatase 2C (PP2C) and ABA-responsive element binding factor (ABF), resulting in an ABA-mediated downstream response. Additionally, the vacuolar-type Na+/H+ antiporter was identified as a key protein in salt stress tolerance via compartmentalizing Na+ in the vacuole. Furthermore, a significant increase in the abundance of the 14-3-3 protein was noticed in salt-fed plants, suggesting that this protein plays an important role in Na+ compartmentalization. Moreover, up-regulation of ascorbate peroxidase (APX), glutathione-S-transferase (GST), and thioredoxin-scavenged reactive oxygen species resulted in improved plant growth under salt stress. These data will help to identify salt-responsive proteins that can be used in future breeding programs to develop salt-tolerant varieties.

1. Introduction

Wheat (Triticum aestivum L.) is a major cereal crop and an important source in the human diet [1]. The wheat genome is composed of BBAA and DD genomes. BBAA and DD genomes have co-existed in hexaploid wheat for only 8500 years [2,3]. The multiple copies of genes and interactions among sub-genomes of wheat confer greater physiological and ecological plasticity that contribute to its remarkable tolerance to a variety of environmental stresses [2,4]. An understanding of the wheat salt-tolerance mechanism is important to improving the salt tolerance of crops [5,6]. Significant improvements in wheat salinity tolerance have been achieved in a variety of areas in recent years, including the proteome, transcriptome, metabolome, genome, and transgenesis [5]. Salinity is a major environmental factor in the world, affecting more than 800 million hectares of arable land [3]. Approximately 7.7 × 10⁷ ha of land has been covered by secondary saline soils, occupying 57% of the irrigated agricultural area [7]. A major threat to the development of agriculture, affecting vast portions of the world, is salinization [8]. The physiological and biochemical complexity of the crops was altered by salt stress, which decreased agricultural productivity. The severity and duration of salinity stress may have altered these mechanisms [9,10]. Osmotic and ion toxicity levels of these salt-stressed plants inhibited plant growth [11,12]. As a result of osmotic stress, the roots’ ability to absorb water was reduced and transpiration increased as salts accumulated in soil and plants; therefore, salt stress is also referred to as hyperosmotic stress [13]. Salinity stress may also be referred to as hyperionic stress [3,12]. High salinity causes Na+ and Cl ions to build up in plant tissue, which slows down plant growth. However, a significant amount of Na+ kept in the vacuole will put the cytoplasm under osmotic stress, and Na+ may also partially leak into the cytoplasm to harm the organelles and enzymes [14]. Although several molecular mechanisms, including osmotic adjustment, salt tolerance, and K+ retention, have been briefly studied in crops, this has been a challenge for bread wheat due to its complicated genome, AABBDD [15]. Hexaploid wheat (genome AABBDD) has a great ability to sustain low shoot Na+ levels that are linked to the Kna1 loci because of their complex genetic makeup [16]. K+ is one of the most crucial players in the growth and development of plants. Ion cytotoxicity is caused during biochemical reactions when K+ is substituted by Na+, and sodium inhibits the interactions between amino acids, which ultimately makes protein non-functional [17]. Thus, Na+ reaches poisonous levels, leading to inadequate K+ for enzymatic reactions in saline conditions [14,17,18]. Plants need a large amount of potassium to activate enzymatic reactions [18]. Accumulation of K+, compatible solutes, and protective proteins can relieve the toxicity of Na+ in such conditions [19]. Compatible solutes mainly include carbohydrates, amino acids, betaine, and polyols [19]. Furthermore, Na+ secretion is a common Na+ tolerance mechanism for plants. During salt stress, plants maintain a high ratio of K+ and a low concentration of Na+ in the cytosol [20]. This mechanism is regulated by the SOS system including SOS1, SOS2, SOS3, and HKT1 [20]. In these SOS regulating systems, SOS1 is a Na+/H+ antiporter that plays a key role in Na+ secretion [20]. HKT1 also controls this Na+ secretion system [20]. However, the Na+/H+ antiporter activity of SOS1 is also controlled by another complex of SOS3 and SOS2 [20]. HKT1 is controlled by the complex system of SOS3 and SOS2 [20]. SOS3 is a myristoylated calcium-binding complex protein that can sense the cytosolic calcium signal elicited by salt stress [20]. Plant salt response is a complicated mechanism involving physiological, biochemical, and molecular changes in cells which are controlled by a series of gene expression and proteomic changes [21]. The proteomic response of plants to salt stress was investigated in many crops, such as durum wheat, soybean, peanut, Sorghum bicolor, and maize [22,23,24,25]. In a study of plant molecular mechanisms of salt tolerance that links gene expression to cell metabolism, which is important for adaptation to excess Na+ in plants under salt stress, plant cells expressed salt-regulated genes that affect the cell’s total protein profile [26].
Through research, significant breakthroughs have been made in revealing the activation mechanism of SnRK2, elucidating how the ABA signaling pathway initiates plant stress response processes through the release and activation of SnRK2 under stress conditions such as drought, high salt, and low temperature. Meanwhile, the key root length regulatory gene OsELF3-1 was discovered in rice, and its function was validated through genetic analysis and positional cloning techniques. Further research has revealed the important role of OsELF3-1 and its interacting protein OsARID3 in regulating the growth and development of rice roots [27]. In addition, this study also delved into the latest research progress in the ABA signaling pathway, enhancing our understanding of the role of ABA in crop salt tolerance and other aspects. This series of important discoveries not only enhances our understanding of how plants cope with adverse environments and growth and development regulatory networks but also provides a valuable theoretical basis and germplasm resources for crop variety improvement and stress resistance enhancement. In revealing the mechanism of plants responding to environmental stress, it clarified the activation mechanism of SnRK2 and the role of the ABA signaling pathway under various stresses and found a key gene, OsELF3-1, regulating root length in rice. In addition, the mechanism by which lactate dehydrogenase OsLdh7 enhances the stress resistance of rice to cadmium was revealed. The positive effects of biochar and arbuscular mycorrhizal fungi on rice under cadmium stress were explored, providing a new perspective for the safe utilization of low-cadmium-polluted soil. These findings deepen our understanding of plant stress resistance mechanisms and provide a theoretical basis and practical guidance for crop improvement [28,29]. This revealed that ABA enhances plant resistance to stress such as drought and high salt by activating the SnRK2 protein family, highlighting the key role of the ABA signaling pathway in plant stress resistance [30,31,32,33]. At the same time, by exploring new components of the ABA signaling pathway in wheat guard cells, we focused on the ABA signaling pathway in wheat guard cells and successfully discovered and studied the new components and their functions in this pathway. This study is not only of great significance to a deeper understanding of the fine regulation of the ABA signaling pathway in the salt tolerance mechanism of wheat but also provides new ideas to improve crop salt tolerance through genetic improvements.
Wheat roots exposed to salinity stress will exhibit changes in the proteomic profile and gene expression of salinity tolerance genes as compared to control plants, and these changes will be associated with the accumulation of compatible solutes. The aim of this research was to understand the physio-biochemical responses of wheat seedlings under salinity stress to identify salt stress-responsive genes and the mechanism involved in salt stress tolerance in wheat seedlings in addition to developing a potential regulatory network of salt stress tolerance in wheat. This study hypothesized that activation of the ABA signaling pathway and up-regulation of stress-responsive genes would improve salt stress tolerance in wheat seedlings. These data will help to identify salt-responsive proteins that can be used in future breeding programs to develop salt-tolerant varieties.

2. Materials and Methods

2.1. Plant Materials and Stress Treatment

In the current study, the Triticum aestivum L., cv. Chinese 98 Spring bread wheat cultivar was planted in each plastic pot containing thoroughly washed sand, and it was then immediately treated to either salt stress or a control treatment. Thirty days of seeds were planted in plastic pots, each containing 10 seedlings. The experimental pots were placed in a greenhouse at 25 ± 1.5 °C during the day and 19 ± 1.5 °C at night, with 18–6 h of light/dark photoperiods. Ten pots were used for each treatment. Control pots were treated with a half-strength Hoagland nutrient solution, and stress treatment pots were treated with a half-strength Hoagland nutrient solution supplemented with 200 mM NaCl lasting six days. During treatment, the Hoagland nutrient solution provides essential nutrients for normal plant growth. The experimental design was a randomized complete block design.

2.2. Protein Extraction and Alkylation

Protein extraction and alkylation were conducted according to the following protocols:
  • A sample (0.4 g) of fresh leaves or roots was ground in liquid nitrogen using a pre-cooled mortar. For total protein extraction, 5 mL of a trichloroacetic acid/acetone solution containing 1 mM PMSF was added to the powdered tissue. Control treatments included three biological replicates, while stress treatments also had three biological replicates.
  • The extracted protein was incubated in the dark at −20 °C for three hours. After incubation, the protein pellet was obtained by centrifugation at 13,000× g for 30 min at 4 °C. The pellet was then washed with 1 mL of acetone and rinsed [27].
  • The pellet was finally resuspended in 1.5 mL of Buffer A, which contained 8 M urea, 4% CHAPS, 30 mM HEPES (pH 8.2), 2 mM Na2EDTA, 10 mM dithiothreitol (DTT), and 1 mM phenylmethylsulfonyl fluoride (PMSF) [27].
  • A total of 15.8 µL of 200 mM DTT was added to 0.3 mL of the supernatant from step 3 after centrifugation (13,000× g, 4 °C for 30 min). The protein samples were then incubated at 56 °C for 1 h and immediately treated with 35 µL of 1 M iodoacetamide (IAM). Subsequently, 1 mL of cold acetone was added to precipitate the proteins in the sample. The pellet from this step was finally resuspended in 700 µL of 50 mM NH4HCO3. Insoluble materials were removed, and the total protein concentration was measured using the Coomassie Brilliant Blue G250 method [28].

2.3. Protein Digestion and Peptide Purification

In total, 40 grams of protein were digested into peptides using 1 g of trypsin by incubating at 37 °C for 16 h. The digestate was then applied to C18 pipette tips (Product ID 87784; Thermo Fisher Scientific, Fresno, CA, USA) following the manufacturer’s instructions to purify the peptides. The purified peptides were subsequently analyzed using an LC-MS/MS system consisting of a nano-flow UHPLC system (Genstech Technology Co., Ltd., Shanghai, China, UPLC EASY-nLC 1200) and a Q-Exactive mass spectrometer (Thermo Scientific, Gilson, Berlin, Germany).

2.4. LC-MS/MS Analysis of the Purified Peptides

The peptides were put onto an Acclaim PepMapTM 100 column (C18, 100 m i.d. 2 cm, 5 m particle size, 100), then separated on an Acclaim PepMapTM RSLC column (C18, 50 m 15 cm, 2 m, 100), using a linear gradient of mobile phase A (0.1% formic acid) and mobile phase B (0.1% formic acid and 80% acetonitrile). The QExactive mass spectrometer completed complete MS scans in the m/z 350–2000 range at a resolution of 70,000. The maximum injection time allowed was 50 ms, and the AGC target value was set at 3 × 10⁶. With a normalized collision energy of 27, higher-energy collisional-induced dissociation was evaluated for fragmenting the 15 most prevalent precursor ions. The resolution of the MS/MS scan was 17,500, and the AGC target value was 1 × 10⁵. MSMS data were produced by the Xcalibur program (version 2.1; Thermo Scientific, Xcalibur, Arlington, VI, USA).

2.5. Label-Free Quantification Analysis

The MS-MS data were exposed to label-free proteomics analysis (Thermo Scientific, USA) according to the manufacturer’s protocol. Protein searching and label-free quantification were performed on Proteome Discoverer software 2.2 (Thermo Scientific, USA) against the wheat reference genome (iwgsc_refseqv1.0). The proteins were identified using unique peptides with a false detection rate (FDR) < 0.05. To minimize the effects of sample preparation processes on the quantification, peptide amounts for each protein were normalized to the total peptide amount of all the proteins in the sample. We quantified the protein content using the normalized abundances of the peptides, and differentially accumulated proteins (DAPs) under sodic alkaline and control conditions were discovered based on significance using the t-test. Differentially abundant proteins (DAPs) were defined as those exhibiting a fold change greater than 2 and a p-value less than 0.01 between stress and control conditions.

2.6. Biochemical Analysis

Root samples were freeze-dried for biochemical analysis. The contents of free carbohydrates, free amino acids, and ions were determined using methods described by Xiao et al. [29] and Bremberger and Lüttge [30]. Additionally, plant hormones from 0.1 g of fresh samples were extracted using 100 µL of methanol at 4 °C, while raw sample proteins were precipitated with 300 µL of methanol. For the analysis of plant hormones, the samples were loaded onto an LC-MS/MS system equipped with an MS Lab C18 column (5 µm particle size, 150 × 4.6 mm). A linear gradient was applied, consisting of mobile phase A (0.2% ammonium acetate in methanol) and mobile phase B (0.2% ammonium acetate in water), with the following gradient: 70:30, 70:30, 95:5, 95:5, 70:30, and 70:30. The mass spectrometry parameters for calculating plant hormones using the MRM scan mode were as follows: CUR: 10 psi, CAD: 5 Medium, IS: 4500 V, TEM: 450 °C, CXP: 2, EP: 10, and GS1: 50 psi.

2.7. qRT-PCR

Five plants were pooled as replicates, with three biological replicates per group. RNA samples from the roots were isolated using TRIzol [29]. Total RNA samples were treated with DNase I (Invitrogen, Shanghai Co., Ltd., Shanghai, China) and then reverse-transcribed using SuperScript™ RNase H Reverse Transcriptase (Invitrogen). The resulting cDNA was subjected to real-time PCR analysis using gene-specific primers (shown in the Section 3) and SYBR Green [29]. The amplification of the Actin gene and RLI gene was used to normalize the expression levels of target genes, with primer sequences detailed in reference [31]. Gene expression values were calculated using the △△Ct method [32]. Statistical analysis of qRT-PCR data was performed using SPSS 16.0 (IBM, Armonk, NY, USA).

2.8. Statistical Analysis

In this study, a randomized complete block design was used. SPSS version 16.0 (SPSS, Chicago, IL, USA) was used to undertake statistical analysis of biochemical data and gene expression. The t-test was used to assess the statistical significance of gene expression and biochemical data at the 0.05 level. The ANOVA (background-based) method was used for label-free quantification to perform statistical analyses using Proteome Discoverer version 2.2 (adjusted p-value 0.05).

3. Results

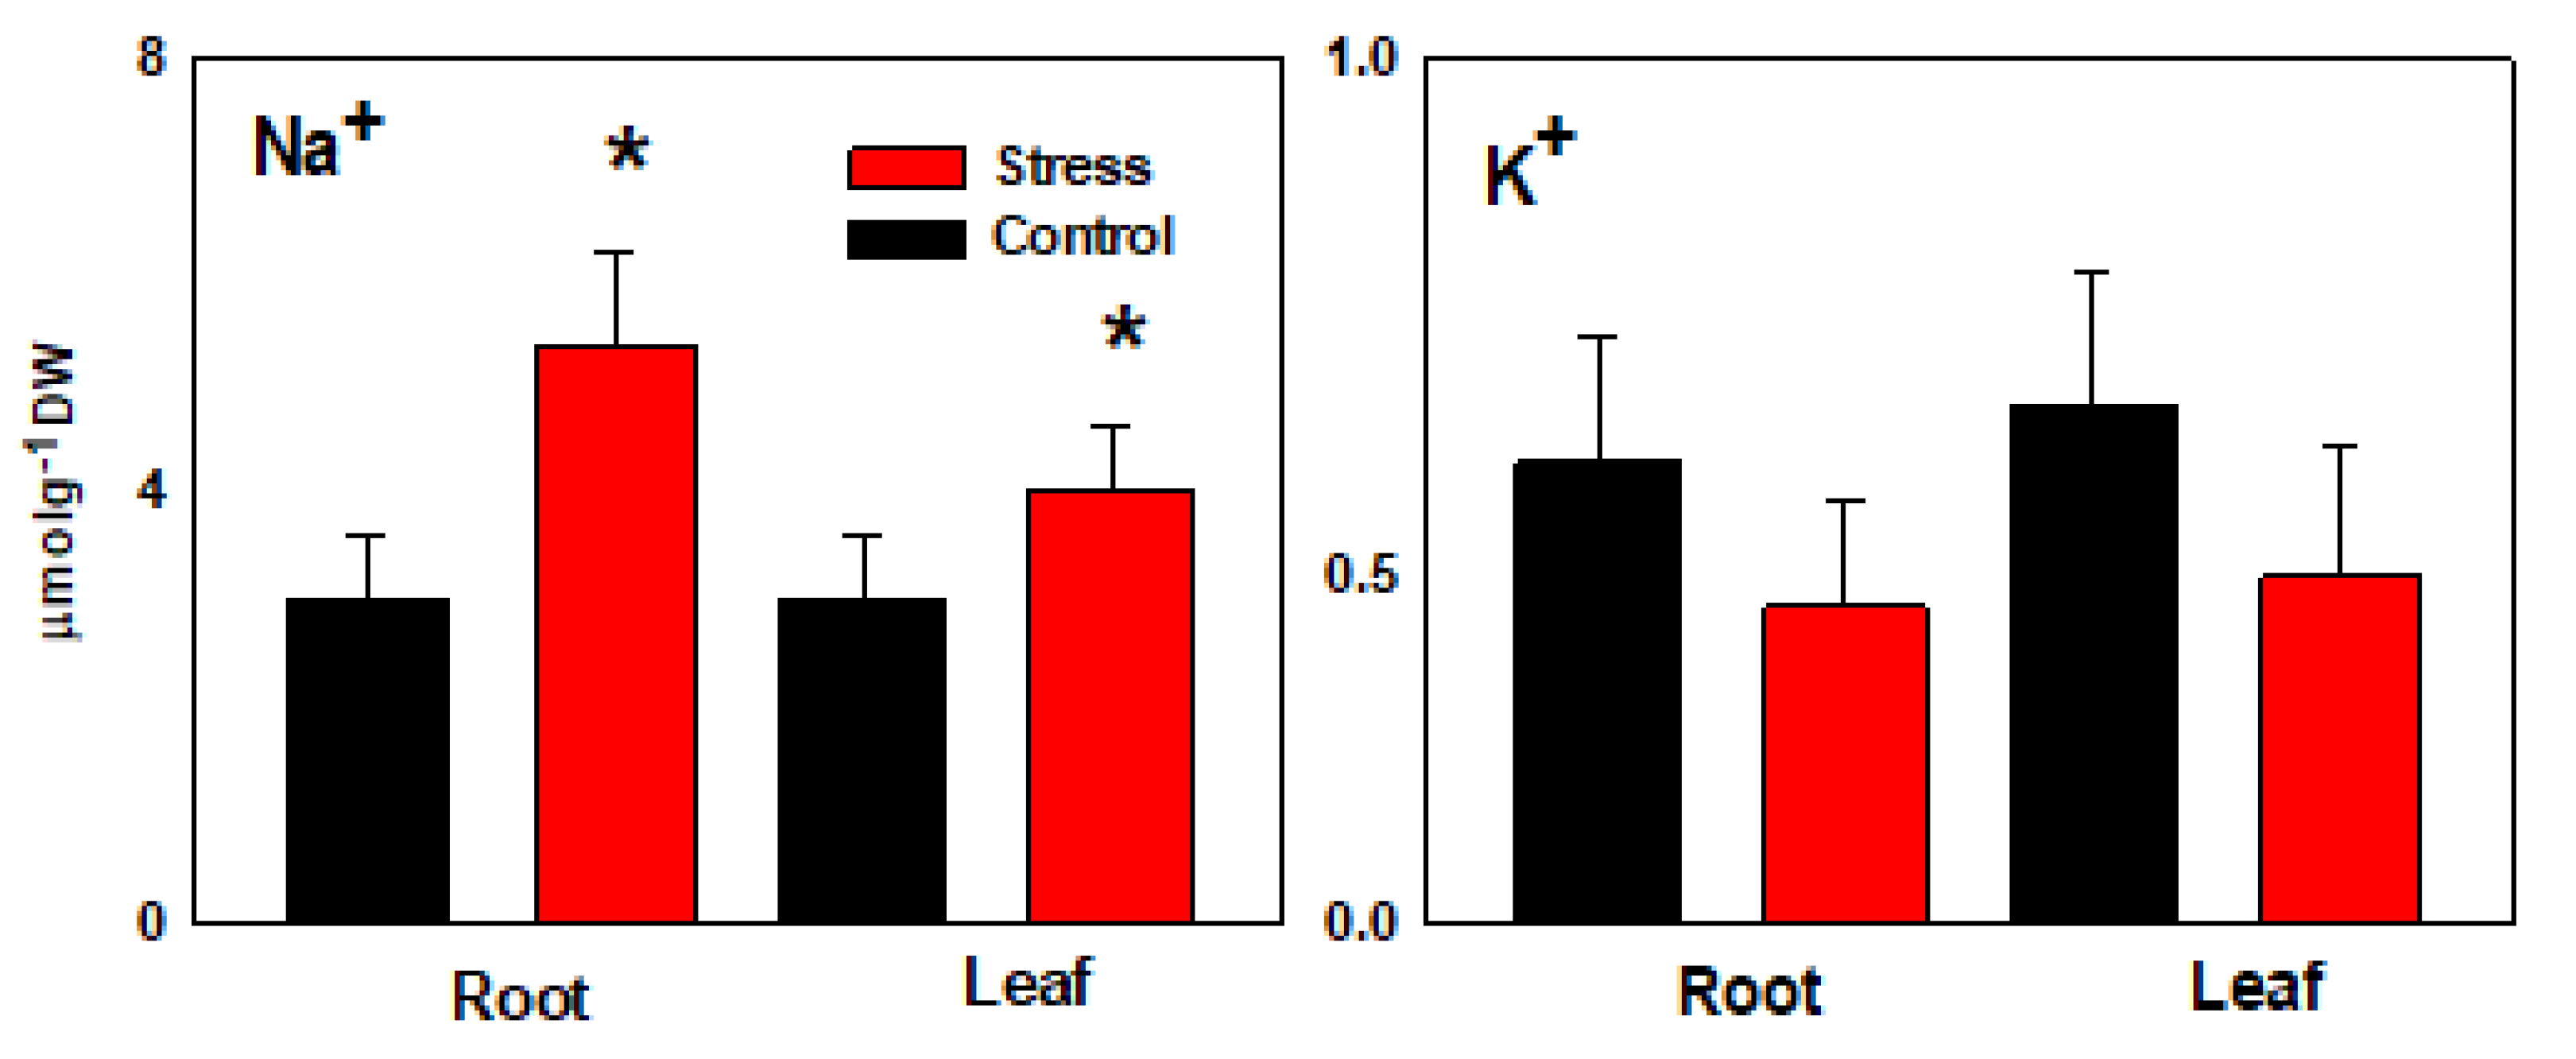
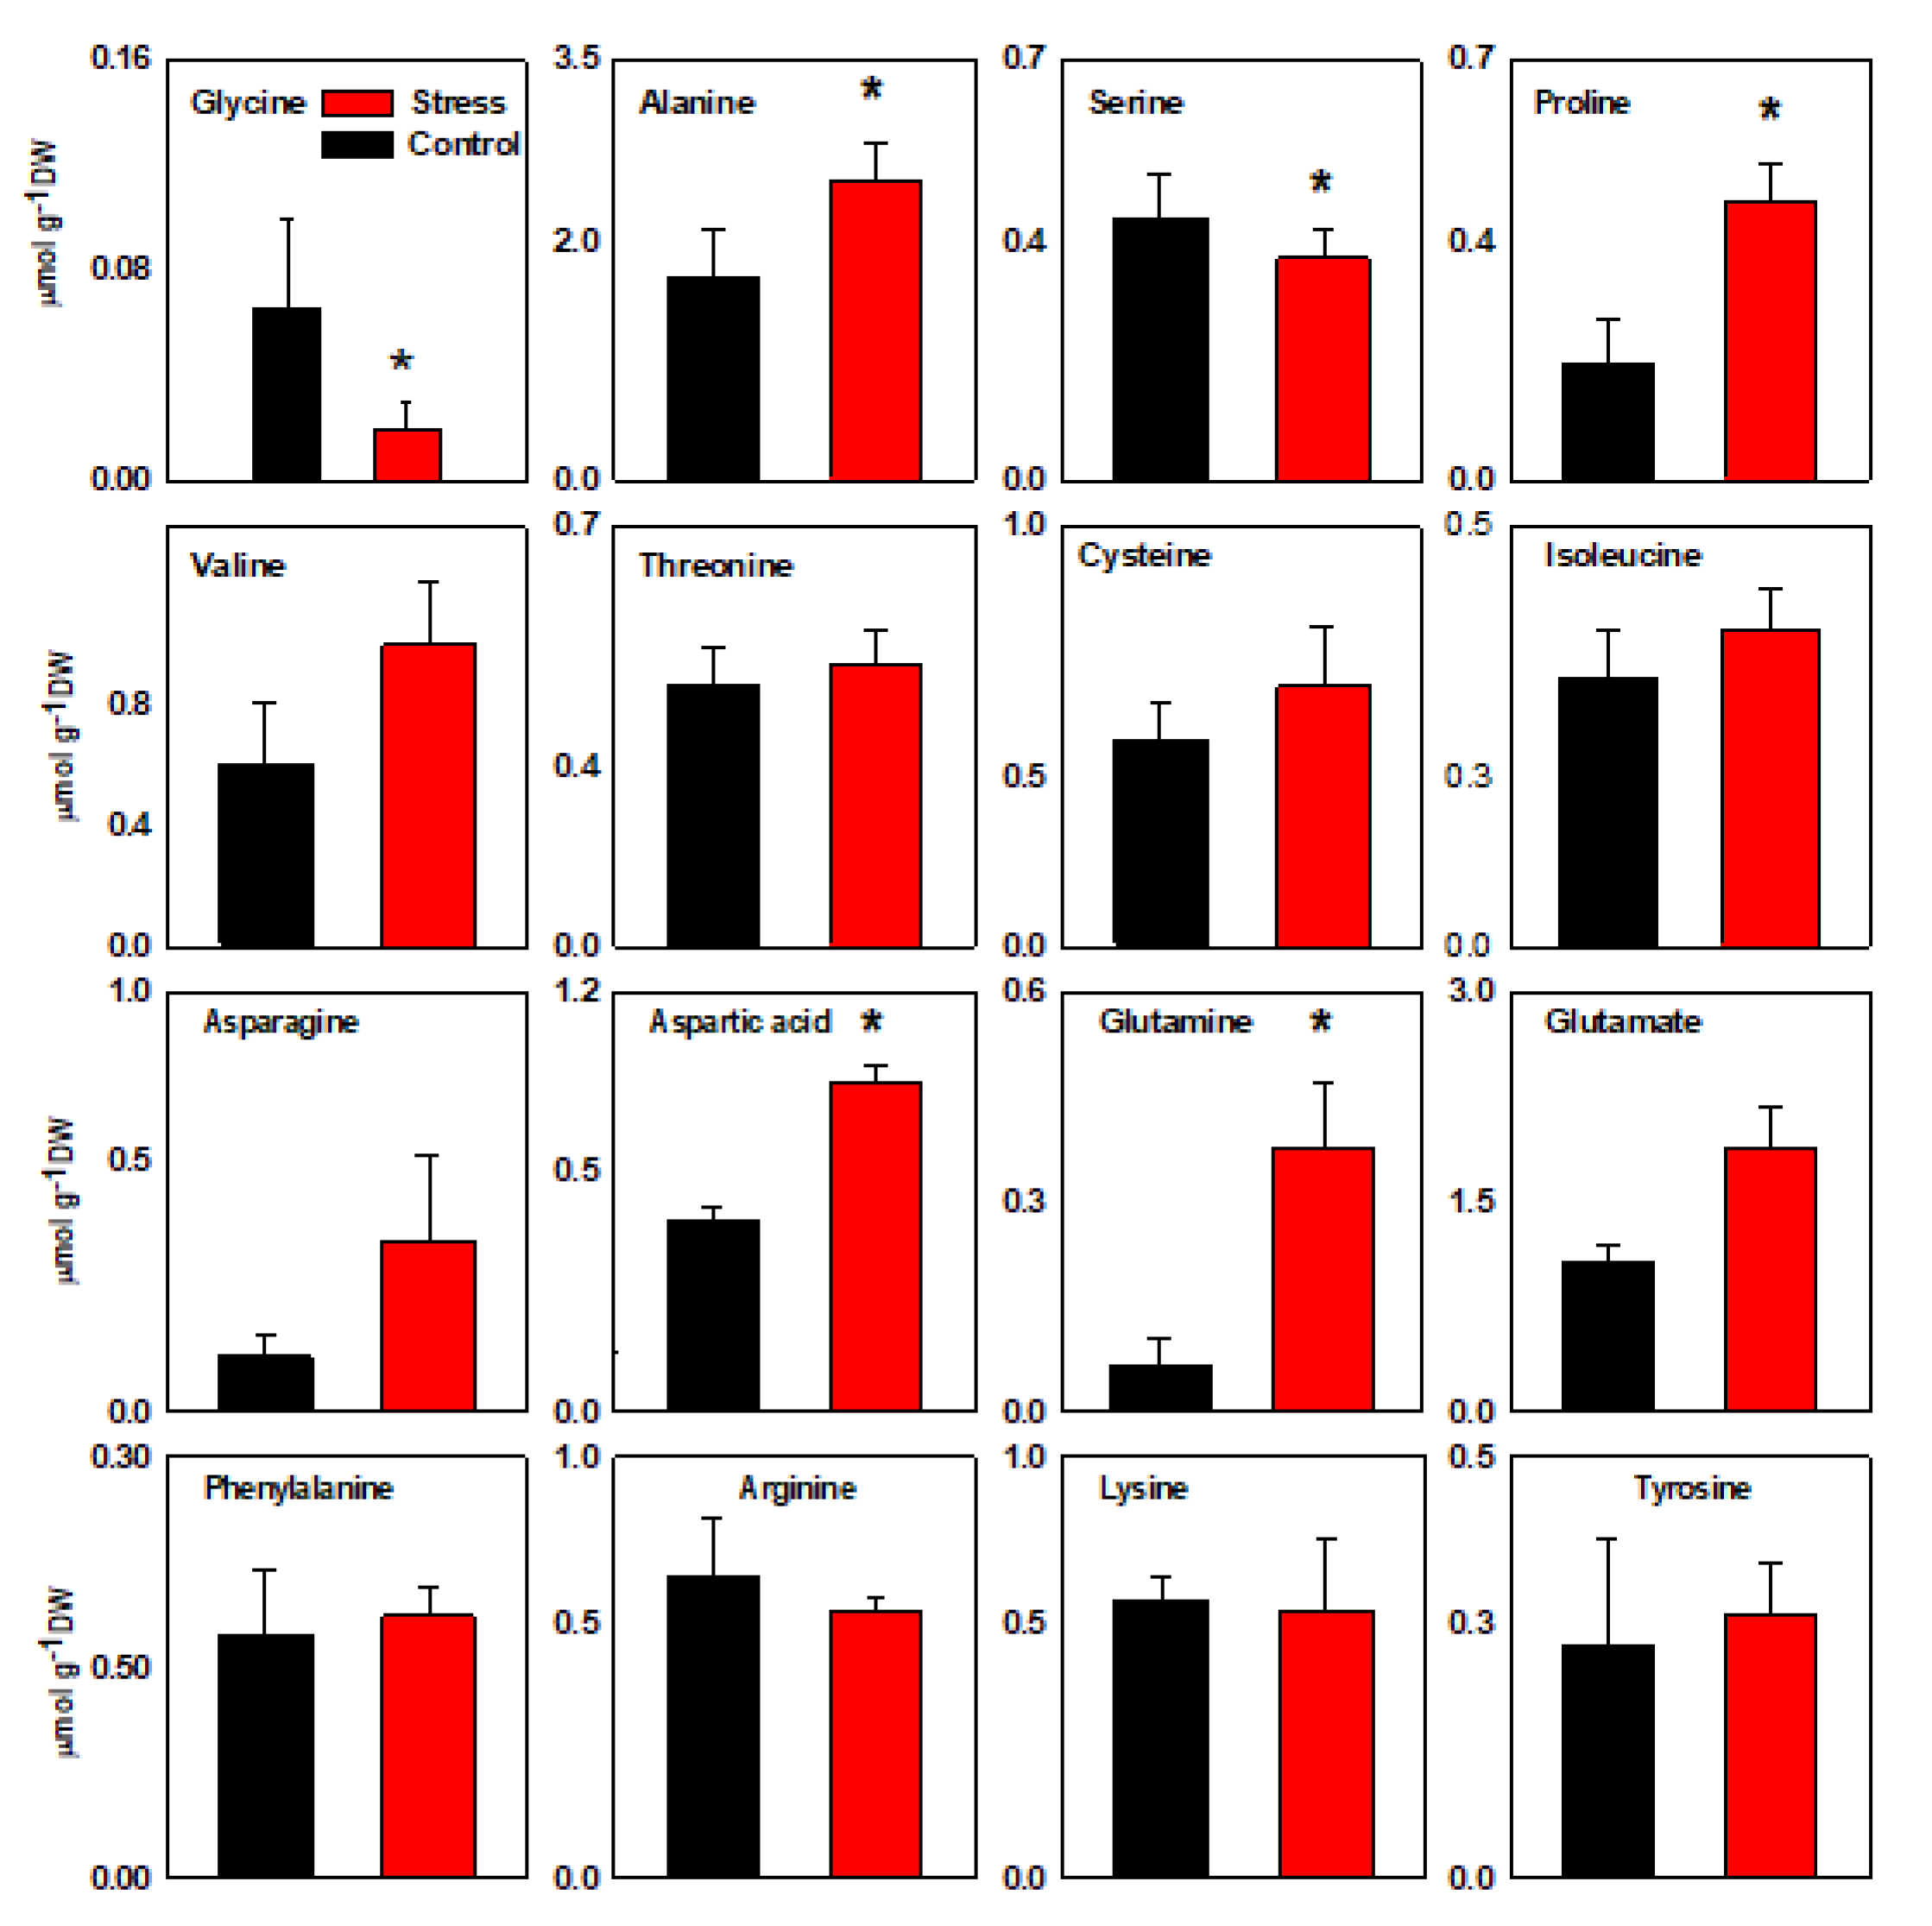
3.1. Ion and Organic Solutes

Salinity stress enhanced Na+ concentration in both the root and leaf of the wheat plant (Figure 1) but had no effect on K+ concentration in both root and leaf tissues (Figure 1). Only roots were examined for organic solutes. Salinity stress only affected the accumulation of lactose in carbohydrates but did not affect the accumulation of any other carbohydrates. The accumulation of lactose in wheat roots was significantly reduced by salt stress (Figure 2). Salt stress enhanced the concentrations of only alanine, proline, aspartic acid, and glutamine while decreasing the concentration of glycine and serine; the other amino acids showed no significant changes (Figure 3).

3.2. Root Phytohormone

The LC-MS technique was used to investigate the phytohormone of hexaploid wheat roots under salinity in the present work. The concentrations of gibberellin A1 (GA1), gibberellin A3 (GA3), jasmonic acid (JA), salicylic acid (SA), abscisic acid (ABA), in-dole-3-acetic acid (IAA), dihydrozeatin, and trans-zeatin were examined in roots. The concentrations of four plant hormones, including ABA, JA, SA, and GA1, changed significantly in the roots of hexaploid wheat after stress treatment (Table 1).
The most important stress-responsive hormone that mediates plant responses to salinity stress is ABA, which increased its concentration by 2.2959-fold when exposed to salt. A concentration increase of 4.1522 times was recorded in GA1, 1.5693 times in SA, and 1.7754 times in JA. GA3, IAA, dihydrozeatin, and trans-zeatin were found to have similar levels of control and stress treatment (Table 1). Furthermore, increased JA, SA, and GA1 accumulation may play essential roles in the response of wheat roots to salinity stress, which should be investigated further in the future.

3.3. Gene Expression Analysis Involved in Salinity Tolerance and Carbohydrate Metabolism

The gene expression response of wheat roots to salt stress was examined in the pre-study. Gene expression related to salt tolerance and carbohydrate metabolism was investigated. The results showed that salinity stress in wheat roots triggered up- or down-regulation of several genes. There were four genes that were down-regulated in relation to salinity tolerance among these differentially expressed genes: protein phosphatase 2C (TraesCS3B01G266200), dehydrin (TraesCS6A01G350700), HAK1 (TraesCS2A01G289300), and dehydrin (TraesCS7A01G560000). The genes that were up-regulated include V-H+ATPase-b2 (TraesCS3D01G250900), HKT1;5 (TraesCS4D01G361300.1), potassium transporter (TraesCS3A01G446600), glutathione S-transferase (TraesCS7B01G370000), ABA-responsive element binding factor (ABF) gene (TraesCS3B01G411300), and dehydrin gene (TraesCS5B01G426800), which are shown in Table 2. The expression of 29 genes related to carbohydrate metabolism was also assessed. The salinity stress of wheat roots up-regulated six carbohydrate metabolism genes, Ta6-SFT1 (ID: 251085), Ta1-SST2 (ID: 264622), TaSPSVI (ID: 253235), TaSAInv2 (ID: 237453), TaSuS11 (ID: 248447), and TaSuS3 (ID: 247088), while only TaFK4a (249158) expression was down-regulated (Table 3).

3.4. Proteomic Profiling

A label-free proteomics analysis was performed using the Q-Exactive LC-MS/MS platform. Using Proteome Discoverer software 2.2, we calculated the protein content based on the standardized abundances of the peptides. Under stress and control conditions, differentially accumulated proteins (DAPs) were detected using a statistical technique called background-based ANOVA. Between the stress and control conditions, a DAP was defined as a fold change > 2 and an adjusted p-value < 0.05. We detected 3826 proteins in which 207 DAPs were observed, including 189 up-regulated proteins and 18 down-regulated proteins. Of the 207 DAPs, many of these proteins were involved in salinity tolerance (Table 4). These included ascorbate, citrate synthase, glutathione S-transferase, dehydrin, peroxidase, potassium channel beta subunit, V-type H+-ATPase, superoxide dismutases [Cu-Zn] [Cu-Zn] (SODs), seven glutathione S-transferase (GST) proteins, five V-ATPases, six heat shock proteins (HSPs), three ascorbate, eight dehydrin (DHN) proteins, and six citrate synthases. Salinity stress increased the abundance of several salinity-responsive proteins, including heat shock protein, glutathione S-transferase, dehydrins, peroxidase, potassium channel beta subunit, heat shock factor-binding protein 1, V-type proton ATPase subunit G, superoxide dismutase (Cu-Zn), V-type proton ATPase subunit E, 14-3-3 protein, thioredoxin, malate dehydrogenase, cold shock protein, plasma membrane-associated cation-binding protein 1, and Hsp70-Hsp90 organizing protein 1 (Table 5).

4. Discussion

Plants utilize a variety of traits and mechanisms to defend themselves against the harmful effects of salts in saline soils. The principal mechanisms are osmotic adjustment, detoxification of reactive oxygen species (ROS), and tissue tolerance. In order to reveal a response of hexaploid wheat towards salinity stress, biochemical, proteomic, and gene expression analysis was carried out. Low Na+ and high K+ concentrations in the cytoplasm are required to balance the osmotic pressure for essential enzyme function in higher plants [33]. In the present work, salinity stress remarkably increased sodium levels in the roots of wheat (Figure 1), which is consistent with the results of Widodo et al. [34]. Several researchers reported similar effects of salinity on ion accumulation in wheat plants [35,36]. Our results showed that, under LSS, the concentrations of free carbohydrate accumulation have been shown to improve plant salinity tolerance and are also required to maintain cell wall synthesis during salt stress [19]. Previous studies showed that free carbohydrates (glucose, fructose, fructans, and trehalose) can protect plants from oxidative injury and maintain the structure of proteins and membrane systems under salt stress [37]. The sucrose content of various rice genotypes increased under salinity stress [38]. In the current study, salt stress only affected the accumulation of lactose in wheat roots but not the accumulation of any other carbohydrates (Figure 2); taken together, amino acids and carbohydrates had similar contributions to increasing the osmotic potential of the root’s cytoplasm, whereas amino acids played more important roles in the osmotic adjustment of the root cytoplasm than did carbohydrates under salinity stress. As a result, salinity stress had no effect on the expression of most genes involved in carbohydrate metabolism in wheat roots (Table 3). Amino acids are essential for protein synthesis and serve as precursors for various metabolites involved in salinity tolerance [39]. In this study, salt treatment increased the levels of several free amino acids in wheat roots, including glutamine, aspartic acid, proline, and alanine. Our findings suggested that salinity stress could increase the contents of amino acids in the plant body to withstand salt stress. Furthermore, these amino acids may accumulate in the cytoplasm to counteract osmotic stress caused by Na+ in the vacuole, as various researchers have stated that proline accumulation contributes significantly to osmotic adjustment [40,41,42].
Furthermore, Na+ in cytoplasm is transported to the vacuole via Na+/H+ antiporter (NHX) [43]. V-ATPase is the dominant H+ pump that provides the driving force for the Na+/H+ antiporter [42]. In the present study, the V-H+ATPase-b2 gene (TraesCS3D01G250900) was up-regulated in the roots of hexaploid wheat under NaCl treatment (Table 2). A stronger proton gradient for NHX will be provided by higher V-H+ATPase gene expression, which will benefit Na+ compartmentalization in the wheat root vacuole. Our data are consistent with previous studies of Silva et al. [44] and Colombo et al. [43]. In addition, another important salinity tolerance gene, glutathione S-transferase (TraesCS7B01G370000), was also up-regulated according to our study (Table 2). Our findings suggest that this GST gene protects wheat root cells from oxidative damage when they are exposed to salinity.
In the present work, under salinity stress, ABA levels in hexaploid wheat roots were increased (Table 1). ABA is a plant hormone that controls plant responses to a variety of environmental stressors [44]. ABA accumulation may be controlled by several processes, including ABA synthesis, ABA catabolism, and ABA transport within plant tissues [45]. ABA signaling pathway is well described in plants [46]. The PP2C protein suppresses the expression of downstream ABA pathway genes like the ABF gene [46]. In the present study, ABA concentration was enhanced under salinity stress in wheat roots. Accordingly, the ABF gene (a critical component for the ABA signaling pathway) was up-regulated by salinity stress, and the PP2C gene (a suppressor of the ABA signaling pathway) was down-regulated in wheat roots. Our findings revealed that salt stress stimulated the ABA signaling system in wheat roots by down-regulating the suppressor of the ABA signaling system and up-regulating the positive regulator of the ABA signaling system, resulting in an ABA-mediated salinity response downstream. Furthermore, the dehydrin gene is an important downstream gene of the ABA signaling system, as the promoter region of the dehydrin gene includes the ARBE element (ABA-responsive CIS element) [47]. Under salinity stress, ABA regulates the expression of the dehydrin gene. In the current study, salt stress up-regulated the expression of the dehydrin gene, which could be regulated by ABA signaling (Table 2). Our research revealed the response of the ABA signaling pathway to salinity stress in wheat roots, providing new insight into crop plant salinity tolerance. Abiotic and biotic stresses can trigger ROS generation related to stomata movement. Under salinity stress, the ROS accumulation was increased while up-regulated APX, GST, and thioredoxins scavenged ROS production (Table 2). And the ABA pathway can regulate the stoma closure to improve the resistance to stress [48]. Stoma closure can decrease water loss to keep the osmotic balance [49]. Furthermore, we found that salt stress induced the synthesis of gibberellic acid (GA) in wheat roots (Table 1). It is unclear whether GA plays a role in the salinity tolerance of wheat root, which should be investigated in the future.
Furthermore, high salinity stress seriously affects both physiological and biochemical processes, including ionic and osmotic homeostasis, protein metabolism, and pigment production in plants, which leads to cellular toxicity and growth limitation [50]. Under salt stress, an excess of Na+ will disrupt ionic thermodynamic equilibrium, resulting in ionic imbalance and toxicity [49]. Under NaCl stress, a subunit of V-ATPase was induced in the current study (Table 5), suggesting that the salt-induced V-ATPase was required to energize the tonoplast for Na+ into the vacuoles Furthermore, we found that the 14-3-3 protein, which is involved in Na+ compartmentalization, was up-regulated in wheat root (Table 5). In salinity stress, the salt overly sensitive (SOS) pathway regulates Na+ compartmentation and excretion in higher plants. The SOS pathway (SOS1) was compensated by SOS2 (protein kinase), SOS3 (a calcium-binding protein), NHX (a vacuolar Na+/H+ antiporter), and a plasma membrane Na+/H+ antiporter. In Na+ excretion, NHX mediates SOS1 functions and Na+ compartmentation. SOS1 and NHX proteins are phosphorylated by the SOS2-SOS3 complex, which activates them. In the Arabidopsis plant, the SOS pathway was controlled by the 14-3-3 protein by binding with Ca2+ [29]. The 14-3-3 protein was significantly up-regulated in wheat roots under salinity stress in wheat plants (Table 5). The SOS pathway promoted Na+ compartmentation in the vacuole of roots due to the abundance of the 14-3-3 protein. LEA and dehydrin proteins are hydrophilic proteins with tandem hydrophilic amino acids (highly hydrophilic structure) that are considered to prevent cytosol dehydration and protein aggregation in the presence of salinity or drought [29]. Formatting intracellular glasses, which can limit the movement of Na+ and Cl in the cytoplasm to mitigate their toxicity, is another key function of dehydrin proteins [29].
The abundance of two dehydrin proteins was enhanced in wheat root in this study (Table 5). Under salinity stress, up-regulated dehydrin proteins may function in the prevention of cytosol dehydration and protein aggregation, as well as limit the movement of Na+ and Cl into the cytoplasm. In addition, salinity stress induces (ROS) reactive oxygen species accumulation in plant tissue, including singlet oxygen, superoxide radical, and hydroxyl radical, and these ROSs also act as secondary messengers in the signal transduction pathway [50]. During wheat acclimation to salinity stress, many antioxidant proteins were up-regulated, including one ascorbate peroxidase (APX), one glutathione-S-transferase (GST), and three thioredoxins (Table 4 and Table 5). APX is an essential antioxidant enzyme that detoxifies H2O2 directly by oxidizing specific substrates like ascorbate [51]. GST enzyme was found to be responsive to cold, heat, and salinity stress in a variety of plant species [51]. GST was found to be significantly up-regulated in our present study, showing that it is involved in salinity-stress tolerance and plant protection from oxidative damage (Table 4 and Table 5). Similar to our protein expression results, a GST gene (TraesCS7B01G370000) was also up-regulated by salinity stress in wheat roots. Our results are consistent with the findings of Gunes et al. [51,52]. A schematic diagram indicates the potential mechanism of salinity stress tolerance in wheat root (Figure 4).

5. Conclusions

Wheat roots respond to salinity stress more effectively to amino acids than carbohydrates to adjust osmotic stress. Salinity stress induced the ABA signaling system, which in turn activated the downstream ABA-mediated salinity response by down-regulating the suppressor of the ABA signaling system and up-regulating the positive regulator in the root. Moreover, up-regulation of ascorbate peroxidase (APX), glutathione-S-transferase (GST), and thioredoxins scavenged reactive oxygen species and resulted in improved plant growth under salt stress. Several salinity response proteins, including V-H+-ATPase and the 14-3-3 protein, were identified by label-free proteomic quantification. In summary, this study proposes some candidate salt-tolerance proteins, as well as carries out a molecular dissection of the crucial physiological response of wheat plants to salt stress.

Author Contributions

Z.Z.: investigation, data curation, software, writing—original draft; A.K. (Aziz Khan): methodology, data curation, formal analysis, writing—original draft; A.K. (Adnan Khan): methodology, software, formal analysis, writing—original draft; Z.T.: data analysis, investigation; S.Z.: visualization, software; Q.L.: formal analysis, validation; J.L.: supervision, conceptualization, project administration; S.L.: writing—review and editing. All authors have read and agreed to the published version of the manuscript.

Funding

Joint Open or System Fund Project of the Key Laboratory of Environmental Evolution and Resource Utilization of the Beibu Gulf, Ministry of Education, entitled “Health Assessment Study on Urban Planning in River Basin Centers”, Project No. NNNu-KLOP-K2106.

Data Availability Statement

This paper contains all the data.

Conflicts of Interest

Author Qiteng Long was employed by the company Guangxi Guiyu as an engineering consultant in Nanning. The remaining authors declare that the research was conducted in the absence of any commercial or financial relationships that could be construed as a potential conflict of interest.

References

  1. Shewry, P.R.; Hey, S.J. The contribution of wheat to human diet and health. Food Energy Secur. 2015, 4, 178–202. [Google Scholar] [CrossRef]
  2. Dubcovsky, J.; Dvorak, J. Genome plasticity a key factor in the success of polyploid wheat under domestication. Science 2007, 316, 1862–1866. [Google Scholar] [CrossRef] [PubMed]
  3. Munns, R.; Tester, M. Mechanisms of salinity tolerance. Annu. Rev. Plant Biol. 2008, 59, 651. [Google Scholar] [CrossRef] [PubMed]
  4. Yang, C.; Yang, Z.; Zhao, L.; Sun, F.; Liu, B. A newly formed hexaploid wheat exhibits immediate higher tolerance to nitrogen-deficiency than its parental lines. BMC Plant Biol. 2018, 18, 113. [Google Scholar] [CrossRef]
  5. Wu, D.; Cai, S.; Chen, M.; Ye, L.; Chen, Z.; Zhang, H.; Dai, F.; Wu, F.; Zhang, G. Tissue metabolic responses to salt stress in wild and cultivated barley. PLoS ONE 2013, 8, e55431. [Google Scholar] [CrossRef]
  6. Kosová, K.; Prášil, I.T.; Vítámvás, P. Protein contribution to plant salinity response and tolerance acquisition. Int. J. Mol. Sci. 2013, 14, 6757–6789. [Google Scholar]
  7. Pitman, M.G.; Läuchli, A. Global impact of salinity and agricultural ecosystems. In Salinity: Environment-Plants-Molecules; Springer: Berlin/Heidelberg, Germany, 2002; pp. 3–20. [Google Scholar]
  8. Jamil, A.; Riaz, S.; Ashraf, M.; Foolad, M. Gene expression profiling of plants under salt stress. Crit. Rev. Plant Sci. 2011, 30, 435–458. [Google Scholar] [CrossRef]
  9. Yang, J.; Cao, Y.; Yang, Z.; Zhang, W.; Sun, L.; Lu, C. Morphological, physiological and biochemical responses of biofuel plant Euphorbia lathyris to salt stress. Acta Agric. Scand. Sect. B–Soil Plant Sci. 2013, 63, 330–340. [Google Scholar]
  10. Foster, T.; Brozović, N.; Butler, A.; Neale, C.; Raes, D.; Steduto, P.; Fereres, E.; Hsiao, T.C. AquaCrop-OS: An open source version of FAO’s crop water productivity model. Agric. Water Manag. 2017, 181, 18–22. [Google Scholar] [CrossRef]
  11. Rahnama, A.; James, R.A.; Poustini, K.; Munns, R. Stomatal conductance as a screen for osmotic stress tolerance in durum wheat growing in saline soil. Funct. Plant Biol. 2010, 37, 255–263. [Google Scholar] [CrossRef]
  12. James, R.A.; Blake, C.; Byrt, C.S.; Munns, R. Major genes for Na+ exclusion, Nax1 and Nax2 (wheat HKT1; 4 and HKT1; 5), decrease Na+ accumulation in bread wheat leaves under saline and waterlogged conditions. J. Exp. Bot. 2011, 62, 2939–2947. [Google Scholar] [CrossRef] [PubMed]
  13. Munns, R. Genes and salt tolerance: Bringing them together. New Phytol. 2005, 167, 645–663. [Google Scholar] [CrossRef] [PubMed]
  14. Khan, A.A.; Rao, S.A.; McNeilly, T. Assessment of salinity tolerance based upon seedling root growth response functions in maize (Zea mays L.). Euphytica 2003, 131, 81–89. [Google Scholar] [CrossRef]
  15. Munns, R.; Gilliham, M. Salinity tolerance of crops—What is the cost? New Phytol. 2015, 208, 668–673. [Google Scholar] [CrossRef]
  16. Dubcovsky, J.; María, G.S.; Epstein, E.; Luo, M.-C.; Dvořák, J. Mapping of the K+/Na+ discrimination locus Kna1 in wheat. Theor. Appl. Genet. 1996, 92, 448–454. [Google Scholar] [CrossRef]
  17. Munns, R.; James, R.A.; Läuchli, A. Approaches to increasing the salt tolerance of wheat and other cereals. J. Exp. Bot. 2006, 57, 1025–1043. [Google Scholar] [CrossRef] [PubMed]
  18. Baghbani, A.; Namdari, A.; Kadkhodaie, A. Effect of salinity and nitrogen supply on nitrogen fixation nodules and nitrogen, sodium and potassium concentration of alfalfa cultivars. J. Basic Appl. Sci. Res. 2012, 2, 9978–9984. [Google Scholar]
  19. Kafi, M.; Stewart, W.; Borland, A. Carbohydrate and proline contents in leaves, roots, and apices of salt-tolerant and salt-sensitive wheat cultivars1. Russ. J. Plant Physiol. 2003, 50, 155–162. [Google Scholar] [CrossRef]
  20. Zhu, J.-K. Regulation of ion homeostasis under salt stress. Curr. Opin. Plant Biol. 2003, 6, 441–445. [Google Scholar] [CrossRef]
  21. Greenway, H.; Munns, R. Mechanisms of salt tolerance in nonhalophytes. Annu. Rev. Plant Physiol. 1980, 31, 149–190. [Google Scholar] [CrossRef]
  22. Jacoby, R.P.; Millar, A.H.; Taylor, N.L. Wheat mitochondrial proteomes provide new links between antioxidant defense and plant salinity tolerance. J. Proteome Res. 2010, 9, 6595–6604. [Google Scholar] [CrossRef] [PubMed]
  23. Sobhanian, H.; Razavizadeh, R.; Nanjo, Y.; Ehsanpour, A.A.; Jazii, F.R.; Motamed, N.; Komatsu, S. Proteome analysis of soybean leaves, hypocotyls and roots under salt stress. Proteome Sci. 2010, 8, 19. [Google Scholar] [CrossRef] [PubMed]
  24. Zörb, C.; Schmitt, S.; Mühling, K.H. Proteomic changes in maize roots after short-term adjustment to saline growth conditions. Proteomics 2010, 10, 4441–4449. [Google Scholar] [CrossRef] [PubMed]
  25. Yin, Y.; Yang, R.; Han, Y.; Gu, Z. Comparative proteomic and physiological analyses reveal the protective effect of exogenous calcium on the germinating soybean response to salt stress. J. Proteom. 2015, 113, 110–126. [Google Scholar] [CrossRef] [PubMed]
  26. Parker, R.; Flowers, T.J.; Moore, A.L.; Harpham, N.V. An accurate and reproducible method for proteome profiling of the effects of salt stress in the rice leaf lamina. J. Exp. Bot. 2006, 57, 1109–1118. [Google Scholar] [CrossRef] [PubMed]
  27. Chatterjee, Y.; Pareek, A.; Pareek, S.L.S. OsLdh7, a rice lactate dehydrogenase, confers stress resilience in rice under cadmium stress through NAD+/NADH regulation. Plant Physiol. Biochem. 2024, 215, 109009. [Google Scholar] [CrossRef]
  28. Sun, W.; Xiang, X.; Zhai, L.; Zhang, D.; Cao, Z.; Liu, L.; Zhang, Z. AGO_18b negatively regulates determinacy of spikelet meristems on the tassel central spike in maize. J. Integr. Plant Biol. 2018, 60, 65–78. [Google Scholar] [CrossRef]
  29. Zhao, T.; Wang, L.; Yang, J. Synergistic effects of combined application of biochar and arbuscular mycorrhizal fungi on the safe production of rice in cadmium contaminated soil. Sci. Total Environ. 2024, 951, 175499. [Google Scholar] [CrossRef]
  30. Baoxiang, W.; Yan, L.; Yifeng, W.; Jingfang, L.; Zhiguang, S.; Ming, C.; Yungao, X.; Bo, X.; Bo, Y.; Jian, L.; et al. OsbZIP72 Is Involved in Transcriptional Gene-Regulation Pathway of Abscisic Acid Signal Transduction by Activating Rice High-Affinity Potassium Transporter OsHKT1;1. Rice Sci. 2021, 28, 257–267. [Google Scholar] [CrossRef]
  31. Aslam, M.M.; Rashid, M.A.R.; Siddiqui, M.A.; Khan, M.T.; Farhat, F.; Yasmeen, S.; Khan, I.A.; Raja, S.; Rasool, F.; Sial, M.A.; et al. Recent Insights into Signaling Responses to Cope Drought Stress in Rice. Rice Sci. 2022, 29, 105–117. [Google Scholar] [CrossRef]
  32. Kartika, K.; Sakagami, J.-I.; Lakitan, B.; Yabuta, S.; Wijaya, A.; Kadir, S.; Widuri, L.I.; Siaga, E.; Nakao, Y. Morpho-Physiological Response of Oryza glaberrima to Gradual Soil Drying. Rice Sci. 2020, 27, 67–74. [Google Scholar] [CrossRef]
  33. Ahmed, S.; Rashid, M.A.R.; Zafar, S.A.; Azhar, M.T.; Waqas, M.; Uzair, M.; Rana, I.A.; Azeem, F.; Chung, G.; Ali, Z.; et al. Genome-wide investigation and expression analysis of APETALA-2 transcription factor subfamily reveals its evolution, expansion and regulatory role in abiotic stress responses in Indica Rice (Oryza sativa L. ssp. indica). Genomics 2021, 113, 1029–1043. [Google Scholar] [CrossRef] [PubMed]
  34. Han, L.; Xiao, C.; Xiao, B.; Wang, M.; Liu, J.; Bhanbhro, N.; Khan, A.; Wang, H.; Wang, H.; Yang, C. Proteomic profiling sheds light on alkali tolerance of common wheat (Triticum Aestivum L.). Plant Physiol. Biochem. 2019, 138, 58–64. [Google Scholar] [CrossRef]
  35. Bradford, M.M. A rapid and sensitive method for the quantitation of microgram quantities of protein utilizing the principle of protein-dye binding. Anal. Biochem. 1976, 72, 248–254. [Google Scholar] [CrossRef]
  36. Xiao, C.; Cui, X.; Lu, H.; Han, L.; Liu, S.; Zheng, Y.; Wang, H.; Wang, H.; Yang, C. Comparative adaptive strategies of old and young leaves to alkali-stress in hexaploid wheat. Environ. Exp. Bot. 2020, 171, 103955. [Google Scholar] [CrossRef]
  37. Bremberger, C.; Lüttge, U. Dynamics of tonoplast proton pumps and other tonoplast proteins of Mesembryanthemum crystallinum L. during the induction of Crassulacean acid metabolism. Planta 1992, 188, 575–580. [Google Scholar] [CrossRef] [PubMed]
  38. Giménez, M.J.; Pistón, F.; Atienza, S.G. Identification of suitable reference genes for normalization of qPCR data in comparative transcriptomics analyses in the Triticeae. Planta 2011, 233, 163–173. [Google Scholar] [CrossRef]
  39. Livak, K.J.; Schmittgen, T.D. Analysis of relative gene expression data using real-time quantitative PCR and the 2− ΔΔCT method. Methods 2001, 25, 402–408. [Google Scholar] [CrossRef]
  40. Ashraf, M.; Rauf, H. Inducing salt tolerance in maize (Zea mays L.) through seed priming with chloride salts: Growth and ion transport at early growth stages. Acta Physiol. Plant. 2001, 23, 407–414. [Google Scholar] [CrossRef]
  41. Patterson, J.H.; Newbigin, E.; Tester, M.; Bacic, A.; Roessner, U. Metabolic responses to salt stress of barley (Hordeum vulgare L.) cultivars, Sahara and Clipper, which differ in salinity tolerance. J. Exp. Bot. 2009, 60, 4089–4103. [Google Scholar]
  42. Rahman, H.; Jagadeeshselvam, N.; Valarmathi, R.; Sachin, B.; Sasikala, R.; Senthil, N.; Sudhakar, D.; Robin, S.; Muthurajan, R. Transcriptome analysis of salinity responsiveness in contrasting genotypes of finger millet (Eleusine coracana L.) through RNA-sequencing. Plant Mol. Biol. 2014, 85, 485–503. [Google Scholar] [CrossRef] [PubMed]
  43. Hussain, K.; Majeed, A.; Nawaz, K.; Nisar, M.F. Effect of different levels of salinity on growth and ion contents of black seeds (Nigella sativa L.). Curr. Res. J. Biol. Sci. 2009, 1, 135–138. [Google Scholar]
  44. Sheen, J.; Zhou, L.; Jang, J.-C. Sugars as signaling molecules. Curr. Opin. Plant Biol. 1999, 2, 410–418. [Google Scholar] [CrossRef] [PubMed]
  45. Alamgir, A.; Ali, M.Y. Effect of salinity on leaf pigments, sugar and protein concentrations and chloroplast ATPase activity of rice (Oryza sativa L.). Bangladesh J. Bot. 1999, 28, 145–149. [Google Scholar]
  46. Less, H.; Galili, G. Principal transcriptional programs regulating plant amino acid metabolism in response to abiotic stresses. Plant Physiol. 2008, 147, 316–330. [Google Scholar] [CrossRef]
  47. Xiong, L.; Zhu, J.K. Molecular and genetic aspects of plant responses to osmotic stress. Plant Cell Environ. 2002, 25, 131–139. [Google Scholar] [CrossRef]
  48. Hartzendorf, T.; Rolletschek, H. Effects of NaCl-salinity on amino acid and carbohydrate contents of Phragmites australis. Aquat. Bot. 2001, 69, 195–208. [Google Scholar] [CrossRef]
  49. Costa, R.; Lobato, A.; Oliveira Neto, C.; Maia, P.; Alves, G.; Laughinghouse IV, H. Biochemical and physiological responses in two Vigna unguiculata (L.) Walp. cultivars under water stress. J. Agron. 2008, 7, 98–101. [Google Scholar] [CrossRef]
  50. Colombo, R.; Cerana, R. Enhanced activity of tonoplast pyrophosphatase in NaCl-grown cells of Daucus carota. J. Plant Physiol. 1993, 142, 226–229. [Google Scholar] [CrossRef]
  51. Silva, P.; Façanha, A.R.; Tavares, R.M.; Gerós, H. Role of tonoplast proton pumps and Na+/H+ antiport system in salt tolerance of Populus euphratica Oliv. J. Plant Growth Regul. 2010, 29, 23–34. [Google Scholar] [CrossRef]
  52. Verslues, P.E. ABA and cytokinins: Challenge and opportunity for plant stress research. Plant Mol. Biol. 2016, 91, 629–640. [Google Scholar] [CrossRef] [PubMed]
Figure 1. Effects of salinity stress (200 mM NaCl) on Na+ and K+ ion content in hexaploid wheat (20 days old). Between the stress and control treatments, a significant difference is indicated by * (p < 0.05). A t-test was used to compare the differences between the treatments.
Agronomy 14 02095 g001
Figure 2. The effects of salinity stress on carbohydrate contents of hexaploid wheat roots. Salinity stress (200 mM NaCl) was applied to wheat seedlings (20 days old). Between the stress and control treatments, the significance differences are indicated by * (p < 0.05). A t-test was used to compare the differences between the treatments.
Agronomy 14 02095 g002
Figure 3. The effects of salinity stress on free amino acids of hexaploid wheat roots. Salinity stress (200 mM NaCl) was applied to wheat seedlings (20 days old). Between the stress and control treatments, the significance differences are indicated by * (p < 0.05). A t-test was used to compare the differences between the treatments.
Agronomy 14 02095 g003
Figure 4. Potential regulatory mechanism of salinity stress tolerance in wheat root.
Agronomy 14 02095 g004
Table 1. The effects of salinity stress on the phytohormone content of hexaploid wheat roots.
NameControl Plant
(µg g−1 DW)
Stressed Plant
(µg g−1 DW)
Fold Change
(Stress/Control)
p-Value
(t-Test)
GA30.0183 ± 0.00510.0138 ± 0.00180.75010.295
ABA0.0028 ± 0.00020.0063 ± 0.00072.29590.0079
IAA0.000 ± 0.00000.0164 ± 0.0232---0.3739
Trans-zeatin0.016 ± 0.00210.0169 ± 0.0011.05360.06308
JA0.3204 ± 0.02070.5687 ± 0.03791.77540.0012
SA0.1337 ± 0.01960.2098 ± 0.02491.56930.0275
Dihydrozeatin0.0005 ± 0.00050.0006 ± 0.00041.2070.8131
GA10.0247 ± 0.00670.1024 ± 0.01544.15220.0026
Between the stress and control treatments, a significant difference is indicated by (p < 0.05). Gibberellic acid (GA3); abscisic acid (ABA); indole-3-acetic acid (IAA); salicylic acid (SA); and jasmonic acid (JA).
Table 2. Salinity-responsive differentially expressed proteins in hexaploid wheat root.
Gene IDGene NameFold Changep-Value (t-Test)
(Stress/Control)
TraesCS6B01G080000Glutathione S-transferase424.9770.321
TraesCS1D01G094700Glutathione S-transferase1.690.228
TraesCS7B01G370000Glutathione S-transferase2.4640.048
TraesCS5B01G426800Dehydrin6.5030.019
TraesCS2B01G613900Peroxidase1.080.005
TraesCS1A01G141100LEA0.8110.261
TraesCS2B01G125800Peroxidase3.9980.092
TraesCS2A01G016500Pectate lyase1.6920.107
TraesCS6A01G350600Dehydrin0.9930.981
TraesCS7A01G560000Dehydrin0.8530.001
TraesCS6A01G350700Dehydrin0.4180.012
TraesCS3B01G266200PP2C0.3060.013
TraesCS3B01G411300ABF2.6820.005
TraesCS3D01G250900V-H+ ATPase-b20.7760.82
TraesCS2A01G289300HAK10.7890.036
TraesCS3A01G446600Potassium transporter1.7370.043
TraesCS2D01G419000Potassium transporter0.1460.074
TraesCS4D01G361300.1HKT1;51.1450.003
The values are the mean of three biological replicates.
Table 3. Effect of salinity stress on gene expression involved in carbohydrate metabolism in hexaploid wheat root.
Gene NameFold Change (Stress/Control)p-Value (t-Test)
TaSPSV0.580.365
TaSPSIV40.480.194
TaSPSIII0.880.79
TaSPSIIa2.010.121
TaSPSIa1.920.492
TaFK4b0.530.478
TaFK4a0.640.033
TaCesA100.520.473
TaCesA41.930.228
TaCesA1b0.470.332
TaUGDC11.060.949
TaUGDH10.550.364
TaPDH-E3-10.690.4304
TaPDH-E1-B11.060.002
Ta6-SFT21.060.83
Ta6-SFT11.40.001
Ta1-SST21.70.013
Ta1-SST11.940.092
TaSPSVI1.790.013
TaSuS32.290.039
TaSuS41.680.174
TaSuS50.370.375
TaSuS71.010.966
TaSuS92.070.104
TaSuS112.30.026
TaSAInv10.720.482
TaSAInv22.110.014
TaRP360.560.209
TaRP150.780.479
The values are the mean of three biological replicates.
Table 4. Differentially accumulated salinity-responsive proteins in wheat roots.
S.noProtein NameProtein Number
1Ascorbate3
2Citrate synthase6
3Glutathione S-transferase7
4Dehydrin8
5Peroxidase4
6Peroxidase2
7Heat shock factor-binding protein 14
8Dehydrin, conserved site1
9V-type proton ATPase subunit G5
10Superoxide dismutase [Cu-Zn]8
11V-type proton ATPase subunit E1
1214-3-3 protein5
13Peroxidase1
14Thioredoxin2
15Malate dehydrogenase1
16Superoxide dismutase3
17Cold shock protein1
18Plasma membrane-associated cation-binding protein 13
19Hsp70-Hsp90 organizing protein 15
20V-type proton ATPase subunit d1
21ATPase family AAA domain-containing protein 32
22Heat-inducible transcription repressor6
23Photosystem I reaction center subunit II4
Table 5. Differentially accumulated salinity tolerance protein abundances between control and salinity stress treatments in hexaploid wheat roots.
Protein IDProtein NameFold Change (Stress/Control)Adj. p-Value
TraesCS3B01G147100.1Glutaredoxin1002.68892 × 10−16
TraesCS3B01G248200.1Receptor-like kinase1002.68892 × 10−16
TraesCS1D01G207400.1Glutathione S-transferase1002.68892 × 10−16
TraesCS6D01G234700.1Dehydrin1002.68892 × 10−16
TraesCS4A01G209400.1Cytochrome b-c1 complex subunit 61002.68892 × 10−16
TraesCS6D01G378400.1Potassium channel beta subunit1002.68892 × 10−16
TraesCS5B01G195600.1Heat shock factor-binding protein 11002.68892 × 10−16
TraesCS5A01G369800.1Dehydrin, conserved site1002.68892 × 10−16
TraesCS2B01G457800.1V-type proton ATPase subunit G7.8568.69717 × 10−6
TraesCS2D01G123300.1Superoxide dismutase [Cu-Zn]5.7855.0951 × 10−5
TraesCS3A01G238700.1V-type proton ATPase subunit E24.969.77338 × 10−5
TraesCS4B01G159900.114-3-3 protein5.1550.000695605
TraesCS7B01G375600.1Peroxidase9.2570.001057598
TraesCS2B01G389500.1Thioredoxin5.4320.005073489
TraesCS3A01G234800.2Acyl-CoA-binding protein4.7240.007562613
TraesCS2A01G537100.1Superoxide dismutase3.9610.010151094
TraesCS1B01G273000.2Cold shock protein3.6920.020824126
TraesCS3B01G183300.2Plasma membrane-associated cation-binding protein 13.2840.038020934
TraesCS2A01G386800.1Hsp70-Hsp90 organizing protein 13.640.04285163
TraesCS3A01G210400.2V-type proton ATPase subunit d7.2280.043992867
TraesCS1D01G445100.1Heat shock family protein0.012.68892 × 10−16
TraesCS4B01G269500.1Heat-inducible transcription repressor0.012.68892 × 10−16
TraesCS5A01G457500.1Photosystem I reaction center subunit II0.0331.56163 × 10−5
TraesCS6A01G198500.1Prohibitin8.0780.038129986
TraesCS5A01G138700.1Cysteine proteinase4.2760.032385383
TraesCS3D01G529500.1Cytochrome b53.6320.026628283
TraesCS4D01G018500.1RNA-binding protein3.3360.015415861
TraesCS3A01G104600.1Late embryogenesis abundant (LEA)12.6160.005187525
TraesCS4A01G139600.140S ribosomal protein S215.3980.00510172
Disclaimer/Publisher’s Note: The statements, opinions and data contained in all publications are solely those of the individual author(s) and contributor(s) and not of MDPI and/or the editor(s). MDPI and/or the editor(s) disclaim responsibility for any injury to people or property resulting from any ideas, methods, instructions or products referred to in the content.

