Article

Impact of Irrigation on Soil Water Balance and Salinity at the Boundaries of Cropland, Wasteland and Fishponds under a Cropland–Wasteland–Fishpond System

1
College of Water Conservancy and Civil Engineering, Inner Mongolia Agricultural University, Hohhot 010018, China
2
Polytechnic Institute of Coimbra, Coimbra Agriculture School, CERNAS—Research Centre for Natural Resources, Environment and Society, Bencanta, 3045-601 Coimbra, Portugal
3
College of Agriculture, Inner Mongolia Agricultural University, Hohhot 010018, China
4
Bayannaoer Modern Agriculture and Animal Husbandry Development Center, Bayannaoer 014400, China
*
Authors to whom correspondence should be addressed.
Agronomy 2024, 14(9), 2110; https://doi.org/10.3390/agronomy14092110
Submission received: 19 August 2024 / Revised: 13 September 2024 / Accepted: 14 September 2024 / Published: 16 September 2024
(This article belongs to the Special Issue Water Saving in Irrigated Agriculture: Series II)

Abstract

:
In order to explore the effect of fishponds on soil water, salt transport and salinization in cropland wasteland, a study on soil water balance and salt distribution pattern in a cropland–wasteland–fishpond system was carried out in 2022–2023 in a typical study area selected from the Yichang Irrigation Area of the Hetao Irrigation District. A water balance model was established for the cropland–wasteland–fishpond system to analyze the effects of irrigation on soil salinity at the boundaries of the cropland, wasteland, and fishpond. The results showed that the lateral recharge from the cropland to the wasteland during spring irrigation in 2022 was 24 mm, the lateral recharge generated by fishponds to wasteland was 18 mm, and the lateral recharge from fishponds to fishpond boundaries was 34 mm. In the fertility period of 2023, the lateral recharge from cropland to wasteland was 15 mm, the lateral recharge from fishponds to wasteland was 9 mm, and the lateral recharge from fishponds to fishpond boundaries was 21 mm. Due to the low salinity content of fishpond water, it diluted the groundwater of the wasteland, and the soil salinity at the boundary between the wasteland and the fishpond was monitored. The data show that the soil salinity at the boundary of the fishpond was smaller than that of the wasteland, which indicates that the migration of fishpond water to the wasteland will not lead to an increase in the soil salinity of the wasteland, but rather to a decrease in the soil salinity of the wasteland. Fishpond regulation has a significant impact on soil and groundwater, and when the topographic conditions of the Hetao irrigation area allow, the model of cropland–wasteland–fishpond can be appropriately adopted to solve land degradation and increase the economic income of farmers; the results of the study provide a contribution for the improvement of the management of land use and soil salinization in the Hetao irrigation area.

1. Introduction

Saline and alkaline land is widely distributed globally, and there is a large amount of saline, dry, crusty and barren saline and alkaline land everywhere, from the frigid and temperate zones to the tropical regions, and from the Americas and Europe to Asia and Australia. According to statistics, the land area covered by different types of saline and alkaline land worldwide accounts for almost 10% of the total land area [1]. The management and utilization of saline and alkaline land is a global problem [2,3,4,5]. China is one of the three major saline–alkaline land distribution countries, and in recent years China has gathered advantageous resources for the efficient management of saline–alkaline land, and the comprehensive utilization of saline–alkaline land has made positive progress [6,7,8]. At present, China has more than 33.33 million ha of various types of saline and alkaline land resources available for use, including 12.33 million ha of saline and alkaline land with agricultural utilization prospects. China’s saline and alkaline land is large in size, type and distribution, and the trend of salinization of cropland has intensified in some areas. Recently, the Ministry of Agriculture and Rural Affairs has been actively advancing aquaculture practices on saline–alkali land. The strategy of ‘excavating ponds to lower salt levels and using fishing to control alkalinity’ can improve soil structure and support the reclamation of saline–alkali areas [9]. The artificial regulation process in fishponds is more pronounced, as it connects with the groundwater of nearby cropland and significantly affects the surrounding soil and groundwater environment. This differs markedly from traditional studies of cropland, wasteland and sea. Understanding the changes in soil and groundwater environments in the cropland–wasteland–fishpond system is crucial for the improvement and prevention of saline–alkaline soils.
The Hetao Irrigation District in Inner Mongolia is a common area in China where soil gets salty. About 394,000 ha of land are affected, making up 69% of all the cropland. This salt problem makes it hard for local farming and the economy to grow [10], and it is an area with no irrigation and no agriculture [11]. Groundwater levels in the irrigation areas exceeded the critical level, exacerbating soil salinization, which has become one of the main problems facing agricultural development [12,13]. The occurrence of soil salinization is influenced by regional factors, and the composition of soil salts and ionic ratios in different regions show specific regional characteristics, while the processes of salt accumulation and drainage also vary [14,15]. Recently, many researchers have extensively studied soil salt ions and the migration of soil salts across different land types, leading to significant findings [16,17,18]. The results show that there is a close relationship between soil salinization and salt ions, and changes in the composition and content of salt ions in the soil directly affect the degree of soil salinization. Therefore, controlling the balance of salt ions in the soil and reducing the negative effects of salts on plants is conducive to improving soil quality and ensuring the sustainable development of irrigation areas. Liu et al. [19] found that freeze–thaw process exacerbates soil salinization and affects agricultural production. It was shown that salt ions migrate unevenly during freezing and thawing, leading to salinization. Observations in the Hetao irrigation area of China carried out in 2020–2021 found that the freeze–thaw process converted the major salt anion from sulfate to chloride, and that topsoil salinization worsened after the freeze–thaw process, with an increase in Cl content. Wang et al. [20] studied the salt accumulation characteristics of different types of soils and the effect of salt ions on soil salt accumulation, with cropland, wasteland and sandy land as research objects. The results showed that the salt accumulation in cropland was mainly concentrated in the spring and fall harvesting periods, and the main salt ions affecting cropland were SO42− and Cl, while those affecting wasteland and sandy land were mainly Na+ and Cl.
Xu et al. [21] suggested that the table–field–fishpond system can promote sustainable land use on a regional scale, facilitate ecological improvement, provide productive structural regulation, transform low-lying saline and fragile ecosystems and support sustainable economic development practices. Ayyam et al. [22] noticed that land in tropical coastal areas is vulnerable to damage from salt and acid in the soil. They suggested that using a rice–fish farming model, along with taking advantage of social and economic opportunities in these coastal areas, could help fix the land degradation issue. Yu et al. [23] concluded that saline fishponds have a positive effect on improving the ecological environment, increasing farmers’ economic benefits and improving saline soils by studying the cropland–wasteland–fishpond system.
Currently, there is a paucity of literature examining the effects of fishponds on soil and groundwater environments in the continuous cropland–wasteland–fishpond system. Therefore, it is of great significance to understand the composition of salt ions in the soil, to determine the amount of soil moisture migration between cropland–wasteland–fishpond systems, and to elucidate the characteristics of the changes in the groundwater environment in the cropland–wasteland–fishpond system for the water and salt regulation in irrigation areas. Taking the cropland–wasteland–fishpond system as the object of study, this paper aims to elucidate the amount of water transport between the above system and groundwater during irrigation. In addition, this paper also explores the distribution characteristics of soil salt ions at the boundary of cropland. This study aims to provide a contribution to the improvement of the management of saline and alkaline land in the Hetao irrigation area, assessing the distribution patterns of eight major ions in groundwater and fishpond water under the influence of freshwater fishponds, as well as the distribution of these ions in wasteland and fishponds.

2. Materials and Methods

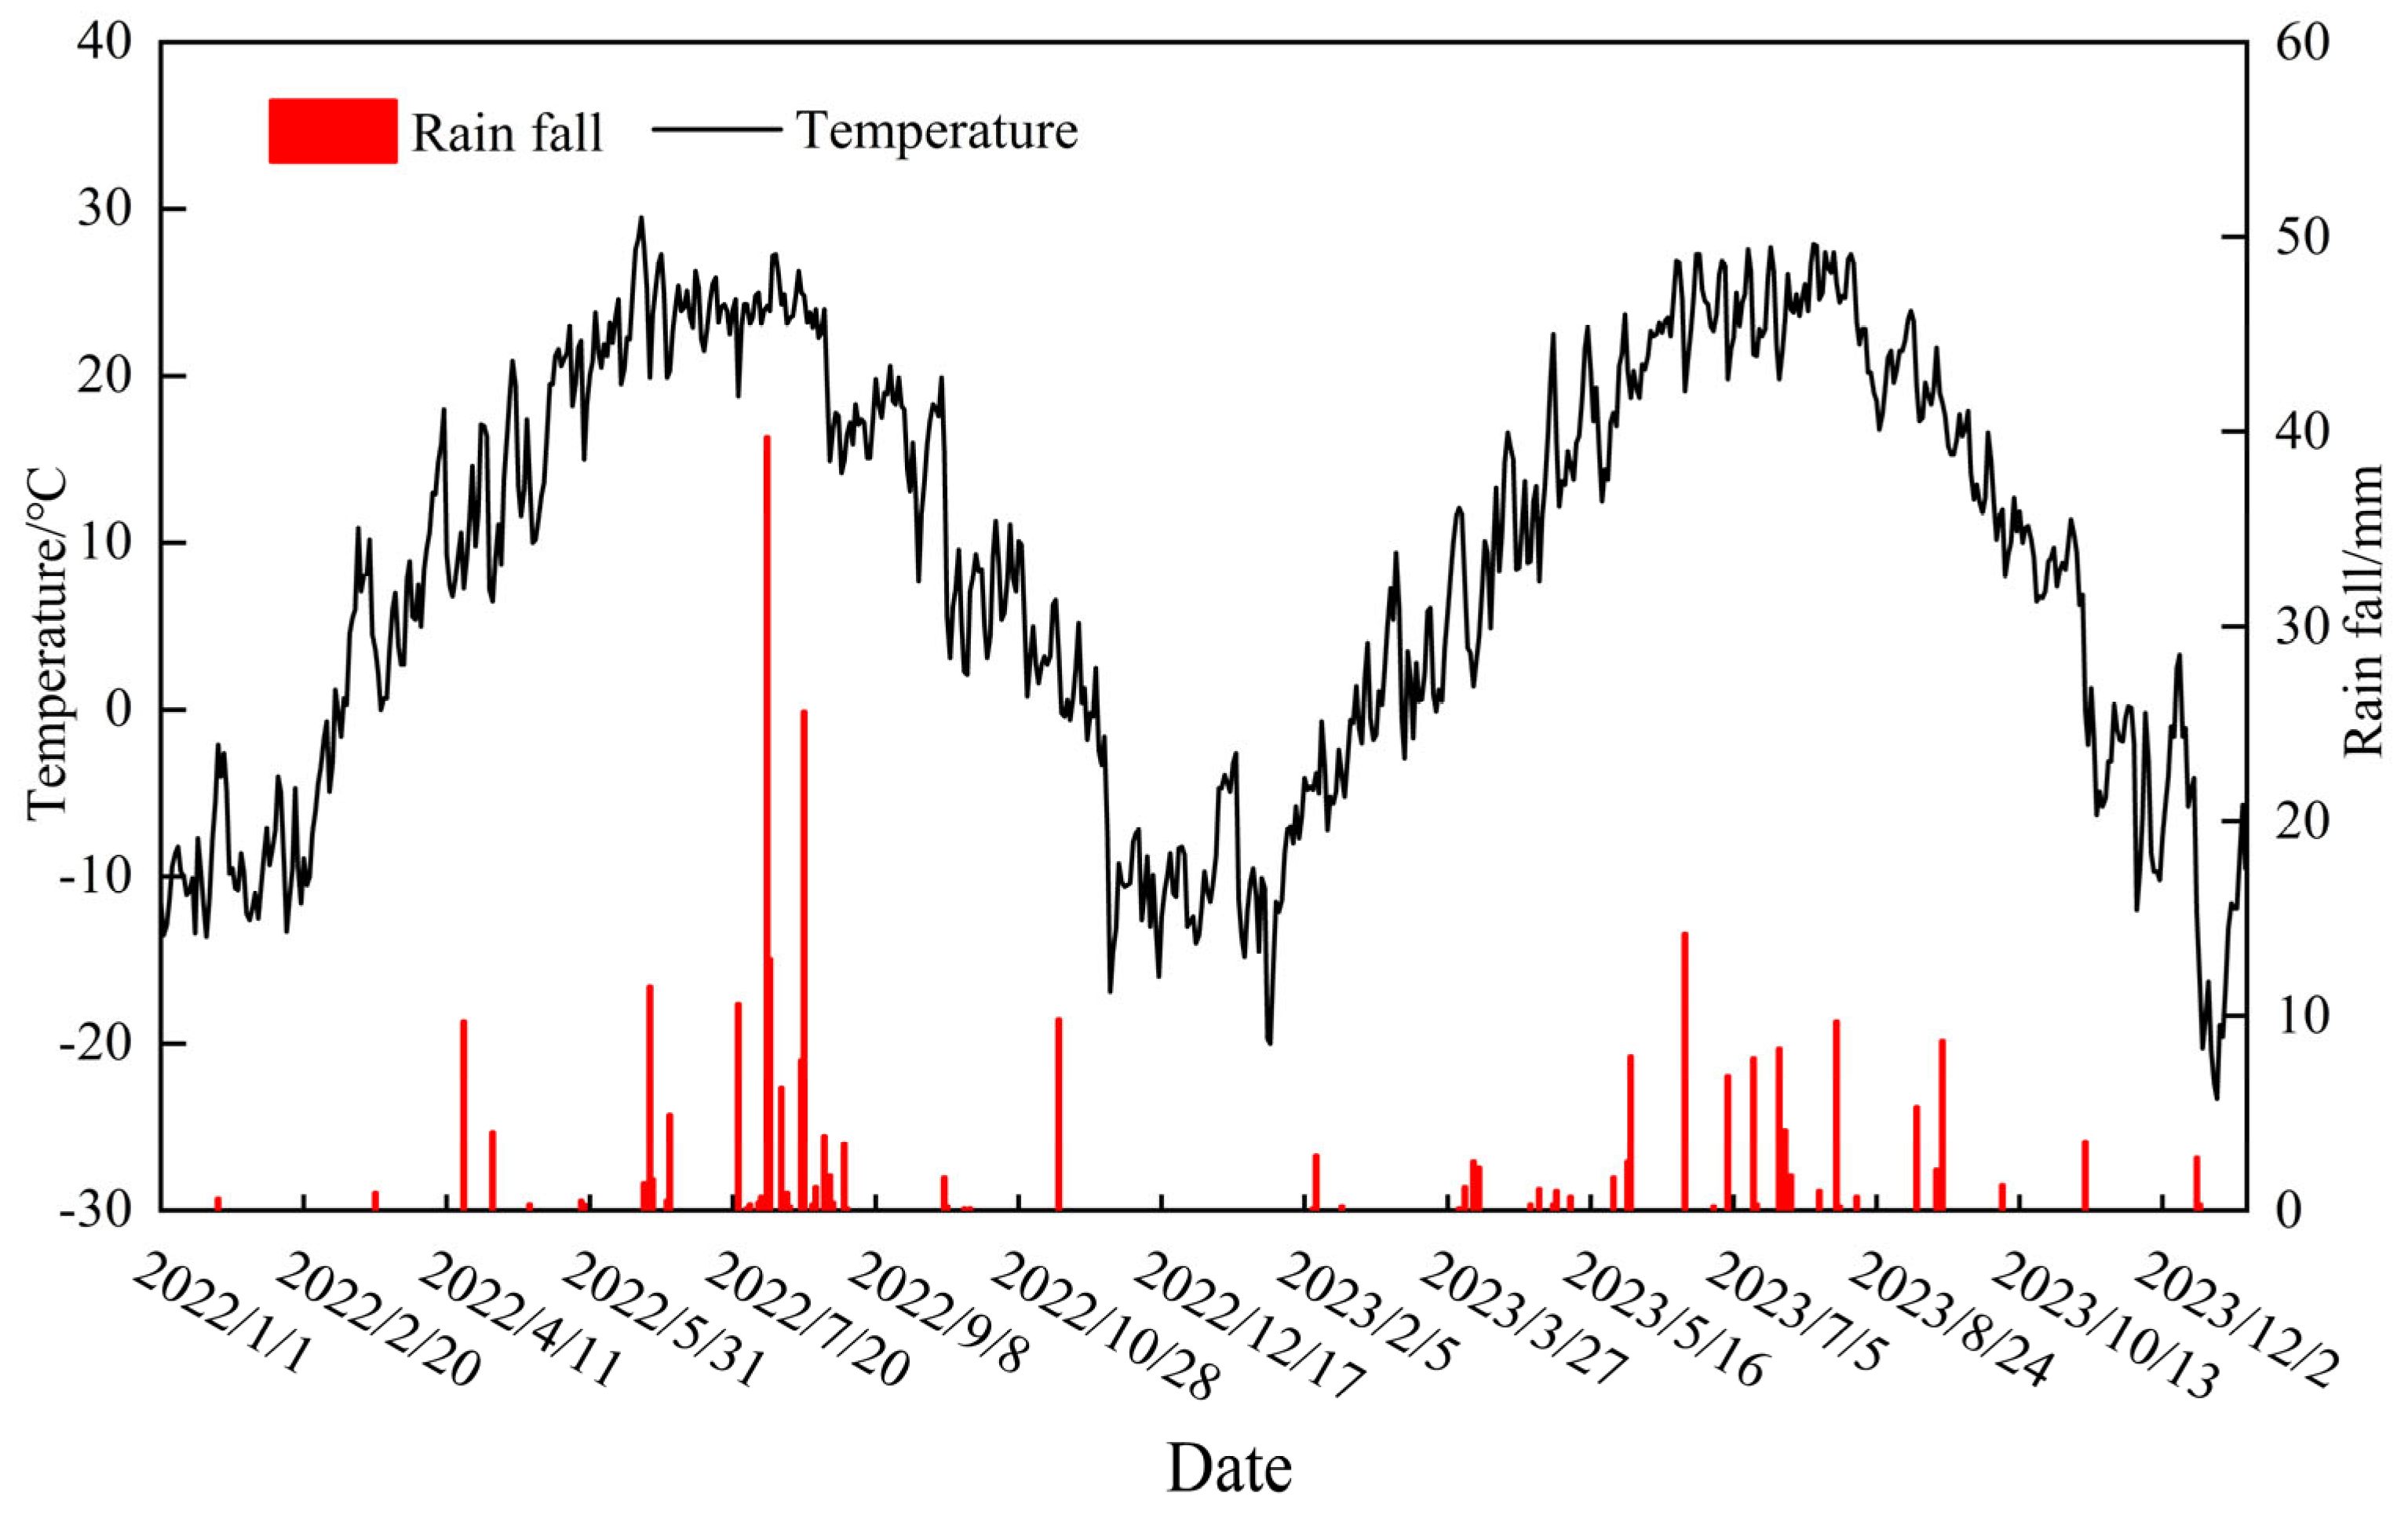
2.1. Overview of the Study Area

The experiment took place from May 2022 to September 2023 in the Yichang Irrigation Area, which is part of the Hetao Irrigation District in Inner Mongolia. The test area was in Wuyuan County, Bayannaoer City, with location co-ordinates of 107°35′ to 108°37′ E and 40°46′ to 41°16′ N. It has a moderate continental climate, with a lot of sunlight, has dry and windy weather, and gets very little rain. The average yearly rainfall is 185 mm, with most of it occurring from July to September, and evaporation is significant, averaging around 2000 mm annually. Groundwater depth in the area typically ranges from 1.5 to 3.0 m and fluctuates regularly. Due to irrigation, infiltration and evaporation, groundwater movement is primarily vertical. Atmospheric temperature and rainfall are monitored by automatic meteorological stations. In 2022, the recorded rainfall was high at 164 mm, while in 2023, it decreased to 103 mm. The changes in temperature and rainfall from 2022 to 2023 are shown in Figure 1.

2.2. Experimental Design and Data Collection

The area of cropland in the experimental area was about 0.8 ha, the area of wasteland was 0.28 ha, and the area of fishponds was 0.77 hm2. Cropland, wasteland and fishponds were adjacent to each other (Figure 2); the fishponds got their water from two main sources: groundwater seeping from the nearby cropland and some water from the Yellow River that could be added to them. In total, 8 groundwater observation wells, 6 field negative pressure gauges and 2 micro-evaporators were installed on each of the wasteland and cropland areas to measure soil evapotranspiration.

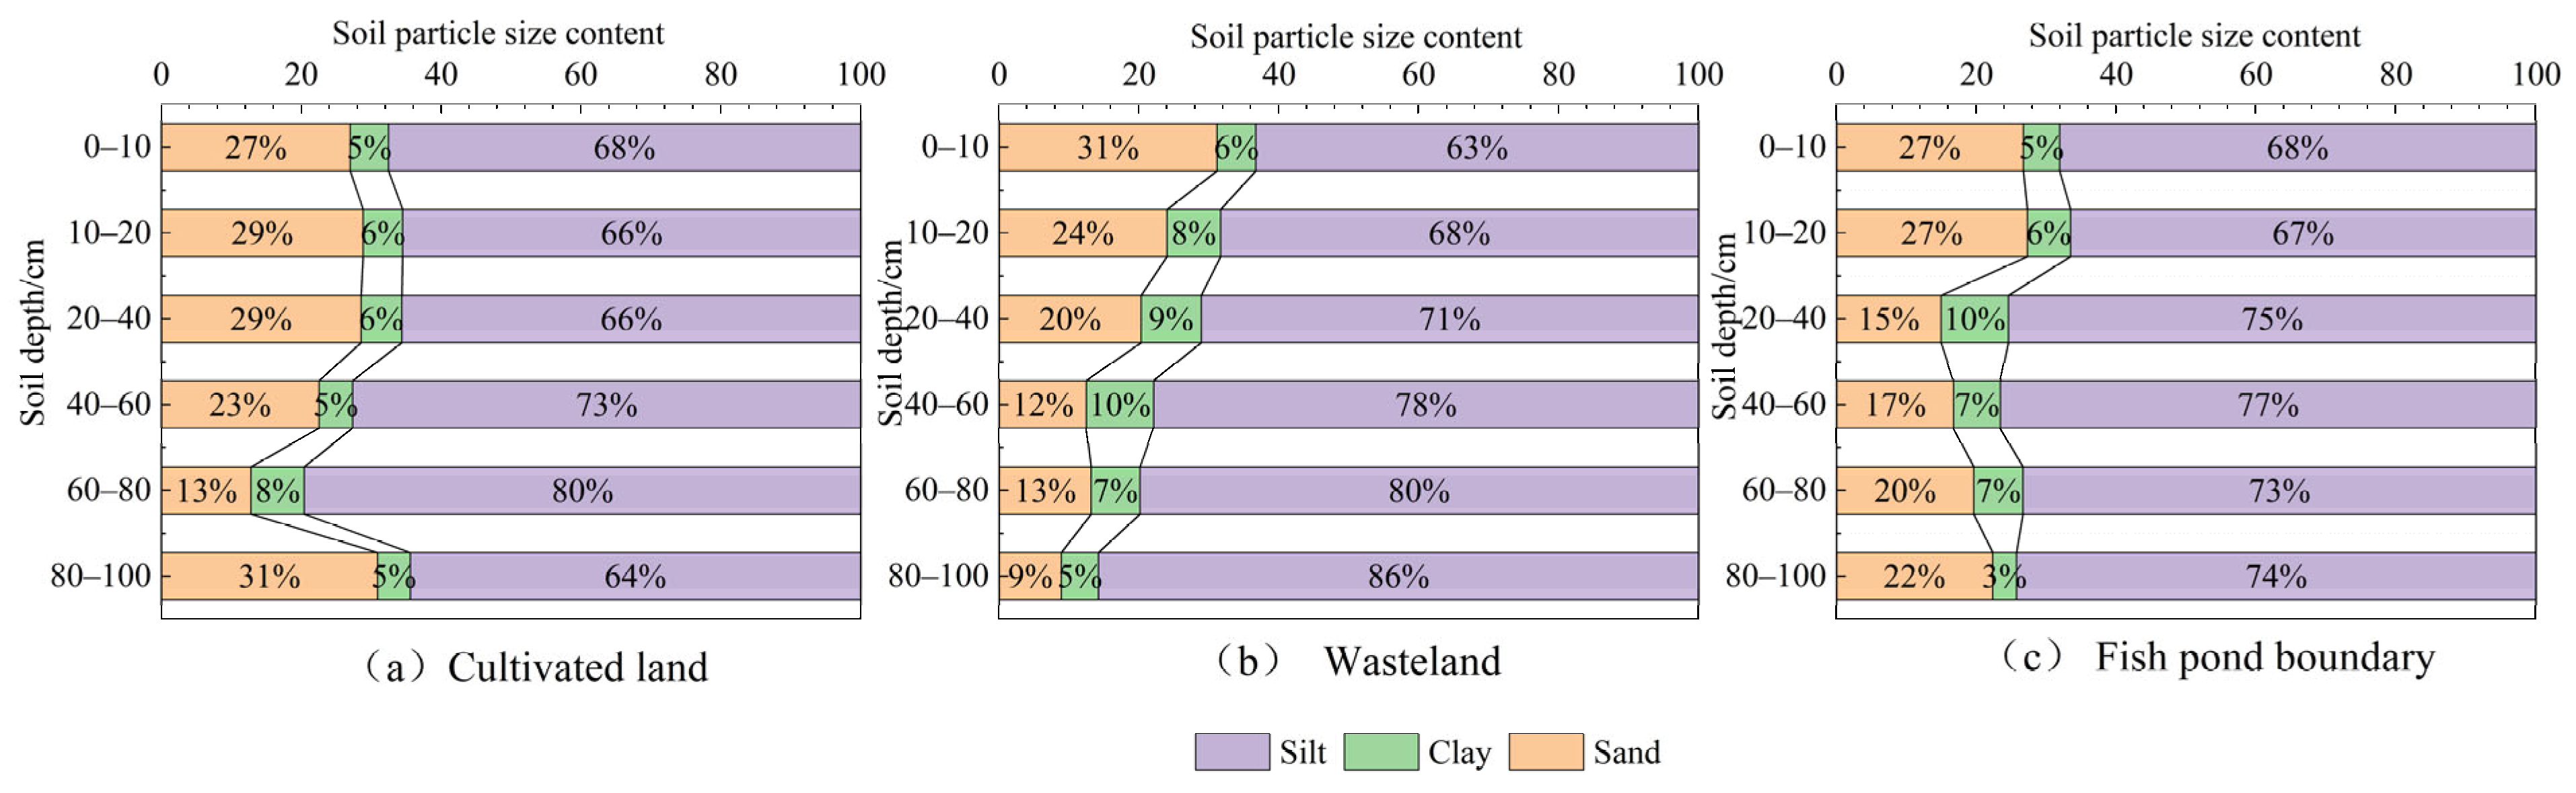
2.2.1. The Fundamental Physical Characteristics of Soil

The field layout of the experimental area was a 30 m × 30 m grid, and soil sampling points were set at the nodes of the grid, totaling 22 soil sampling points. Six vertical profiles were established for soil indicator testing, using a soil auger method to collect samples at a depth of 1 m. This resulted in six soil layers (0–10 cm, 10–20 cm, 20–40 cm, 40–60 cm, 60–80 cm and 80–100 cm) [24]. Basic soil data were collected and determined for each layer, with the physical properties of the soil in the test area depicted in Figure 3.

2.2.2. Soil Salts and Salt Ions

Soil samples were obtained from a depth of 100 cm using a soil auger in six layers, with the first layer at a depth of 0–10 cm, the second at 10–20 cm, the third at 20–40 cm, the fourth at 40–60 cm, the fifth at 60–80 cm and the sixth at 80–100 cm. Soil samples were obtained at 30-day intervals, and the conductivity of soil leachate, prepared with a 1:5 soil-to-water ratio, was quantified utilizing a conductance meter (DDS-307A, Shanghai Youke Instrument Company, Shanghai, China). Soil salt ion content K++Na+ was determined by the flame photometer method, Mg2+, Ca2+, SO42− by EDTA titration, Cl by silver nitrate titration, and HCO3 and CO32− by dual indicator neutralization titration; these were measured once before spring irrigation and once after harvest.

2.2.3. Groundwater Depth

Eight groundwater observation wells were installed. They were made of PVC pipes that were 110 mm wide and 5 m deep. Among them, there were 2 observation wells for cropland, 4 for wasteland and 2 for the boundary of fishponds. The spacing between each groundwater observation well was 6 m, and well No. 1 (cropland), well No. 3 (wasteland) and well No. 5 (fishpond boundary) were selected as the key groundwater monitoring points. The groundwater burial depth and the fishpond water level were monitored every 7 d in 2022, and groundwater automatic sensors (CTD-10, Meter Company, Pullman, USA) were installed in May 2023 to record groundwater level, temperature and salinity data every 2 h. The dynamic map of groundwater burial depth is shown in Figure 4.

2.2.4. Water Information

Two specific spots were chosen in the fishponds, and samples were taken every 10 to 15 days. At every sampling location, we collected 500 mL of water from the middle layer of the fishponds and another 500 mL from the groundwater observation wells. The water samples were taken to the lab for testing within 48 h. The parameters analyzed included conductivity and the concentration of eight major ions. The chemical characteristics of the groundwater are presented in Table 1.

2.3. Calculation and Analysis Methods

2.3.1. Soil Salinity

The conversion of soil conductivity to total soil salinity was calculated according to Zhao et al. [24]
C = 3.7657EC1:5 − 0.2405
where: C is the total salt content of the soil, g/kg; EC1:5 is the electrical conductivity of soil leachate with a water mass ratio of 1:5, dS/m
The equation for soil salinity is [25]
S = 100Cρsl
where: S is the soil salinity, kg/hm2; ρs is the soil bulk weight, g/cm3; l is the soil depth, (cm)

2.3.2. Soil Desalination Rate

The rate of soil desalination was calculated as follows:
N = S 1 S 2 S 1 × 100 %
where: N is the desalination rate, %; S1 is soil conductivity before irrigation, dS/m; S2 is soil conductivity after irrigation, dS/m

2.3.3. Groundwater Mineralization

Conversion of groundwater conductivity (EC) and mineralization (TDS)
T D S = 0.69 E C
where: TDS is the salinity of groundwater, g/L; EC is the conductivity of groundwater, dS/m.

2.3.4. Soil Water Balance Analysis

The soil water balance method was applied, using the equation:
F = Δ W S P I Q + E T
where: ∆Ws is the soil water storage variable, mm; P is rainfall, mm; I is irrigation water, mm; Q is groundwater recharge, mm; (negative values are groundwater seepage); ET is evapotranspiration, mm; F is lateral recharge, mm (positive values are inflow; negative values are outflow).
The cropland area of the typical area was 0.8 ha and the equilibrium period was from 11 May to 22 June 2022 (spring irrigation period), and from 16 May to 24 August 2023 (crop fertility irrigation), respectively.
The soil moisture storage variable was calculated as
W i = 10 i = 1 n r i h i θ i
where: Wi is the soil water storage of the i layer, mm; γi is the dry bulk weight of soil layer i, dimensionless; hi is the thickness of soil layer i, cm; θi is the mass water content of soil layer i, dimensionless.
The total rainfall during the equilibrium period was 15.3 mm in 2022 and 65.6 mm in 2023, and the effective rainfall after subtracting the canopy retention evapotranspiration (typically 5 mm) was 15.3 mm and 63.9 mm, respectively. The irrigation regimes are shown in Table 2.
In this study, the positioning flux method was utilized to calculate groundwater recharge. This method entails the installation of a negative pressure gauge at designated points Z1 and Z2. Monitoring alterations in the soil water potential gradient enables the flux at these points to be calculated in accordance with Darcy’s law, using the equation:
Q ( z 1 2 ) = K ( h ¯ ) ( h 2 h 1 Δ Z + 1 )
Among them:
h ¯ = h 1 + h 2 2
K ( h ) = α m n α θ s ( α h ) n 1 1 + ( α h ) n m 1 . exp ( b θ s 1 + ( α h ) n ) m
where: h1 and h2 are the negative manometer values at sections Z1 and Z2, hPa; ∆Z is the difference between Z2 and Z1, cm; Q(z1−2) is the soil water flow rate per unit area flowing through during the time period t1~t2, mm; K(h) is the unsaturated hydraulic conductivity, cm/min; θs is the saturated water content of the soil, cm3/cm3; α is the reciprocal of the value of the soil air intake, cm−1; h is the soil suction, hPa; m and b are fitted empirical parameters. The same can be obtained from Q(z−2) for any cross-section flow:
Q ( z ) = Q ( z 1 2 ) + z z 1 2 Q ( z , t 2 ) d z z z 1 2 Q ( z , t 1 ) d z

3. Results

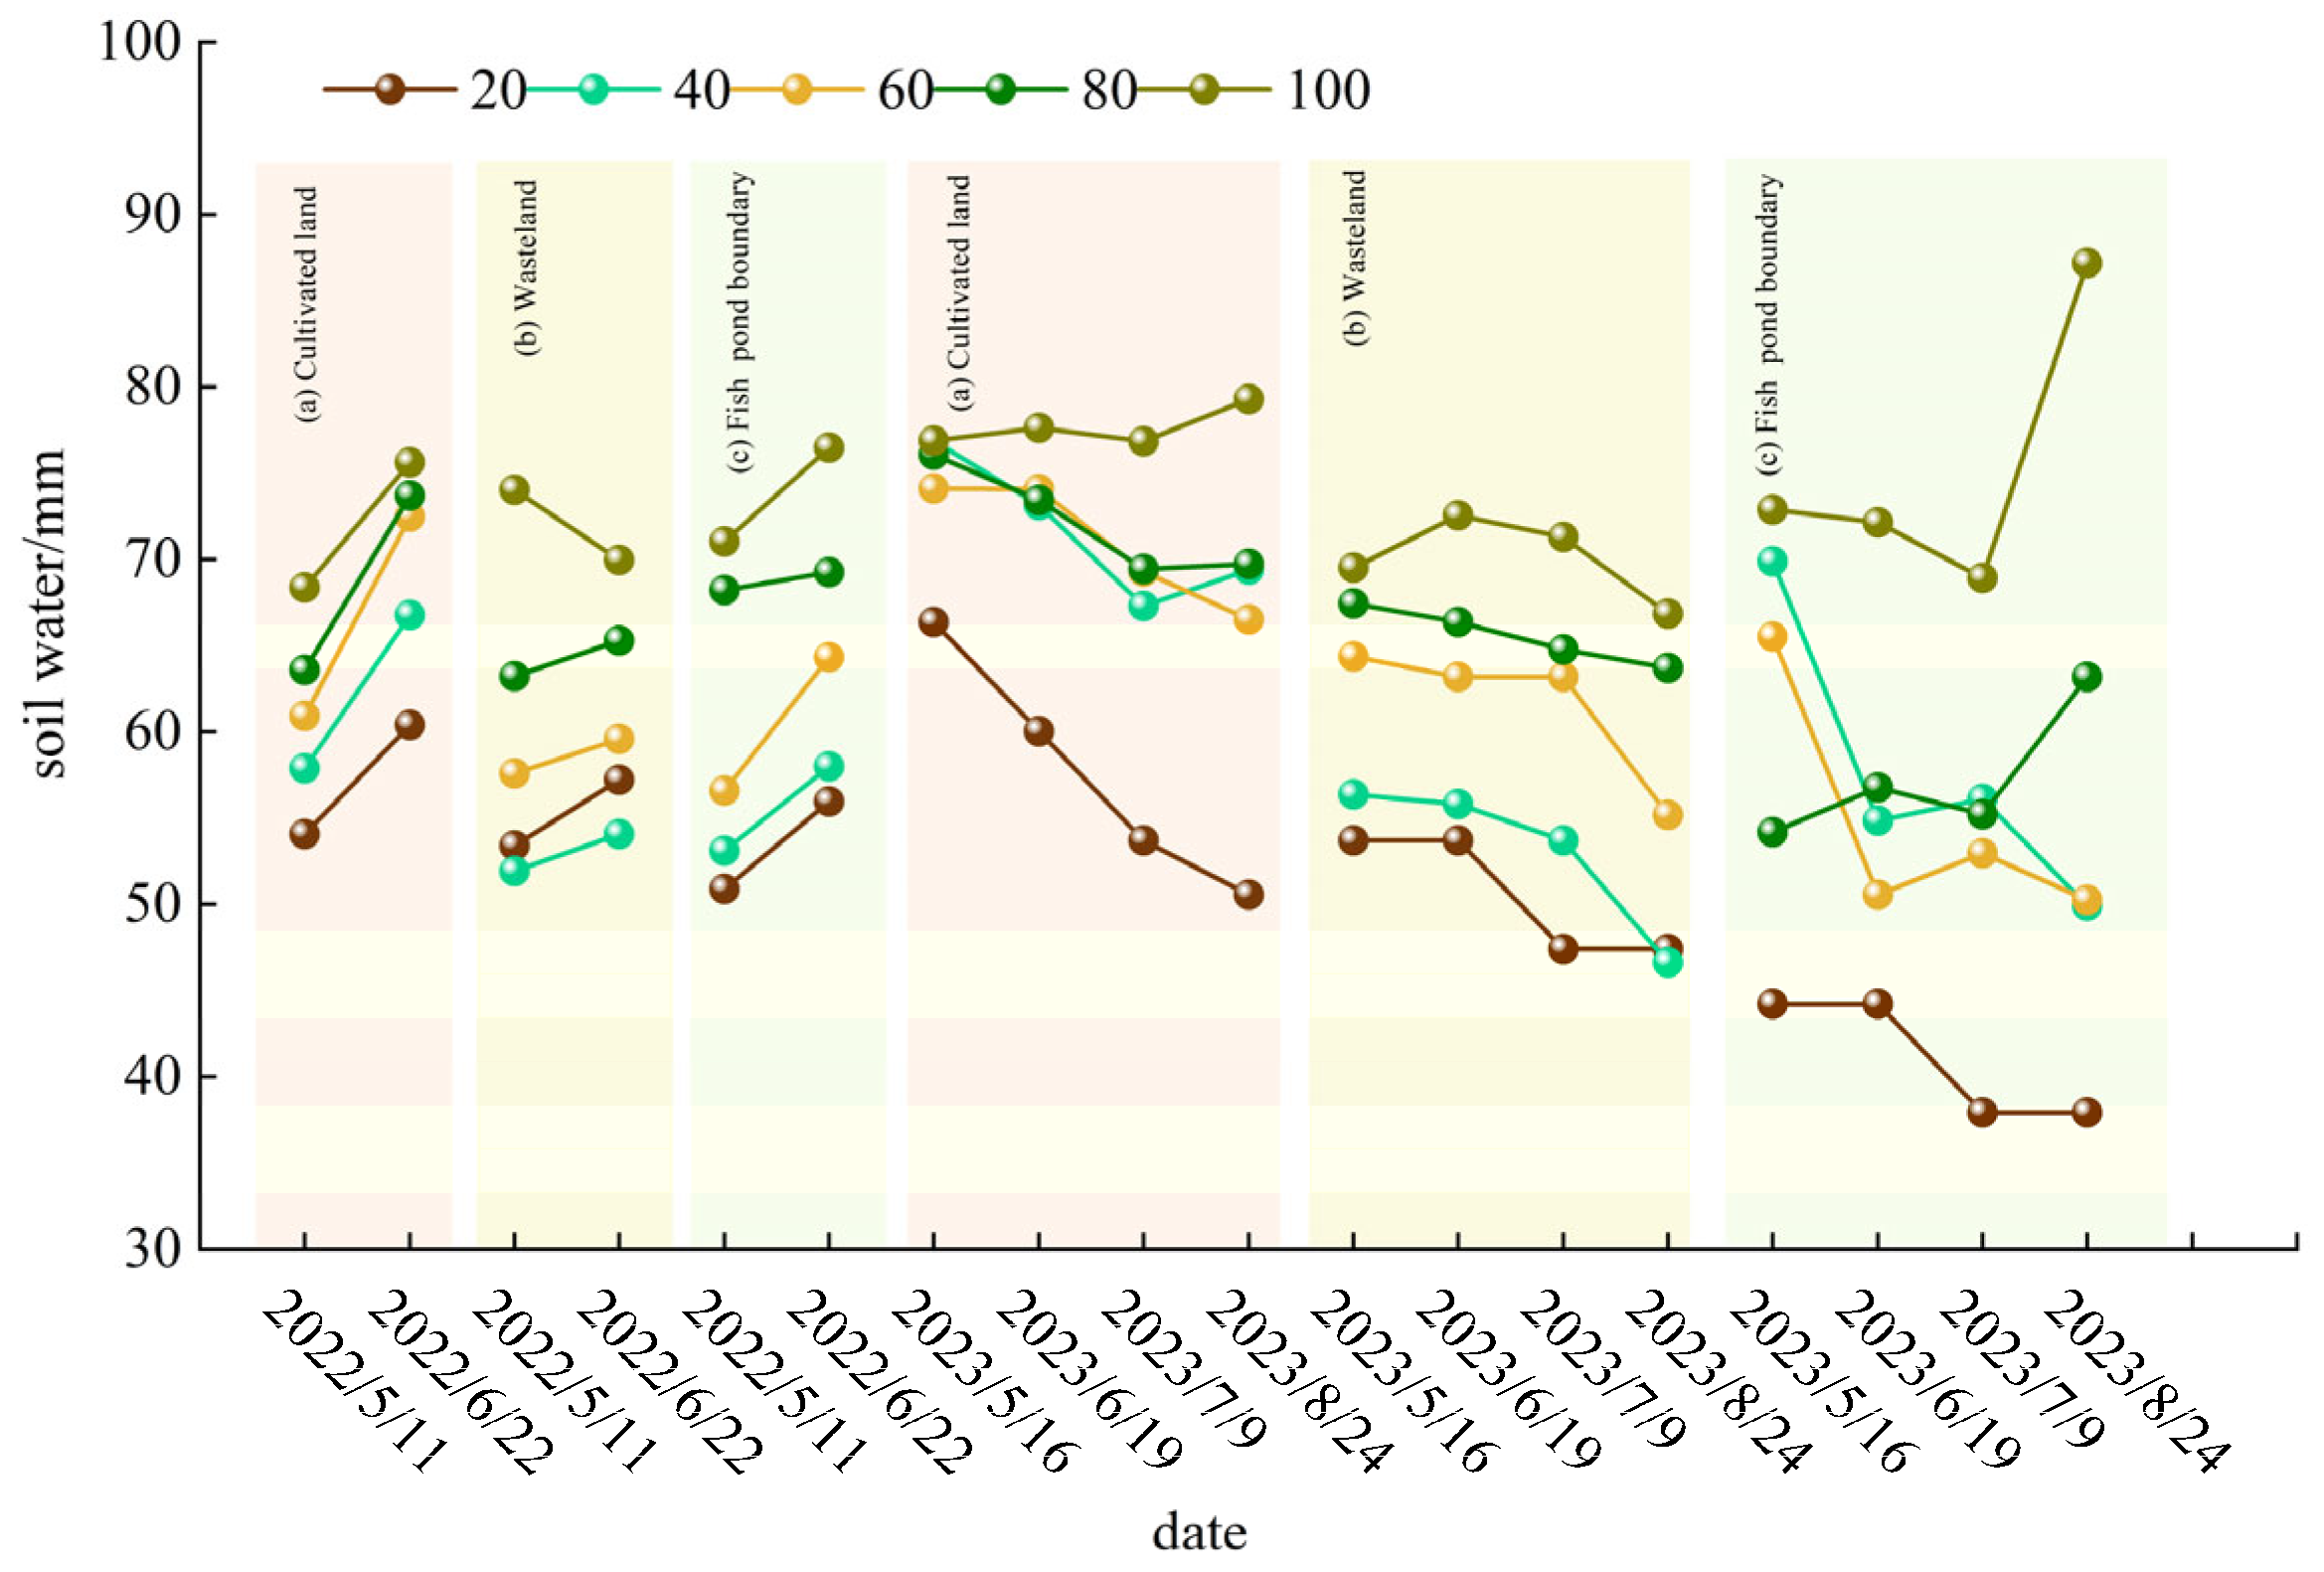
3.1. Analysis of Soil Water Balance between Cropland–Wasteland–Fishpond System

Soil water storage fraction changes were calculated during the equilibrium period by determining the soil water content (Figure 5). During spring irrigation in 2022, the changes in soil water storage fractions were 44.14 mm for cropland, 5.97 mm for wasteland and 24.18 mm for fishpond boundaries. In contrast, during the fertility period in 2023, the changes were −35.05 mm for cropland, −31.89 mm for wasteland and −18.35 mm for fishpond boundaries. Based on the water balance equation, the lateral recharge for cropland, wasteland and fishpond boundaries in the experimental area was calculated for both spring irrigation in 2022 and the reproductive period irrigation in 2023 (Figure 6). Due to the unique geographic environment of cropland, wasteland and fishpond, there was not only lateral recharge from cropland to wasteland during the irrigation period but also an increase in the water level of the fishpond, which contributed additional lateral recharge to the wasteland. Furthermore, the fishpond generated more lateral recharge to the area of the fishpond boundary closer to the fishpond (C) than to the wasteland (B). During the spring irrigation period of 2022, the lateral recharge from cropland to wasteland (B) was 24.13 mm, from fishpond to wasteland it was 17.56 mm and from fishpond to the fishpond boundary (C) it was 34.47 mm. In 2022, the lateral recharge from the fishpond to the fishpond boundary (C) was 10.34 mm greater than that to wasteland (B). In 2023, the lateral recharge from cropland to wasteland was 14.84 mm, from fishpond to wasteland (B) it was 9.36 mm and from fishpond to the fishpond boundary (C) it was 21.46 mm. In 2023, the lateral recharge from the fishpond to the fishpond boundary (C) was 12.1 mm higher than that to wasteland (B). The lateral recharge from cropland to wasteland in 2022 was 19.51 mm greater than in 2023, due to a higher single irrigation amount in cropland during the spring irrigation of 2022.

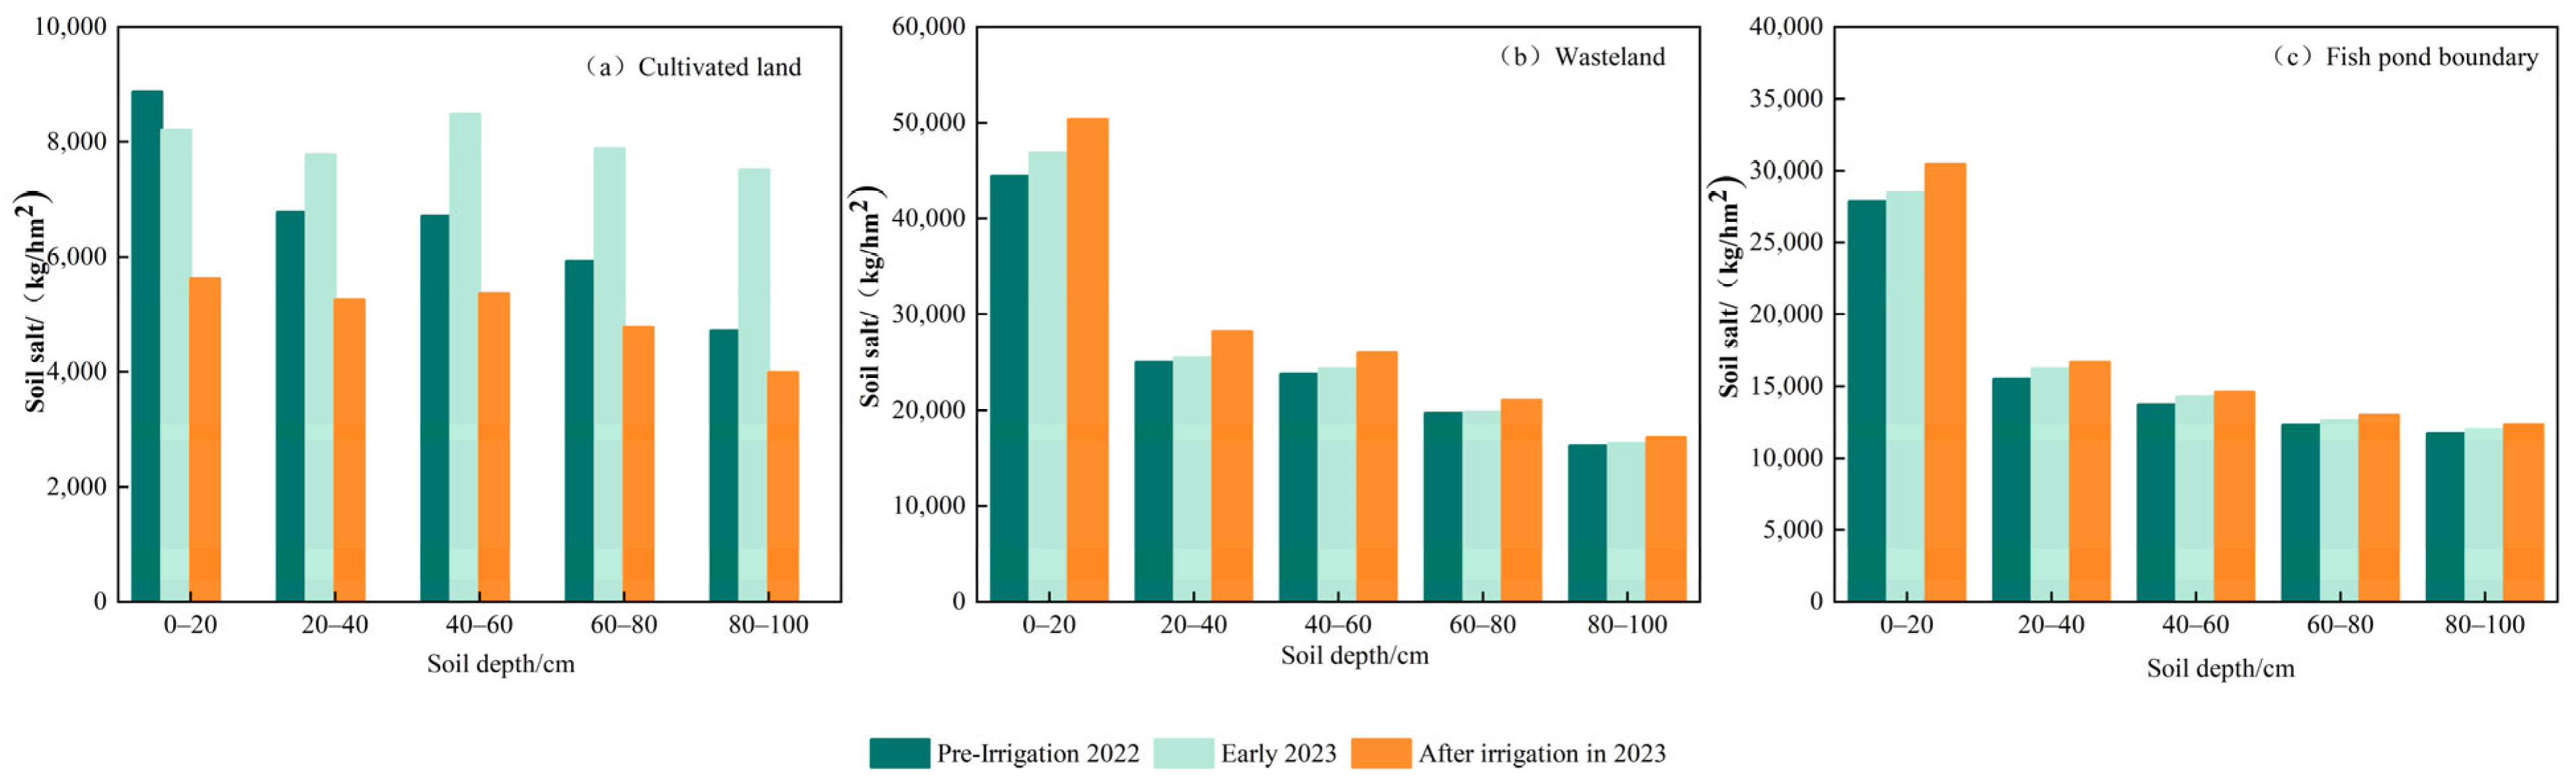
3.2. Desalination Effect of Salinized Soil in Cropland–Wasteland–Fishpond System

Before the spring irrigation in 2022 and after the last irrigation in 2023, the soil salinity of different land types is shown in Figure 7. The soil salinity before spring irrigation is severe, the soil salinity in wasteland is the highest, the soil salinity in cropland is relatively low, and the soil salinity in fishpond border is the second.
Based on the changes in soil salinity from before the irrigation in 2022 to early 2023, it can be observed that the topsoil (0–20 cm) in the cropland is in a leached state, while the subsoil (20–100 cm) is in a salt-accumulated state. The reason for this is that the irrigation in the autumn of 2022 was delayed, so the leaching water did not completely percolate before freezing, causing the salt to remain in the soil. As a result, the soil salinity was higher in early 2023. After one year of irrigation and leaching, the salt in the cropland was washed down into the groundwater. Salt is carried into the wasteland and fishpond boundaries via groundwater, resulting in both the wasteland and fishpond boundaries being in a state of salt accumulation by the beginning of 2023.
Based on the changes in soil salinity from before the irrigation in 2022 to after irrigation in 2023, After two years of irrigation, the saltiness in the soil decreased, and the soil desalination rate was reduced with the increase of soil depth, and the soil desalination rate of 0 to 20 cm soil layer was the highest. However, the wasteland and fishpond had a lot of salt built up in the soil. The amount of salt decreased as you go deeper into the soil. The layer of soil from 0 to 20 cm had the most salt. During irrigation, salt leaches from cropland into water tables, which are higher in cropland than in wasteland. Therefore, the groundwater of the cropland migrates to the wasteland, and the salt also migrates to the wasteland, resulting in the accumulation of salt in the wasteland. Because the groundwater at the border of the fishpond is influenced by the adjacent freshwater fishpond, the groundwater migrating to the border of the fishpond is diluted by the adjacent freshwater fishpond during the irrigation period, so the soil salt accumulation rate at the border of the fishpond is lower than that of the wasteland, and the freshwater fishpond adjacent to the wasteland inhibits the salt.

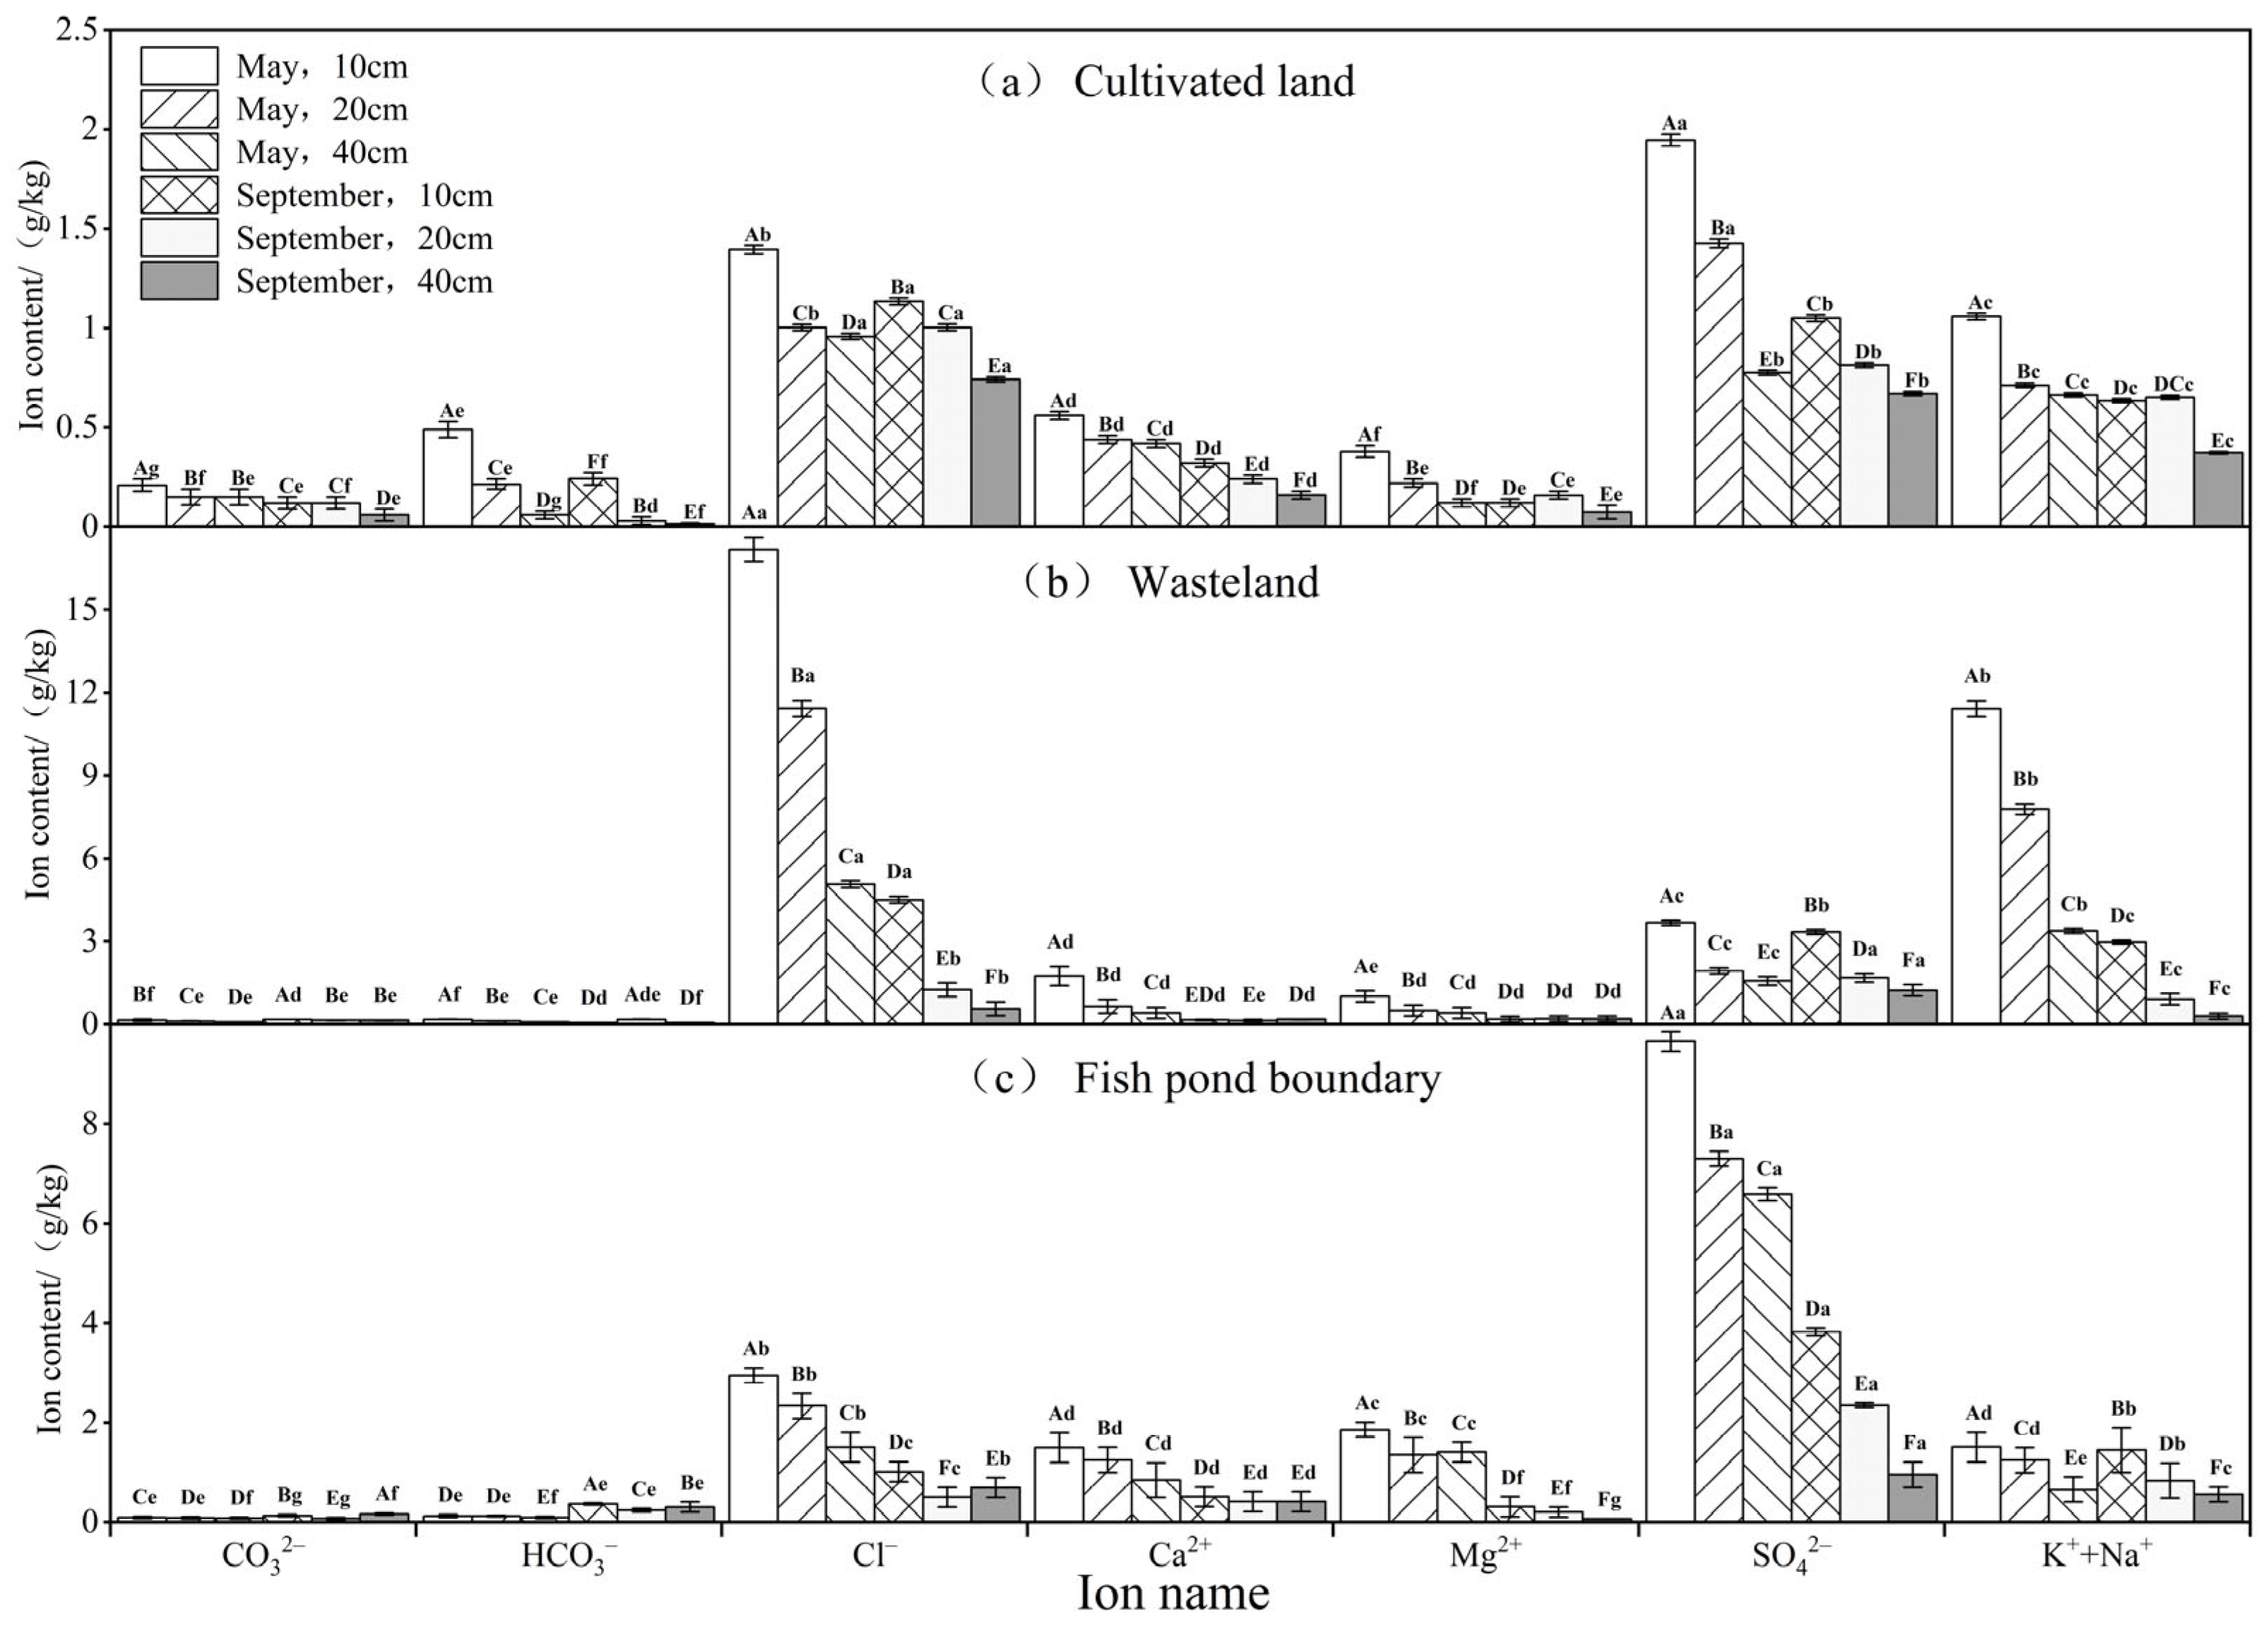
3.3. Characteristics of Soil Salt Ion Distribution in Cropland-Wasteland-Fishpond System

Figure 8 presents the ion contents at various soil depths and time periods at the boundaries of cropland, wasteland, and fishponds. In the figure, different uppercase letters denote significant differences (p < 0.05) in ion contents across different periods and soil depths for the same ions, while different lowercase letters indicate significant differences (p < 0.05) in ion contents among different ion levels within the same period and soil depth. In cropland soils, the cations were predominantly K⁺ and Na⁺, which together accounted for 56% of the total cations. The primary anion was SO₄²⁻, constituting 45% of the total anions. In wasteland soils, K⁺ and Na⁺ were the dominant cations, making up 82% of the total, while Cl⁻ was the main anion, representing 73% of the total anions. For soils bordering fishponds, K⁺ and Na⁺ were the major cations, contributing 38% of the total, followed by Mg²⁺ and Ca²⁺, which made up 32% and 30% of the total cations, respectively. Soil anions were primarily dominated by SO₄²⁻, which made up 74% of the total anions. The reason why soil cations in cropland, wasteland and fishpond borders are mainly dominated by K+ and Na+ may be that fertilizers widely used in agricultural production contain potassium and sodium elements, especially potash fertilizers and fertilizers containing sodium compounds (e.g., sodium sulfate, or sodium chloride), which release the corresponding ions into the soil after application and increase the content of potassium and sodium in the soil. The salt in the cropland in turn migrates with groundwater to the wasteland and fishpond boundaries leading to a consequent increase in potassium and sodium ions in the wasteland and fishpond boundaries. As fishpond water contains high levels of sulfate ions, the source of water may be through groundwater or direct contact with the soil, resulting in higher levels of sulfate ions than chloride ions at the boundaries of the fishpond. The wasteland has been left unmanaged for a long period of time, resulting in severe soil salinization, which will increase the chloride ion content in the soil because other ions in the soil combine with chloride ions to form salts during salinization, increasing the chloride ion content, and at the same time, salinization may lead to a decrease in the sulphate ion content of the soil because the sulphate ions may combine with sodium ions to form sodium sulphate that will be drenched away, resulting in the higher chloride ion content than sulfate ion content in wasteland.
As salts from cropland are leached into groundwater through irrigation, this groundwater eventually connects with that in adjacent wastelands, leading to increased salinity in the groundwater of these wastelands. The wasteland surfaces, exposed year-round, experience significant evaporation of surface water, which brings the salts from the groundwater to the soil and increases soil salinity. Conversely, in fishpond areas, the salinity of the groundwater decreases due to dilution from freshwater in the ponds, which lowers soil salinity at the fishpond borders. This results in reduced soil salinity in the fishpond areas compared to the more saline wasteland soils. The soil salinity of the salt wasteland was significantly higher than that of the cropland and the border of the fishpond. The salt content of the 0-10 cm layer is obviously higher than that of the deep soil, which is a typical salinized soil with surface aggregation.

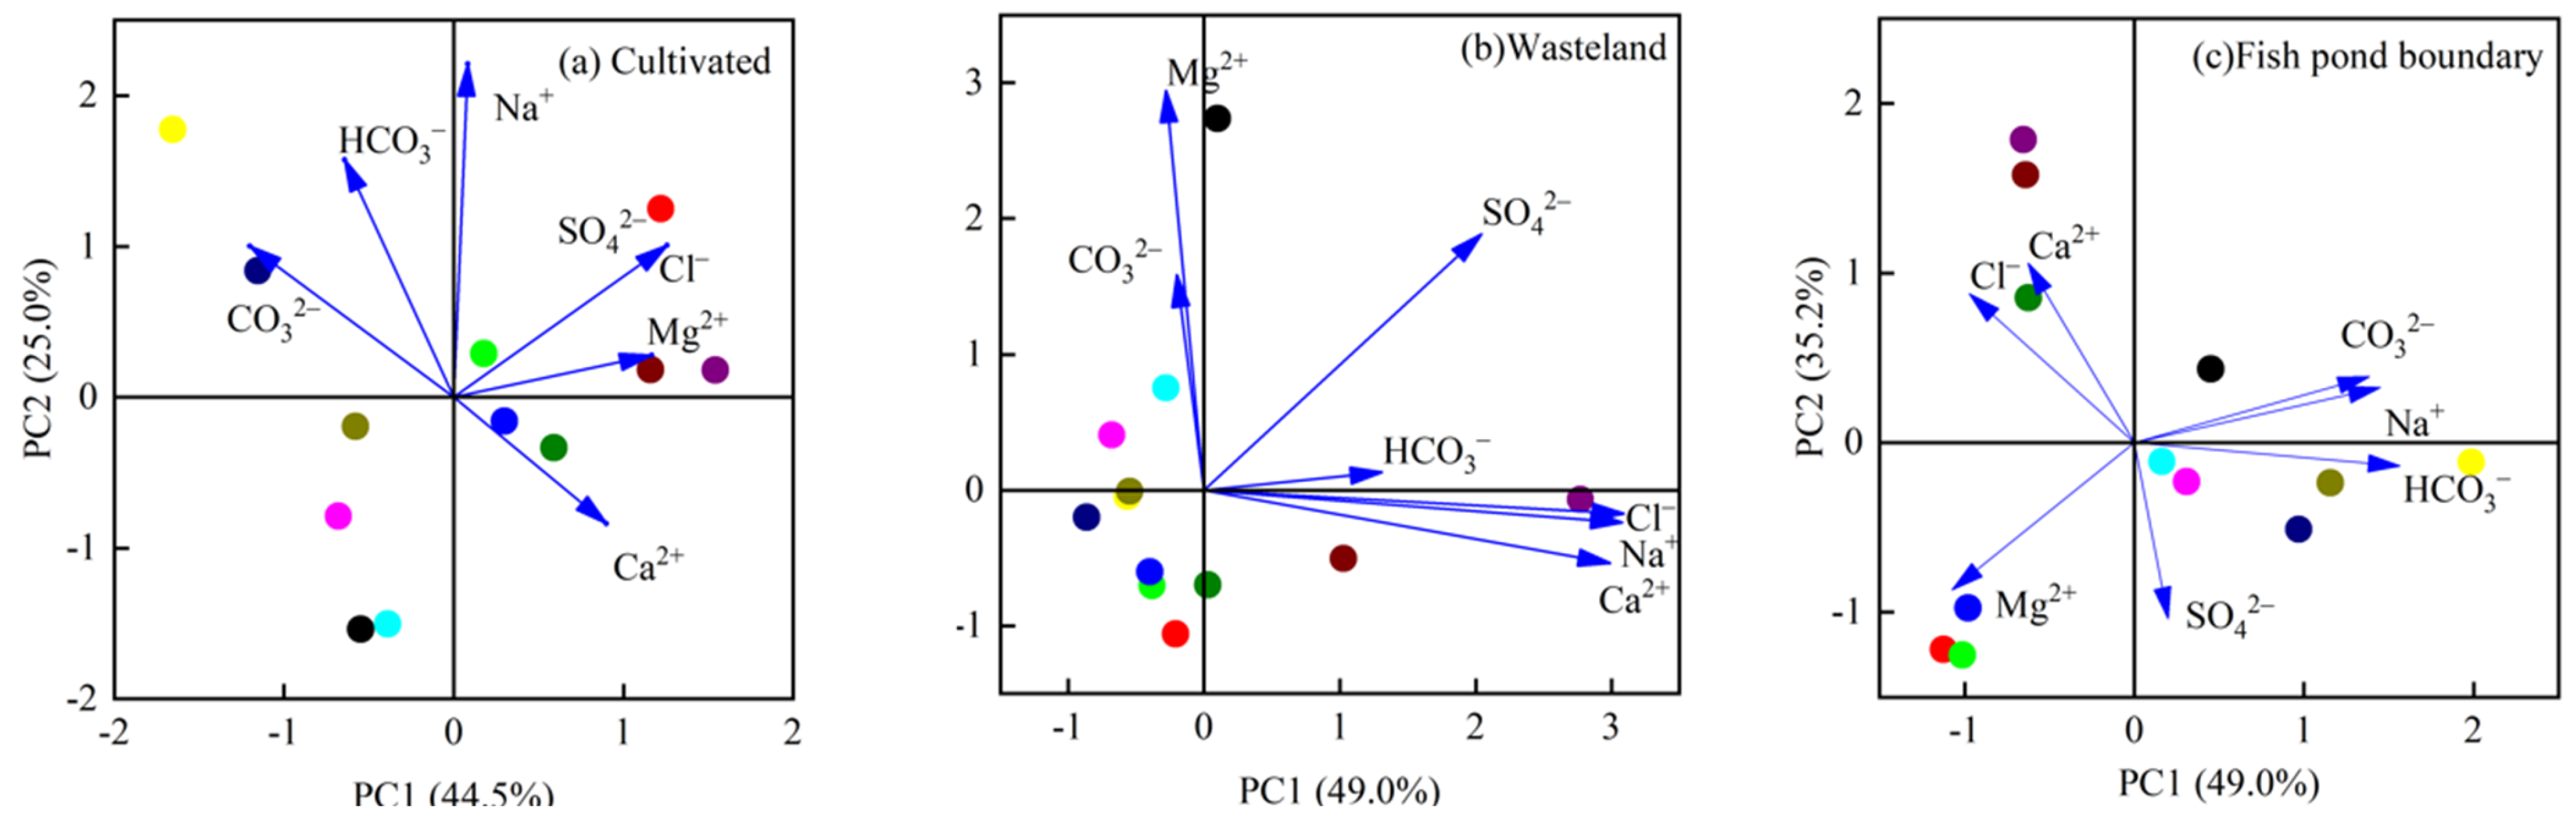
3.4. Identification of Master Ions for Soil Salt Accumulation in Cropland-Wasteland-Fishpond System

Principal component analysis was used to extract the main salt ions affecting soil salt accumulation and to calculate the eigenvalues, variance contribution, cumulative contribution, and factor scores for each ion and draw PCA diagram as shown in Figure 9. According to the eigenvalue (>1) for extraction, three principal components were extracted from the plowed land, and the first three principal components could reflect 86.0% of the information of the eight ions. It can be understood that the first principal component PC1 of them can reflect 44.5% of the information of the original variables, the second principal component PC2 can reflect 25.0%, and the third principal component PC3 can reflect 16.5%. As shown in Figure 9a, Cl⁻ and SO₄2⁻ have a significant impact on the first principal component, while HCO₃⁻ and Na⁺ + K⁺ predominantly influence the second principal component. HCO₃⁻ and Ca2⁺ are the primary contributors to the third principal component.
Three principal components are extracted from the wasteland, and the first three principal components can reflect 92.0% of the information of the eight ions. It can be understood that the first principal component PC1 of them can reflect 49.0% of the information of the original variables, the second principal component PC2 can reflect 23.3%, and the third principal component PC3 can reflect 19.7%. As can be seen in Figure 9b, Cl and Na++K+ have a significant impact on the first principal component, SO42− and Mg2+ have a significant influence on the second principal factor, CO32− and HCO3 have a significant influence on the third principal factor.
Three principal components were extracted from the fishpond boundary, and the first three principal components can reflect 94.1% of the information of the eight ions. It can be understood that the first principal component PC1 of them can reflect 49.0% of the information of the original variables, the second principal component PC2 can reflect 35.2%, and the third principal component PC3 can reflect 9.9%. As can be seen in Figure 9c, HCO3 and Na++K+ have a significant influence on the first principal factor, SO42− and Ca2+ have a significant influence on the second principal factor, SO42− and Ca2+ have a significant influence on the third principal factor.

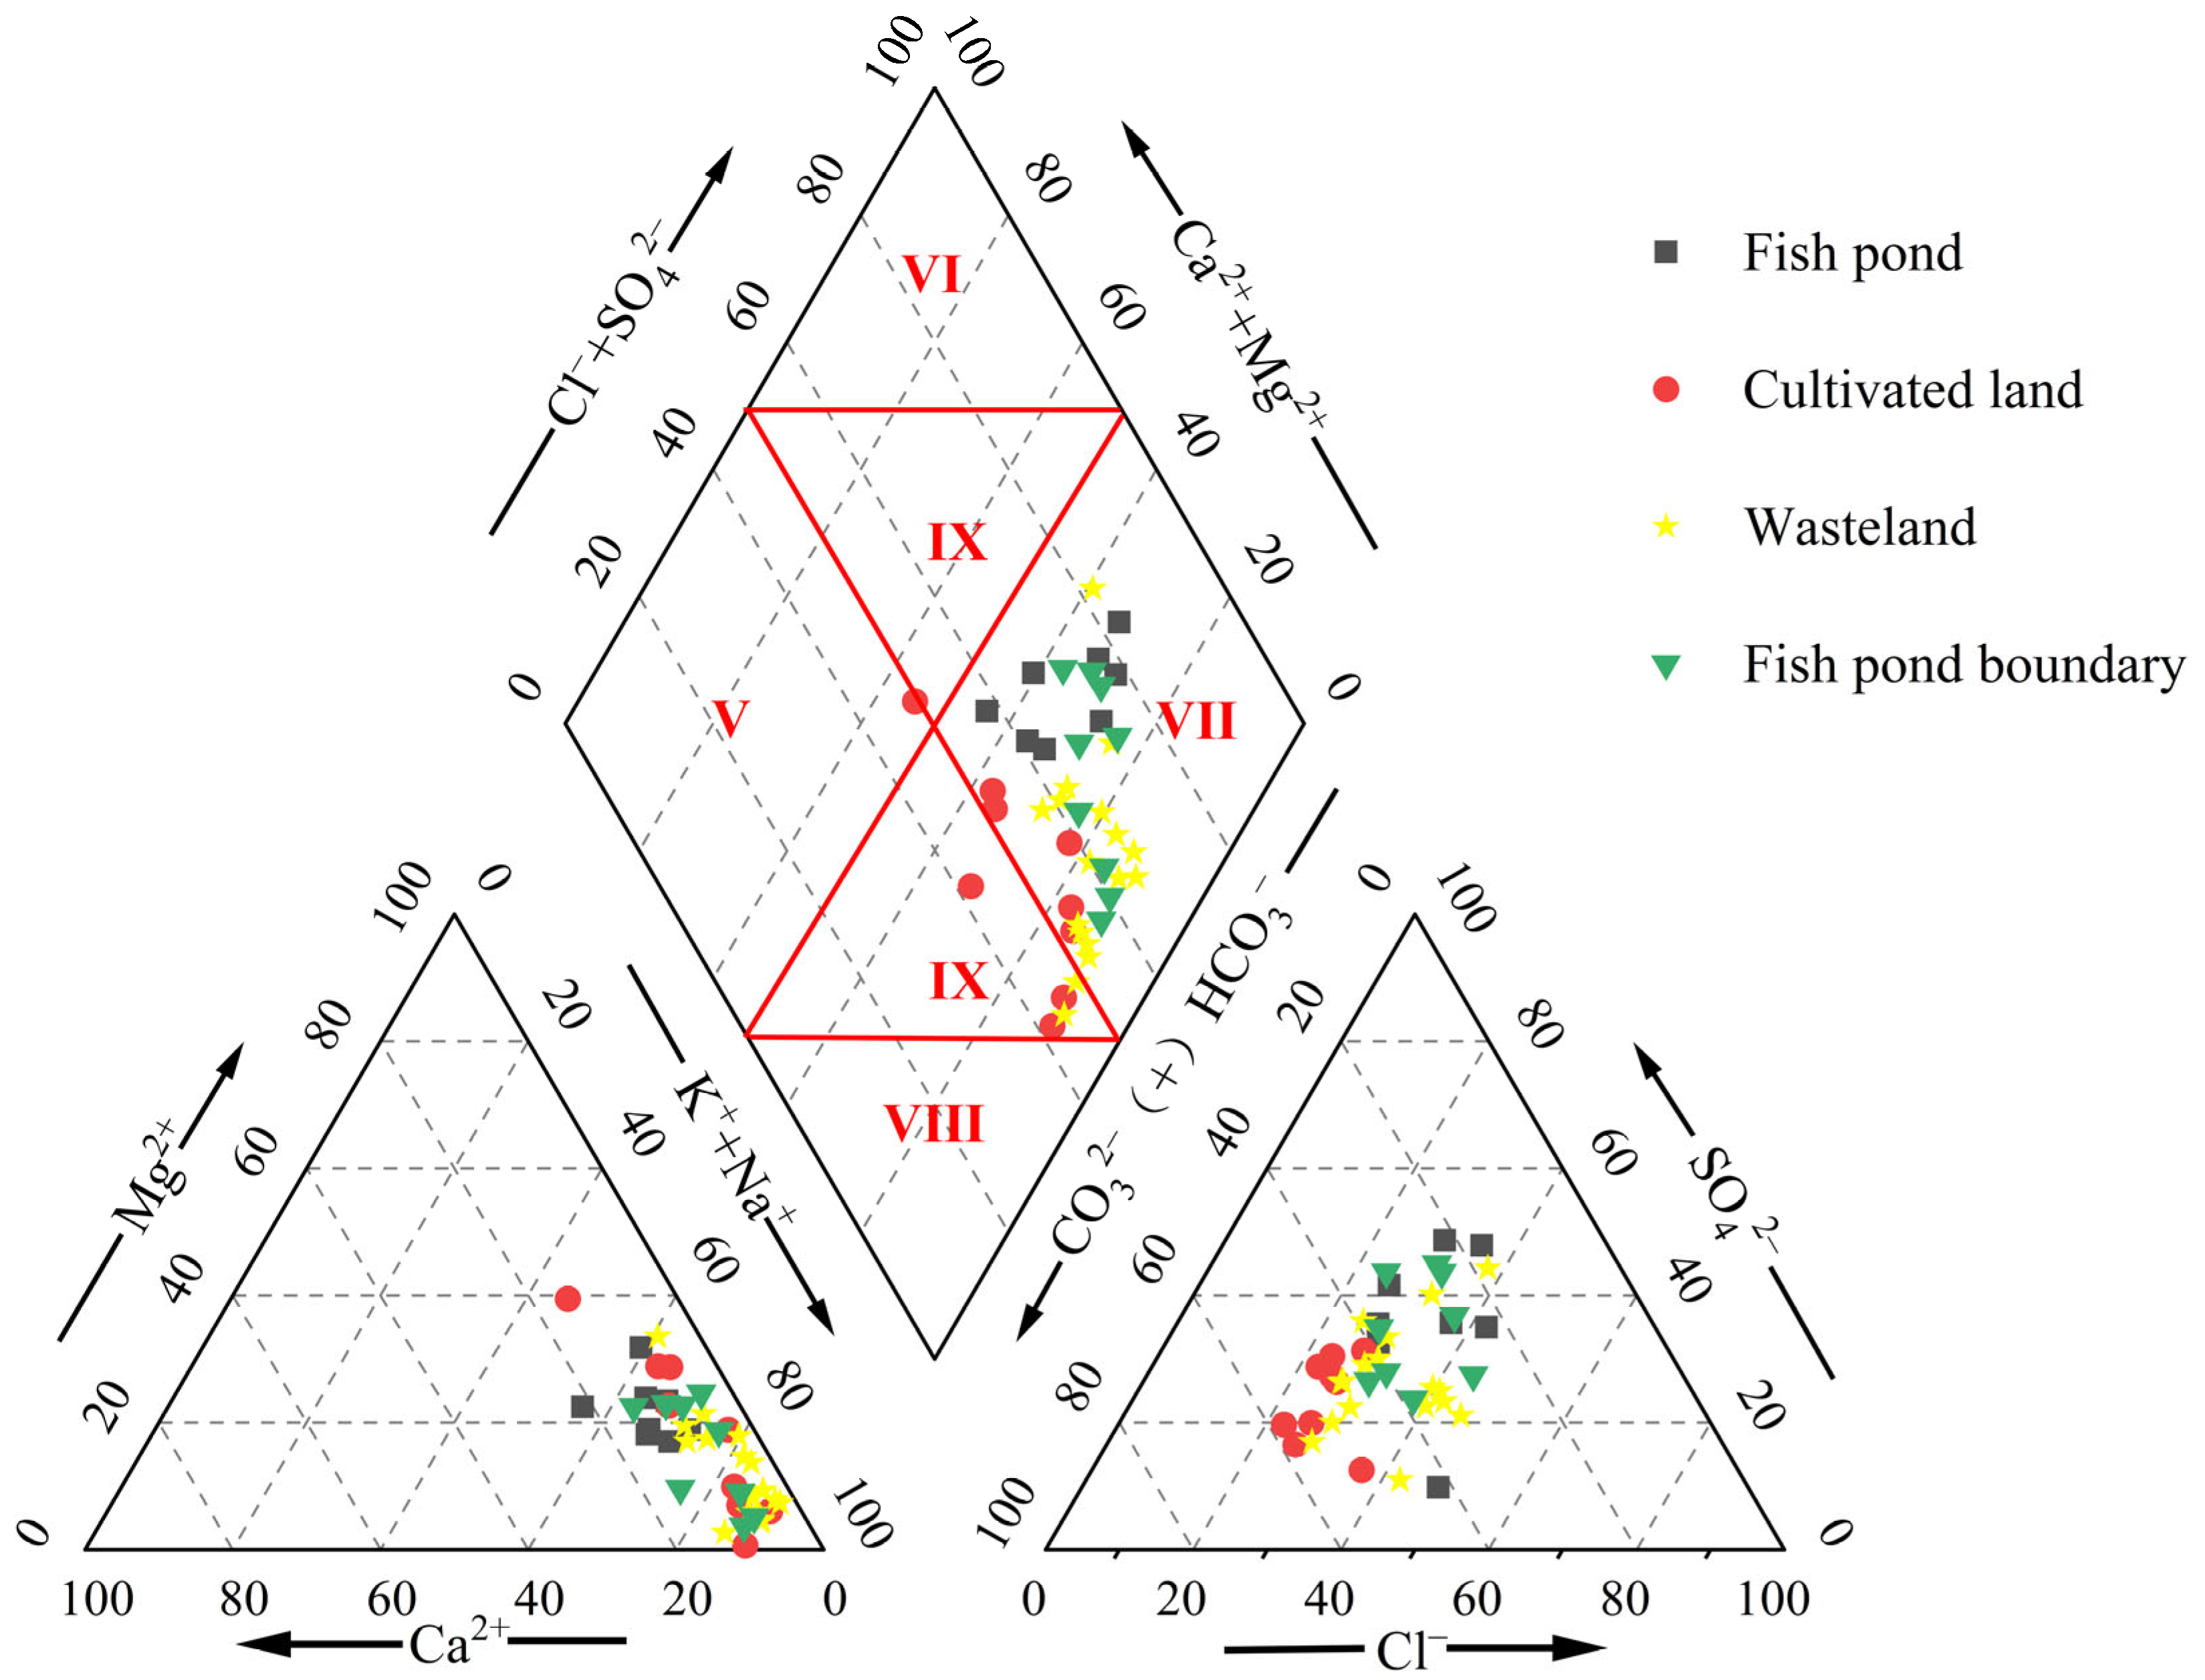
3.5. Groundwater Chemistry Types in Cropland-Wasteland-Fishpond Systems

The main factors influencing groundwater chemistry types include the lithology of the rocks through which the groundwater flows, the rate of runoff, geochemical reactions and human activities [26]. The trilinear diagram was proposed by Piper in 1944 and is expressed as a percentage of milligram equivalents per liter of the three most important groups of ions (Ca2+, Mg2+, Na++K+) and anions (Cl, SO42−, HCO3+CO32−) [27,28]. The diamond-shaped area of piper’s diagram is divided into zones V, VI, VII, VIII and IX, indicating Ca2+-HCO3 type, Ca2+-SO42− type, Na+-Cl type, Na+-HCO3 type and mixed type. As shown in Figure 10, it can be judged that the main groundwater chemical composition type in the study area is Na+-HCO3 type, and only a small portion of the cropland and wasteland groundwater chemical composition type is a mixed type. The major reason for this is that the chemical composition of groundwater in cropland is greatly affected by anthropogenic factors, while the groundwater in cropland migrates to wasteland, which leads to a slight difference in the results of the groundwater chemical analysis of cropland and wasteland.

4. Discussion

4.1. Analysis of Soil Salinity Changes

Soil salinity varies depending on soil type, water table, irrigation method, topography and other factors [29,30]. Therefore, analyzing the difference between soil salinity in a cropland–wasteland–fishpond system and other types of soil salinity is essential to study the effect of the cropland–wasteland–fishpond system on soil improvement. Yang et al. [31] obtained the mean values of soil salinity for four land types, namely, river, cropland, seashore and wasteland, from five years of soil salinity monitoring in the Shenwu Irrigation Basin, Inner Mongolia, which were 2.0 g/kg, 3.13 g/kg, 2.14 g/kg and 14.89 g/kg, respectively, whereas the mean values of soil salinity for cropland, wasteland and fishpond boundaries were 1.88 g/kg, 8.59 g/kg and 5.25 g/kg, respectively, for a cropland–wasteland–fishpond system over a two-year period were 1.88 g/kg, 8.59 g/kg and 5.25 g/kg, respectively, and the soil salinity of the plowed wasteland was significantly lower than that of the studied soil in Yang’s study. Wang et al. [32] by monitoring salinity indicators in the irrigation domain of Wulate, Inner Mongolia, concluded that the highest salt content was found in the 0–20 cm soil layer, and the soluble salt ions in the soil were mainly HCO3, SO42−, Cl and Na+. In the cropland–wasteland–fishpond system, the cations were all dominated by K++Na+, the anions in the soil bordering the cropland and fishponds were all dominated by SO42− and the anions in the wasteland soil were dominated by Cl, with a slightly different ion content, which may be related to the special geographic structure of the cropland–wasteland–fishponds. However, the soil salinity pattern was the same, and all of them showed high salt content in the surface layer. Wang et al. [33], exploring the spatial variability of soil salinity in the coastal saline–alkaline soils of the Yellow River Delta in China, found that, on a macro scale, soil salinity was relatively high, with significant variability in salinity across different soil layers; the farther from the sea, the lower the soil salinity. Wang et al. [34], using the Hydrus-1D model, investigated soil saline transport in the cropland–wasteland–fishpond system of the upper Yellow River Basin. They concluded that soil salinity accumulation was greater at the fishpond boundary compared to other areas, with a notable capillary bulge effect. The upper part of the boundary between wasteland and fishponds exhibited severe salinization, indicating the need for measures to prevent further soil salinization. However, within the cropland–wasteland–fishpond system, soil salinity decreases the closer one gets to the fishponds.

4.2. Analysis of Soil Salinity Improvement

The Hetao irrigation area experiences severe soil salinity due to a combination of factors, including climate, topography, soil parent material and human activities [35,36]. Therefore, in order to improve and prevent soil salinization, many scientists have done a lot of research. Dhaouadi et al. [37] pointed out that in dry and hot areas like the South of Tunisia, the availability of good quality water was very limited because of scarce precipitation, long dry seasons and high evaporation. The study also analyzed 28 water samples and showed that groundwater spatial variability is high and some of the water quality is suitable, but most of it is not suitable for irrigation. The study assessed the impact of water quality on agricultural soil fertility and recommended the use of drainage water quality assessment to improve the efficiency of land management, promote sustainable oasis agriculture and prevent land degradation. Vibhute et al. [38] pointed out that the alternation of fresh and brackish water drip irrigation can reduce the salinity stress induced by high salinity groundwater and also prevent the detrimental effects of canal water on the salinity of the soil. Fouladidorhani et al. [39] and other studies evaluated the use of agricultural waste as amendments, and their pyrolyzed products for saline, calcareous sandy loam soils. Results showed that bagasse, pinewood and rice hull pyrolysis at 300 °C significantly improved soil quality, reduced soil salinity and sodicity, and enhanced leaching potential over other treatments. A study by Westhoff et al. [40] evaluated the effects of phytoremediation on saline soils and showed that planting a mixture of maize and perennial grasses was effective at reducing soil conductivity and exchangeable sodium during high rainfall periods. However, a drop in the water table during dry periods reversed these effects. Zhu et al. [41] concluded that, under the combination of mulch cover and buried soil fiber layer (FM+BL), soil salinity showed an overall decreasing trend with the rainfall process, and that FM+BL had a significant effect on crop growth and yield improvement, and that FM+BL was an effective means of soil water conservation, blocking the accumulation of salts and improving the yield of cotton in the Yangtze River Delta region. Alghamdi [42] indicated that the use of Spirulina inoculated with humified legume compost is a promising and sustainable method that helps to improve inter-root soil properties and nutrient effectiveness, and promotes Na+ and Ca2+ exchangeability. Asadi Kapourchal et al. [43] investigated a 33,000-ha area with extremely high salinity by conducting two field-scale leaching experiments. They developed a practical model to estimate the leaching requirements, and their findings indicated that one pore volume of water was adequate to remove 85% of the salts from the soil profile in the study area. Stevenson et al. [44] evaluated the effectiveness of an integrated aquaculture and agriculture system by applying identical irrigation and fertilization practices to barley and cotton fields using both groundwater and wastewater from fishponds. They found that using fishpond wastewater had a positive impact on crop growth and yields compared to groundwater irrigation.
Currently, the relationship between fish farming and agriculture involves recycling water discharged from cropland into aquaculture systems. However, these discharges may sometimes contain pesticides and chemicals that could be detrimental to both fish and human health. In response to this problem, Elnwishy et al. [45] proposed that aquaculture and agribusiness systems can be developed in a complementary manner, where drainage water from aquaculture is recycled for agriculture. The findings indicated that using drainage water from fishponds for irrigation significantly enhanced soil quality and reduced soil salinity. Mandal [46] and others have proposed that in coastal areas, land shaping techniques, including farm ponds and paddy-cum-fish systems, can effectively tackle key challenges such as land degradation (salinization), drainage issues and shortages of freshwater for irrigation. These methods hold promise for boosting production, improving productivity and enhancing both income and employment prospects.
In this study, we chose the cropland–wasteland–fishpond system to explore the effect of fishponds on saline soils. Since the groundwater of fishponds, cropland and wasteland are interconnected, there is mutual migration of groundwater between them, and fishpond water migrates to cropland and wasteland when the water level of fishponds is higher than that of the cropland and wasteland, resulting in a rise of the groundwater level of the cropland and wasteland, thus exposing cropland and wasteland to the risk of aggravation of soil salinization, and this paper took this factor into account to monitor the soil salinity at the cropland–wasteland–fishpond boundary, and calculated the lateral migration of soil moisture between the cropland, wasteland and the fishpond. The results of the study showed that fishponds do not aggravate soil salinization in cropland and wasteland, but rather reduce soil salinity by diluting groundwater salinity in cropland and wasteland; the model of cropland–wasteland–fishpond can be adopted in the Hetao irrigation area in order to solve land degradation and to increase the incomes of farmers. This study is currently limited to the Loop Irrigation District and may subsequently extend the cropland–wasteland–fishpond system to areas outside the Loop Irrigation District to explore the scalability of the system and its applicability in different agro-ecological zones.

5. Conclusions

Due to the larger single irrigation volume for cropland in 2022, the lateral recharge from cropland to wasteland was significantly higher than the recharge from fishponds to wasteland, and also higher than the recharge from cropland to wasteland in 2023. Additionally, recharge from fishponds to their own boundary was higher than the recharge to wasteland. In 2023, with a reduced single irrigation volume, the lateral recharge from cropland to wasteland decreased, while the recharge from fishponds to their boundary increased relative to other areas.
The study area of cropland was desalted after two years of irrigation drenching, whereas wasteland showed salt accumulation, with the salt accumulation rate at the boundaries of the fishponds closer to the ponds being less than that of the wasteland. This results from significant water flows from cropland to wasteland (24 mm in spring and 15 mm in summer), from fishponds to wasteland (18 mm in spring and 9 mm in summer), and from fishponds to the fishpond boundaries (34 mm in spring and 21 mm in summer).
In the study area, the cations in the soil of cropland, wasteland and fishpond boundaries were predominantly K+ and Na+. The anions in the soil of cropland and fishpond boundaries were mainly SO42−, while the anions in the soil of wasteland were predominantly Cl. A principal component analysis identified the main salt ions affecting the amount of salt accumulation: Cl and SO42− influenced cropland, Cl and Na+ + K+ affected wasteland, and HCO3 and Na++ K+ were key for the boundaries of fishponds.

Author Contributions

Conceptualization, H.S. and C.Y.; methodology, C.Y.; validation, H.S., Q.M. and J.M.G.; formal analysis, J.M.G. and X.D.; investigation, C.Y., Z.H., C.H., H.Z. and Y.Z.; data curation, C.Y., Z.H., C.H., H.Z. and Y.Z.; writing—review and editing, C.Y.; visualization, X.D.; supervision, H.S. and Q.M.; project administration, H.S.; funding acquisition, H.S. All authors have read and agreed to the published version of the manuscript.

Funding

This research was funded by the Inner Mongolia Autonomous Region “Unveiling the List with Commanders” Project, China (2023JBGS0003), the “14th Five-Year Plan” National Key R&D Program, China (2021YFC3201202-05), the National Natural Science Foundation of China (52269014), and Project for Inner Mongolia revitalization by technology (NMKJXM202303-04).

Data Availability Statement

The original contributions presented in the study are included in the article, further inquiries can be directed to the corresponding author/s.

Conflicts of Interest

The authors declare no conflicts of interest.

References

  1. Shu, M.; Yu, Y.; Yin, M.; Wang, J.; Bandala, E.R.; Rodrigo-Comino, J. Super absorbent polymer (SAP) on water-salt transport in saline alkali soil: Effects of dosage, height and thickness. Eur. J. Soil Sci. 2024, 75, e13500. [Google Scholar] [CrossRef]
  2. Pessoa, L.G.; Freire, M.B.d.S.; Green, C.H.; Miranda, M.F.; de A Filho, J.C.; Pessoa, W.R. Assessment of soil salinity status under different land-use conditions in the semiarid region of Northeastern Brazil. Ecol. Indic. 2022, 141, 109139. [Google Scholar] [CrossRef]
  3. Ashraf, M.Y.; Ashraf, M.; Mahmood, K.; Akhter, J.; Hussain, F.; Arshad, M. Phytoremediation of saline soils for sustainable agricultural productivity. In Plant Adaptation and Phytoremediation; Springer: Dordrecht, The Netherlands, 2010; pp. 335–355. [Google Scholar]
  4. Zhao, H.; Gu, B.; Chen, D.; Tang, J.; Xu, X.; Qiao, Z.; Wang, J. Physicochemical properties and salinization characteristics of soils in coastal land reclamation areas: A case study of China-Singapore Tianjin Eco-City. Heliyon 2022, 8, e12629. [Google Scholar] [CrossRef]
  5. Sirpa-Poma, J.; Satgé, F.; Pillco Zolá, R.; Resongles, E.; Perez-Flores, M.; Flores Colque, M.; Molina-Carpio, J.; Ramos, O.; Bonnet, M.-P. Complementarity of Sentinel-1 and Sentinel-2 Data for Soil Salinity Monitoring to Support Sustainable Agriculture Practices in the Central Bolivian Altiplano. Sustainability 2024, 16, 6200. [Google Scholar] [CrossRef]
  6. Li, Z.; Liu, H.; Wang, T.; Gong, P.; Li, P.; Li, L.; Bai, Z. Deep vertical rotary tillage depths improved soil conditions and cotton yield for saline farmland in South Xinjiang. Eur. J. Agron. 2024, 156, 127166. [Google Scholar] [CrossRef]
  7. Chen, L.; Zhou, G.; Feng, B.; Wang, C.; Luo, Y.; Li, F.; Shen, C.; Ma, D.; Zhang, C.; Zhang, J. Saline–alkali land reclamation boosts topsoil carbon storage by preferentially accumulating plant-derived carbon. Sci. Bull. 2024; in press. [Google Scholar]
  8. Wang, J.; Yang, C.; Zhang, H.; Li, J. Improving soil properties by sand application in the saline-alkali area of the middle and lower reaches of the Yellow River, China. Sustainability 2023, 15, 9437. [Google Scholar] [CrossRef]
  9. Yang, X.; Sang, Y.; Wang, A. Study on the correlation coefficient and ecological function of eight ions and ecological factors in the fishpond of saline-alkali land. Shandong Fish. 2004, 21, 14–17. [Google Scholar]
  10. Li, M.; Zhang, W.; Wang, S.; Li, Y.; Zhao, Y. Suitable application of flue gas desulphurized gypsum to improve the sunflower yield in saline-alkali soil in the Hetao irrigation areas of Inner Mongolia Trans. Chin. Soc. Agric. Eng. 2022, 38, 89–95. [Google Scholar]
  11. Li, C.; Feng, H.; Luo, X.; Li, Y.; Wang, N.; Wu, W.; Zhang, T.; Siddique, K.H. Limited irrigation and fertilization in sand-layered soil increases nitrogen use efficiency and economic benefits under film mulched ridge-furrow irrigation in arid areas. Agric. Water Manag. 2022, 262, 107406. [Google Scholar] [CrossRef]
  12. Wen, Y.; Wan, H.; Shang, S.; Rahman, K.U. A monthly distributed agro-hydrological model for irrigation district in arid region with shallow groundwater table. J. Hydrol. 2022, 609, 127746. [Google Scholar] [CrossRef]
  13. Al-Tamimi, M.; Green, S.; Abou Dahr, W.; Al-Muaini, A.; Lyra, D.; Ammar, K.; Dawoud, M.; Kenyon, P.; Kemp, P.; Kennedy, L. Salt dynamics, leaching requirements, and leaching fractions during irrigation of a halophyte with different saline waters. Soil Res. 2023, 62, SR23173. [Google Scholar] [CrossRef]
  14. Ngabire, M.; Wang, T.; Xue, X.; Liao, J.; Sahbeni, G.; Huang, C.; Duan, H.; Song, X. Soil salinization mapping across different sandy land-cover types in the Shiyang River Basin: A remote sensing and multiple linear regression approach. Remote Sens. Appl. Soc. Environ. 2022, 28, 100847. [Google Scholar] [CrossRef]
  15. Gangwar, R.; Makádi, M.; Demeter, I.; Táncsics, A.; Cserháti, M.; Várbíró, G.; Singh, J.; Csorba, Á.; Fuchs, M.; Michéli, E. Comparing soil chemical and biological properties of salt affected soils under different land use practices in Hungary and India. Eurasian Soil Sci. 2021, 54, 1007–1018. [Google Scholar] [CrossRef]
  16. Ao, C.; Jiang, D.; Bailey, R.T.; Dong, J.; Zeng, W.; Huang, J. Water, Salt, and Ion Transport and Its Response to Water-Saving Irrigation in the Hetao Irrigation District Based on the SWAT-Salt Model. Agronomy 2024, 14, 953. [Google Scholar] [CrossRef]
  17. Yuan, H.; Yang, S.; Wang, B. Hydrochemistry characteristics of groundwater with the influence of spatial variability and water flow in Hetao Irrigation District, China. Environ. Sci. Pollut. Res. 2022, 29, 71150–71164. [Google Scholar] [CrossRef]
  18. Mora, J.; Herrero, J.; Weindorf, D.C. Multivariate analysis of soil salination-desalination in a semi-arid irrigated district of Spain. Geoderma 2017, 291, 1–10. [Google Scholar] [CrossRef]
  19. Liu, Y.; Wu, J.; Zhao, H.; Li, C.; Mao, J.; Zhang, R.; Liu, J.; Zhao, Q. Ions Transport in Seasonal Frozen Farmland Soil and Its Effect on Soil Salinization Chemical Properties. Agronomy 2023, 13, 660. [Google Scholar] [CrossRef]
  20. Wang, Y.; Liu, X.; Hu, X. Water and salt distribution and salt accumulation characteristics of cultivated land-barren land-sandy land in salinization irrigation area. Agric. Res. Arid Areas 2020, 38, 207–214. [Google Scholar]
  21. Xu, X.; Duan, X.; Dawson, R.; Liu, Y.; He, Y.; Peng, H.; Cui, C. Effects of Lucc Resulting from Tffp Land Usepattern in the Yellow River Delta, China. In Computer and Computing Technologies in Agriculture II, Volume 1: The Second IFIP International Conference on Computer and Computing Technologies in Agriculture (CCTA2008), October 18-20, 2008, Beijing, China 2; Springer: Boston, MA, USA, 2009; pp. 431–441. [Google Scholar]
  22. Ayyam, V.; Palanivel, S.; Chandrakasan, S.; Ayyam, V.; Palanivel, S.; Chandrakasan, S. Approaches in land degradation management for productivity enhancement. In Coastal Ecosystems of the Tropics-Adaptive Management; Springer: Singapore, 2019; pp. 463–491. [Google Scholar]
  23. Yu, C.; Shi, H.; Miao, Q.; Gonçalves, J.M.; Yan, Y.; Hu, Z.; Hou, C.; Zhao, Y. Water–Salt Migration Patterns among Cropland–Wasteland–Fishponds in the River-Loop Irrigation Area. Agronomy 2024, 14, 107. [Google Scholar] [CrossRef]
  24. Zhao, Y.; Shi, H.; Miao, Q.; Yang, S.; Hu, Z.; Hou, C.; Yu, C.; Yan, Y. Analysis of Spatial and Temporal Variability and Coupling Relationship of Soil Water and Salt in Cultivated and Wasteland at Branch Canal Scale in the Hetao Irrigation District. Agronomy 2023, 13, 2367. [Google Scholar] [CrossRef]
  25. Wang, G.; Shi, H.; Li, X.; Yan, J.; Miao, Q.; Li, Z.; Akae, T. A study on water and salt transport, and balance analysis in sand dune–wasteland–lake systems of Hetao Oases, upper reaches of the Yellow River Basin. Water 2020, 12, 3454. [Google Scholar] [CrossRef]
  26. Zhang, M.; Zhu, S.; Zeng, H.; Pang, Y. Spatial and Seasonal Geochemical Characteristics and Contamination Assessment of Groundwater in Maofeng Mountain Area. Environ. Eng. 2018, 36, 135–139. [Google Scholar] [CrossRef]
  27. Yu, H.; Gui, H.; Zhao, H.; Wang, M.; Li, J.; Fang, H.; Jiang, Y.; Zhang, Y. Hydrochemical characteristics and water quality evaluation of shallow groundwater in Suxian mining area, Huaibei coalfield, China. Int. J. Coal Sci. Technol. 2020, 7, 825–835. [Google Scholar] [CrossRef]
  28. Liu, M.; Xiao, C.; Liang, X.; Wei, H. Response of groundwater chemical characteristics to land use types and health risk assessment of nitrate in semi-arid areas: A case study of Shuangliao City, Northeast China. Ecotoxicol. Environ. Saf. 2022, 236, 113473. [Google Scholar] [CrossRef] [PubMed]
  29. Bandak, S.; Movahedi-Naeini, S.A.; Mehri, S.; Lotfata, A. A longitudinal analysis of soil salinity changes using remotely sensed imageries. Sci. Rep. 2024, 14, 10383. [Google Scholar] [CrossRef]
  30. Kulmatov, R.; Khasanov, S.; Odilov, S.; Li, F. Assessment of the space-time dynamics of soil salinity in irrigated areas under climate change: A case study in Sirdarya province, Uzbekistan. Water Air Soil Pollut. 2021, 232, 1–13. [Google Scholar] [CrossRef]
  31. Yang, S.; Miao, Q.; Shi, H.; Zhao, Y.; Liu, X.; Nie, X.; Feng, W.; Gonçalves, J.M.; Zhang, T.; Li, Y. Spatial and temporal heterogeneity of soil salinity and ionic coupling relationship under the water-saving renovation of a typical irrigation district in arid and semi-arid areas. Sci. Total Environ. 2024, 951, 175776. [Google Scholar] [CrossRef]
  32. Wang, R.; Wan, H.; Chen, S.; Xia, Y.; Bai, Q.; Peng, Z.; Shang, S. Spatial distribution pattern of soil salinization in farmland of Wulate sub-irrigation areas in Hetao Irrigation District in Inner Mongolia in spring. Trans. Chin. Soc. Agric. Eng 2021, 37, 105–113. [Google Scholar]
  33. Wang, Z.; Zhao, G.; Gao, M.; Chang, C. Spatial variability of soil salinity in coastal saline soil at different scales in the Yellow River Delta, China. Environ. Monit. Assess. 2017, 189, 1–12. [Google Scholar] [CrossRef]
  34. Wang, G.S.; Xu, B.; Tang, P.C.; Shi, H.B.; Tian, D.L.; Zhang, C.; Ren, J.; Li, Z.K. Modeling and Evaluating Soil Salt and Water Transport in a Cultivated Land-Wasteland-Lake System of Hetao, Yellow River Basin’s Upper Reaches. Sustainability 2022, 14, 14410. [Google Scholar] [CrossRef]
  35. Mengmeng, H.; Juanle, W.; Baomin, H. Spatial-temporal variation and attribution of salinization in the Yellow River Basin from 2015 to 2020. Int. J. Digit. Earth 2023, 16, 446–463. [Google Scholar] [CrossRef]
  36. Ramos, T.B.; Liu, M.; Paredes, P.; Shi, H.; Feng, Z.; Lei, H.; Pereira, L.S. Salts dynamics in maize irrigation in the Hetao plateau using static water table lysimeters and HYDRUS-1D with focus on the autumn leaching irrigation. Agric. Water Manag. 2023, 283, 108306. [Google Scholar] [CrossRef]
  37. Dhaouadi, L.; Besser, H.; Karbout, N.; Khaldi, R.; Haj-Amor, Z.; Maachia, S.; Ouassar, F. Environmental sensitivity and risk assessment in the Saharan Tunisian oasis agro-systems using the deepest water table source for irrigation: Water quality and land management impacts. Environ. Dev. Sustain. 2022, 24, 10695–10727. [Google Scholar] [CrossRef]
  38. Vibhute, S.D.; Chinchmalatpure, A.R.; TV, V.; Kumar, S.; Gorain, B.; Prasad, I.; Camus, D.D.; Shukla, M. Alternate use of fresh and saline waters to improve water productivity and soil sustainability of drip irrigated wheat in a semi-arid region. Arid Land Res. Manag. 2024, 1–20. [Google Scholar] [CrossRef]
  39. Fouladidorhani, M.; Shayannejad, M.; Shariatmadari, H.; Mosaddeghi, M.R.; Arthur, E. Pyrolysis of different organic feedstock combinations as soil amendments enhances the reclamation of saline-sodic soil. Soil Tillage Res. 2024, 238, 105993. [Google Scholar] [CrossRef]
  40. Westhoff, S.; Reese, C.; Bruggeman, S.; Moriles-Miller, L.; Perkins, L.; Joshi, D.; Marzano, S.; Clay, D. Phytoremediation and high rainfall combine to improve soil and plant health in a North America northern great plains saline sodic soil. J. Soil Water Conserv. 2022, 77, 381–388. [Google Scholar]
  41. Zhu, W.; Yang, J.; Yao, R.; Xie, W.; Wang, X.; Liu, Y. Soil water-salt control and yield improvement under the effect of compound control in saline soil of the Yellow River Delta, China. Agric. Water Manag. 2022, 263, 107455. [Google Scholar] [CrossRef]
  42. Alghamdi, S.A.; Alharby, H.F.; Abdelfattah, M.A.; Mohamed, I.A.; Hakeem, K.R.; Rady, M.M.; Shaaban, A. Spirulina platensis-inoculated humified compost boosts rhizosphere soil hydro-physico-chemical properties and Atriplex nummularia forage yield and quality in an arid saline calcareous soil. J. Soil Sci. Plant Nutr. 2023, 23, 2215–2236. [Google Scholar] [CrossRef]
  43. Asadi Kapourchal, S.; Homaee, M. Minimizing freshwater usage for quality improvement of saline soils in semi-arid regions. Irrig. Drain. 2022, 71, 1240–1253. [Google Scholar] [CrossRef]
  44. Stevenson, K.T.; Fitzsimmons, K.M.; Clay, P.A.; Alessa, L.; Kliskey, A. Integration of aquaculture and arid lands agriculture for water reuse and reduced fertilizer dependency. Exp. Agric. 2010, 46, 173–190. [Google Scholar] [CrossRef]
  45. Elnwishy, N.H.; Ramadhane, M.S.; Zalat, S.M. Combating desertification through fish farming. In The Future of Drylands: International Scientific Conference on Desertification and Drylands Research Tunis, Tunisia, 19–21 June 2006; Springer: Dordrecht, The Netherlands, 2008; pp. 507–518. [Google Scholar]
  46. Mandal, S.; Sarangi, S.; Burman, D.; Bandyopadhyay, B.; Maji, B.; Mandal, U.; Sharma, D. Land shaping models for enhancing agricultural productivity in salt affected coastal areas of West Bengal–an economic analysis. Indian J. Agric. Econ. 2013, 68, 389–401. [Google Scholar]
Figure 1. Rainfall and temperature, 2022–2023.
Agronomy 14 02110 g001
Figure 2. Diagram showing the distribution of the study area and sampling locations. (where A in the subplot represents cultivated land, B represents wasteland, and C represents the fishpond boundary).
Agronomy 14 02110 g002
Figure 3. Physical properties of soil at typical sample sites in the study area.
Agronomy 14 02110 g003
Figure 4. Groundwater bathymetry dynamics.
Agronomy 14 02110 g004
Figure 5. Soil water storage between different land types.
Agronomy 14 02110 g005
Figure 6. Calculation of water balance of cropland–wasteland–fishpond boundary in different periods.
Agronomy 14 02110 g006
Figure 7. Salt content and desalination rate in different soil layers from 2022 to 2023.
Agronomy 14 02110 g007
Figure 8. Soil ion content in the test area.
Agronomy 14 02110 g008
Figure 9. PCA mapping between different land classes (where (a) represents cultivated land, (b) represents wasteland, and (c) represents fishponds, and different colors represent different samples).
Agronomy 14 02110 g009
Figure 10. Groundwater chemistry Piper trilinear map.
Agronomy 14 02110 g010
Table 1. Average content of chemical characteristics of groundwater.
CategoryCO32−
(g/L)
HCO3
(g/L)
Cl
(g/L)
Ca2+
(g/L)
Mg2+
(g/L)
SO42−
(g/L)
K++Na+
(g/L)
TDS
(g/L)
Cropland21.48 132.84 80.02 23.16 50.27 76.08 237.00 2.25
Wasteland23.14 136.05 138.12 21.97 48.39 103.76 330.70 2.62
Fishpond boundary14.63 77.94 86.50 21.26 40.66 92.40 209.55 1.95
Fish pond10.21 42.95 62.76 22.55 40.33 68.14 121.19 0.84
Table 2. Irrigation regimes in the study area in 2022 and 2023.
Particular YearIrrigation PeriodFlooding Quota/mmDate of Irrigation
2022Spring irrigation11011 May
2023Fertility irrigation8020 June
9518 July
7010 August
Disclaimer/Publisher’s Note: The statements, opinions and data contained in all publications are solely those of the individual author(s) and contributor(s) and not of MDPI and/or the editor(s). MDPI and/or the editor(s) disclaim responsibility for any injury to people or property resulting from any ideas, methods, instructions or products referred to in the content.

