Article

Field Evaluation of Urea Fertilizers Enhanced by Biological Inhibitors or Dual Coating

Department of Plant Science, The Pennsylvania State University, University Park, PA 16802, USA
*
Author to whom correspondence should be addressed.
Agronomy 2024, 14(9), 2118; https://doi.org/10.3390/agronomy14092118 (registering DOI)
Submission received: 5 July 2024 / Revised: 9 September 2024 / Accepted: 13 September 2024 / Published: 17 September 2024
(This article belongs to the Special Issue Advances in Application Effects and Mechanisms of Fertilizer Products)

Abstract

:
Relative to soluble N sources, enhanced-efficiency fertilizers (EEFs) support steady turfgrass growth and dense canopy quality while abating N loss as nitrate, ammonia, and/or N2O from turfgrass systems. Modern EEFs provide turfgrass managers greater operational effect and versatility in their nutrient management efforts and compel field characterization of their temporal response. Likewise, field confirmation of commercial EEF nutrient recovery helps stakeholders select the appropriate EEF for their specific application. Our research objective was to quantify the temporal response of Kentucky bluegrass growth/yield, canopy density and color, and fertilizer N recovery to a practical application of conventional urea or an enhanced-efficiency granular fertilizer. In May 2014 and June 2018, Kentucky bluegrass plots were fertilized by granules of conventional urea, N-(n-butyl) thiophosphoric triamide (NBPT)-, and dicyandiamide (DCD)-stabilized urea, or polymer-/sulfur-coated urea (PSCU) at a N rate of 43.9 kg ha−1 (0.9 lbs/1000 sq. ft.). The dependent variable response over the two growing seasons was highly affected by efficiency enhancement. Following the repeated 16.5-week evaluations, the mean percent of fertilizer N recovered from conventional urea, stabilized urea, and PSCU totaled 57.5, 68.4, and 89.1%, respectively. In the 23 to 51 days from treatment (DFT), recovery of PSCU-N significantly exceeded that from conventional or stabilized urea.

1. Introduction

Of all the mineral nutrients required by plants, nitrogen (N) is accumulated in the greatest quantity. Due to its low unit-N cost and salt index, urea remains a popular soluble N fertilizer. However, application of urea to turfgrass often results in deleterious volatilization of ammonia (NH3). While direct urea assimilation by plant roots and vegetation is preferred, a true myriad of potential fates await urea N fertilizer applied to turfgrass. But as a product of arginine metabolism, the presence of cytoplasmic urea is not reliant on urea assimilation. Rather, ornithine-cycled urea is exported from the mitochondria before being hydrolyzed by urease in the cytoplasm [1]. Next, the urea-derived NH4 is assimilated into glutamine via glutamine synthetase, and then catalyzed to glutamic acid by glutamate synthase [2].
Thus, despite numerous omissions in current textbook editions and statements to the contrary in recent journal articles, urea is a plant-available form of N. Specifically, high-affinity membrane transport of urea into roots is facilitated by the proton/urea symporter AtDUR3, while low-affinity (gradient-driven) assimilation by root and/or shoot tissue is mediated by aquaporins comprised of plasma-membrane-intrinsic proteins (PIPs) [3,4,5,6]. In the 48 h following a foliar urea N application of 50 kg ha−1, assimilation by perennial ryegrass (Lolium perenne L.) exceeded 17 kg ha−1 [7].
Alternatively, urea fertilizer is hydrolyzed into ammonia and carbon dioxide by urease [8], an enzyme ubiquitous to soil, thatch, and turfgrass vegetation surfaces [9]. Exactly where urea is hydrolyzed strongly influences the fate of its products [10]. Accordingly, best management practice (BMP) includes physical soil incorporation and/or prompt but judicious ‘watering-in’ of urea fertilizer applications to turfgrass [11,12,13,14,15,16]. Yet, given the perennial nature of turfgrass, the opportunity for mechanical incorporation is often limited. Likewise, current soil water status or clientele playability expectations may preclude concomitant irrigation following granular urea N fertilizer treatment. As a result, the industry has adopted two fertilizer efficiency enhancements to prevent rapid hydrolysis of plant-available urea.
The first is the complementation, or stabilization, of urea by biological inhibiters. An effective and commonly employed biological inhibitor of urease is N-(n-butyl) thiophosphoric triamide (NBPT, C4H14N3PS) [17]. In the presence of oxygen, this polar alkane transforms to N-(n-butyl) phosphorotriamide [18] and inhibits urease activity by forming a tridental bond shielding its active site [19]. A novel meta-analysis of agricultural and horticultural research shows NBPT-amended urea results in a near 50% reduction in NH3 loss relative to broadcast application of urea [20]. Later evaluations assessing NH3 volatilization from 100+ kg ha−1 urea N applications confirm the benefits of 2 g kg−1 NBPT complementation [21,22,23].
The second urea fertilizer efficiency enhancement is the physical coating of granular prills [16,24]. Sulfur-coated urea (SCU) was the first mass-produced coated fertilizer by which plant exposure to urea required failure/rupture of the sulfur coating [25]. Elemental sulfur serves as an inexpensive, biodegradable acidulent that facilitates plant recovery of urea N in neutral to alkaline soil [26]. Later addition of a thin thermoplastic or resin coating around SCU granules improved the coating stability without further diluting its N content [27]. These polymer-/sulfur-coated urea (PSCU) fertilizers feature more dependable release rates than urea–formaldehyde reaction products or first-generation SCU granulars [28,29].
Recent research reveals that relative to soluble N sources, enhanced-efficiency fertilizers (EEF) support turfgrass nutrition, quality, and vigor while reducing N loss as nitrate [30,31], ammonia [32,33], and N2O from turfgrass systems [34,35,36,37]. Meanwhile, a core element of professional turfgrass management remains operational efficiency through technological innovation. Specifically, this includes controlled-release technologies that extend the duration of nutrient release from a single given EEF application [38]. Our research objective was to quantify the temporal response of Kentucky bluegrass growth/yield, canopy density and color, and fertilizer N recovery to a single, practical application of conventional urea or enhanced-efficiency granular fertilizer.

2. Materials and Methods

A Kentucky bluegrass (Poa pratensis L. ‘Midnight’) system, established by sod in a Hagerstown silt loam (fine, mixed, semiactive, mesic Typic Hapludalfs) in 2012, has since been maintained within the J. Valentine Turfgrass Research Center (University Park, PA, USA).
In April and May 2014, clippings were removed from plots mowed at a 3 cm height of cut on 7 ± 3 d intervals. Soil sampled from the upper 15 cm of the profile in April 2014 indicated neutral soil reaction (7.0 pH) and Mehlich-3 soil-extractable Ca, K, Mg, and P levels of 1360, 156, 219, and 87 mg kg−1, respectively. A 1:2.5 H2O extraction revealed nondetectable levels of soil ammonium or nitrate (<4 mg kg−1). An early-May maintenance fertilizer treatment supplied 30 kg Mg, 60 kg S, and 50 kg K ha−1.
Following one described mowing on 13 May, a randomized complete block design was installed. The 1.83 × 1.22 m plots in the five (5) replicate blocks were separated by a 661 cm boundary. An unfertilized control plot (0 kg N) was randomly assigned to one plot in each block. Pre-weighed, half-plot portions of each of the three (3) granular fertilizer treatments were prepared in ten labeled vials.
The three fertilizer treatments, sharing a particle diameter range of 2.2 ± 0.2 mm, were as follows: conventional urea (Alfa-Aesar, Ward Hill, MA, USA), polymer-/sulfur-coated urea (XCU, Nu-Tec Specialty Products, Putnam, ON, Canada), and stabilized urea (UMAXX, Koch Agronomic Services, Wichita, KS, USA). The XCU (43-0-0) urea fertilizer is enhanced by a polymer inner coat and a combination wax/elemental sulfur (40 g S kg−1) outer coat. The UMAXX (46-0-0) stabilized urea fertilizer is enhanced by dicyandiamide (DCD) and N-butyl-thiophosphoric triamide (NBPT) biological inhibitors at a respective 21 and 0.9 g kg−1 mass fraction.
Using a 0.92 × 1.22 m plywood ‘randomizer’ frame [39], fertilizer in each vial was uniformly distributed at a 43.9 kg ha−1 N rate (0.9 lbs N 1000 ft−2) over each half-plot. Following application of all fertilizers on 13 May, the granular treatments were activated by 1 cm of precipitation.
A fabricated harness and ‘mini-bagger’ were installed on a 56 cm rotary mower (Model JS60, John Deere Co., Moline, IL, USA) to collect clipping yields from a center strip of each plot at 7, 14, 22, 28, 35, 44, 52, 59, 68, 77, 87, 96, 106, 113, and 120 days from treatment (DFT) in 2014. Once complete, the factory bagger was reinstalled, and the remaining sward mowed (clippings removed).
Clipping bags were promptly transferred to a convection oven (65 °C) and dried to constant mass. Each dry clipping sample mass was then logged with 1 mg resolution [40]. For every plot, a 1.0 g clipping subsample of the first and second yields, third and fourth yields, and ultimately eleventh and twelfth yields was pooled and ground to pass a 500 μm sieve. The thirteenth yield, collected 27 August 2014, was ground as described and retained as a single sample. The last two yields, collected 3 and 10 September 2014, were pooled and ground as the fourteenth yield (designated 116.5 DFT). Reagent-grade EDTA (as a standard reference) and the ground clipping samples were assessed for total nitrogen by dynamic flash combustion and thermal conductivity detection under He purge (EA-1110 CHNS, CE Instruments, Milan, Italy).
On a per-plot basis, N offtake (kg N ha−1) was computed as the product of each collected yield and its pooled tissue N (equal to the earlier or later collected date). Fertilizer N recovery (kg FN ha−1) for each plot and DFT was determined by subtracting the ‘within-block’ control plot N offtake [33]. Negative fertilizer N recoveries were replaced with zeroes before statistical analysis. Percent fertilizer N recovery (%FNR) is expressed as the quotient of cumulative fertilizer N recovery (kg FN ha−1) from the original 43.9 kg FN ha−1 fertilizer application [38].
In May 2018, the experimental area was mowed weekly as described and a maintenance granular fertilizer application delivered 30 kg Mg, 60 kg S, and 50 kg K ha−1. Following the 6 June 2018 mowing, a randomized complete block design of 1.83 × 1.22 m plots in five (5) replicate blocks was installed in a unique location within the Kentucky bluegrass field described (Figure 1). This second trial was then initiated by applying the described granular urea fertilizers at a N rate of 43.9 kg ha−1. An unfertilized control plot (0 kg N) was maintained in each block, and the plots were irrigated by approximately 1 cm of potable H2O.
In 2018, clipping yields were collected from the center strip of each plot using a 56 cm rotary mower (Model 14PZ, John Deere Co., Moline, IL, USA) set to a 3 cm height of cut 8, 15, 23, 29, 36, 44, 50, 57, 65, 71, 78, 85, 93, 100, 107, and 116 DFT (Figure 2). Once collected, clippings were dried to constant mass (65 °C) and cooled in desiccators for dry mass determination. A subsample of each yield was ground to pass a 500 μm sieve, except from pooled yields collected 10 and 16 August (designated 68 DFT) or 7 and 14 September (designated 96.5 DFT), respectively. All ground samples were subjected to the described total N analysis. These and clipping yield data were used to calculate N offtake and fertilizer N recovery (kg ha−1) on a per-plot basis.
A passive multi-spectral radiometer (CropScan MSR87, Rochester, MN, USA) was used to measure percent canopy reflectance of 460, 560, 660, 710, and 810 ± 5 nm irradiance from a 0.1 m2 circular sample area in the ±3 h interval around solar noon. Percent reflectance of 460, 560, and 660 nm irradiance was used to calculate the dark green color index (DGCI) [41]. Percent reflectance in the 810 nm and 660 or 710 nm wavebands was used to calculate the normalized differential red edge (NDRE) or vegetative index (NDVI) [42,43]. These DGCI or NDVI and NDRE indices provide continuous, resolute measures quantifying turfgrass canopy dark green color or densities, respectively [44].
Data from all serial measures of clipping yield, N offtake, canopy quality indices, and %FNR were combined for analysis by the MIXED procedure (SAS Institute, v. 9.4, Cary, NC, USA). Common fertilizer treatments were employed and analogous cultural, climatic, and edaphic conditions compelled the classification of ‘experiment (EXP)’, a random variable [45], exactly as recently described [38].
Temperature and rainfall data from January through September of both experiment years were collected from two nearby climate monitoring stations. The respective data were averaged or summed on a monthly basis (Table 1).

3. Results

3.1. Clipping Yield

The mean clipping yield was significantly affected by the fertilizer treatment main effect (Table 2). Given the merits of summary variable emphasis in field research featuring repeated measures [46,47,48], main effect means are briefly discussed regardless of accompanying significant interaction with the fixed DFT effect. All fertilizer treatments increased mean clipping yield relative to the control, confirming the N-limited status of the Kentucky bluegrass system over the two growing seasons (Table 2).
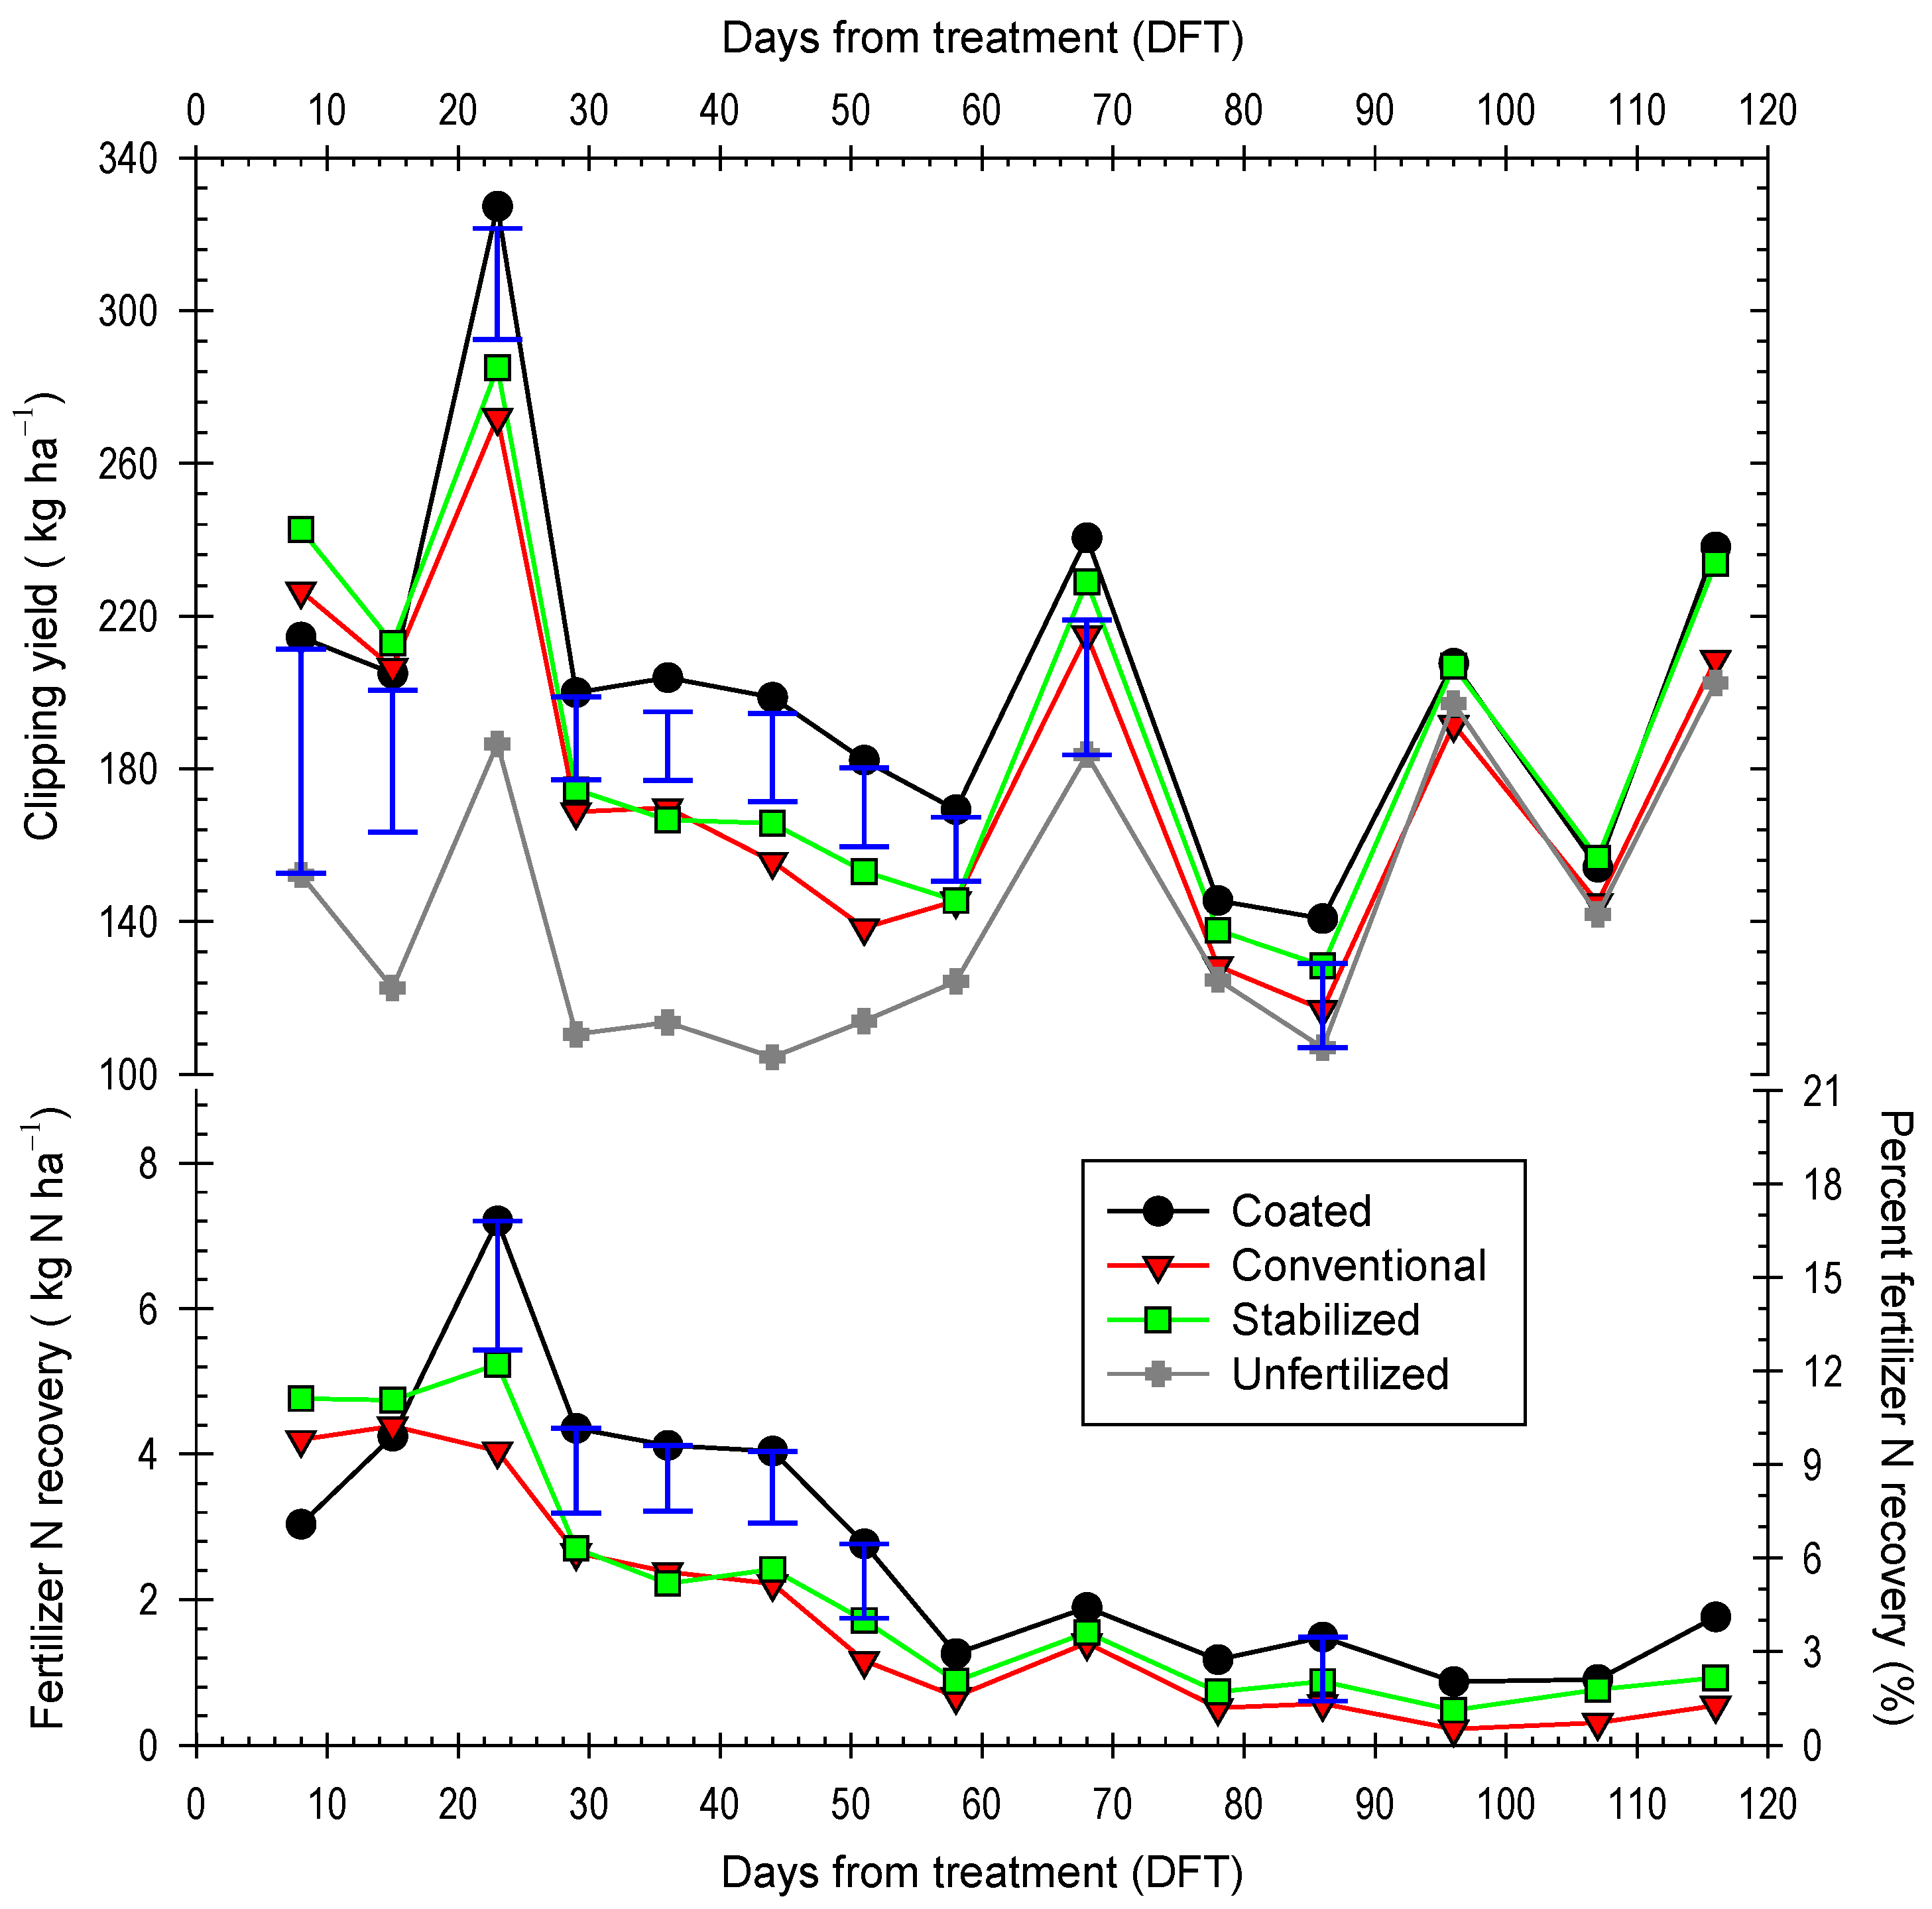
Clipping yield was influenced by an interaction between EEF treatment and sample DFT (Table 2). From 8 to 44 DFT, yields from unfertilized control plots comprised the lowest statistical grouping (Figure 3). This was not an unexpected outcome, given Kentucky bluegrass has a monthly N requirement of 20 to 40 kg ha−1 [16]. The clipping yield response to the urea treatment was not dissimilar from any fertilizer 15 DFT, yet significantly declined relative to the other fertilizers 23 to 51 DFT (Figure 3). Clipping yield response to conventional urea significantly exceeded that of the unfertilized control plots 8 to 44 DFT but was statistically equal thereafter (51 to 116 DFT; Figure 3).
The yield response to conventional urea was surpassed by that of the PSCU treatment from 23 to 58 DFT, and again 86 DFT (Figure 3). The decrease in mean clipping yields 70+ DFT, and only two observed significant differences in clipping yield after 78 DFT (Figure 3), were not surprising given the cumulative N requirements of Kentucky bluegrass over 16+ weeks of growing conditions well exceed the 43.9 kg ha−1 fertilizer N treatment applied.

3.2. Fertilizer Nitrogen Recovery

The vast majority of fertilizer N recovery was observed in the first 51 DFT, yet no significant differences between fertilizer treatment were observed until 23 DFT (Figure 3). The coated urea fertilizer showed greater mean fertilizer N recovery than both the stabilized and conventional urea fertilizers 23, 29, 36, 44, and 51 DFT. Eighty-six DFT, the coated urea fertilizer showed greater mean recovery of fertilizer N than the conventional urea, but not the stabilized urea fertilizer (Figure 3). The mechanism responsible for this difference was likely the preservation of fertilizer urea N within the dual-encapsulated PSCU fertilizer granules. At 90+ DFT, less than 5% or 2.5% of the fertilizer N was recovered by Kentucky bluegrass receiving stabilized or conventional urea treatment, respectively (Figure 3).

3.3. Canopy Characteristics

Fertilizer treatments supplying 43.9 kg N ha−1 showed equivalent mean DGCI indices yet supported a greater experiment-wide mean DGCI than no fertilizer (Table 2). Canopy dark green color was significantly influenced by DFT and generally decreased 9 to 38 DFT, yet increased from 38 to 82 DFT, except for the DGCI of unfertilized control plots that plateaued 28 to 38 DFT.
Treatment interacted with DFT to significantly influence canopy DGCI (Table 2). At every DFT, the unfertilized control plot canopy DGCI either fully comprised, or resided within, the lowest statistical grouping (Figure 4). Considering Kentucky bluegrass has a monthly N requirement of 20 to 40 kg ha−1 [16] and N is a critical ingredient of chlorophyll synthesis [49], these results were not surprising. At 8 DFT, the fully soluble conventional and stabilized urea fertilizer treatments fostered significantly greater canopy DGCI than the coated urea. From 38 to 82 DFT, canopy DGCI response to the coated N fertilizer treatment significantly exceeded the conventional urea treatment mean DGCI (Figure 4). At 74 DFT, the stabilized urea (UMAXX) treatment showed significantly greater canopy DGCI than unfertilized plots and plots fertilized by conventional urea (Figure 4).
All granular fertilizer treatments (43.9 kg N ha−1) showed equivalent mean canopy density indices (NDRE and NDVI) but fostered greater experiment-wide means than the alternative (Table 2).
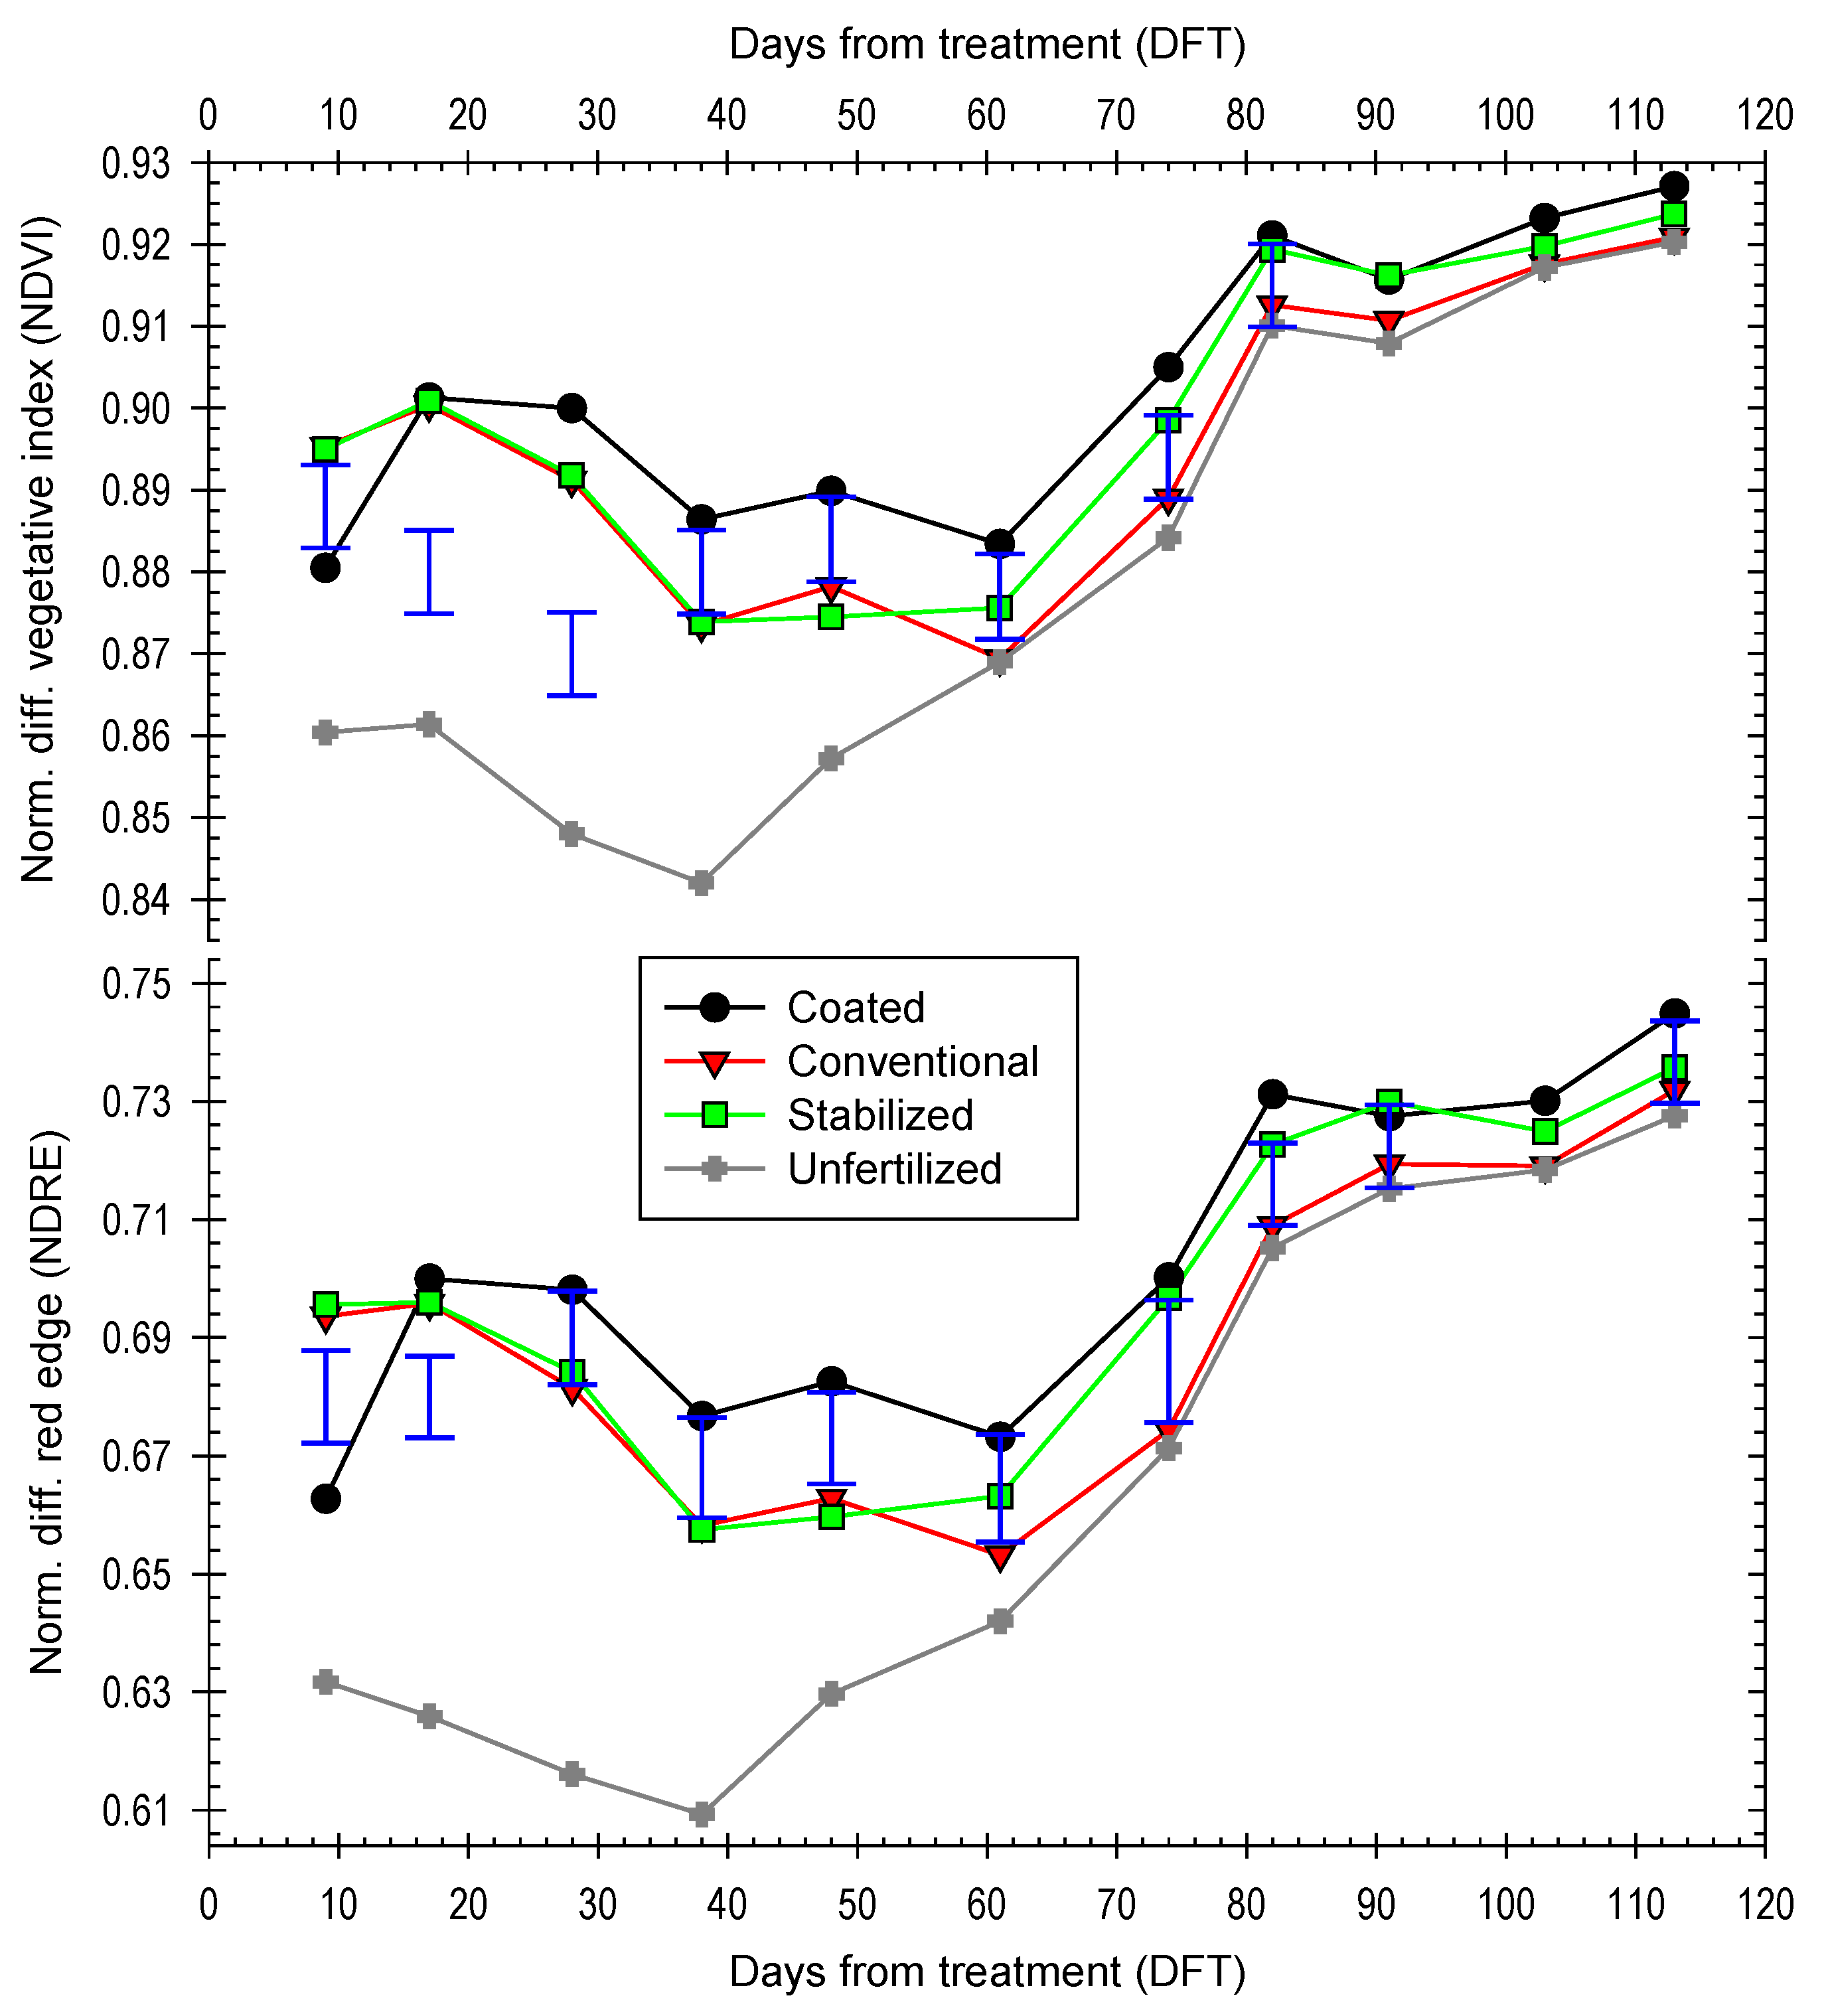
Canopy NDVI (density) values were observed over a 0.79 to 0.948 range, were statistically affected by DFT, and generally increased from 61 to 113 DFT regardless of treatment. This vegetative index was further influenced by fertilizer treatment and sample DFT interaction (Table 2). The ‘Test of Effect Slices’ in PROC MIXED identified significant fertilizer treatment effects on NDVI between 8 and 82 DFT (Figure 5). At 8 DFT, the fully soluble conventional and stabilized urea fertilizer treatments fostered a significantly greater canopy NDVI than the coated urea. At 38 and 48 DFT, the NVDI of the dual-coated urea fertilizer exceeded that of all other fertilized and unfertilized plots. From 61 to 74 DFT, the NVDI of the dual-coated urea fertilizer exceeded that of conventional urea fertilizer and unfertilized plots (Figure 5).
Canopy NDRE (density) values were observed over a 0.551 to 0.771 range, were statistically affected by DFT, and generally increased from 61 to 113 DFT. As with the NDVI, NDRE levels were further influenced by the interaction of fertilizer treatment and sample DFT (Table 2). The PROC MIXED ‘Test of Effect Slices’ identified significant fertilizer treatment effects on the NDRE for every sample date but 103 DFT (Figure 5). At 8 DFT, the fully soluble stabilized and conventional urea fertilizer treatments fostered a significantly greater canopy NDRE than the coated urea. From 28 to 82 DFT, the NDRE of the dual-coated urea fertilizer exceeded the conventional urea plots as well as the unfertilized plots. Meanwhile, the NDRE of the dual-coated urea fertilizer exceeded that of all other fertilized and unfertilized plots between 38 and 48 DFT (Figure 5).

3.4. Monthly Percent Fertilizer N Recovery

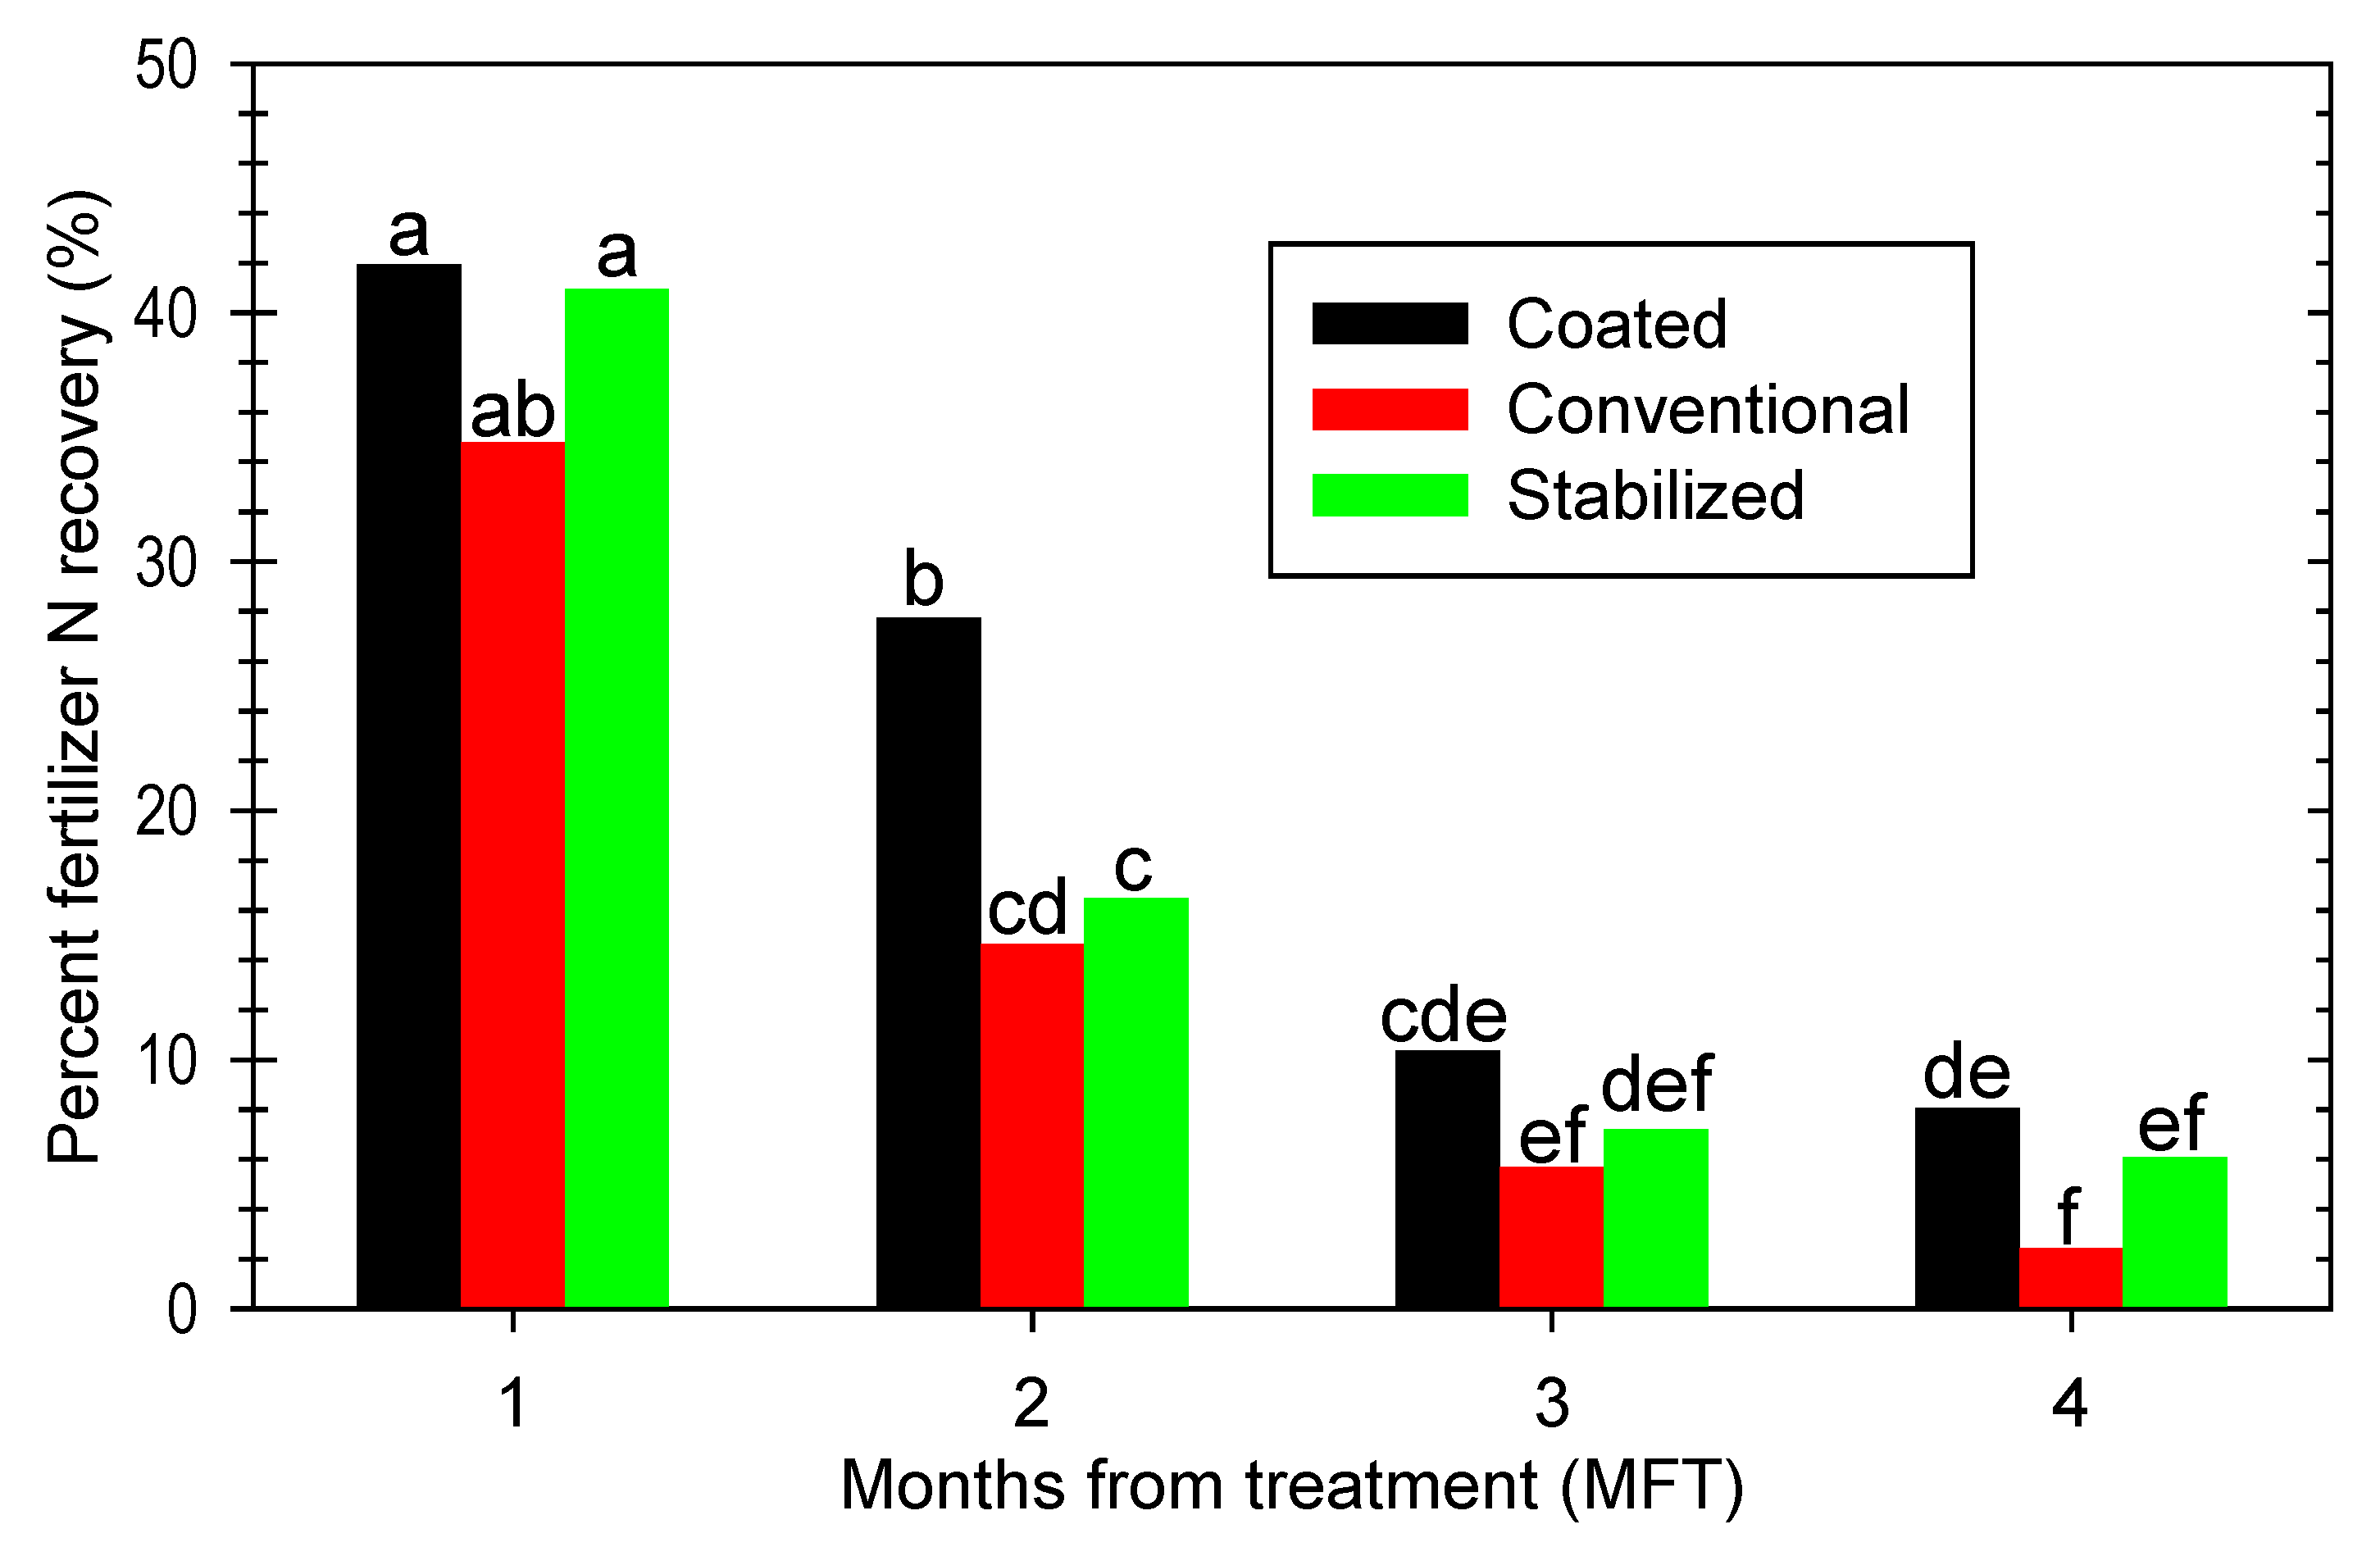
Consideration of fertilizer N assimilation by month may prove more useful to practitioners than the weekly resolution depicted (Figure 3). Fertilizer N recovery was greatest over the first month following application, ranging from 35 to 42% (Figure 6). Subsequent fertilizer N recovery from conventional and stabilized urea treatments was observed to comprise the lowest statistical grouping in Months 2, 3, and 4. However, urea N recovery from the stabilized treatment in Month 4 was not significantly less than that from the coated urea fertilizer treatment, whereas N recovery from the conventional urea treatment was (Figure 6).
After two months, the mean cumulative recovery of conventional urea-N was 49.4%, whereas the mean cumulative recovery of the stabilized urea N was 57.4%. Mean cumulative recovery of the coated urea N in the two months following treatment reached nearly 70% (Figure 6). No significant differences in monthly fertilizer N recovery were observed in Month 3, when between 5.5 and 10.5% of the granular fertilizer N treatments was recovered. Month 4 fertilizer N recoveries were the lowest observed and ranged from 2.4 to 8.1% (Figure 6).

4. Discussion

When managing a turfgrass species in the appropriate environment and height of cut, clipping yield is directly influenced by available soil N. All serial measures of mean shoot growth (yield) over the two growing seasons were greatest from plots receiving fertilizer treatments, except those of conventional urea at 96 DFT. The observed clipping yields correspond with Kentucky bluegrass field research results showing greatest growth in the 20 d following 100 kg ha−1 N applications via soluble fertilizers [28]. However, from 50 to 104 d after treatment, the four coated granular fertilizers supported significantly greater clipping yields than the soluble urea or NH4NO3 fertilizer.
By 44 DFT, 45.2% (conventional) to 62% (coated) of the applied granular urea N fertilizer had been recovered in clippings. From 45 to 116 DFT, 12.3, 18.1, and 27.6% of the applied granular urea N fertilizer had been recovered in the clippings of conventional, stabilized, and coated urea fertilizer-treated plots. At 116 DFT, mean percent fertilizer N recovered from conventional, stabilized, and coated urea totaled 57.5, 68.4, and 89.1%, respectively.
The 57.5% cumulative fertilizer N recovery of the conventional urea was similar to the 63% fertilizer N recovery reported of Kentucky bluegrass over the 18 weeks following a 43.9 kg N ha−1 May application [38]. Likewise, the observed conventional urea fertilizer N recovery mirrors the 62.5% reported in Kentucky bluegrass clipping recovery collected over the 63 d following a 43 kg N ha−1 June application [33].
The observed 68.4% cumulative fertilizer N recovery of the stabilized urea is less than the 72.9% fertilizer N recovery reported of Kentucky bluegrass over the 9 weeks following a 43 kg N ha−1 June application [33]. Yet, the relative 10% improvement in FNR by stabilized urea, vs. conventional urea, proves consistent in this study (68.4% vs. 57.5%) and the study featuring a 43 kg N ha−1 application rate (72.9 vs. 62.5%) [33]. In that study, a 43 kg N ha−1 application of blended urea fertilizer (containing 25% PCU) to Kentucky bluegrass resulted in 66% fertilizer N recovery in clipping offtake [33], again indicating improved fertilizer N recovery with an increasing fraction of coated urea.
Field research conducted on bermudagrass (Cynodon dactylon L.) receiving 98 kg N ha−1 from polymer-coated, polymer-/sulfur-coated, and conventional urea, and synthetic or natural organics, showed significantly improved shoot growth in plots treated by polymer-/sulfur-coated urea relative to conventional urea, particularly >30 d after application [29]. Field evaluation by Kentucky bluegrass visual quality and % green cover was conducted following late-April or late-May application of humic-coated, polymer-/humic-coated, polymer-/sulfur-coated, stabilized, or conventional urea at a 49 kg N ha−1 rate [50]. Similar to the results shown, the response variables indicate statistically equivalent performance by all fertilizers but conventional urea.

5. Conclusions

Greater plant recovery of urea N via efficiency enhancement is a realized benefit of ongoing technological refinement by fertilizer manufacturers. While different granular enhanced-efficiency fertilizers (EEFs) may support similar cumulative N recovery by turfgrass, varied patterns of N release were shown to manifest over the 16.5-week evaluations. Specifically, the dual-coated urea resulted in a significantly greater Kentucky bluegrass FNR than stabilized or conventional urea in Month 2, and a greater FNR than conventional urea in Month 4.
Canopy reflectance indices confirmed this improved nitrogen nutrition of Kentucky bluegrass treated by stabilized or dual-coated urea 28 to 82 d previously. This research provides useful insight into the field performance of currently available granular EEF fertilizers, supporting their practical utilization by turfgrass managers. The results confirm the suitability of a single application of dual-coated, granular urea to support 2 to 3 months of turfgrass N sufficiency requirements. Future research could evaluate heavier (50 to 75 kg N ha−1), late-Spring, dual-coated, N fertilizer application rates supporting 2 to 3 months of N in soil where limited organic matter and the N mineralization rate proves more challenging to N sufficiency.
Given that urea is a plant-available N form, enhancement/stabilization by biological inhibitors (NBPT and DCD) neither imparts controlled release nor delays fertilizer N availability. Furthermore, an ammonia-volatilization-mitigating effort was made by applying fertilizer treatments before a natural precipitation (2014) or a scheduled irrigation event. This may have limited the likelihood of forthcoming benefits via a stabilized EEF urea fertilizer. Regardless, the authors recommend employing biological-inhibitor-enhanced urea to support 1 to 1.5 months of N requirements under input-limited scenarios and/or when managing turfgrass in air quality ‘non-attainment’ regions.

Author Contributions

Conceptualization, M.J.S.; methodology, B.E.B. and M.J.S.; software, M.J.S.; validation, B.E.B. and M.J.S.; formal analysis, M.J.S.; investigation, B.E.B. and M.J.S.; resources, M.J.S.; data curation, M.J.S.; writing—original draft preparation, B.E.B.; writing—review and editing, B.E.B. and M.J.S.; visualization, B.E.B. and M.J.S.; supervision, M.J.S.; project administration, M.J.S.; funding acquisition, M.J.S. All authors have read and agreed to the published version of the manuscript.

Funding

This research was funded by the USDA National Institute of Food and Agriculture, Federal Appropriations under Project PEN04749 and Accession number 1023224.

Data Availability Statement

The datasets are available from the corresponding author on request.

Conflicts of Interest

The authors declare no conflicts of interest.

References

  1. Taylor, N.; Howell, K.; Heazlewood, J.; Tan, T.; Narsai, R.; Huang, S.; Whelan, J.; Millar, A. Analysis of the rice mitochondrial carrier family reveals anaerobic accumulation of a basic amino acid carrier involved in arginine metabolism during seed germination. Plant Physiol. 2010, 154, 691–704. [Google Scholar] [CrossRef] [PubMed]
  2. Merigout, P.; Lelandais, M.; Bitton, F.; Renou, J.-P.; Briand, X.; Meyer, C.; Daniel-Vedele, F. Physiological and transcriptomic aspects of urea uptake and assimilation in Arabidopsis plants. Plant Physiol. 2008, 147, 1225. [Google Scholar] [CrossRef] [PubMed]
  3. Eckert, M.; Biela, A.; Siefritz, F.; Kaldenhoff, R. New aspects of plant aquaporin regulation and specificity. J. Exp. Bot. 1999, 50, 1541–1545. [Google Scholar]
  4. Liu, L.H.; Ludewig, U.; Gassert, B.; Frommer, W.B.; von Wiren, N. Urea transport by nitrogen-regulated tonoplast intrinsic proteins in Arabidopsis. Plant Physiol. 2003, 133, 1220. [Google Scholar]
  5. Kojima, S.; Bohner, A.; von Wiren, N. Molecular mechanisms of urea transport in plants. J. Membr. Biol. 2006, 212, 83–91. [Google Scholar]
  6. Merigout, P.; Gaudon, V.; Quillere, I.; Briand, X.; Daniel-Vedele, F. Urea use efficiency of hydroponically grown maize and wheat. J. Plant Nutr. 2008, 31, 427. [Google Scholar] [CrossRef]
  7. Bowman, D.C.; Paul, J.L. Foliar absorption of urea, ammonium, and nitrate by perennial ryegrass turf. J. Am. Soc. Hortic. Sci. 1992, 117, 75–79. [Google Scholar]
  8. Chin, W.; Kroontje, W. Urea hydrolysis and subsequent loss of ammonia. Soil Sci. Soc. Am. J. 1963, 27, 316–318. [Google Scholar] [CrossRef]
  9. Torello, W.A.; Wehner, D.J. Urease activity in a Kentucky bluegrass turf. Agron. J. 1983, 75, 654–656. [Google Scholar]
  10. Petrovic, A.M. The fate of nitrogenous fertilizers applied to turfgrass. J. Environ. Qual. 1990, 19, 1–14. [Google Scholar]
  11. Bernardi, A.C.C.; Mota, E.P.; Cardosa, R.D.; Monte, M.B.M.; Oliveira, P.P.A. Ammonia volatilization from soil, dry-matter yield, and nitrogen levels of Italian ryegrass. Comm. Soil Sci. Plant Anal. 2014, 45, 153–162. [Google Scholar] [CrossRef]
  12. Rochette, P.; Angers, D.A.; Chantigny, M.H.; MacDonald, J.D.; Gasser, M.-O.; Bertrand, N. Reducing ammonia volatilization in a no-till soil by incorporating urea and pig slurry in shallow bands. Nutr. Cycl. Agroecosyst. 2009, 84, 71–80. [Google Scholar] [CrossRef]
  13. Titko, S., III; Street, J.R.; Logan, T.J. Volatilization of ammonia from granular and dissolved urea applied to turfgrass. Agron. J. 1987, 79, 535–540. [Google Scholar]
  14. Bowman, D.C.; Paul, J.L.; Davis, W.B.; Nelson, S.H. Reducing ammonia volatilization from Kentucky bluegrass turf by irrigation. HortScience 1987, 22, 84–87. [Google Scholar]
  15. Holcomb, J.C.; Sullivan, D.M.; Horneck, D.A.; Clough, G.H. Effect of irrigation rate on ammonia volatilization. Soil Sci. Soc. Am. J. 2011, 75, 2341–2347. [Google Scholar]
  16. Carrow, R.N.; Waddington, D.V.; Rieke, P.E. Turfgrass Soil Fertility and Chemical Problems: Assessment and Management; John Wiley & Sons: Hoboken, NJ, USA, 2001; pp. 306–318. ISBN 1-57504-153-7. [Google Scholar]
  17. Kiss, S.; Simihaian, M. Improving Efficiency of Urea Fertilizers by Inhibition of Soil Urease Activity; Kluwer Academic Publishers: Norwell, MA, USA, 2002; pp. 142–419. ISBN 1-4020-0493-1. [Google Scholar]
  18. McCarty, G.W.; Bremner, J.M.; Chai, H.S. Effect of N-(n-butyl) thiophosphoric triamide on hydrolysis of urea by plant, microbial, and soil urease. Biol. Fertil. Soils 1989, 8, 123–127. [Google Scholar] [CrossRef]
  19. Manunza, B.; Deiana, S.; Pintire, M.; Gessa, C. The binding mechanism of urea, hydroxamic acid and N-(N-butyl)-phosphoric triamide to the urease active site: A comparative molecular dynamics study. Soil Biol. Biochem. 1999, 31, 789–796. [Google Scholar] [CrossRef]
  20. Silva, A.G.B.; Sequeira, C.H.; Sermarini, R.A.; Otto, R. Urease inhibitor NBPT on ammonia volatilization and crop productivity: A meta-analysis. Agron. J. 2017, 109, 1–13. [Google Scholar]
  21. Del Moro, S.K.; Sullivan, D.M.; Horneck, D.A. Ammonia volatilization from broadcast urea and alternative dry nitrogen fertilizers. Soil Sci. Soc. Am. J. 2018, 81, 1629–1639. [Google Scholar]
  22. Engel, R.; Jones, C.; Romero, C.; Wallander, R. Late-fall, winter and spring broadcast applications of urea to no-till winter wheat I. Ammonia loss and mitigation by NBPT. Soil Sci. Soc. Am. J. 2017, 81, 322–330. [Google Scholar] [CrossRef]
  23. Sunderlage, B.; Cook, R.L. Soil property and fertilizer additive effects on ammonia volatilization from urea. Soil Sci. Soc. Am. J. 2018, 82, 253–259. [Google Scholar] [CrossRef]
  24. Skogley, C.R.; King, J.W. Controlled release nitrogen fertilization of turfgrass. Agron. J. 1968, 60, 61–64. [Google Scholar]
  25. Boulin, G.M.; Rindt, D.W.; Moore, O.E. Sulfur-coated fertilizers for controlled release. Pilot-plant production. J. Agric. Food Chem. 1971, 19, 801–808. [Google Scholar]
  26. Rindt, D.W.; Blouin, G.M.; Getsinger, J.G. Sulfur coating on nitrogen fertilizer to reduce dissolution rate. J. Agric. Food Chem. 1968, 16, 773–778. [Google Scholar]
  27. Allen, S.E.; Hunt, C.M.; Terman, G.L. Nitrogen release from sulfur coated urea as affected by coating weight placement and temperature. Agron. J. 1971, 63, 529. [Google Scholar]
  28. Zhang, M.; Nyborg, N.; Malhi, S.S. Comparison of controlled release nitrogen fertilizers on turfgrass in a moderate temperature area. HortScience 1998, 33, 1203–1206. [Google Scholar]
  29. Carrow, R.N. Turfgrass response to slow-release nitrogen fertilizers. Agron. J. 1997, 89, 491–496. [Google Scholar]
  30. Guillard, K.; Kopp, K.L. Nitrogen fertilizer form and associated nitrate leaching from cool-season lawn turf. J. Environ. Qual. 2004, 33, 1822–1827. [Google Scholar] [CrossRef]
  31. Snyder, G.H.; Augustin, B.J.; Davison, J.M. Moisture sensor-controlled irrigation for reducing N leaching in bermudagrass turf. Agron. J. 1984, 76, 964. [Google Scholar]
  32. Knight, E.C.; Guertal, E.A.; Wood, C.W. Mowing and nitrogen source effects on ammonia volatilization from turfgrass. Crop. Sci. 2007, 47, 1628–1634. [Google Scholar]
  33. Schlossberg, M.J.; McGraw, B.A.; Sebring, R.L.; Hivner, K.R. Nitrogen recovery and loss from Kentucky bluegrass fertilized by conventional or enhanced-efficiency urea granules. Agronomy 2018, 8, 144. [Google Scholar] [CrossRef]
  34. Braun, R.C.; Bremer, D.J. Nitrous oxide emissions from turfgrass receiving different irrigation amounts and nitrogen fertilizer forms. Crop. Sci. 2018, 58, 1762. [Google Scholar] [CrossRef]
  35. Gillette, K.L.; Qian, Y.; Follett, R.F.; Del Grosso, S. Nitrous oxide emissions from a golf course fairway and rough after application of different nitrogen fertilizers. J. Environ. Qual. 2016, 45, 1788–1795. [Google Scholar] [CrossRef]
  36. Maggiotto, S.R.; Webb, J.A.; Wagner-Riddle, C.; Thurtell, G.W. Nitrous and nitrogen oxide emissions from turfgrass receiving different forms of nitrogen fertilizer. J. Environ. Qual. 2000, 29, 621–630. [Google Scholar]
  37. LeMonte, J.J.; Jolley, V.D.; Summerhays, J.S.; Terry, R.E.; Hopkins, B.G. Polymer coated urea in turfgrass maintains vigor and mitigates nitrogen’s environmental impacts. PLoS ONE 2016, 11, e0146761. [Google Scholar] [CrossRef]
  38. Schlossberg, M.J. Temporal recovery of polymer-coated urea-N by Kentucky bluegrass in the field. Horticulturae 2022, 8, 207. [Google Scholar] [CrossRef]
  39. Henning, S.W.; Branham, B.E.; Mulvaney, R.L. Response of turfgrass to urea-based fertilizers formulated to reduce ammonia volatilization and nitrate conversion. Biol. Fertil. Soils 2013, 49, 51–60. [Google Scholar]
  40. Zhu, Q.; Schlossberg, M.J.; Bryant, R.B. Foliar fertilization–induced injury and recovery of a creeping bentgrass putting green. J. Plant Nutr. 2016, 39, 1589–1596. [Google Scholar] [CrossRef]
  41. Karcher, D.E.; Richardson, M.D. Quantifying turfgrass color using digital image analysis. Crop. Sci. 2003, 43, 943–951. [Google Scholar]
  42. Baret, F.; Guyot, G. Potentials and limits of vegetation indices for LAI and APAR assessment. Remote Sens. Environ. 1991, 35, 161–173. [Google Scholar]
  43. Barnes, E.M.; Clarke, T.R.; Colaizzi, P.; Haberland, J.; Kostrzewski, M.; Riley, E.; Moran, S.; Waller, P.; Choi, C. Coincident detection of crop water stress, nitrogen status, and canopy density using ground-based multispectral data. In Proceedings of the 5th International Conference on Precision Agriculture, Bloomington, MN, USA, 16–19 July 2000; Precision Agriculture Center, University of Minnesota: Madison, WI, USA, 2000. [Google Scholar]
  44. Leiby, N.L.; Schlossberg, M.J. Putting green canopy reflectance by time from colourant and spray oil combination product application. Int. J. Remote Sens. 2022, 43, 7024. [Google Scholar] [CrossRef]
  45. McIntosh, M.S. Analysis of combined experiments. Agron. J. 1983, 75, 153–155. [Google Scholar] [CrossRef]
  46. DeKlerk, N.H. Repeated warnings re repeated measures. Aust. N. Z. J. Med. 1986, 16, 637–638. [Google Scholar] [CrossRef]
  47. Matthews, J.N.S.; Altman, D.G.; Campbell, M.J.; Royston, P. Analysis of serial measurements in medical research. Br. Med. J. 1990, 300, 230–235. [Google Scholar]
  48. Piepho, H.P.; Eckl, T. Analysis of series of variety trials with perennial crops. Grass Forage Sci. 2014, 69, 431–440. [Google Scholar] [CrossRef]
  49. Marschner, P. Mineral Nutrition of Higher Plants, 3rd ed.; Elsevier: San Diego, CA, USA, 2012. [Google Scholar]
  50. Lindsey, A.J.; Thoms, A.W.; McDaniel, M.D.; Christians, N.E. Plant-available soil nitrogen fluxes and turfgrass quality of Kentucky bluegrass fertilized with humic substances. Crop Sci. 2021, 61, 4416–4424. [Google Scholar] [CrossRef]
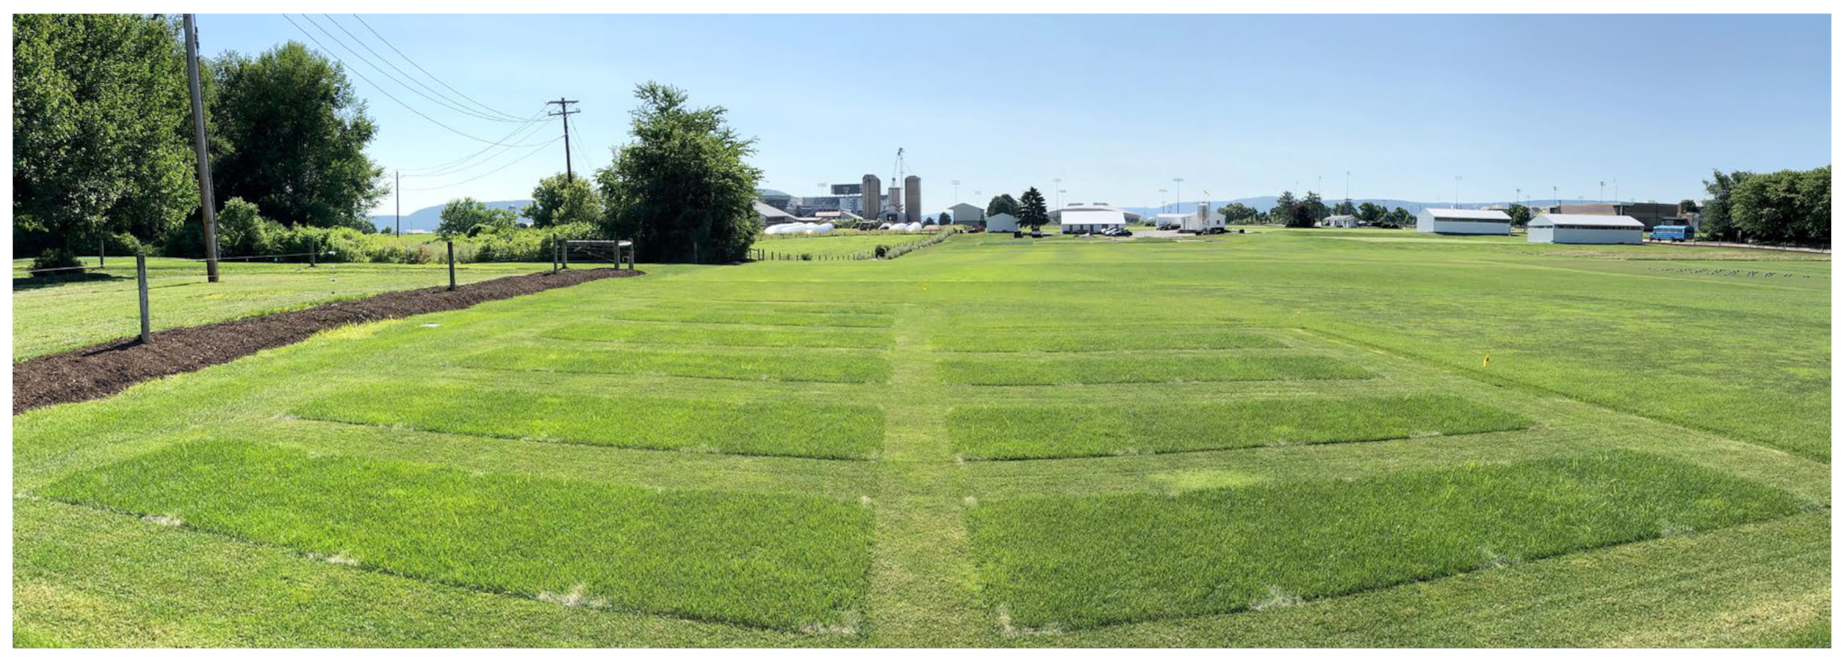
Figure 1. Experimental plots maintained within the Valentine Turfgrass Research Center (University Park, PA, USA), July 2018.
Agronomy 14 02118 g001
Figure 2. Experimental plots immediately following clipping yield collection, June 2018 (Valentine Turfgrass Research Center, University Park, PA, USA).
Agronomy 14 02118 g002
Figure 3. Kentucky bluegrass clipping yield and fertilizer N recovery by urea fertilizer and days from treatment (DFT). Blue error bar lengths denote Fisher’s Protected Least Significant Difference (LSD) at a 5% alpha level.
Agronomy 14 02118 g003
Figure 4. Mean daily air temperature and Kentucky bluegrass canopy color as dark green color index (DGCI) by urea fertilizer and days from treatment (DFT). Blue error bar lengths denote Fisher’s Protected Least Significant Difference (LSD) at a 5% alpha level.
Agronomy 14 02118 g004
Figure 5. Kentucky bluegrass canopy density as normalized diff. red edge (NDRE) or veg. index (NDVI) by urea fertilizer and days from treatment (DFT). Blue error bar lengths denote Fisher’s Protected Least Significant Difference (LSD) at a 5% alpha level.
Agronomy 14 02118 g005
Figure 6. Percent fertilizer N recovery of Kentucky bluegrass by urea fertilizer and month from treatment (MFT). All means denoted by common letters are not significantly different by Fisher’s Protected LSD at a 5% alpha level.
Agronomy 14 02118 g006
Table 1. Mean monthly air temperature and precipitation recorded at two nearby climate monitoring stations (University Park, PA, USA).
20142018
Mean AirTotalMean AirTotal
Month(s)Temperature (°C)Precipitation (cm)Temperature (°C)Precipitation (cm)
January to April0.121.21.937.4
May16.914.319.114.8
June21.614.120.49.7
July22.721.522.814.6
August20.518.723.112.3
September18.14.120.015.9
Table 2. Global ANOVA of Kentucky bluegrass clipping yield, canopy vegetative indices, and fertilizer N recovery, by source; and main effect (pooled) means, by fertilizer treatment level.
dfClippingdfCanopydfFertilizer N
SourceNumDenYieldNumDenDGCINDRENDVINumDenRecovery
p value p value p value
Fertilizer (FERT)330.019330.0230.0140.017221 ns
Days from treatment (DFT)1313ns10100.0370.0240.0431313<0.001
FERT × DFT3939<0.0013030<0.001<0.001<0.00126260.041
Fertilizer Mean, kg ha−1 Mean, unitless Mean, kg ha−1
Coated urea (XCU) 202 0.6920.7030.903 2.79
Conventional urea 178 0.6830.6910.896 1.80
Stabilized urea (UMAXX) 188 0.6890.6970.899 2.14
Unfertilized control 142 0.6680.6630.880
2 LSD 5% 26.6 0.0120.0160.010 ns
1 ns, not significant. 2 LSD, least significant difference.
Disclaimer/Publisher’s Note: The statements, opinions and data contained in all publications are solely those of the individual author(s) and contributor(s) and not of MDPI and/or the editor(s). MDPI and/or the editor(s) disclaim responsibility for any injury to people or property resulting from any ideas, methods, instructions or products referred to in the content.