Article

Optimal Application of Biogas Slurry in Paddy Fields under the Dual Constraints of Agronomy and Environment in the Yangtze River Delta Region

1
Institute of Agricultural Sciences in Taihu Lake Region, Jiangsu Academy of Agricultural Sciences, Suzhou 215100, China
2
National Soil Quality Observation Experiment Station in Xiangcheng, Suzhou 215131, China
3
College of Food Science and Technology, Nanjing Agricultural University, Nanjing 210095, China
4
Nanjing Institute of Agricultural Mechanization, Ministry of Agriculture and Rural Affairs, Nanjing 210008, China
*
Authors to whom correspondence should be addressed.
Agronomy 2024, 14(9), 2142; https://doi.org/10.3390/agronomy14092142
Submission received: 30 August 2024 / Revised: 16 September 2024 / Accepted: 18 September 2024 / Published: 20 September 2024

Abstract

:
The production of huge amounts of biogas slurry during livestock breeding has resulted in pressing environmental issues. Although paddy fields can be potential sinks for the disposal of biogas slurry, the impacts of biogas slurry on rice production, grain quality, and relevant environmental risks in the Yangtze Delta region remain unclear. Herein, we conducted a field trial from 2021 to 2023 which involved different gradients of biogas slurry utilization, including CK (no fertilizer), CN (100% chemical nitrogen (N) of 240 kg ha−1), NBS (biogas slurry replacing 50% chemical N), BS1 (replacing 100% chemical N), BS1.5 (replacing 150% chemical N), and BS2 (replacing 200% chemical N). The results showed that there were no significant differences in average rice yields between CN, NBS, BS1.5, and BS2 over the three-year study period, with an average yield of 8283 kg ha−1, and the average yields of BS1 and CK were 7815 kg ha−1 and 6236 kg ha−1, respectively. However, heavy utilization of biogas slurry (BS1.5 and BS2) not only significantly reduced the rice seed-setting rate, the 1000-grain weight, and the processing quality, but also significantly increased the protein, amylose, Cu, and Zn content in rice grains; additionally, higher N losses occurred via surface water and increased NH3 volatilization was observed, finally resulting in lower nitrogen-use efficiency. Meanwhile, moderate utilization of biogas slurry (NBS and BS1) led to better rice quality and nitrogen-use efficiency, lower potential food safety risk, and N loss. Further, compared to BS1, NBS showed higher yield, harvest index, processing quality, gel consistency, palatability scores, and nitrogen-use efficiency, but lower N losses were present. Overall, the NBS treatment balanced the agronomic benefits and environmental risks in the Yangtze River Delta region. In the future, more attention should be paid to food safety and environmental risks when using biogas slurry.

1. Introduction

Livestock plays a crucial role in human society, providing essential resources such as meat, milk, eggs, and other animal-based foods, which are vital sources of high-quality protein and micronutrients that are necessary for human nutrition and health [1]. The global production of these commodities has been steadily increasing, driven by rising population, urbanization, and income growth. As of 2021, approximately 336 million metric tons of meat were produced globally, with poultry comprising the majority, followed by pork, beef, and sheep/goat meat [2]. Meanwhile, the disposal of livestock’s excrement is a key part of breeding, and biogas digestion is a widely used and crucial process in livestock management [3]. This anaerobic fermentation process ultimately results in biogas and biogas slurry. As a residue of digestion, biogas slurry comprises very low levels of organic carbons but is rich in mineral nutrition, containing substances such as nitrogen (N) and phosphorus (P), which can be used as substitutes for chemical fertilizers [4]. Moreover, it is estimated that global biogas production from livestock has reached approximately 50–60 billion cubic meters annually [5], and the amount of biogas slurry has exceeded 500 million tons annually [6]. These immense quantities of biogas slurry from livestock are becoming the Sword of Damocles, hanging over environmental pollution. That is, indiscriminate discharge of biogas slurry can lead to serious pollution of natural water, soil, and air [7].
Rice (Oryza sativa L.) is a primary source of calories for human beings [8]. In 2022, the total area of land used for rice cultivation was approximately 29.5 million hectares, and the average rice grain yield reached about 6.5 tons ha−1 [9]. As expected, rice cultivation has consumed large amounts of fertilizer to increase rice yields since the Green Revolution of agriculture in the 20th century [10]. Simultaneously, paddy fields also require large amounts of water during rice growth [11], potentially providing a large sink for the disposal of biogas slurry [12]. Therefore, the application of biogas slurry in paddy fields is complementary.
Numerous studies have investigated the effects of biogas slurry application on rice yield and quality. Most studies have demonstrated that an optimal biogas slurry application rate is beneficial for rice production. Lu et al. showed that replacing 30% of chemical N fertilizer (approximately 45.0–61.4 t ha−1 biogas slurry) significantly increased rice grain yield [13]. Similarly, a feasible biogas slurry application of 165.1 t ha−1 achieved the highest rice yield in Sichuan, China [14]. However, the effects of biogas slurry on rice quality are relatively limited. Rice quality is co-affected by molecular and environmental factors, which result in differential rice commodity properties [15,16]. Rice processing quality indices, including the brown rice rate, milled rice rate and head milled rice rate, are generally applied to assess the rice milling process. Brown rice is produced by removing the palea and lemma; milled rice is produced by removing the bran, germ, and embryo; head milled rice is characterized by a standard criterium that the weight percentage of the rice grains should have a length greater than or equal to 75% of the average length of the whole grain [15,17]. Rice’s cooking and eating quality is largely associated with the content of protein and amylose in rice grain and the gel consistency [18,19]. Protein content not only represents nutritional values, but also determines the palatability of rice used for cooking [18], as rice grain with high protein content tends to be harder [19]. Amylose is an important part of rice starch, and rice grain with optimal amylose content can usually achieve higher cooking and palatability scores [18]. Gel consistency is another parameter for evaluating the tendency of cooked rice to harden on cooling, which is used to classify rice as hard, medium, or soft [15]. Wang et al. reported that the brown rice rate, milled rice rate, and head milled rice rate have increased with increasing amounts of biogas slurry [20]. Regarding the eating quality of rice grain, a few field trials have shown that the protein content in rice grain significantly increased when more biogas slurry was applied [20,21,22,23], but the amylose content in rice grains decreased with heavy biogas slurry dosage [20,21,24]. Meanwhile, biogas slurry application could result in potential risks to food security due to the heavy metals derived from feed addition in livestock [25]. Heavy metals, particularly copper (Cu) and zinc (Zn), can be assimilated and accumulated in rice grains. A field trial in Japan showed that biogas slurry fertilization enhanced Cu uptake in rice grains [26,27]. Another long-term field experiment in China demonstrated that the concentrations of cadmium (Cd) and lead (Pb) in rice grain were significantly increased by biogas slurry [12]. Overall, for agronomy purposes, the optimal application of biogas slurry in paddy fields is still not clear, probably because of nutrient variations in biogas slurry, soil type and fertility, rice variety, and climate conditions [28,29,30].
Nitrogen (N) loss is another crucial issue in biogas slurry application in paddy fields. The pathways involving N loss after fertilization include water runoff, leaching, ammonia (NH3) volatilization, nitrification, and denitrification [31,32]. Zhou et al. estimated that 11–15% of N leached downwards, 2.5–4.0% of N was emitted via NH3 volatilization, and approximately 30–40% of N was lost via denitrification [33]. Meanwhile, Chen et al. showed that 2.3% of N leached downwards, 16.4% of N was lost via NH3 volatilization, 0.70% of N was discharged with floodwater drainage, and 39.4% of N was retained in soil or emitted via N2 [34]. Overall, biogas slurry application affected N loss mainly via gasses rather than water. In particular, the odor caused by NH3 volatilization directly affects the lives and health of nearby residents and limits the utilization of biogas slurry [35]. Therefore, NH3 volatilization should be given more consideration in biogas slurry applications.
In East Asia, the Yangtze River Delta region is economically developed, with a strong demand for livestock products, and is also a major rice production area in China. How can the balance between rice production and environmental protection be maintained using biogas slurry? This is a pressing issue that must be addressed immediately. We conducted a continuous three-year field experiment of biogas slurry application, and our objectives were as follows: (1) to elucidate the effects of biogas slurry application on agronomy and the environment in paddy fields; (2) to propose an optimal application strategy of biogas slurry in the Yangtze Delta region.

2. Materials and Methods

2.1. Field Experiment Description

The field experiment was conducted from 2021 to 2023 at Chang-yin-sha Farm (latitude 31.81 °N, longitude 120.83 °E), located in Zhangjiagang City, Yangtze River Delta region, China. The mean annual temperature was 16.6 °C, and the precipitation levels were 1100–1300 mm. The site had a history of cultivation under a rice–wheat crop rotation system spanning several decades prior to the commencement of our study. The soil at the experimental site was typified as a sandy gley, according to the World Reference Base for Soil Resources [36]. At the outset of the experiment, the 0–20 cm soil exhibited the following properties: 30.12 g kg−1 of soil organic matter, 1.65 g kg−1 of total nitrogen (TN), 0.52 g kg−1 of total phosphorus (TP), 10.9 g kg−1 of total potassium (TK), 121.0 mg kg−1 of mineral-N (extracted by 0.5 mol L−1 K2SO4), 35.35 mg kg−1 of Olsen-P (extracted by 0.5 mol L−1 NaHCO3), 57.7 mg kg−1 of available-K (extracted by 1 mol L−1 CH3COONH4), and a pH of 7.25 (ratio of soil and CO2-free water, weight/volume, 1:2.5).

2.2. Experiment Design and Management

To obtain the optimal dosage of biogas slurry, we conducted a gradient trial for biogas slurry application. The experiment employed a fully randomized design, incorporating six treatments: CK (blank control without any fertilizer), CN (100% chemical N of 240 kg ha−1), NBS (biogas slurry replacing 50% chemical N), BS1 (replacing 100% chemical N), BS1.5 (replacing 150% chemical N), and BS2 (replacing 200% chemical N). Each treatment was replicated four times, and each plot covered an area of 30 m2 (5 × 6 m). The plots were separated using 30 cm high ridges, which were covered with waterproof fabric, and the waterproof fabric was inserted into the soil to a depth of 30 cm to prevent nutrient cross-contamination. Each field plot was equipped with an independent water inlet and outlet pipe. Biogas slurry was quantitatively applied using a manual irrigation method.
Throughout the entire growth period, a total N application rate of 240 kg ha−1, a total P application rate of 52 kg P2O5 ha−1, and a total K application rate of 120 kg K2O ha−1 were maintained. For the CN and NBS treatments, the chemical N fertilizer was divided into three splits, with 30% applied before rice transplanting as a basal dressing, another 30% at the tillering stage, and the remaining 40% at the jointing stage. All the chemical P fertilizers were applied as a basal dressing before rice transplanting, while 50% of the chemical K fertilizer was applied before rice transplanting, and the remaining 50% was applied at the jointing stage. For the NBS, BS1, BS1.5, and BS2 treatments, the biogas slurry was dispensed into four equal portions, corresponding to the transplanting, tillering, jointing, and booting stages. The P and K deficiencies were compensated with a one-time application of chemical P and K fertilizers prior to rice transplantation. Detailed application methods are presented in Table 1.
The chemical N fertilizer was urea, with a N content of 46%; the chemical P fertilizer was superphosphate, containing 12% P2O5; the chemical K fertilizer was potassium chloride, containing 60% K2O. The biogas slurry was obtained from the anaerobic fermentation of manure water from pig farming. The biogas slurry exhibited slight seasonal variations in nutrient concentrations, which showed an average TN concentration of 760.34 mg L−1, an ammonium ( NH 4 + –N) concentration of 721.78 mg L−1, a P2O5 concentration of 133.45 mg L−1, a K2O concentration of 681.04 mg L−1, and a pH of 7.55. It also contained copper (Cu) (12.5 mg L−1) and zinc (Zn) (10.2 mg L−1).
Suxianggeng-100, a late-mature soft japonica cultivar, was cultivated from 2021 to 2023. Artificial simulated machine transplanting was employed, with row and plant spacings of 30 cm and 12 cm, respectively. In addition to fertilization, the management of pests, diseases, and weeds was conducted in accordance with conventional local practices. Rice was typically transplanted in late June and harvested in early November.

2.3. Sampling and Measurements

2.3.1. Yield, Yield Components, and Harvest Index

The rice seeds were harvested from each plot in a 1 m2 area at maturity and then measured, and the grain moisture content was adjusted to 13.5% fresh weight to obtain the grain yield. The panicle number per hill was measured by counting the panicle numbers on 30 hills where rice plants were growing, and measurements were obtained from different locations in each plot. Representative samples were collected according to the panicle number, which was subsequently used to determine the spikelet number per panicle, seed-setting rate, and 1000-grain weight. The aboveground parts, including the roots and shoots of the rice plants, were dried at 90 °C in an oven to a constant weight and then weighed. The harvest index (HI) was determined by grain and straw weights (see Supplementary File S5).

2.3.2. Nitrogen Content Determination

The dry matter of grain and straw was milled, digested with H2SO4-H2O2, and the digested solution was subsequently analyzed to determine the TN content using an automatic Kjeldahl apparatus (KjelMaster K-375, Büchi, Flawil, Switzerland).

2.3.3. Ammonium ( NH 4 + –N) Content in Surface Water

Surface water samples were collected only in 2023, and surface water of 100 mL in each plot was sampled for 10 days after biogas slurry application. The NH 4 + –N content in surface water was determined using the indophenol blue colorimetric method [37].

2.3.4. Rice Quality Determination

The sun-dried grains from each plot were stored at room temperature for approximately two months to determine the grain quality. Rice grains of 200 g was successively passed through a rice dehusker and rice polisher for polishing and milling, and the brown rice rate, the milled rice rate, and the head milled rice rate were calculated and expressed as percentages of the 100 g rice grains. Milled rice grains were ground using a cyclonic mill (CT293, FOSS, Hillerød, Denmark), thoroughly blended, and homogenized before passing through a sieve of 150 µm mesh. The protein content was determined using an automatic Kjeldahl apparatus (KjelMaster K-375, Büchi, Flawil, Switzerland). The amylose content was determined using iodine colorimetry at a wavelength of 620 nm, according to the international standard ISO 6647-2:2020(E) [38]. The gel consistency was determined according to the standard GB/T 17891 (high-quality paddy), China [39]. Palatability scores were assessed using a rice taste tester (RLTA10C, SATAKE, Suzhou, China).
To determine the Cu and Zn content, rice flour samples of approximately 0.30 g were decomposed in 6.84 g of HNO3 and 0.6 g of H2O2 using a microwave digestion system (ETHOS UP, Milestone, Sorisole, Italy) with a 25 min ramp to 200 °C followed by a 15 min hold at the same temperature [40]. The Cu and Zn contents in the digestion were measured using an inductively coupled plasma mass spectrometry (ICP-MS) instrument (Agilent 7800, Santa Clara, CA, USA), according to the manufacturer’s instructions.

2.4. Data Analysis

Nitrogen uptake (UN) was calculated using dry matter weight and N content.
The agronomy efficiency of nitrogen (AEN) and recovery efficiency of nitrogen (REN) were selected as indicators of nitrogen-use efficiency. AEN and REN were calculated through Equations (1) and (2):
AE N = Y i Y CK NF
RE N = UN i UN CK NF × 100 %
where Yi and YCK represent the rice yields (kg ha−1) for the fertilization treatments (CN, NBS, BS1, BS1.5, and BS2) and the no-fertilization treatment (CK), respectively. UNi and UNCK represent the nitrogen uptake (kg N ha−1) of rice plants and grains for the fertilization treatments (CN, NBS, BS1, BS1.5, and BS2) and the no-fertilization treatment (CK), respectively. NF is the total nitrogen applied (kg N ha−1).
NH3 volatilization was predicted by a modified mass transport model (Equation (3)) that estimates NH3 volatilization based on the NH 4 + –N concentration, pH, and temperature [41].
Flux ( NH 3 ( gas ) ) = K × [ NH 4 ( aq ) + ] × [ H ] 1 + 10 ( 0.09018 + 2729.92 T pH )
where K is the mass transfer coefficient, NH 4 ( aq ) + is the NH 4 + –N concentration in surface water, H is Henry’s law coefficient, T is the temperature, and pH is the pH. In general, for field experiments on slurry or soil mixtures, the values of the overall mass transfer coefficient ranged from 10–4 to 10–3 m s−1 [33]. According to the results of preliminary experiments in our laboratory, a value of 1 × 10⁻⁴ m s−1 is more appropriate for K in the condition of the specified soil and biogas slurry in this study.

2.5. Statistical Analysis

Data were collected using Microsoft Office 2010. Statistical analysis was performed using the R environment (https://cran.r-project.org/, (accessed on 14 June 2024)). Two-way analysis of variance (two-way ANOVA) was adopted to test the differences in rice yields, harvest index, and yield components between years and treatments. The NH 4 + –N retention concentrations in surface water, accumulated NH3 volatilization, and rice quality indices in 2023 were tested using one-way ANOVA. Tukey’s honest significant difference (HSD) test was used for multiple comparisons. NH 4 + –N concentrations in surface water and NH3 volatilization were fitted using an exponential decay and growth model in SigmaPlot 14.0 (https://systat-sigmaplot.com/, (accessed on 2 May 2023)), respectively.

3. Results

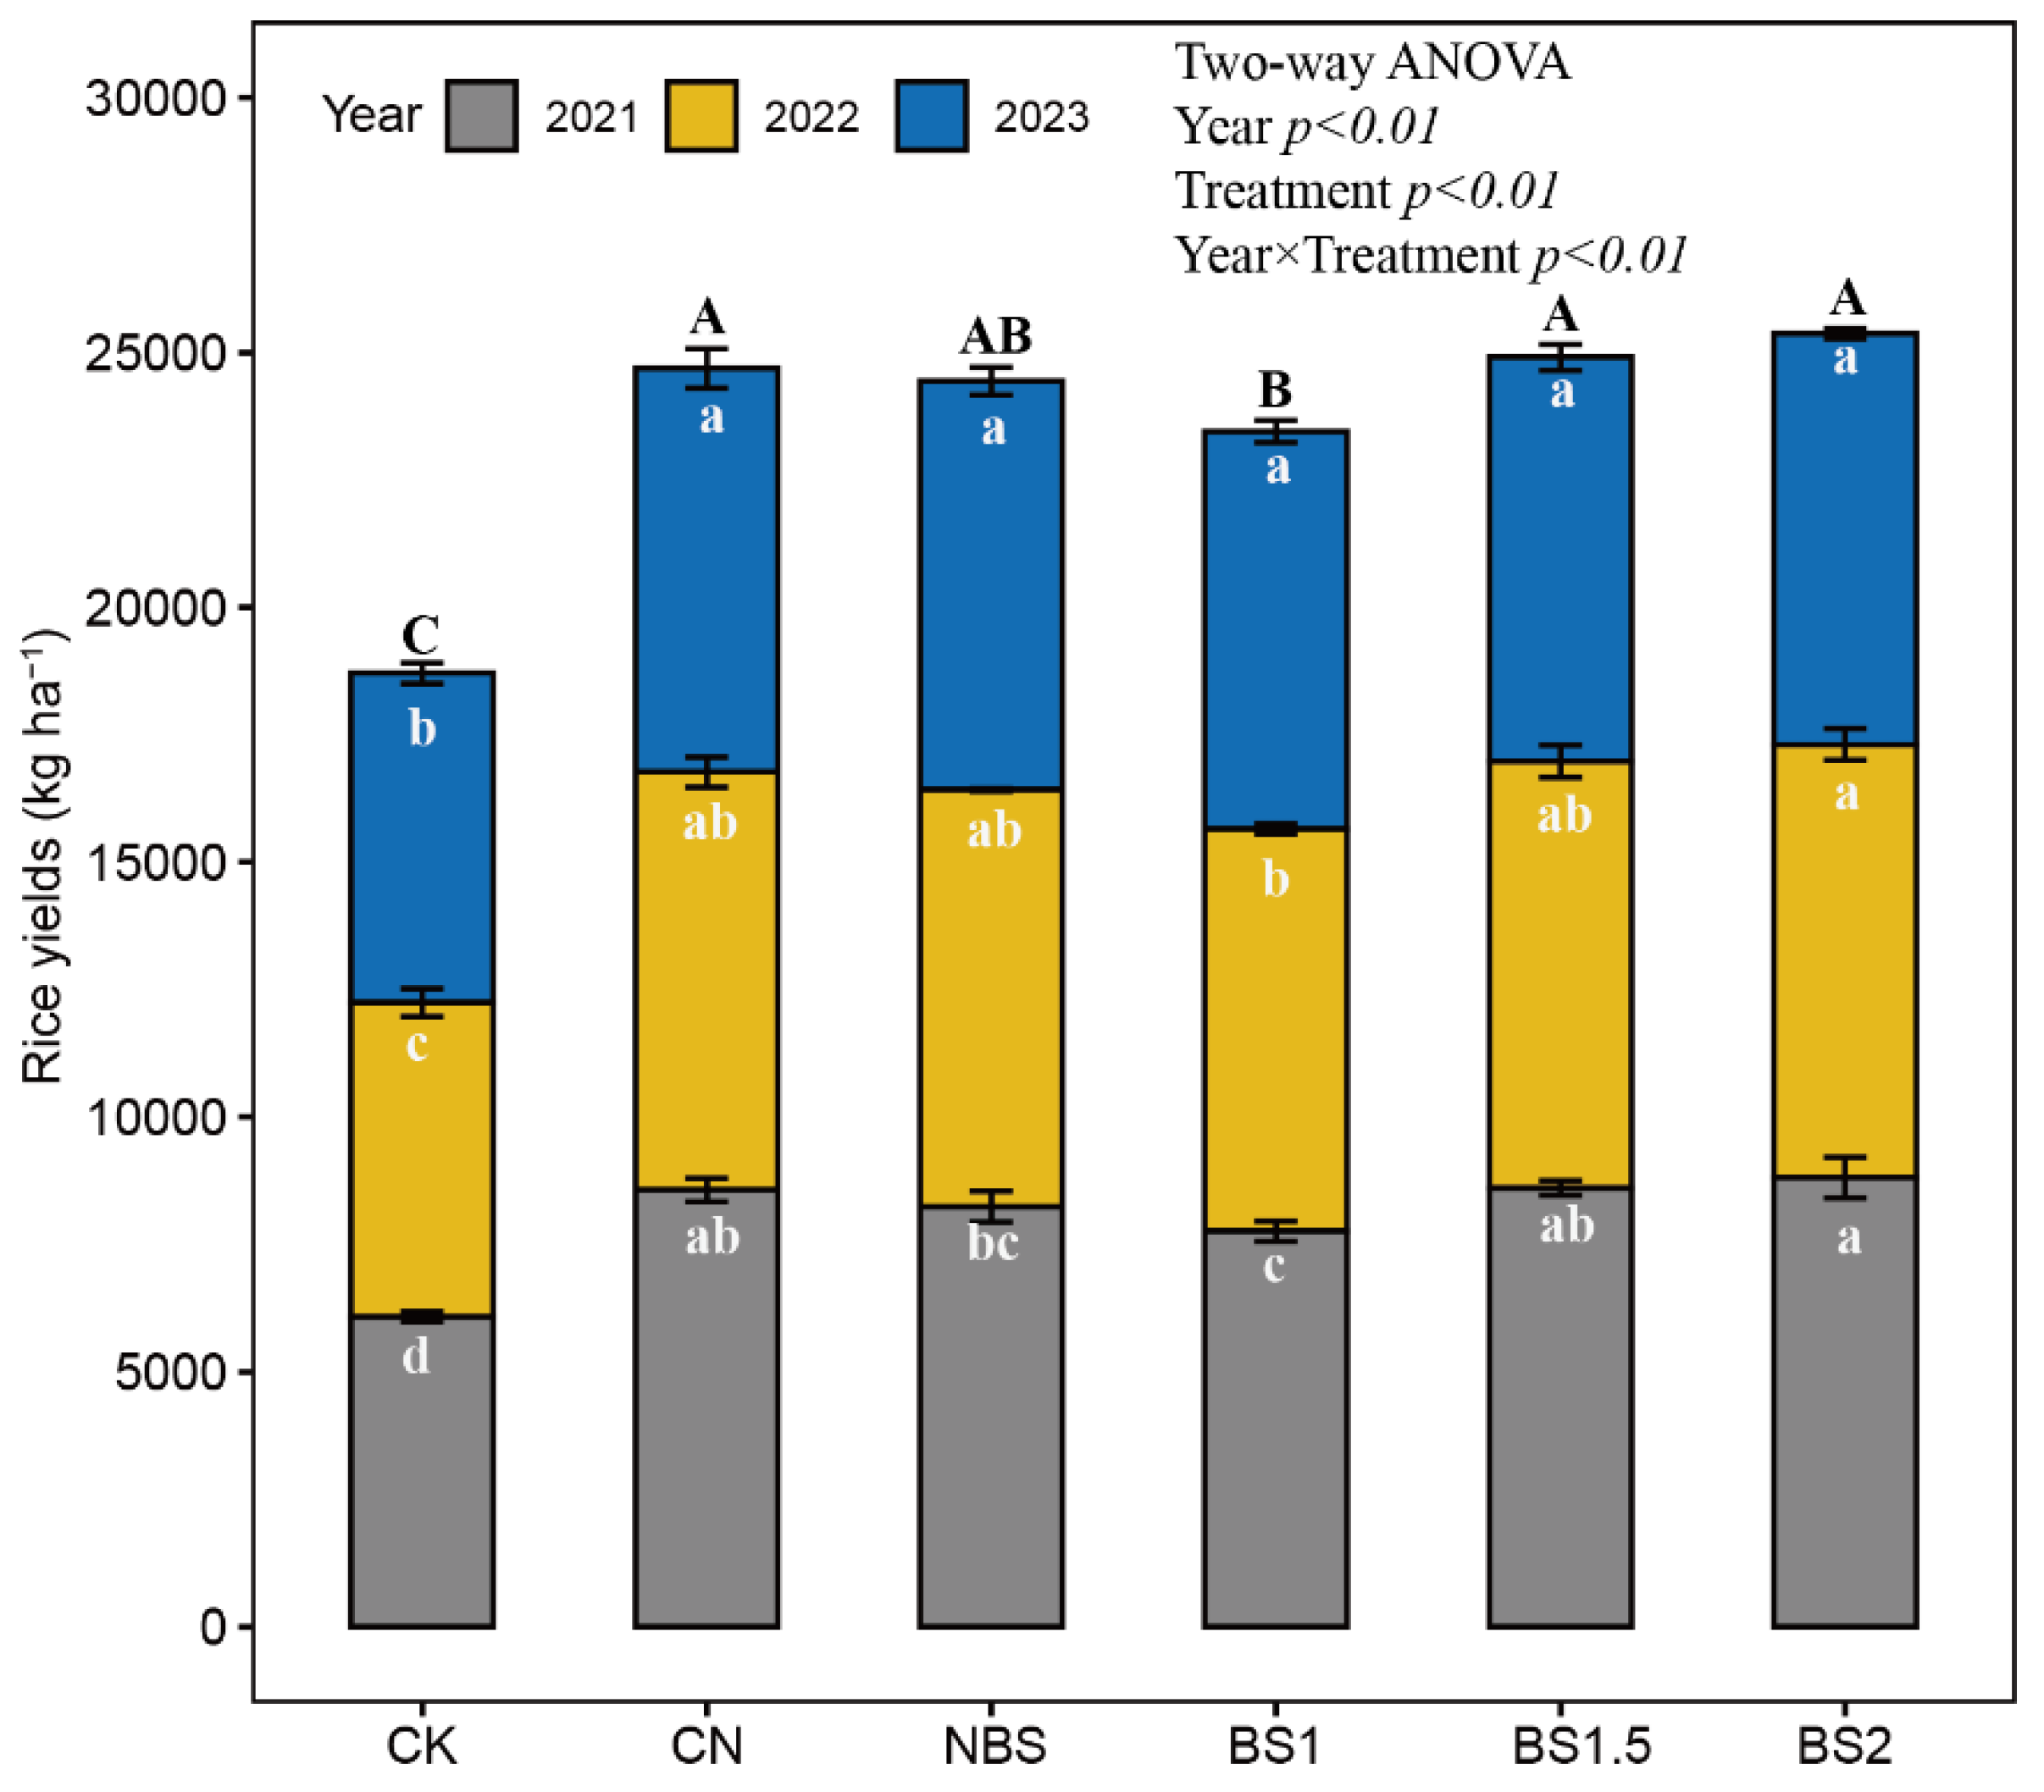
3.1. Rice Yields, Yield Components, and Harvest Index
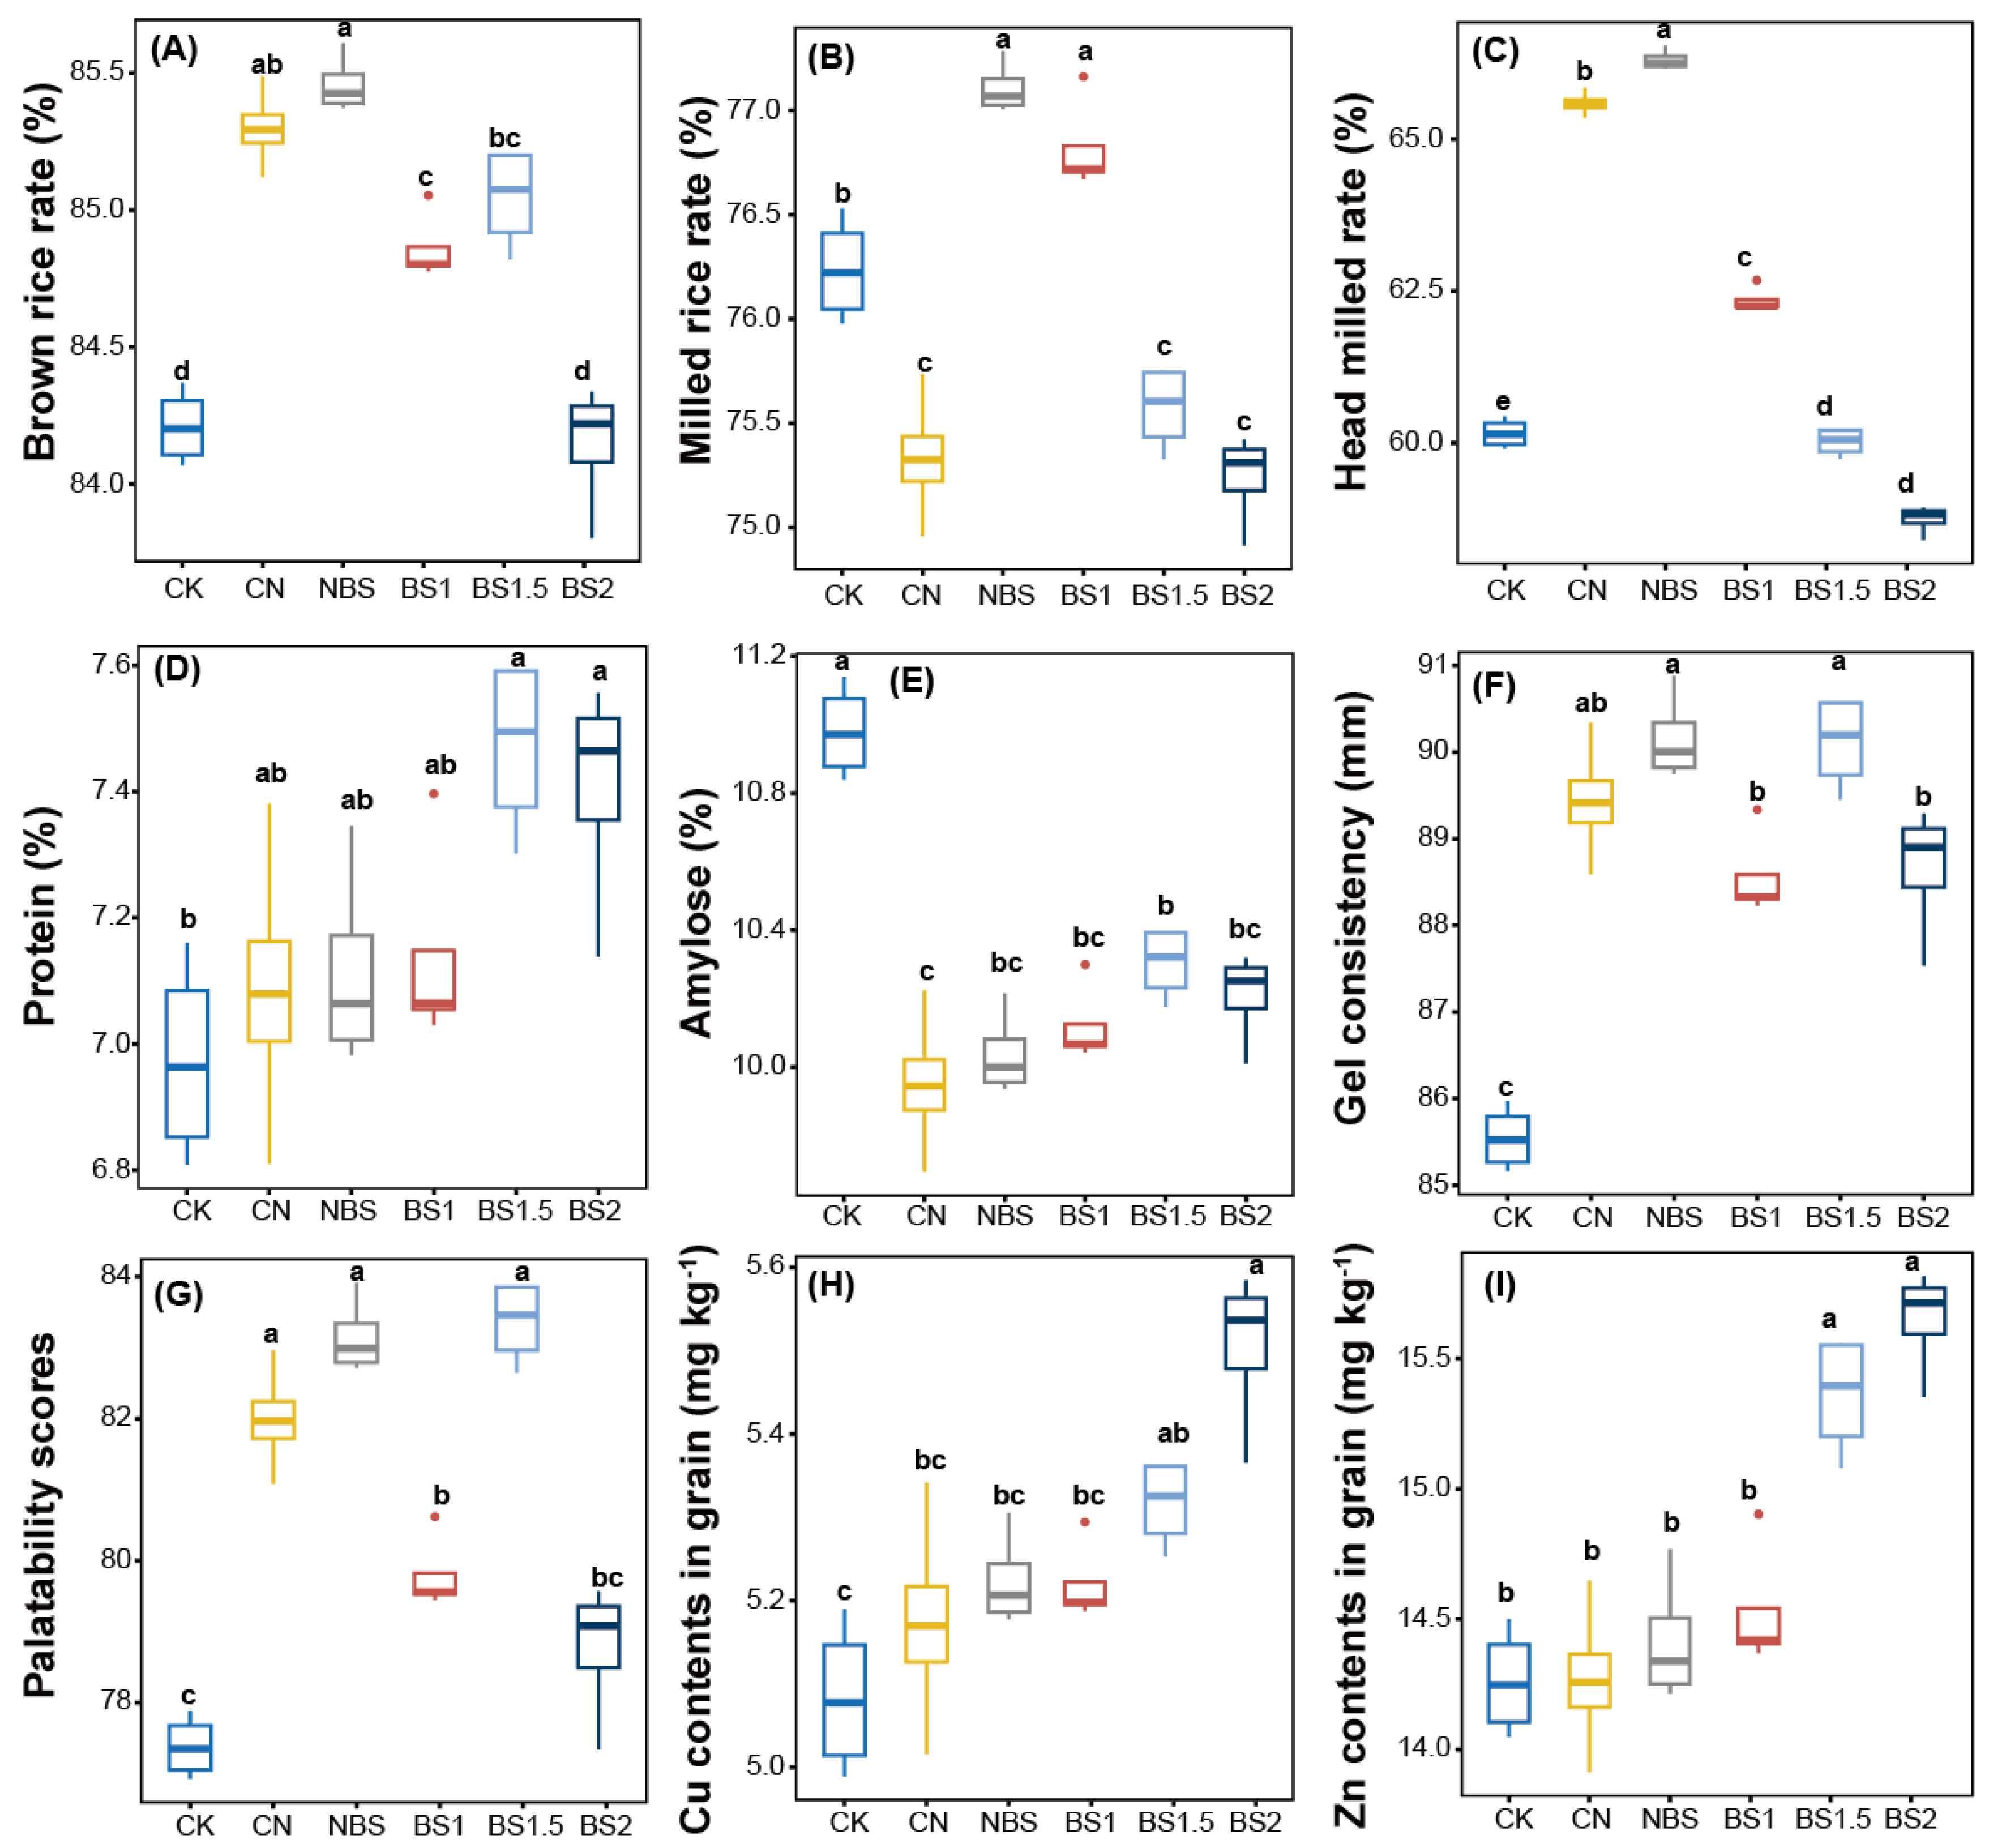
A two-way ANOVA showed that rice yields were significantly affected by year and treatment (Figure 1). For 2021 and 2022, the BS2, BS1.5, NBS, and CN treatments showed significantly higher yields than BS1 and CK; the average rice yields were 8555.7 kg ha−1 and 8310.6 kg ha−1 in 2022 and 2023, respectively. Notably, the yields of fertilization treatments (except CK) in the year 2023 did not show significant differences, with an average yield of 7944.3 kg ha−1. Overall, for the average yield in 2021–2023, there were no significant differences in rice yield among CN, NBS, BS1.5, and BS2, with an average yield of 8283 kg ha−1, and the average yields of BS1 and CK were 7815 kg ha−1 and 6236 kg ha−1, respectively. Specifically, NBS (biogas slurry replacing 50% chemical N) exhibited a high average rice yield of 8145 kg ha−1 over three years.
Analysis of variance indicated that rice grain yields were affected by both the year and the fertilization treatment (Table 2). Heavy utilization of biogas slurry (BS2, BS1.5) promoted panicle numbers. For example, the average panicle number of BS2 in 2021–2023 was 3.05 million ha−1, whereas the average panicle number of CN in 2021–2023 was just 2.84 million ha−1. Notably, NBS treatment was beneficial for enhancing the panicle number, with an average of 2.80 in 2021–2023, which was comparable to that of BS1. Consistent with the observed pattern in the rice panicle number, the spikelet number increased with increased biogas slurry input (Table 2). Although the spikelet number varied over the years, the spikelet number of BS2 was always significantly higher than the others, with an average spikelet number of 128.9, followed by BS1.5, CN, NBS, BS1, and CK. Unexpectedly, the seed-setting rate showed a decreasing trend under heavy utilization of biogas slurry, and BS2 showed a significantly lower seed-setting rate than other treatments (Table 2). Notably, the NBS treatment resulted in a higher seed-setting rate than the heavy utilization of biogas slurry treatments, with an average seed-setting rate of 94.4%, which was 7.3% higher than that of BS2. For 1000-grain weight, CN and NBS treatments showed higher 1000-grain weight than other treatments, and higher utilization of biogas slurry resulted in lower 1000-grain weight. Regardless, the variation in 1000-grain weight is relatively limited, with a range of 25.03–26.52 g.
The harvest index was significantly affected by the treatments (Figure 2). The average harvest index in CN, NBS, and BS1.5 was 0.66, which was significantly higher than that of the other treatments. The average harvest index in BS1 and BS2 was 0.59, which was 11% lower than that in CN, NBS, and BS1.5, but was 9.2% higher than that in CK.

3.2. Rice Quality

Rice’s processing quality was significantly affected by fertilization management (Figure 3A–C). The NBS treatment demonstrated a significantly higher rice processing quality than the other treatments. Importantly, heavy utilization of biogas slurry induced obvious trends of reduction in the brown rice rate, the milled rice rate, and the head milled rice rate. The averages of the brown rice rate, the milled rice rate, and the head milled rice rate in NBS were 85.5%, 77.1%, and 66.3%, respectively; these were 1.7%, 2.5%, and 12.9% higher than those of BS2.
Protein, amylose, gel consistency, and palatability scores are the primary criteria that were generally used to assess the palatability of rice. Over-fertilization, i.e., heavy utilization of biogas slurry, significantly stimulated rice protein content and significantly decreased amylose content compared to the CK and CN treatments (Figure 3D,E). Gel consistency and palatability scores were also significantly affected by different fertilization methods, and CN, NBS, and BS1.5 demonstrated higher gel consistency and palatability scores than other treatments, indicating that optimal application of biogas slurry could achieve better gel consistency and palatability scores. As a comprehensive indicator of eating quality, the average palatability score of CN, NBS, and BS1.5 was 82.8, which was 3.8% and 5.1% higher than those of BS1 and BS2, respectively.
According to the standard NY 861—2004 of China [42], the standard limit values of Cu and Zn content in rice grains are 10 mg kg−1 and 50 mg kg−1, respectively. Although the Cu and Zn concentrations were significantly affected by fertilization (Figure 3H,I), the Cu and Zn concentrations were still below the maximum permissible concentrations. As expected, heavy utilization of biogas slurry enhanced the assimilation and accumulation of Cu and Zn in rice grains. For instance, the average Cu and Zn content of BS2 reached 5.51 mg kg−1 and 15.6 mg kg−1, respectively, and were 6.6% and 6.9% higher than that of CN.

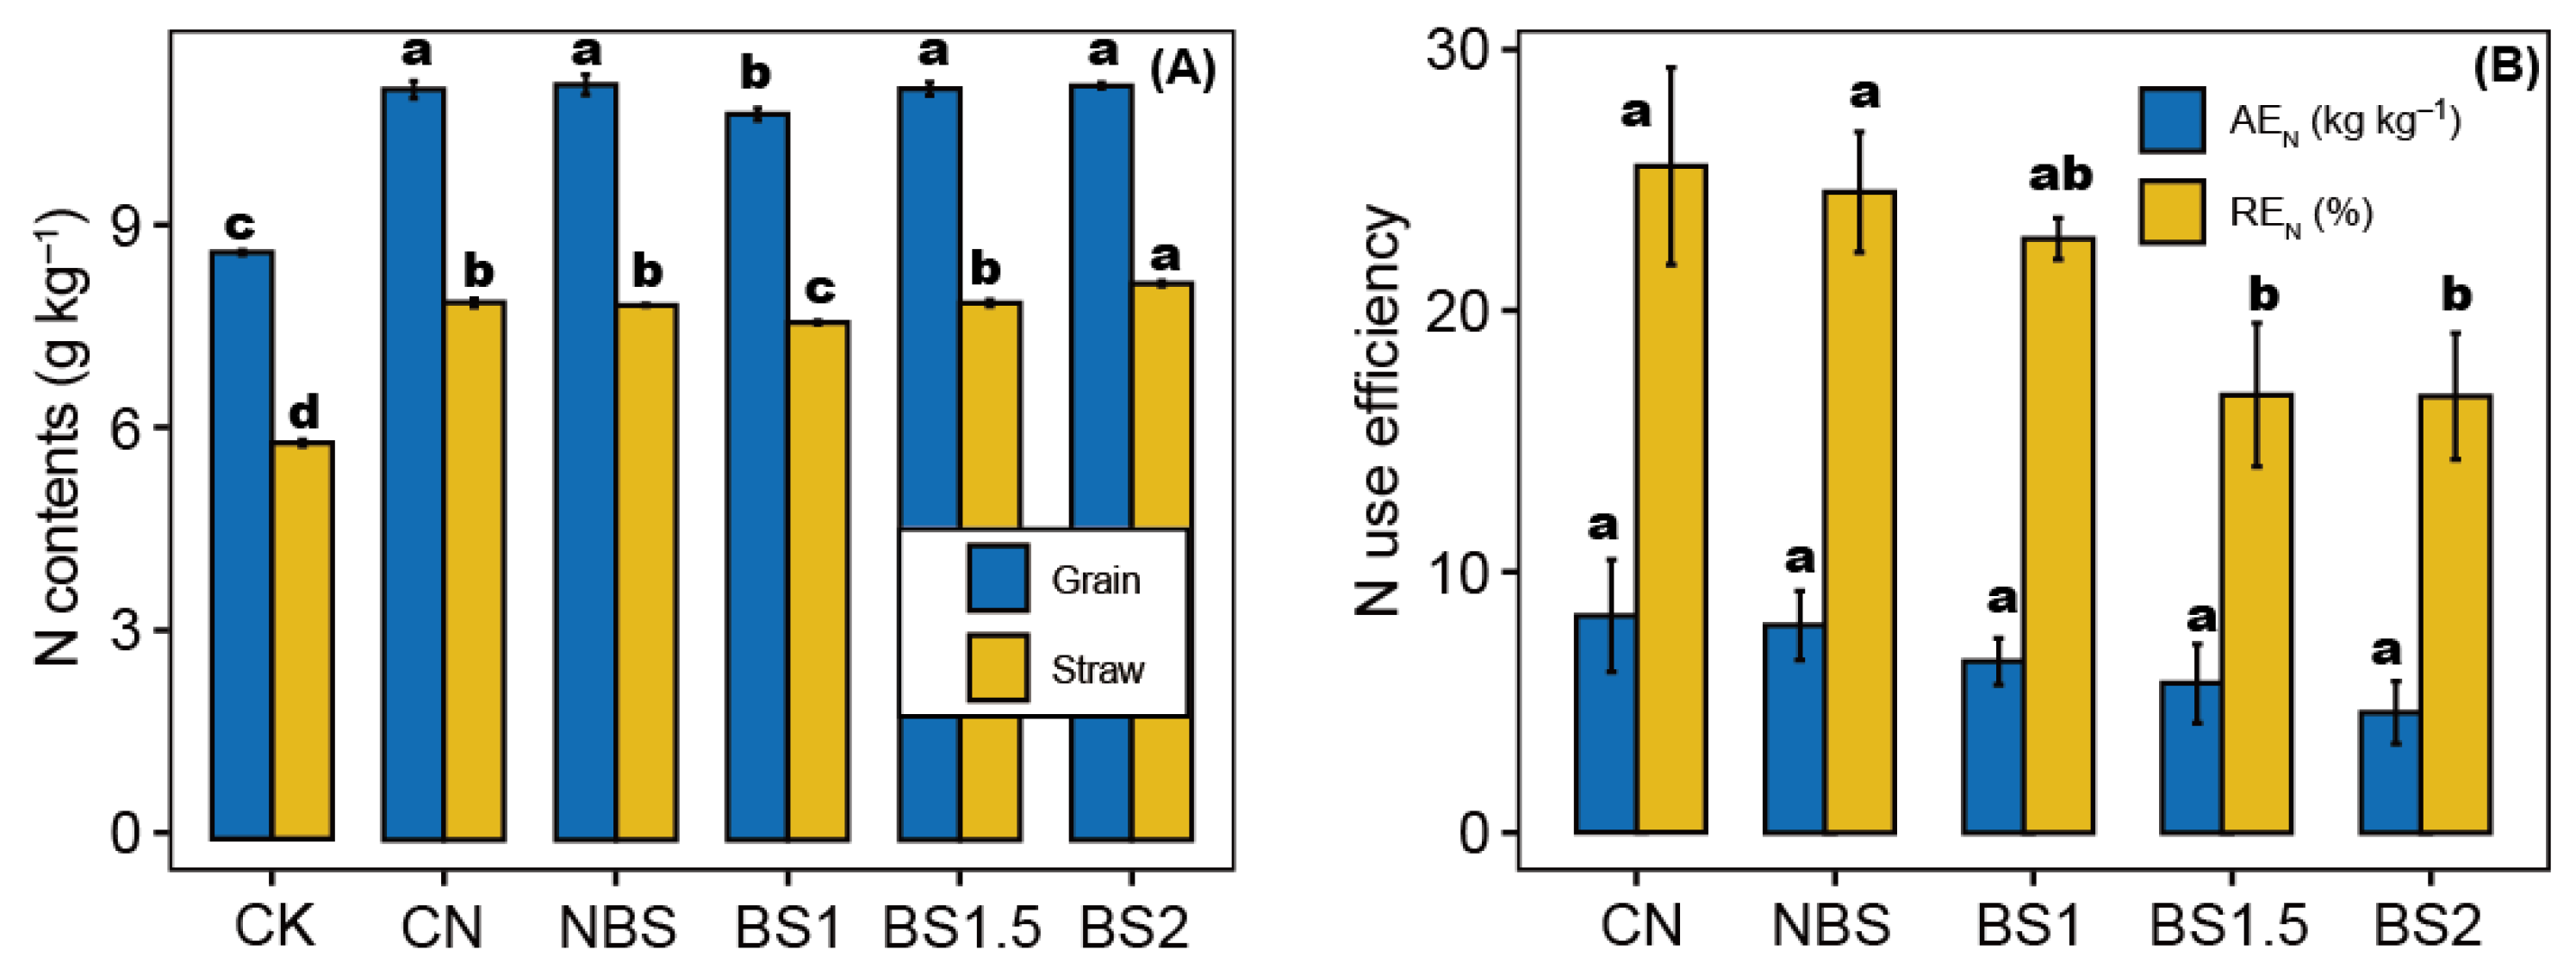
3.3. Nitrogen-Use Efficiency
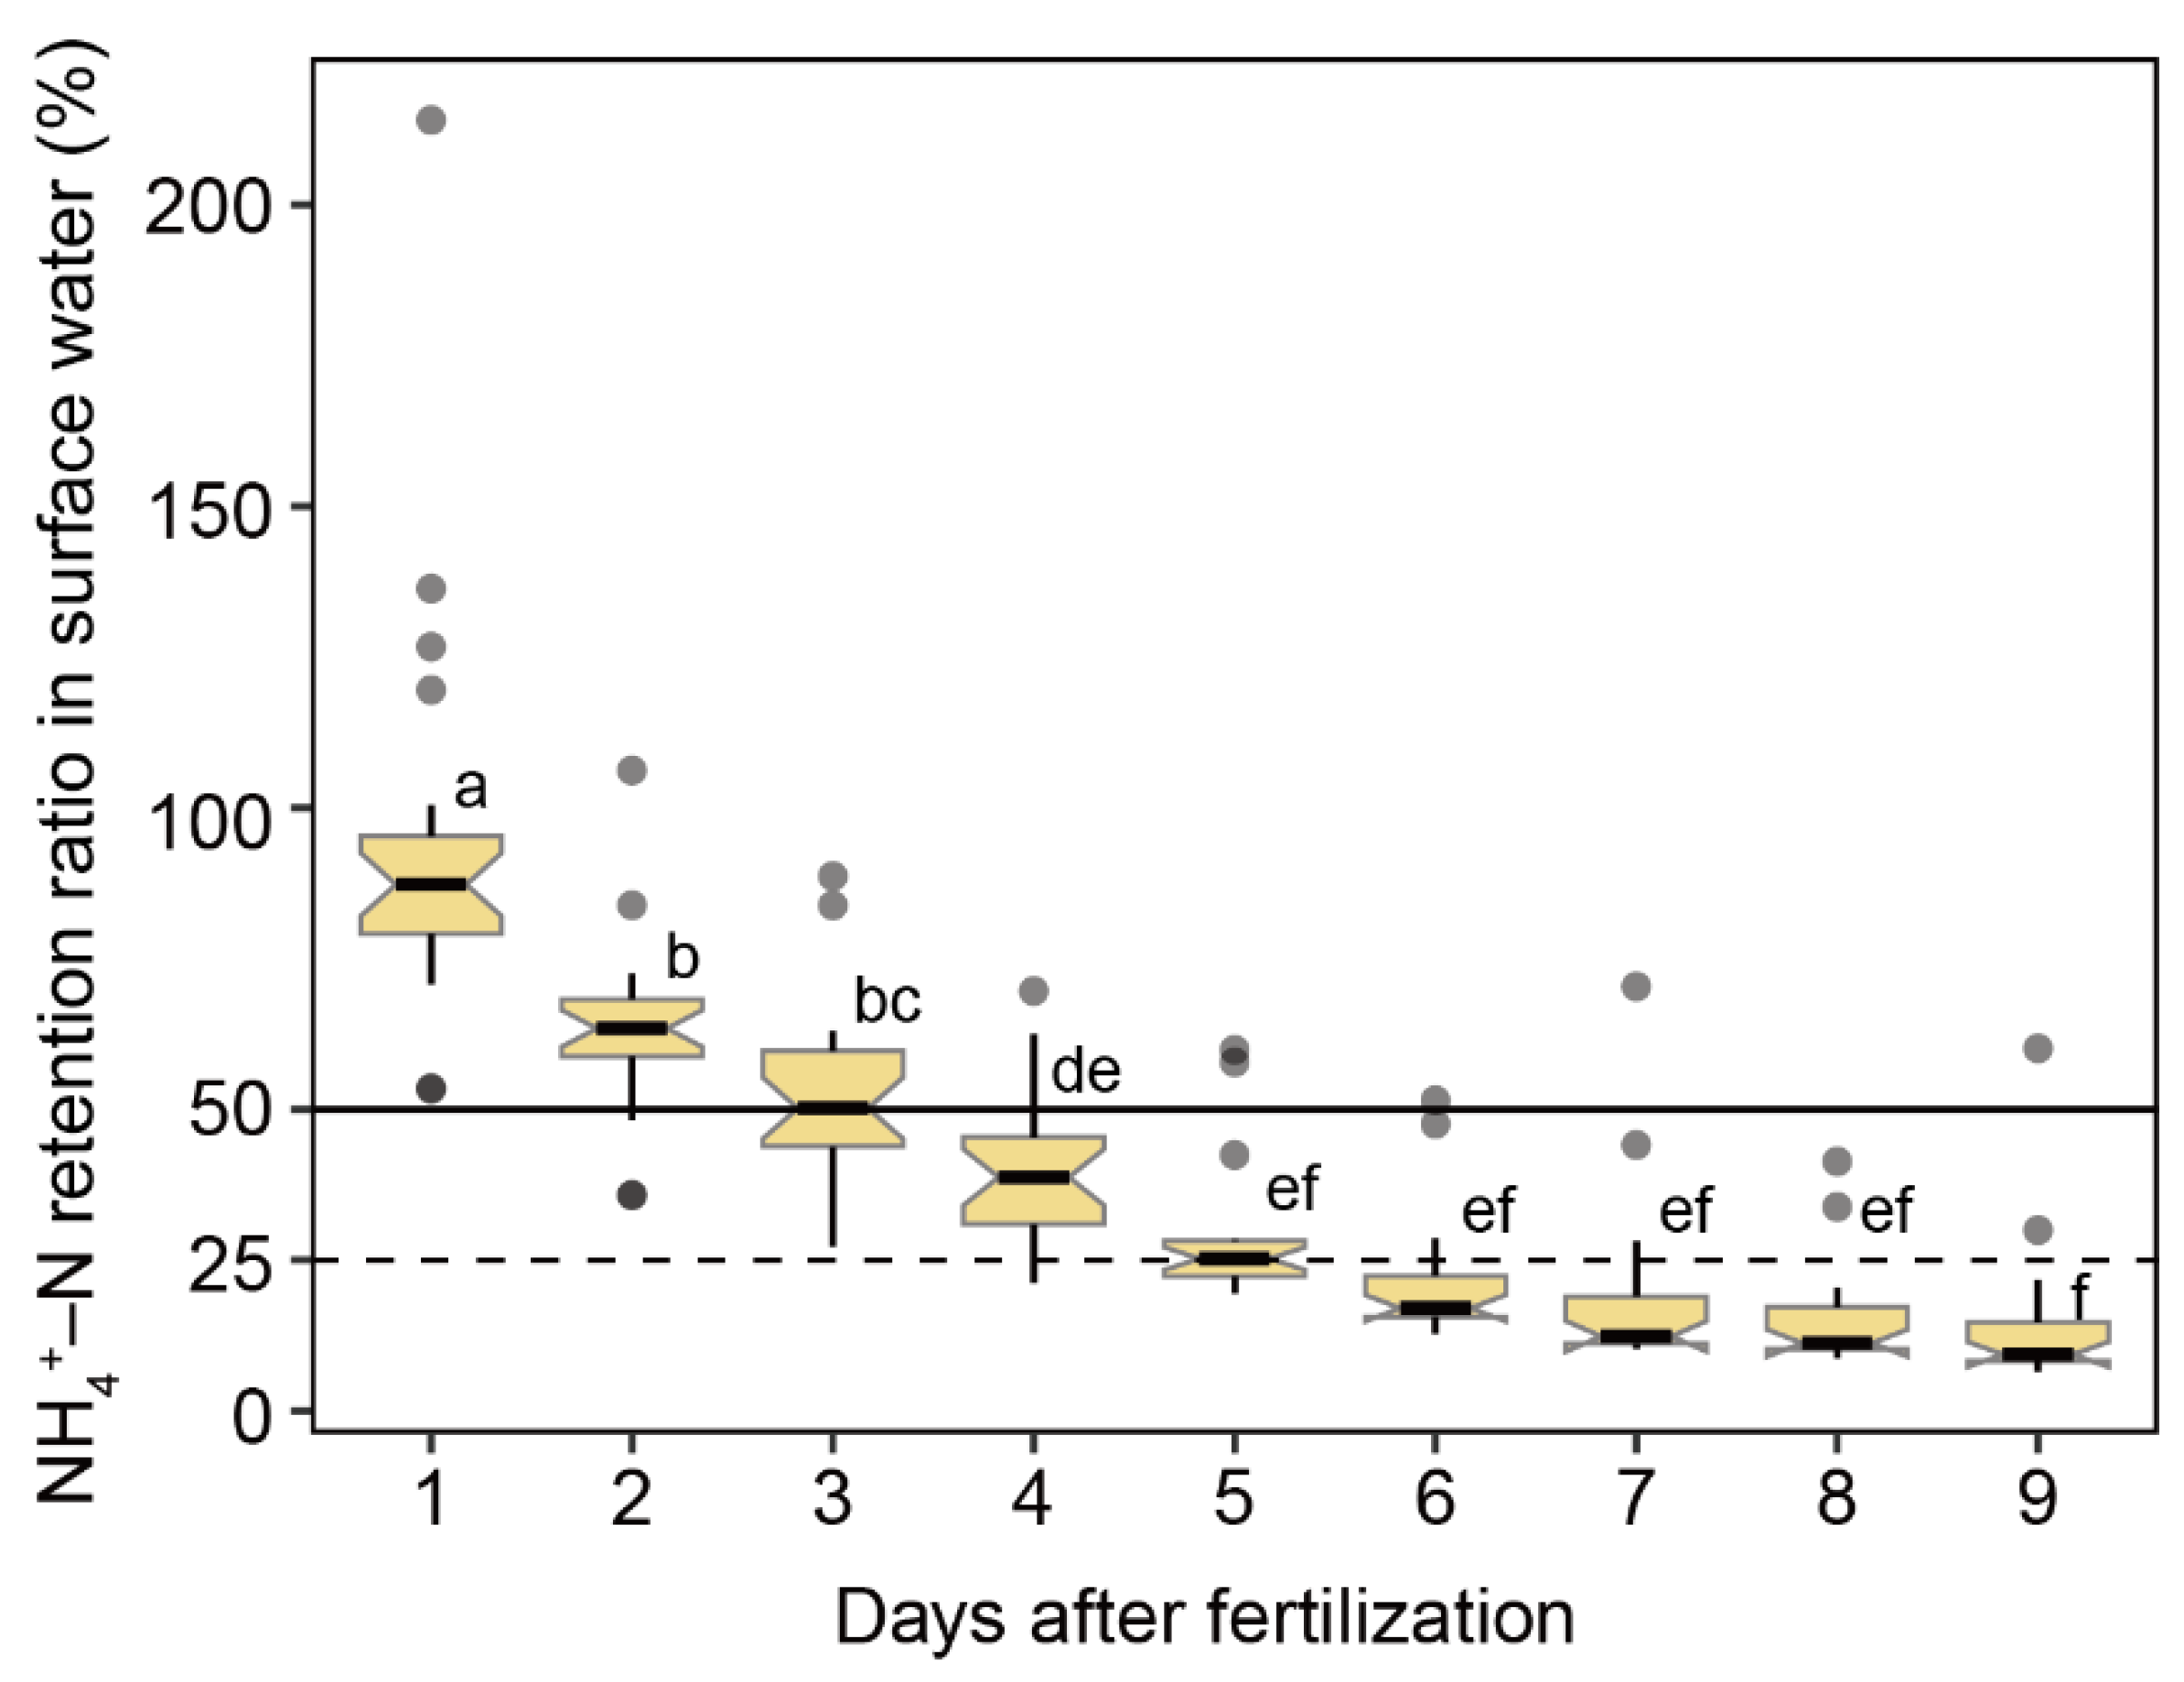
Fertilization significantly affected the TN content in the grains and straw (Figure 4A). CN, NBS, BS1.5, and BS2 showed the highest TN content in rice grains, with an average of 11.14 g kg−1, which was 3.7% and 28.3% higher than the BS1 and CK content, respectively. BS2 also showed the highest TN content of 8.23 g kg−1 in rice straw, followed by the treatments of BS1.5, CN, and NBS, which resulted in an average TN content of 7.93 g kg−1. Notably, the TN content in BS1 was 7.66 g kg−1, which was significantly lower than that in the other fertilization treatments.
Although fertilization did not significantly affect AEN, the AEN values of the CN and NBS treatments were 8.6 kg kg−1 and 7.9 kg kg−1, respectively, and were substantially higher than those of other treatments (Figure 4B). Notably, heavy utilization of biogas slurry was associated with a decreasing trend in AEN, and the BS2 treatment exhibited an AEN of 4.6 kg kg−1, which was approximately only 56% of that observed in the CN treatment. Concurrently, fertilization had a significant impact on REN (Figure 4B), with the primary trend being parallel to that of AEN. The incorporation of biogas slurry significantly reduced REN, with the CN treatment demonstrating a REN of 25.5%, approximately 1.5 times that of BS2.

3.4. N H 4 + –N Concentrations in Surface Water

Considering that NH 4 + –N accounted for approximately 95% of TN in the biogas slurry in this study, the NH 4 + –N content in the surface water was measured instead of TN. For the CN treatment, the NH 4 + –N content on the day of fertilization (day 0) was much lower than that on the first day after fertilization (Figure 5A–D). In other circumstances, NH 4 + –N concentrations in surface water always decreased rapidly in the days that followed fertilization, which could be well fitted by an exponential decay model in the transplanting, tillering, jointing, and booting stages (Figure 5A–D). Notably, the average NH 4 + –N concentrations on the third and fifth days were approximately 50% and 25% of the NH 4 + –N content on the fertilization day, respectively (Figure 6).

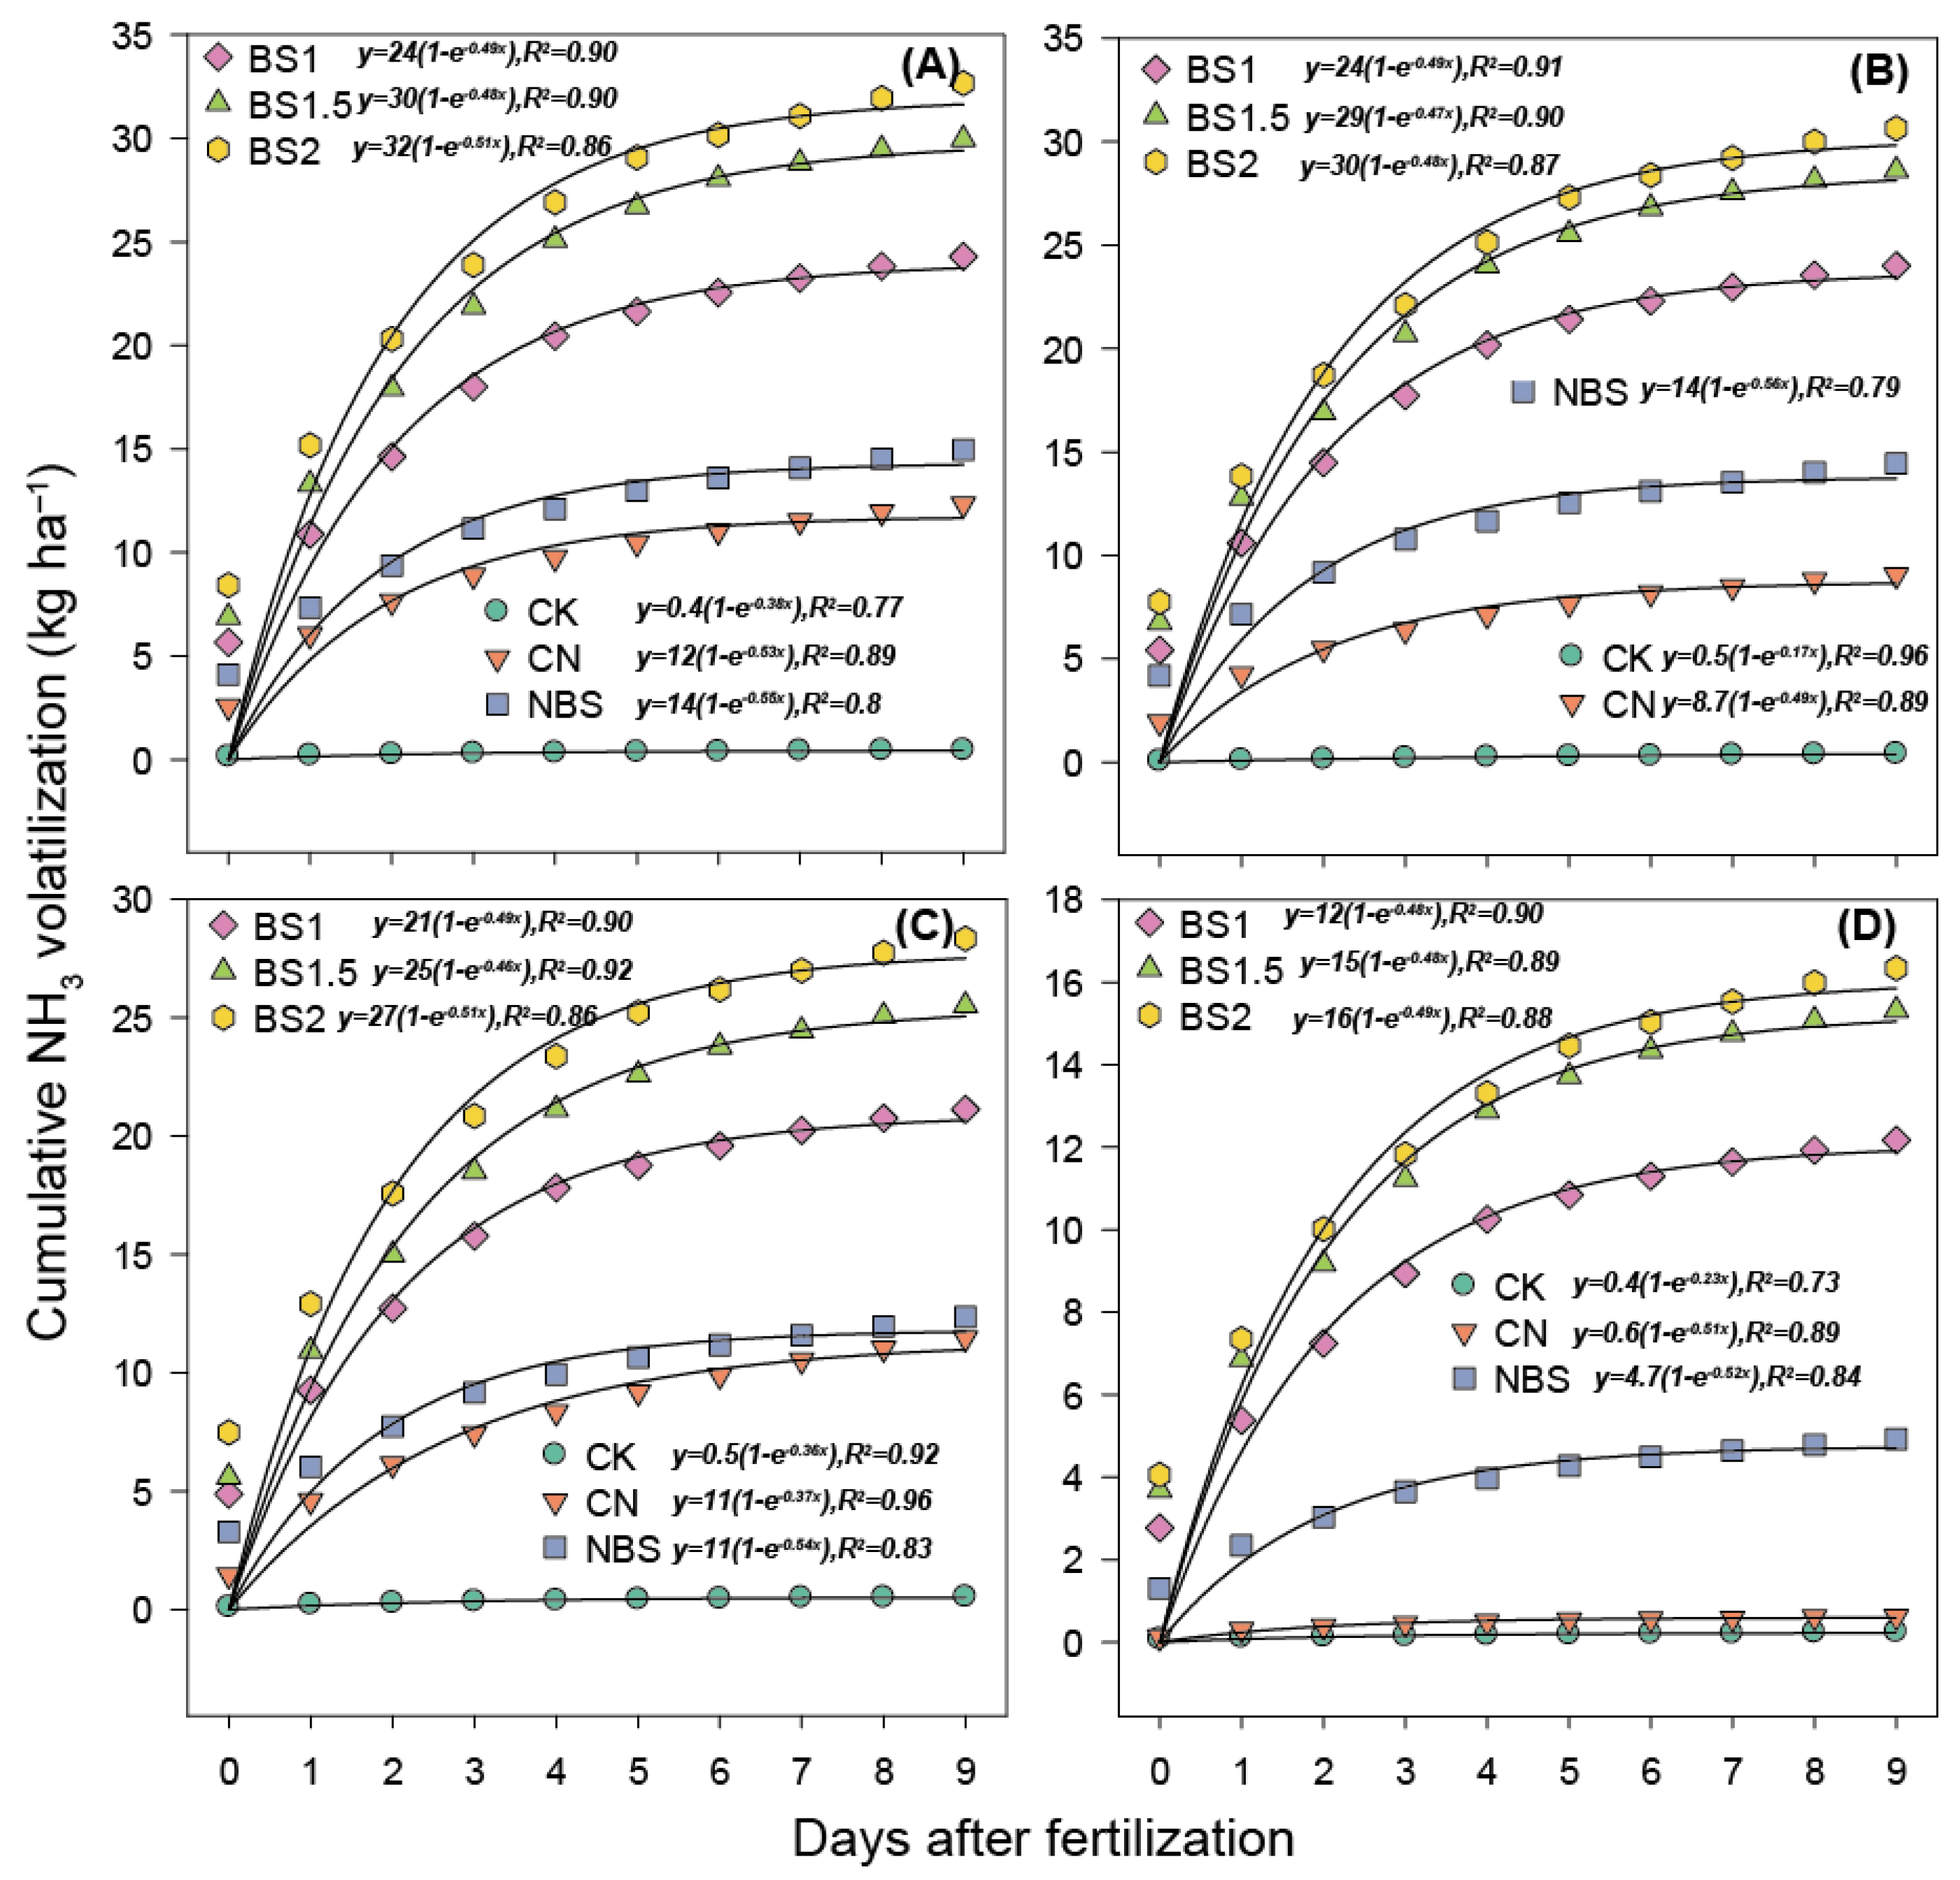
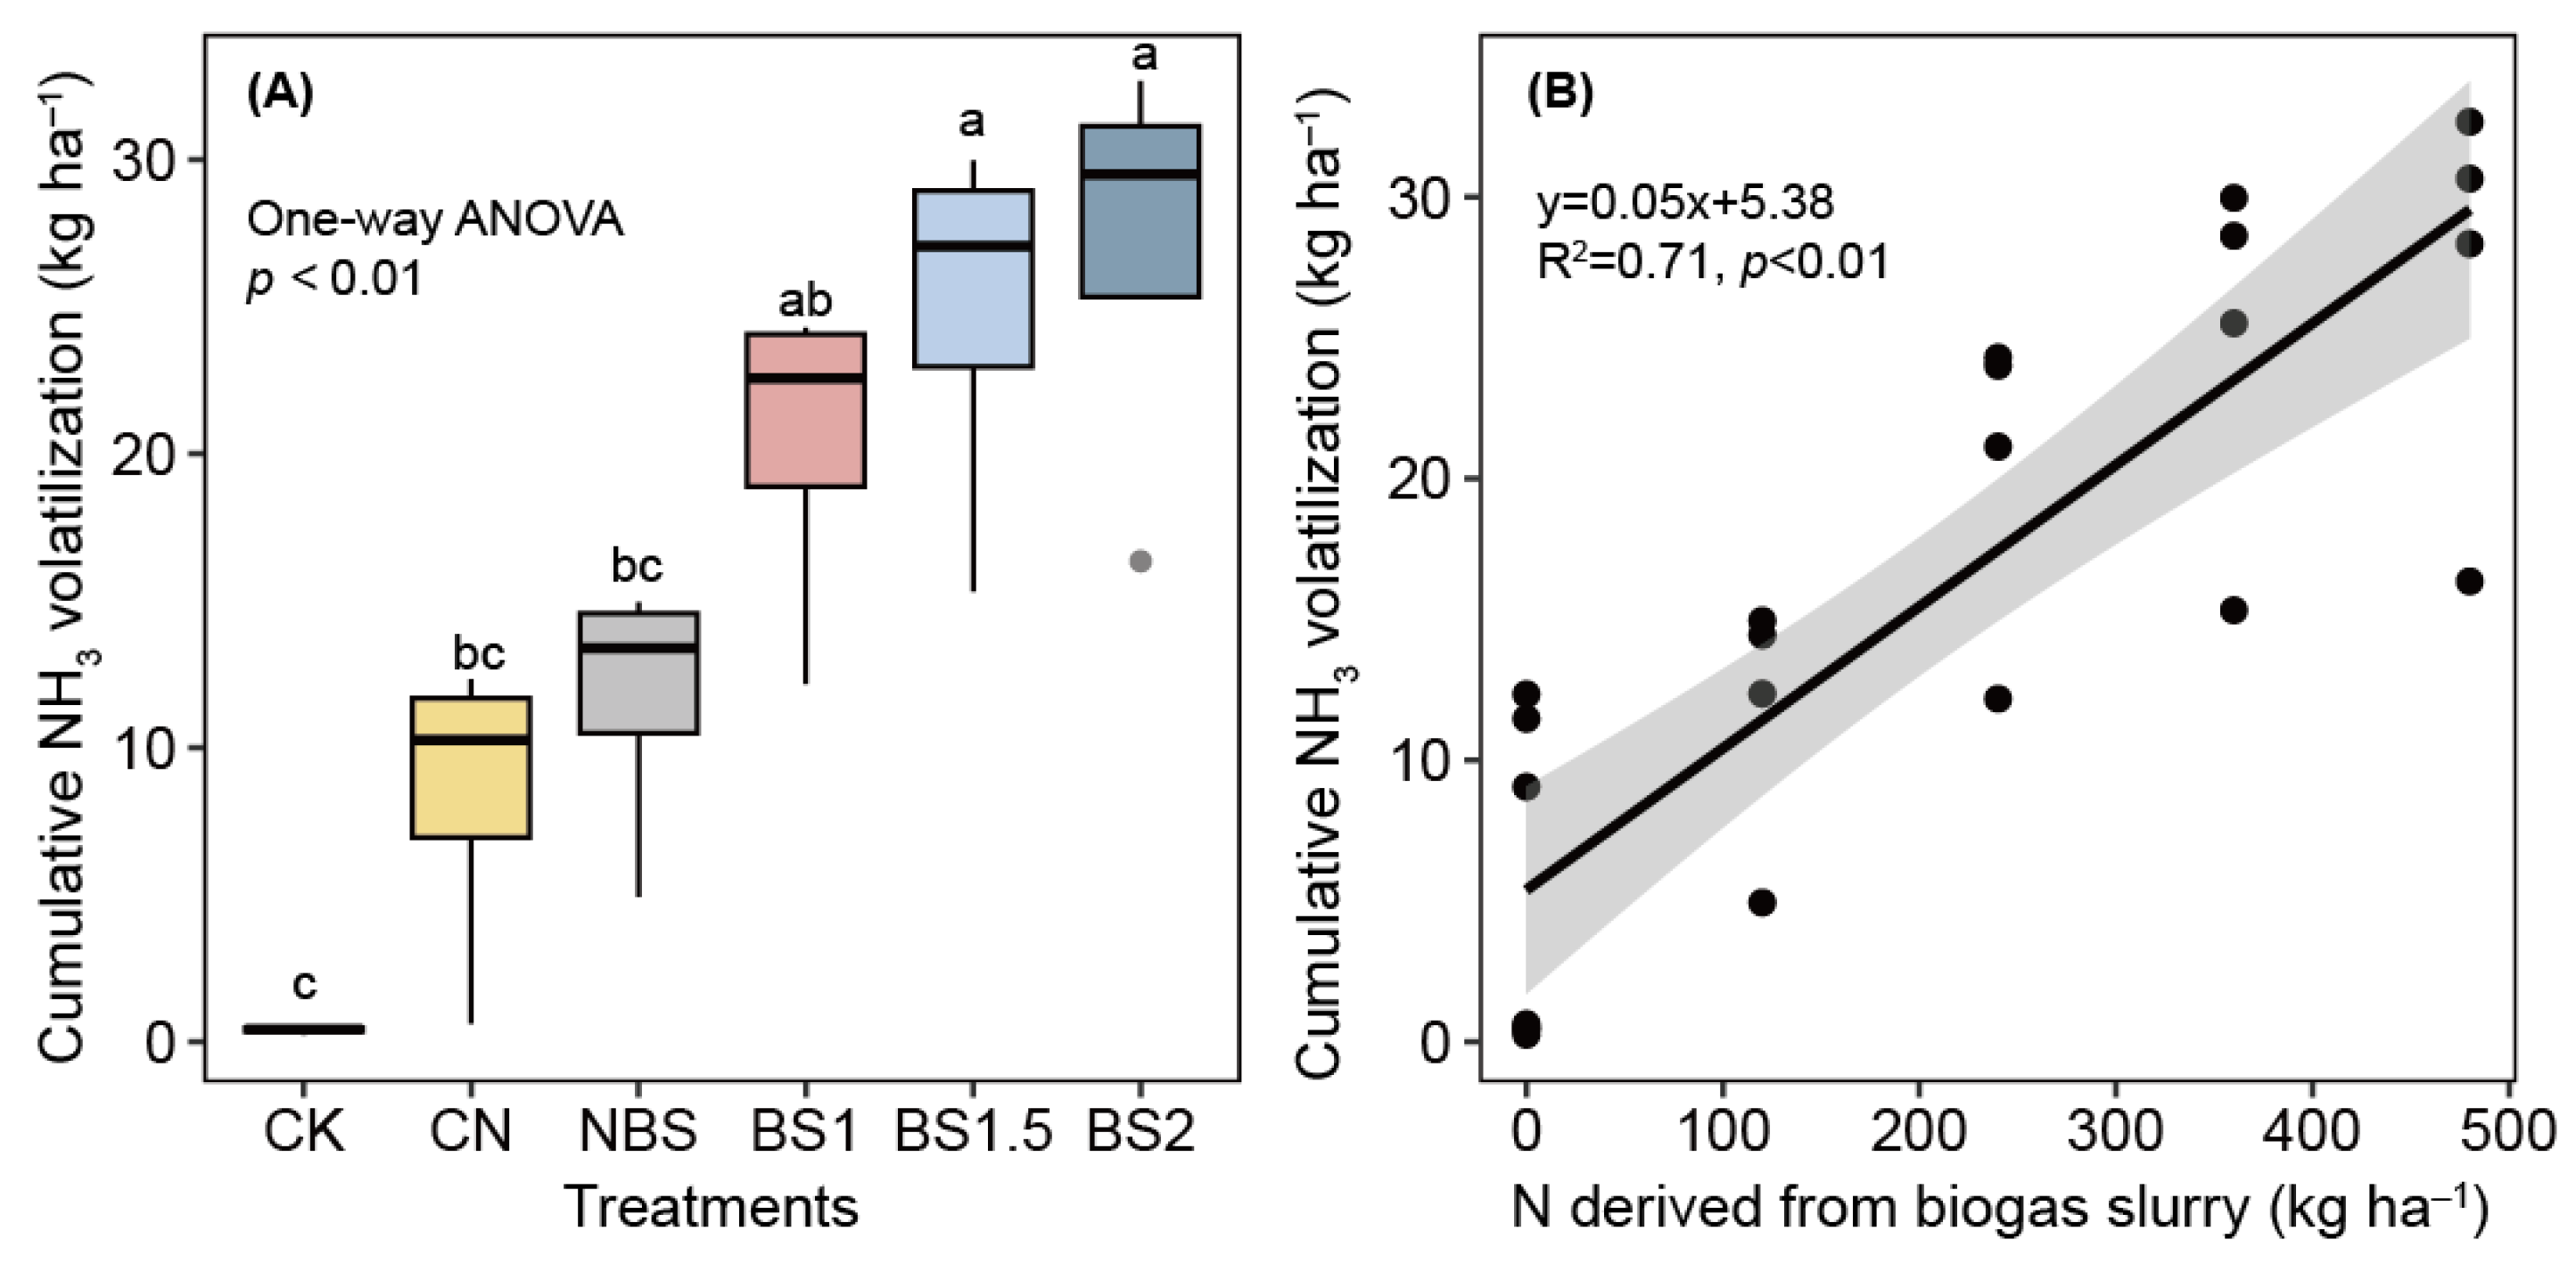
3.5. Characteristics of NH3 Volatilization

NH3 volatilization was predicted by a mass transport model, and cumulative NH3 was well fitted using the exponential rise model (Figure 7A–D). NH3 volatilization was vigorous in the first few days after fertilization. It is estimated that more than 50% of NH3 volatilization occurs within the first two days after biogas slurry fertilization. For instance, the ranges of NH3 volatilization were 53.9–62.2%, 38.0–63.4%, 63.8–74.7%, and 54.9–61.5% within the first two days after fertilization in the transplanting, tillering, jointing, and booting stages, respectively.
On the tenth day after fertilization, the cumulative NH3 volatilization was significantly influenced among treatments, and the BS2 treatment demonstrated the highest NH3 volatilization, with an average of 27.0 kg ha−1, which was 1.08, 1.13, 2.3, 3.2, and 66.0 times the averages of BS1.5, BS1, NBS, CN, and CK, respectively (Figure 8A). A linear regression model was used to assess the efficiency of NH3 volatilization under different N levels derived from biogas slurry, with a significant intercept of 0.05 (Figure 8B). That is, for every additional 1 kg N ha−1 derived from biogas slurry, 0.05 kg ha−1 NH3 volatilization would occur.

4. Discussion

4.1. Rice Yields, Quality, and Potential Safety Risks

Compared to the conventional fertilization treatment (CN), heavy application of biogas slurry significantly enhanced rice yields in this field trial, and BS2 (480 kg N ha−1) reached the highest rice grain yield (Figure 1). Our results are consistent with those published by Jiang et al., who found that the highest rice yield was obtained with a high dosage of biogas slurry [43]. Interestingly, we found that NBS (replacing 50% chemical N) also achieved an equivalent amount of grain yield to that of BS2. Wang et al. and Hou et al. separately reported that treatments in which biogas slurry replaced 70% and 80% of the chemical fertilizer achieved the highest grain yields [20,22], indicating that replacing chemical fertilizers with biogas slurry might be an optimal strategy for rice production.
The yield component analysis explained that the NBS treatment could achieve high rice yield when administered in the form of heavy biogas slurry applications. The heavy application of biogas slurry (BS1.5 and BS2) promoted panicle and spikelet numbers but led to a limited seed-setting rate and 1000-grain weight (Table 2). The increase in panicle and spikelet numbers was attributed to a higher supply of NH 4 + –N, which greatly increased the tillering and spikelet numbers [44]. Thus, it was determined that excessive tillering paradoxically decreases the seed-setting rate and 1000-grain weight [45]. Moreover, heavy application of biogas slurry simultaneously delayed rice maturation, resulting in a decrease in 1000-grain weight and higher dry matter in the straw [46], which was supported through the harvest index (Figure 2). Notably, NBS possessed the highest seed-setting rate and 1000-grain weight compared to the other treatments, but with moderate numbers of panicles and spikelets (Table 2). We inferred that biogas slurry application had different mechanisms affecting rice yield formation. That is, heavy application of biogas slurry (BS1.5 and BS2) generally promotes rice yield by increasing panicle and spikelet numbers, while moderate application of biogas slurry (NBS and BS1) promotes rice yield by increasing the seed-setting rate and 1000-grain weight.
Rice quality is generally regulated by genes, climate, agronomy strategies, and environmental factors [15,16,47]. The application of more N fertilizer usually increases the brown rice rate and head milled rice rate [45,48]. For instance, Wang et al. showed that heavy application of biogas slurry (BS1.5 and BS2) enhanced the brown rice rate, the milled rice rate, and the head milled rice rate [20]. However, our results opposed this finding (Figure 3A–C). We argued that biogas slurry contained abundant available N ( NH 4 + –N), which was found to delay maturity and finally result in insufficient grain filling and poor processing quality [45,49], especially for the late-mature soft japonica variety (Suxianggen-100) in our study. The N dosage is positively and negatively correlated with rice protein and amylose content, respectively [50,51]. As expected, heavy application of biogas slurry (BS1.5 and BS2) induced higher protein and lower amylose contents (Figure 3D,E). Gel consistency and palatability scores are a comprehensive index for eating quality, and our results pointed out that NBS and BS1.5 achieved the best eating quality, suggesting that optimal utilization of biogas slurry was benefit for rice eating quality [52,53].
Obviously, heavy utilization of biogas slurry (BS1.5 and BS2) resulted in the enrichment of Cu and Zn in rice grains (Figure 3H,I) and potential food safety risks. Regardless, these heavy metal contents were still below the maximum permissible concentrations according to the Chinese standard (GB 2762—2012) [54]. Considering the use of Cu and Zn as feed additions for livestock [25,55], there are inevitable accumulations of Cu and Zn in soil and rice grain. In fact, the accumulation of heavy metals via utilization of biogas slurry in soil is generally slow. It has been estimated that the safe utilization period of biogas slurry is approximately 63 years in coastal rice–wheat rotated farmland in China [56]. Furthermore, heavy metals are always a particular concern, and other metals, such as Cd, Pb, Cr, Hg, and As, should be monitored and assessed in future research.

4.2. Nitrogen-Use Efficiency and Loss

The utilization of slow-release fertilizers, urease inhibitors, and nitrification inhibitors resulted in an increase in N uptake by 8.0% based on a global meta-analysis [57]. In contrast, as a rapid-acting N fertilizer, biogas slurry exhibited abundant NH 4 + –N content, which reduced nitrogen-use efficiency. Thus, there was an obvious downtrend in AEN after utilization of biogas slurry, and heavy utilization of biogas slurry (BS1.5 and BS2) demonstrated significantly lower REN in this study (Figure 4). In other words, lower nitrogen-use efficiency is a trade-off for N loss. To date, the major pathways of N loss include water runoff, downward leaching, NH3 volatilization, and N2O and N2 loss via nitrification and denitrification [31,32]. In this study, we determined the N concentrations in surface water and estimated the NH3 volatilization. Water runoff is a key process in non-point pollution of agriculture [58]. Herein, NH 4 + –N retention rates of 50% and 25% in surface water were found on the third and fifth days, suggesting that the potential intensity of N loss from water runoff could occur on the first few days after biogas slurry fertilization. Zhou et al.’s findings were consistent with our results and showed similar exponential decay of NH 4 + –N in surface water [33].
NH3 volatilization is another important route by which N loss occurs, accounting for 2.5–16.4% of N emissions [23,34]. We estimated NH3 volatilization via a modified mass transport model, and the rapid decrease in NH3 was mainly due to the NH 4 + –N concentration, pH, and ambient temperature [39]. We found that 50% of NH3 was emitted in the first two days, indicating that NH3 volatilization was intensive and transient in paddy fields [59]. Notably, heavy utilization of biogas slurry (BS1.5 and BS2) significantly enhanced the cumulative NH3 volatilization, and the final loss of NH3 volatilization after the utilization of biogas slurry was estimated using the linear model, with an intercept of 0.05. This model could not only help us to predict the final NH3 volatilization via applied N from biogas slurry but also contribute to optimizing the application of biogas slurry in the Yangtze River Delta region.
Due to the limitations of experimental conditions, we did not conduct research on N loss in leachate or other forms of gaseous N loss, including N2O and N2. Regardless, the N loss in leachate was relatively lower because of the plow pan layer in the paddy field [60,61], and NO 3 –N is generally more prone to leaching than NH 4 + –N. We monitored the underground water after a 5-year utilization of biogas slurry in an adjacent field in 2023, and the average NO 3 –N concentrations of water 1 m underground were 8.46 mg L−1, satisfying Class III of the standards for groundwater quality (GB/T14848–2017) [62]. Meanwhile, inevitable N loss via N2O and N2 emissions is mainly regulated by water management in paddy fields [63], which requires further study under the conditions of biogas slurry application.

5. Conclusions

In summary, the findings of the consecutive three-year field trial indicated that the application of biogas slurry significantly influenced rice yield, grain quality, nitrogen-use efficiency, and N loss. The heavy utilization of biogas slurry (BS1.5 and BS2) resulted in higher rice productivity but induced lower rice grain quality and nitrogen-use efficiency, higher potential food safety risk, and higher N loss via surface water and NH3 volatilization. The moderate utilization of biogas slurry (NBS and BS1) resulted in better rice quality and N-use efficiency, lower potential food safety risk, and N loss. Notably, NBS achieved a high yield that was close to that achieved through the heavy utilization of biogas slurry treatments and significantly improved the brown rice rate, the head milled rice rate, the gel consistency, and the palatability compared to BS1. Thus, we propose that NBS (biogas slurry replacing 50% chemical N) could be the optimal utilization option for biogas slurry application under the dual constraints of agronomy and the environment in the Yangtze Delta region. However, this study still has a few shortcomings: the Cd, As, Pb, and Hg content in rice grain, the N leaching rates, and the losses of N via nitrification and denitrification were not considered after biogas slurry application. These issues are probably limitations in our evaluation of biogas slurry applications and need to be studied further in the future.

Supplementary Materials

The following supporting information can be downloaded at: https://www.mdpi.com/article/10.3390/agronomy14092142/s1, File S0: rice yields; File S1: rice yield components and harvest index; File S2: rice grain quality; File S3: nitrogen contents of grain and rice and nitrogen-use efficiency; File S4: Ammonium concentrations in surface water and predicted ammonia volatilization; File S5: Optimal Application of Biogas Slurry in Paddy Fields under the Dual Constraints of Agronomy and Environment in the Yangtze River Delta Region.

Author Contributions

L.S. contributed to the design, implementation of the research, the analysis of the results, and the writing of the manuscript; R.L. contributed to the design, the implementation of the research, the analysis of the results, and reviewed and edited the manuscript; H.J. and T.L. contributed to the collection and determination of samples; C.L. and H.W. conceived the original idea and supervised the project; Y.S. and L.D. analyzed the raw data and helped to plot the tables and graphs. All authors have read and agreed to the published version of the manuscript.

Funding

The study was supported by Jiangsu Province Agricultural Science and Technology Independent Innovation Fund Project (CX(22)3005); the Carbon Peak and Carbon Neutralization Key Science and technology Program of Suzhou (ST202228); Suzhou science and technology support project (SNG2021015).

Data Availability Statement

The data are available in Supplementary Materials.

Conflicts of Interest

The authors declare no conflicts of interest.

References

  1. Mottet, A.; de Haan, C.; Falcucci, A.; Tempio, G.; Opio, C.; Gerber, P. Livestock: On Our Plates or Eating at Our Table? A New Analysis of the Feed/Food Debate. Glob. Food Secur. 2017, 14, 1–8. [Google Scholar] [CrossRef]
  2. Food and Agriculture Organization of the United Nations (FAO). FAO Statistical Yearbook 2021-World Food and Agriculture; FAO: Rome, Italy, 2021. [Google Scholar]
  3. Hagos, K.; Zong, J.; Li, D.; Liu, C.; Lu, X. Anaerobic Co-Digestion Process for Biogas Production: Progress, Challenges and Perspectives. Renew. Sustain. Energy Rev. 2017, 76, 1485–1496. [Google Scholar] [CrossRef]
  4. Chen, G.; Zhao, G.; Zhang, H.; Shen, Y.; Fei, H.; Cheng, W. Biogas Slurry Use as N Fertilizer for Two-Season Zizania Aquatica Turcz. in China. Nutr. Cycl. Agroecosystems 2017, 107, 303–320. [Google Scholar] [CrossRef]
  5. Food and Agriculture Organization of the United Nations (FAO). The Global Status of Biogas Production; FAO: Rome, Italy, 2019. [Google Scholar]
  6. International Energy Agency (IEA). Outlook for Biogas and Biomethane: Prospects for Organic Growth; OECD Publishing: Paris, France, 2020. [Google Scholar]
  7. Paolini, V.; Petracchini, F.; Segreto, M.; Tomassetti, L.; Naja, N.; Cecinato, A. Environmental Impact of Biogas: A Short Review of Current Knowledge. J. Environ. Sci. Health Part A 2018, 53, 899–906. [Google Scholar] [CrossRef] [PubMed]
  8. Nie, L.; Peng, S. Rice Production in China. In Rice Production Worldwide; Chauhan, B.S., Jabran, K., Mahajan, G., Eds.; Springer International Publishing: Cham, Switzerland, 2017; pp. 33–52. ISBN 978-3-319-47516-5. [Google Scholar]
  9. National Bureau of Statistics of China (NBS). China Statistical Yearbook; National Bureau of Statistics of China (NBS): Beijing, China, 2023.
  10. Naher, U.A.; Ahmed, M.N.; Sarkar, M.I.U.; Biswas, J.C.; Panhwar, Q.A. Chapter 8-Fertilizer Management Strategies for Sustainable Rice Production. In Organic Farming; Chandran, S., Unni, M.R., Thomas, S., Eds.; Woodhead Publishing Series in Food Science, Technology and Nutrition; Woodhead Publishing: Cambridge, UK, 2019; pp. 251–267. ISBN 978-0-12-813272-2. [Google Scholar]
  11. Ding, W.; Xu, X.; He, P.; Ullah, S.; Zhang, J.; Cui, Z.; Zhou, W. Improving Yield and Nitrogen Use Efficiency through Alternative Fertilization Options for Rice in China: A Meta-Analysis. Field Crop. Res. 2018, 227, 11–18. [Google Scholar] [CrossRef]
  12. Wang, Q.; Chen, Z.; Zhao, J.; Ma, J.; Yu, Q.; Zou, P.; Lin, H.; Ma, J. Fate of Heavy Metals and Bacterial Community Composition Following Biogas Slurry Application in a Single Rice Cropping System. J. Soils Sediments 2022, 22, 968–981. [Google Scholar] [CrossRef]
  13. Lu, Y.; Xiao, Q.; Wu, S.; Yuan, H.; Gao, T.; Cai, T.; Wu, X.; Ma, Y.; Liao, X. Partial Substitution of Nitrogen Fertilizer with Biogas Slurry Increases Rice Yield and Fertilizer Utilization Efficiency, Enhancing Soil Fertility in the Chaohu Lake Basin. Plants 2024, 13, 2024. [Google Scholar] [CrossRef]
  14. Xu, M.; Xian, Y.; Wu, J.; Gu, Y.; Yang, G.; Zhang, X.; Peng, H.; Yu, X.; Xiao, Y.; Li, L. Effect of Biogas Slurry Addition on Soil Properties, Yields, and Bacterial Composition in the Rice-Rape Rotation Ecosystem over 3 Years. J. Soils Sediments 2019, 19, 2534–2542. [Google Scholar] [CrossRef]
  15. Chen, Y.; Wang, M.; Ouwerkerk, P.B.F. Molecular and environmental factors determining grain quality in rice. Food Energy Secur. 2012, 1, 111–132. [Google Scholar] [CrossRef]
  16. Butardo, V.M.; Sreenivasulu, N.; Juliano, B.O. Improving Rice Grain Quality: State-of-the-Art and Future Prospects. In Rice Grain Quality: Methods and Protocols; Sreenivasulu, N., Ed.; Springer: New York, NY, USA, 2019; pp. 19–55. ISBN 978-1-4939-8914-0. [Google Scholar]
  17. Yu, L.; Turner, M.S.; Fitzgerald, M.; Stokes, J.R.; Witt, T. Review of the Effects of Different Processing Technologies on Cooked and Convenience Rice Quality. Trends Food Sci. Technol. 2017, 59, 124–138. [Google Scholar] [CrossRef]
  18. Xu, Y.; Ying, Y.; Ouyang, S.; Duan, X.; Sun, H.; Jiang, S.; Sun, S.; Bao, J. Factors Affecting Sensory Quality of Cooked Japonica Rice. Rice Sci. 2018, 25, 330–339. [Google Scholar] [CrossRef]
  19. Balindong, J.L.; Ward, R.M.; Liu, L.; Rose, T.J.; Pallas, L.A.; Ovenden, B.W.; Snell, P.J.; Waters, D.L.E. Rice Grain Protein Composition Influences Instrumental Measures of Rice Cooking and Eating Quality. J. Cereal Sci. 2018, 79, 35–42. [Google Scholar] [CrossRef]
  20. Wang, G.; Kou, X.; Zhang, J.; Wang, S.; Xu, R.; Han, G.; Tang, H.; Zhu, L.; Bi, J.; Wu, L. Effect of chemical fertilzer nitrogen substitution by biogas slurry on the growth and quality of rice. Chin. J. Ecol. 2018, 37, 2672–2679. [Google Scholar] [CrossRef]
  21. Wang, Q.; Huang, Q.; Wang, J.; Li, H.; Qin, J.; Li, X.; Gouda, S.G.; Liu, Y.; Liu, Q.; Guo, G.; et al. Ecological Circular Agriculture: A Case Study Evaluating Biogas Slurry Applied to Rice in Two Soils. Chemosphere 2022, 301, 134628. [Google Scholar] [CrossRef] [PubMed]
  22. Hou, F.; Yang, Z.; Chen, Y.; Jin, C.; Shi, K.; Chen, C.; Feng, G. Effects of biogas slurry produced from swine manure substituing for urea applied on growth traits, yield and forage quality of indica rice. J. South. Agric. 2019, 50, 1197–1203. (In Chinese) [Google Scholar]
  23. Mao, X.; Wu, J.; Meng, X.; Wei, K.; Zhang, Z.; Tian, D.; Xian, Y. Effects of three-year continuous application of digested biogas slurry on yield and quality of rice. ACTA Agric. Boreali-Sin. 2016, 31, 218–224. [Google Scholar]
  24. Hou, F.; Chen, Y.; Yang, Z.; Jin, C.; Shi, K.; Chen, C.; Feng, G.; Li, H. Effects of digested pig slurry application on agronomic trait, yield and forage quality of indica rice. J. Zhejiang Univ. Agric. Life Sci. 2019, 45, 325–331. (In Chinese) [Google Scholar]
  25. Li, J.; Xu, Y.; Wang, L.; Li, F. Heavy Metal Occurrence and Risk Assessment in Dairy Feeds and Manures from the Typical Intensive Dairy Farms in China. Environ. Sci. Pollut. Res. 2019, 26, 6348–6358. [Google Scholar] [CrossRef]
  26. Win, A.T.; Toyota, K.; Ito, D.; Chikamatsu, S.; Motobayashi, T.; Takahashi, N.; Ookawa, T.; Hirasawa, T. Effect of Two Whole-Crop Rice (Oryza sativa L.) Cultivars on Methane Emission and Cu and Zn Uptake in a Paddy Field Fertilized with Biogas Slurry. Soil Sci. Plant Nutr. 2016, 62, 99–105. [Google Scholar] [CrossRef]
  27. Win, A.T.; Toyota, K.; Win, K.T.; Motobayashi, T.; Ookawa, T.; Hirasawa, T.; Chen, D.; Lu, J. Effect of Biogas Slurry Application on CH4 and N2O Emissions, Cu and Zn Uptakes by Whole Crop Rice in a Paddy Field in Japan. Soil Sci. Plant Nutr. 2014, 60, 411–422. [Google Scholar] [CrossRef]
  28. Huijsmans, J.F.M.; Hol, J.M.G.; Hendriks, M.M.W.B. Effect of Application Technique, Manure Characteristics, Weather and Field Conditions on Ammonia Volatilization from Manure Applied to Grassland. NJAS Wagening. J. Life Sci. 2001, 49, 323–342. [Google Scholar] [CrossRef]
  29. Kang, Q.; Zhang, Z. Overview of Main Nutrient and Heavy Metal Concentrations in Current Large-Scale Pig Farm Biogas Slurry. Int. J. Ecol. 2019, 08, 310–316. [Google Scholar] [CrossRef]
  30. Shaheb, M.R.; Nazrul, M.I.; Khan, A.M. Agro Economic Performance of Bio-Slurry on Boro Rice Cultivation in Some Sites of Moulvibazar District. Bangladesh J. Agric. Res. 2017, 42, 363–371. [Google Scholar] [CrossRef]
  31. Insam, H.; Gómez-Brandón, M.; Ascher, J. Manure-Based Biogas Fermentation Residues–Friend or Foe of Soil Fertility? Soil Biol. Biochem. 2015, 84, 1–14. [Google Scholar] [CrossRef]
  32. Möller, K. Effects of Anaerobic Digestion on Soil Carbon and Nitrogen Turnover, N Emissions, and Soil Biological Activity. A Review. Agron. Sustain. Dev. 2015, 35, 1021–1041. [Google Scholar] [CrossRef]
  33. Zhou, S.; Nishiyama, K.; Watanabe, Y.; Hosomi, M. Nitrogen Budget and Ammonia Volatilization in Paddy Fields Fertilized with Liquid Cattle Waste. Water. Air. Soil Pollut. 2009, 201, 135–147. [Google Scholar] [CrossRef]
  34. Chen, D.; Jiang, L.; Huang, H.; Toyota, K.; Dahlgren, R.A.; Lu, J. Nitrogen Dynamics of Anaerobically Digested Slurry Used to Fertilize Paddy Fields. Biol. Fertil. Soils 2013, 49, 647–659. [Google Scholar] [CrossRef]
  35. Cruz, L.P.S.; Alves, R.S.; da Rocha, F.O.C.; Moreira, M.S.; dos Santos Júnior, A. Atmospheric Levels, Multivariate Statistical Study, and Health Risk Assessment of Odorous Compounds (H2S and NH3) in Areas near Polluted Urban Rivers in the City of Salvador, in Northeastern Brazil. Air Qual. Atmos. Health 2022, 15, 159–176. [Google Scholar] [CrossRef]
  36. IUSS Working Group WRB World Reference Base for Soil Resources. International Soil Classification System for Naming Soils and Creating Legends for Soil Maps, 4th ed.; International Union of Soil Sciences (IUSS): Vienna, Austria, 2022. [Google Scholar]
  37. Boo, H.-K.; Ma, T.S. A Simple Method for Determining Ammonia in Water at the Ppm Level. Microchim. Acta 1976, 66, 515–523. [Google Scholar] [CrossRef]
  38. ISO 6647-2; Rice—Determination of Amylose Content—Part 2: Spectrophotometric Routine Method without Defatting Procedure and with Calibration from Rice Standards. ISO: Vernier, Geneva, 2020.
  39. GB/T 17891—2017; High Quality Paddy. Standards Press of China: Beijing, China, 2018.
  40. Shi, L.; Shen, M.; Wu, H.; Lu, C.; Mei, L.; Zhu, X.L.; Wang, H.; Song, Y.-S. Using Sowing Date Management to Promote Micronutrient Quality and Alleviate Cadmium Accumulation in Rice Grains. Cereal Res. Commun. 2020, 48, 575–583. [Google Scholar] [CrossRef]
  41. Roelle, P.A.; Aneja, V.P. Modeling of Ammonia Emissions from Soils. Environ. Eng. Sci. 2005, 22, 58–72. [Google Scholar] [CrossRef]
  42. NY 861—2004; Limits of Eight Elements in Cereals, Legume, Tubes and Its Products. Standards Press of China: Beijing, China, 2005.
  43. Jiang, L.; Wang, Q.; Chen, D.; Li, A.; Qian, S.; Fu, J.; Wang, S. The ecological effects of fallow paddy field disposal biogas slurry and tis impact on the following rice safety production. J. Agro-Environ. Sci. 2011, 30, 1328–1336. (In Chinese) [Google Scholar]
  44. Wang, Y.; Ren, T.; Lu, J.; Ming, R.; Li, P.; Hussain, S.; Cong, R.; Li, X. Heterogeneity in Rice Tillers Yield Associated with Tillers Formation and Nitrogen Fertilizer. Agron. J. 2016, 108, 1717–1725. [Google Scholar] [CrossRef]
  45. Zhu, D.; Zhang, H.; Guo, B.; Xu, K.; Dai, Q.; Wei, H.; Gao, H.; Hu, Y.; Cui, P.; Huo, Z. Effects of Nitrogen Level on Yield and Quality of Japonica Soft Super Rice. J. Integr. Agric. 2017, 16, 1018–1027. [Google Scholar] [CrossRef]
  46. Ye, T.; Li, Y.; Zhang, J.; Hou, W.; Zhou, W.; Lu, J.; Xing, Y.; Li, X. Nitrogen, Phosphorus, and Potassium Fertilization Affects the Flowering Time of Rice (Oryza sativa L.). Glob. Ecol. Conserv. 2019, 20, e00753. [Google Scholar] [CrossRef]
  47. Li, X.; Wu, L.; Geng, X.; Xia, X.; Wang, X.; Xu, Z.; Xu, Q. Deciphering the Environmental Impacts on Rice Quality for Different Rice Cultivated Areas. Rice 2018, 11, 7. [Google Scholar] [CrossRef]
  48. Zhou, C.; Huang, Y.; Jia, B.; Wang, Y.; Wang, Y.; Xu, Q.; Li, R.; Wang, S.; Dou, F. Effects of Cultivar, Nitrogen Rate, and Planting Density on Rice-Grain Quality. Agronomy 2018, 8, 246. [Google Scholar] [CrossRef]
  49. Fan, Y.; Zhang, Y.; Wang, Y.; Li, J.; Du, Y.; Sun, H.; Ting, P.; Zhao, Z.; Zhang, J. Effects of temperature and light conditions on yield and quality of Indica rice under different sowing dates. J. Henan Agric. Sci. 2024, 53, 17–27. (In Chinese) [Google Scholar] [CrossRef]
  50. Ata-Ul-Karim, S.T.; Zhu, Y.; Cao, Q.; Rehmani, M.I.A.; Cao, W.; Tang, L. In-Season Assessment of Grain Protein and Amylose Content in Rice Using Critical Nitrogen Dilution Curve. Eur. J. Agron. 2017, 90, 139–151. [Google Scholar] [CrossRef]
  51. Kaur, A.; Ghumman, A.; Singh, N.; Kaur, S.; Virdi, A.S.; Riar, G.S.; Mahajan, G. Effect of Different Doses of Nitrogen on Protein Profiling, Pasting and Quality Attributes of Rice from Different Cultivars. J. Food Sci. Technol. 2016, 53, 2452–2462. [Google Scholar] [CrossRef]
  52. Atapattu, A.J.; Prasantha, B.D.R.; Amaratunga, K.S.P.; Marambe, B. Increased Rate of Potassium Fertilizer at the Time of Heading Enhances the Quality of Direct Seeded Rice. Chem. Biol. Technol. Agric. 2018, 5, 22. [Google Scholar] [CrossRef]
  53. Zhou, T.-Y.; Li, Z.-K.; Li, E.-P.; Wang, W.-L.; Yuan, L.-M.; Zhang, H.; Liu, L.-J.; Wang, Z.-Q.; Gu, J.-F.; Yang, J.-C. Optimization of Nitrogen Fertilization Improves Rice Quality by Affecting the Structure and Physicochemical Properties of Starch at High Yield Levels. J. Integr. Agric. 2022, 21, 1576–1592. [Google Scholar] [CrossRef]
  54. GB 2762—2012; National Food Safety Standard—Limits of Contaminants in Food. Standards Press of China: Beijing, China, 2013.
  55. Wang, H.; Dong, Y.; Yang, Y.; Toor, G.S.; Zhang, X. Changes in Heavy Metal Contents in Animal Feeds and Manures in an Intensive Animal Production Region of China. J. Environ. Sci. 2013, 25, 2435–2442. [Google Scholar] [CrossRef] [PubMed]
  56. Tang, Y.; Wang, L.; Wu, D.; Dai, C.; Han, J. Assessment of heavy metal pollution and bearing capacity estimation of continuous biogas slurry application on cropland: A case study of the coastal rice-wheat rotated farmland in Jiangsu, China. China Environ. Sci. 2019, 39, 1687–1695. (In Chinese) [Google Scholar]
  57. Linquist, B.A.; Liu, L.; van Kessel, C.; van Groenigen, K.J. Enhanced Efficiency Nitrogen Fertilizers for Rice Systems: Meta-Analysis of Yield and Nitrogen Uptake. Field Crop. Res. 2013, 154, 246–254. [Google Scholar] [CrossRef]
  58. Xia, Y. Recent Advances in Control Technologies for Non-Point Source Pollution with Nitrogen and Phosphorous from Agricultural Runoff: Current Practices and Future Prospects. Appl. Biol. Chem. 2020, 63, 8. [Google Scholar] [CrossRef]
  59. Hayashi, K.; Nishimura, S.; Yagi, K. Ammonia Volatilization from the Surface of a Japanese Paddy Field during Rice Cultivation. Soil Sci. Plant Nutr. 2006, 52, 545–555. [Google Scholar] [CrossRef]
  60. Starr, J.L.; DeRoo, H.C.; Frink, C.R.; Parlange, J.-Y. Leaching Characteristics of a Layered Field Soil. Soil Sci. Soc. Am. J. 1978, 42, 386–391. [Google Scholar] [CrossRef]
  61. Xiao, Q.; Dong, Z.; Han, Y.; Hu, L.; Hu, D.; Zhu, B. Impact of Soil Thickness on Productivity and Nitrate Leaching from Sloping Cropland in the Upper Yangtze River Basin. Agric. Ecosyst. Environ. 2021, 311, 107266. [Google Scholar] [CrossRef]
  62. GB/T 14848—2017; Standard for Groundwater Quality. Press of China: Beijing, China, 2018.
  63. Senbayram, M.; Chen, R.; Budai, A.; Bakken, L.; Dittert, K. N2O Emission and the N2O/(N2O+N2) Product Ratio of Denitrification as Controlled by Available Carbon Substrates and Nitrate Concentrations. Agric. Ecosyst. Environ. 2012, 147, 4–12. [Google Scholar] [CrossRef]
Figure 1. Rice yields under different fertilizer treatments. Different lowercase letters in the bars represent significant yield differences in the same year among the treatments (p < 0.05, n = 4), and different capital letters above bars represent significant average yield differences in three years among the treatments (p < 0.05, n = 4) using Tukey’s HSD test. The bars represent the standard deviation of the mean (n = 4).
Agronomy 14 02142 g001
Figure 2. Rice harvest index (HI) under different fertilizer treatments. Different lowercase letters above the violin and dot plots represent significant HI differences from 2021 to 2023 among the treatments using Tukey’s HSD test (p < 0.01, n = 12).
Agronomy 14 02142 g002
Figure 3. Rice quality measurements in 2023, including rice processing quality (AC), cooking and eating quality (DG), and rice safety quality (H,I). Different lowercase letters above the boxplot represent significant differences among treatments using Tukey’s HSD test (p < 0.05, n = 4).
Agronomy 14 02142 g003
Figure 4. Average total nitrogen (TN) content in straw and grain from 2021 to 2023 (A) and nitrogen-use efficiency (B). AEN and REN represent the agronomy efficiency and recovery efficiency of nitrogen in 2021–2023, respectively. Different lowercase letters above the error bars represent significant differences among the treatments using Tukey’s HSD test (p < 0.05, n = 3).
Agronomy 14 02142 g004
Figure 5. NH 4 + –N concentrations in surface water in 2023. (A) Transplanting stage, (B) tillering stage, (C) jointing stage, and (D) booting stage. The NH 4 + –N concentrations in the surface water were fitted by an exponential decay model.
Agronomy 14 02142 g005
Figure 6. Retention ratio of NH 4 + –N concentration in surface water in 2023. The solid and dashed horizontal lines represent the 50% and 25% retention ratios of the NH 4 + –N contents on the fertilization day, respectively. Different lowercase letters above the error bars represent significant differences among the treatments using Tukey’s HSD test (p < 0.05, n =24).
Agronomy 14 02142 g006
Figure 7. Predicted cumulative ammonia (NH3) volatilization using a modified mass transport model in 2023. (A) Transplanting stage, (B) tillering stage, (C) jointing stage, and (D) booting stage. The predicted cumulative NH3 volatilizations were well fitted using the exponential rise model.
Agronomy 14 02142 g007
Figure 8. Predicted cumulative NH3 volatilization 10 d after fertilization (A). Relationship between N derived from biogas slurry and predicted cumulative NH3 volatilization using a linear regression model (B). Different lowercase letters above the boxplot represent significant differences among treatments using Tukey’s HSD test (p < 0.05, n = 4).
Agronomy 14 02142 g008
Table 1. Management of nitrogen fertilizer application under different treatments in different growth stages of rice in 2021–2023.
TreatmentNitrogen SourceBasal
(kg N ha−1)
Tillering
(kg N ha−1)
Jointing
(kg N ha−1)
Booting
(kg N ha−1)
CK-----
CNUrea727296-
NBSUrea/biogas slurry36/3036/3048/30-/30
BS1Biogas slurry60606060
BS1.5Biogas slurry90909090
BS2Biogas slurry120120120120
Notes: CK—no fertilization; CN—chemical nitrogen fertilizer (240 kg N ha−1); NBS—50% nitrogen from chemical fertilizer (120 kg N ha−1) plus 50% nitrogen from biogas slurry (120 kg N ha−1); BS1—100% nitrogen from biogas slurry (240 kg N ha−1); BS1.5—150% nitrogen from biogas slurry (360 kg N ha−1); BS2—200% nitrogen from biogas slurry (480 kg N ha−1).
Table 2. Rice yield composition under different treatments across study years.
YearTreatPanicle Numbers
(106 ha−1)
Spikelet Numbers
(per Panicle)
Seed-Setting Rate
(%)
1000-Grain Weight
(g)
2021CK2.55 e110.25 d92.53 b25.23 c
CN2.84 c128.92 b92.18 c26.36 a
NBS2.70 d122.81 c94.28 a26.47 a
BS12.70 d119.59 c92.16 c25.96 b
BS1.52.95 b129.89 b90.19 d25.69 b
BS22.99 a135.06 a88.90 e25.21 c
2022CK2.58 e109.57 e90.06 d25.03 c
CN2.90 b116.09 d95.61 a26.11 ab
NBS2.78 c122.99 bc94.69 b26.52 a
BS12.74 d120.94 c92.39 c26.19 ab
BS1.52.94 a126.00 b90.10 d25.80 b
BS22.94 a129.55 a89.57 e25.24 c
2023CK2.58 f108.23 d92.53 f25.23 c
CN2.79 e115.31 bc95.33 a26.33 a
NBS2.93 c113.12 c94.21 b26.42 a
BS12.87 d116.57 b93.45 c26.15 a
BS1.52.94 b122.66 a89.16 d25.63 b
BS23.22 a122.16 a85.49 e25.09 c
Two-way ANOVA
Year******ns
Treatment********
Year × Treatment******ns
Notes: Different lowercase letters in the same column represent significant differences among treatments in each year at 0.05 levels using Tukey’s HSD test. ** and ns indicate significant difference at 0.01 levels and no significant difference, respectively.
Disclaimer/Publisher’s Note: The statements, opinions and data contained in all publications are solely those of the individual author(s) and contributor(s) and not of MDPI and/or the editor(s). MDPI and/or the editor(s) disclaim responsibility for any injury to people or property resulting from any ideas, methods, instructions or products referred to in the content.

