Article

Responses of Leaf Senescence for Stipa krylovii to Interactive Environmental Factors

by
Xingyang Song
1,2 and
Guangsheng Zhou
1,2,3,*
1
State Key Laboratory of Severe Weather, Chinese Academy of Meteorological Sciences, Beijing 100081, China
2
Hebei Gucheng Agricultural Meteorology National Observation and Research Station, Baoding 072656, China
3
Collaborative Innovation Center on Forecast and Evaluation of Meteorological Disasters (CIC-FEMD), Nanjing University of Information Science & Technology, Nanjing 210044, China
*
Author to whom correspondence should be addressed.
Agronomy 2024, 14(9), 2145; https://doi.org/10.3390/agronomy14092145
Submission received: 26 August 2024 / Revised: 16 September 2024 / Accepted: 19 September 2024 / Published: 20 September 2024
(This article belongs to the Section Agroecology Innovation: Achieving System Resilience)

Abstract

:
The effects of temperature, and photoperiod on autumn phenology are well established for many species. However, the impact of multiple environmental factors and their interactions on regulating autumn phenology remains insufficiently explored. A large-scale controlled experiment in an artificial climate chamber was conducted from April to October 2021 at the Hebei Gucheng Agricultural Meteorology National Observation and Research Station, Hebei Province. This study aimed to investigate the interactive effects of temperature [T1.5, (1.5 °C above the control), T2, (2 °C above the control)], photoperiod [LP, long photoperiod (4 h photoperiod above the control), SP, short photoperiod (4 h photoperiod below the control)], and nitrogen addition [LN, low nitrogen, (nitrogen at 5 g N·m−2·a−1), MN, medium nitrogen, (nitrogen at 10 g N·m−2·a−1), HN, high nitrogen, (nitrogen at 20 g N·m−2·a−1), control for temperature and photoperiod was the mean monthly temperature and average photoperiod (14 h) from 1989–2020 for Stipa krylovii, while the control for nitrogen treatment was without nitrogen addition] on leaf senescence in Stipa krylovii. A three-way analysis of variance (ANOVA) revealed significant effects of temperature, photoperiod, and nitrogen addition on leaf senescence (p < 0.01), with effects varying across different levels of each factor. Increased temperature notably delayed leaf senescence, with delays averaging of 4.0 and 6.3 days for T1.5 and T2, respectively. The LP treatment advanced leaf senescence by an average of 4.0 days, while the SP treatment delayed it by an average of 6.2 days; nitrogen addition advanced leaf senescence, with the effect intensifying as nitrogen levels increased, resulting in average advancements of 1.5, 1.9, and 4.3 days for LN, MN, and HN, respectively. Additionally, we observed that temperature altered the sensitivity of leaf senescence to the photoperiod, diminishing the advancement caused by LP at 2 °C and amplifying the delay caused by SP. These findings underscore the differential impacts of these three factors on the leaf senescence of Stipa krylovii and provide critical insights into plant phenology in response to varying environmental conditions.

1. Introduction

Plant phenology refers to the seasonal timing of life cycle events in plants [1], serving as a sensitive indicator of the biological impacts of climate change [2,3,4]. These shifts not only reflect the dynamic responses of terrestrial ecosystems to climate change but also alter ecosystem structure and function by influencing the development of plants’ phenophases [5,6]. Variations in plant phenology, particularly during the growing season (from leaf expansion to senescence), are closely linked to vegetation productivity and carbon capture [7]. Such changes profoundly affect the regulation of terrestrial biochemical cycles and are key parameters in both land surface process models and models predicting plant productivity. Numerous studies have shown that shifts in autumn phenology, such as leaf senescence (visually identifiable by seasonal leaf color changes), exert a more substantial influence on grassland ecosystem productivity and community structure than spring phenology [8,9]. Increasing evidence now highlights the importance of the leaf senescence date (LSD) in regulating the length of the growing period, with significant effect on the carbon cycle, hydrological process, and energy balance in terrestrial ecosystems [10,11,12,13].
Research on phenology has highlighted how major environmental cues, such as temperature and photoperiod, provide multiple routes to leaf senescence depending on the environmental conditions [14,15,16]. Temperature is considered the most critical factor influencing plant phenology [17]. Plants thrive and evolve within specific temperature ranges, requiring a certain degree of accumulated warmth to complete their life cycles [18]. For instance, a negative correlation between the LSD and temperature has been observed in the mid-latitude grasslands of the Northern Hemisphere [19]. Photoperiod, another key driver of plant phenology, plays a significant role in modulating autumnal events, particularly leaf senescence [7]. A long photoperiod can offset a low-temperature requirement during a plant’s physiological dormancy, thereby promoting spring phenology, while a short photoperiod can delay leaf unfolding to minimize frost risk [20,21]. The responses of plant phenology to temperature are widespread, generally showing strong advances on average, although there is substantial variation among species and locations [22]. Long-term observations have found that the sensitivities of the phenological response to temperature have been weakened in recent decades [23,24,25], suggesting that multiple environmental cues contribute to the reduced temperature sensitivity [26].
Nitrogen (N), a fundamental mineral element in plants, affects plant phenology by influencing their growth and development [27]. However, there is substantial uncertainty regarding nitrogen’s effects on plant phenology, with limited research on this topic. Recent studies have found that the flowering dates of two forb species were extended when exposed to N addition [28], while others, such as Petraglia et al. (2014) [29], noted no significant effect of nitrogen alone on phenology. These inconsistent findings, which vary among species and environmental conditions, further complicate our understanding of nitrogen’s impact on plant phenology. N deposition has emerged as a significant contributor to global environmental change, with a marked increase observed on a global scale since the onset of the Industrial Revolution [27,30]. Furthermore, N deposition is anticipated to escalate in the forthcoming decades, driven by the emissions of nitrogenous waste gases from industrial processes and the widespread application of nitrogenous fertilizers in agricultural practices [31]. While N deposition’s impact on plant phenology is evident, few studies have specifically examined its relationship with phenological changes.
China’s temperate grasslands, the third largest in the world, are highly sensitive to climatic change and play a crucial role in the global carbon cycle [32,33]. Stipa krylovii, one of the dominant species in the temperate grassland ecosystems of northern China, is particularly responsive to climate change. In recent years, its phenological patterns have undergone significant shifts due to environmental changes driven by global warming [34]. Understanding how Stipa krylovii’s autumn phenology responds to environmental factors is essential for predicting future dynamics in vegetation–climate systems and improving phenological modeling in grasslands [4,35]. While previous studies have proved the significant effects of temperature, photoperiod, and N deposition on plant phenology [8,28,36], the combined influence of these factors on phenological traits remains unclear. Controlled experiments provide an optimal approach to determining the relative impact of different environmental cues on plant phenology [6,35,37,38]. Therefore, this study involved an experiment in large artificial growth chambers to investigate the effects of varying temperatures, photoperiods, and N addition on leaf senescence in Stipa krylovii. The specific objective was to clarify how temperature, photoperiod, and N addition influence the leaf senescence of Stipa krylovii.

2. Materials and Methods

2.1. Study Area and Species

The study was conducted in large artificial growth chambers at the Hebei Gucheng Agricultural Meteorology National Observation and Research Station in Hebei Province, China (39°08′ N, 115°40′ E, 15.2 m a.s.l.) from April to October 2021. Stipa krylovii specimens were sourced from the Xilinhot National Climate Observatory. In this experiment, three large artificial climate chambers were used to simulate and control growth conditions (Figure 1). Each chamber could hold 48 samples and was equipped with a centralized system for precise heating or cooling, enabling continuous temperature adjustments above or below ambient air temperatures, both day and night. Each chamber was designated a specific temperature treatment and three chambers could be used to obtain three temperature treatments. The chambers were divided into six cubicles using wooden panels and opaque curtains to impose varying photoperiod treatments. Each cubicle was equipped with sodium lamps and housed eight saplings; the lamps and curtains were adjusted at specific intervals to create three unique photoperiod treatments. Two cubicles per chamber were dedicated to a specific photoperiod treatment, accommodating a total of 16 saplings, which were then sprayed with varying concentrations of water-soluble urea to implement four N addition treatments. Prior to green-up (24 April), plant samples, along with the associated soil and roots, were collected from the observatory and transferred into polyethylene pots with a diameter of 20 cm and a height of 20 cm. These pots were subsequently transported to the experimental station for background growth assessments before being placed in the large artificial growth chambers (27 April).

2.2. Experimental Design

We established three temperature treatments × three photoperiod treatments × four N addition treatments, resulting in a total of 36 treatment combinations. Each treatment was replicated four times. The temperature treatments were as follows: [controlling the mean month temperature of the original place of Stipa krylovii from 1989–2020, T, T1.5, (1.5 °C above the control), T2, (2 °C above the control)]. The photoperiod treatments were as follows: [control (14 h photoperiod, the average photoperiod of the original place of Stipa krylovii from 1989 to 2020, P), LP, long photoperiod (18 h photoperiod), SP, short photoperiod (10 h photoperiod)]. The N addition treatments were as follows: [control, without nitrogen application, N, LN, low nitrogen, (nitrogen at 5 g N·m−2·a−1), MN, medium nitrogen, (nitrogen at 10 g N·m−2·a−1), HN, high nitrogen, (nitrogen at 20 g N·m−2·a−1)] The corresponding temperature, photoperiod and relative humidity were adjusted at the beginning of each month. The CO2 concentration was maintained at atmospheric levels (400 ± 20 µmol/mol). During the experiment, irrigation was carried out every three days, with water amounts corresponding to the average rainfall in Stipa krylovii’s native habitat from 1989 to 2020 (Table 1). Nitrogen was applied at the beginning of each month, with urea dissolved in water and sprayed evenly across treatments, while the control received an equivalent amount of water.

2.3. Phenological Observation

According to the observation criteria, the leaf coloration onset stage (LCO) was defined as the date when the first leaf had an autumn color; leaf coloration in the general stage (LCG) was defined as the date when 50% of the leaves had an autumn color; the leaf fully coloring stage (LCF) was defined as the date when all leaves had an autumn color. The species-specific phenological observations were carried out every two days by professionals according to uniform observation criteria [39].

2.4. Statistical Analyses

Statistical analysis was conducted using SPSS v.21.0 software (SPSS Inc. Chicago, IL, USA). A three-way ANOVA with LSD tests was used to test the effects of temperature, photoperiod, and N addition and their interactions. The differences in the leaf senescence phase (LCO, LCG, LCF) for various treatments were compared with the control, which were determined with a Duncan’s multiple comparison test. Variation days in figures were calculated by subtracting the corresponding control values from the treatment values. Negative values indicated an advancement in the leaf senescence phase, while positive values indicated a delay.

3. Results

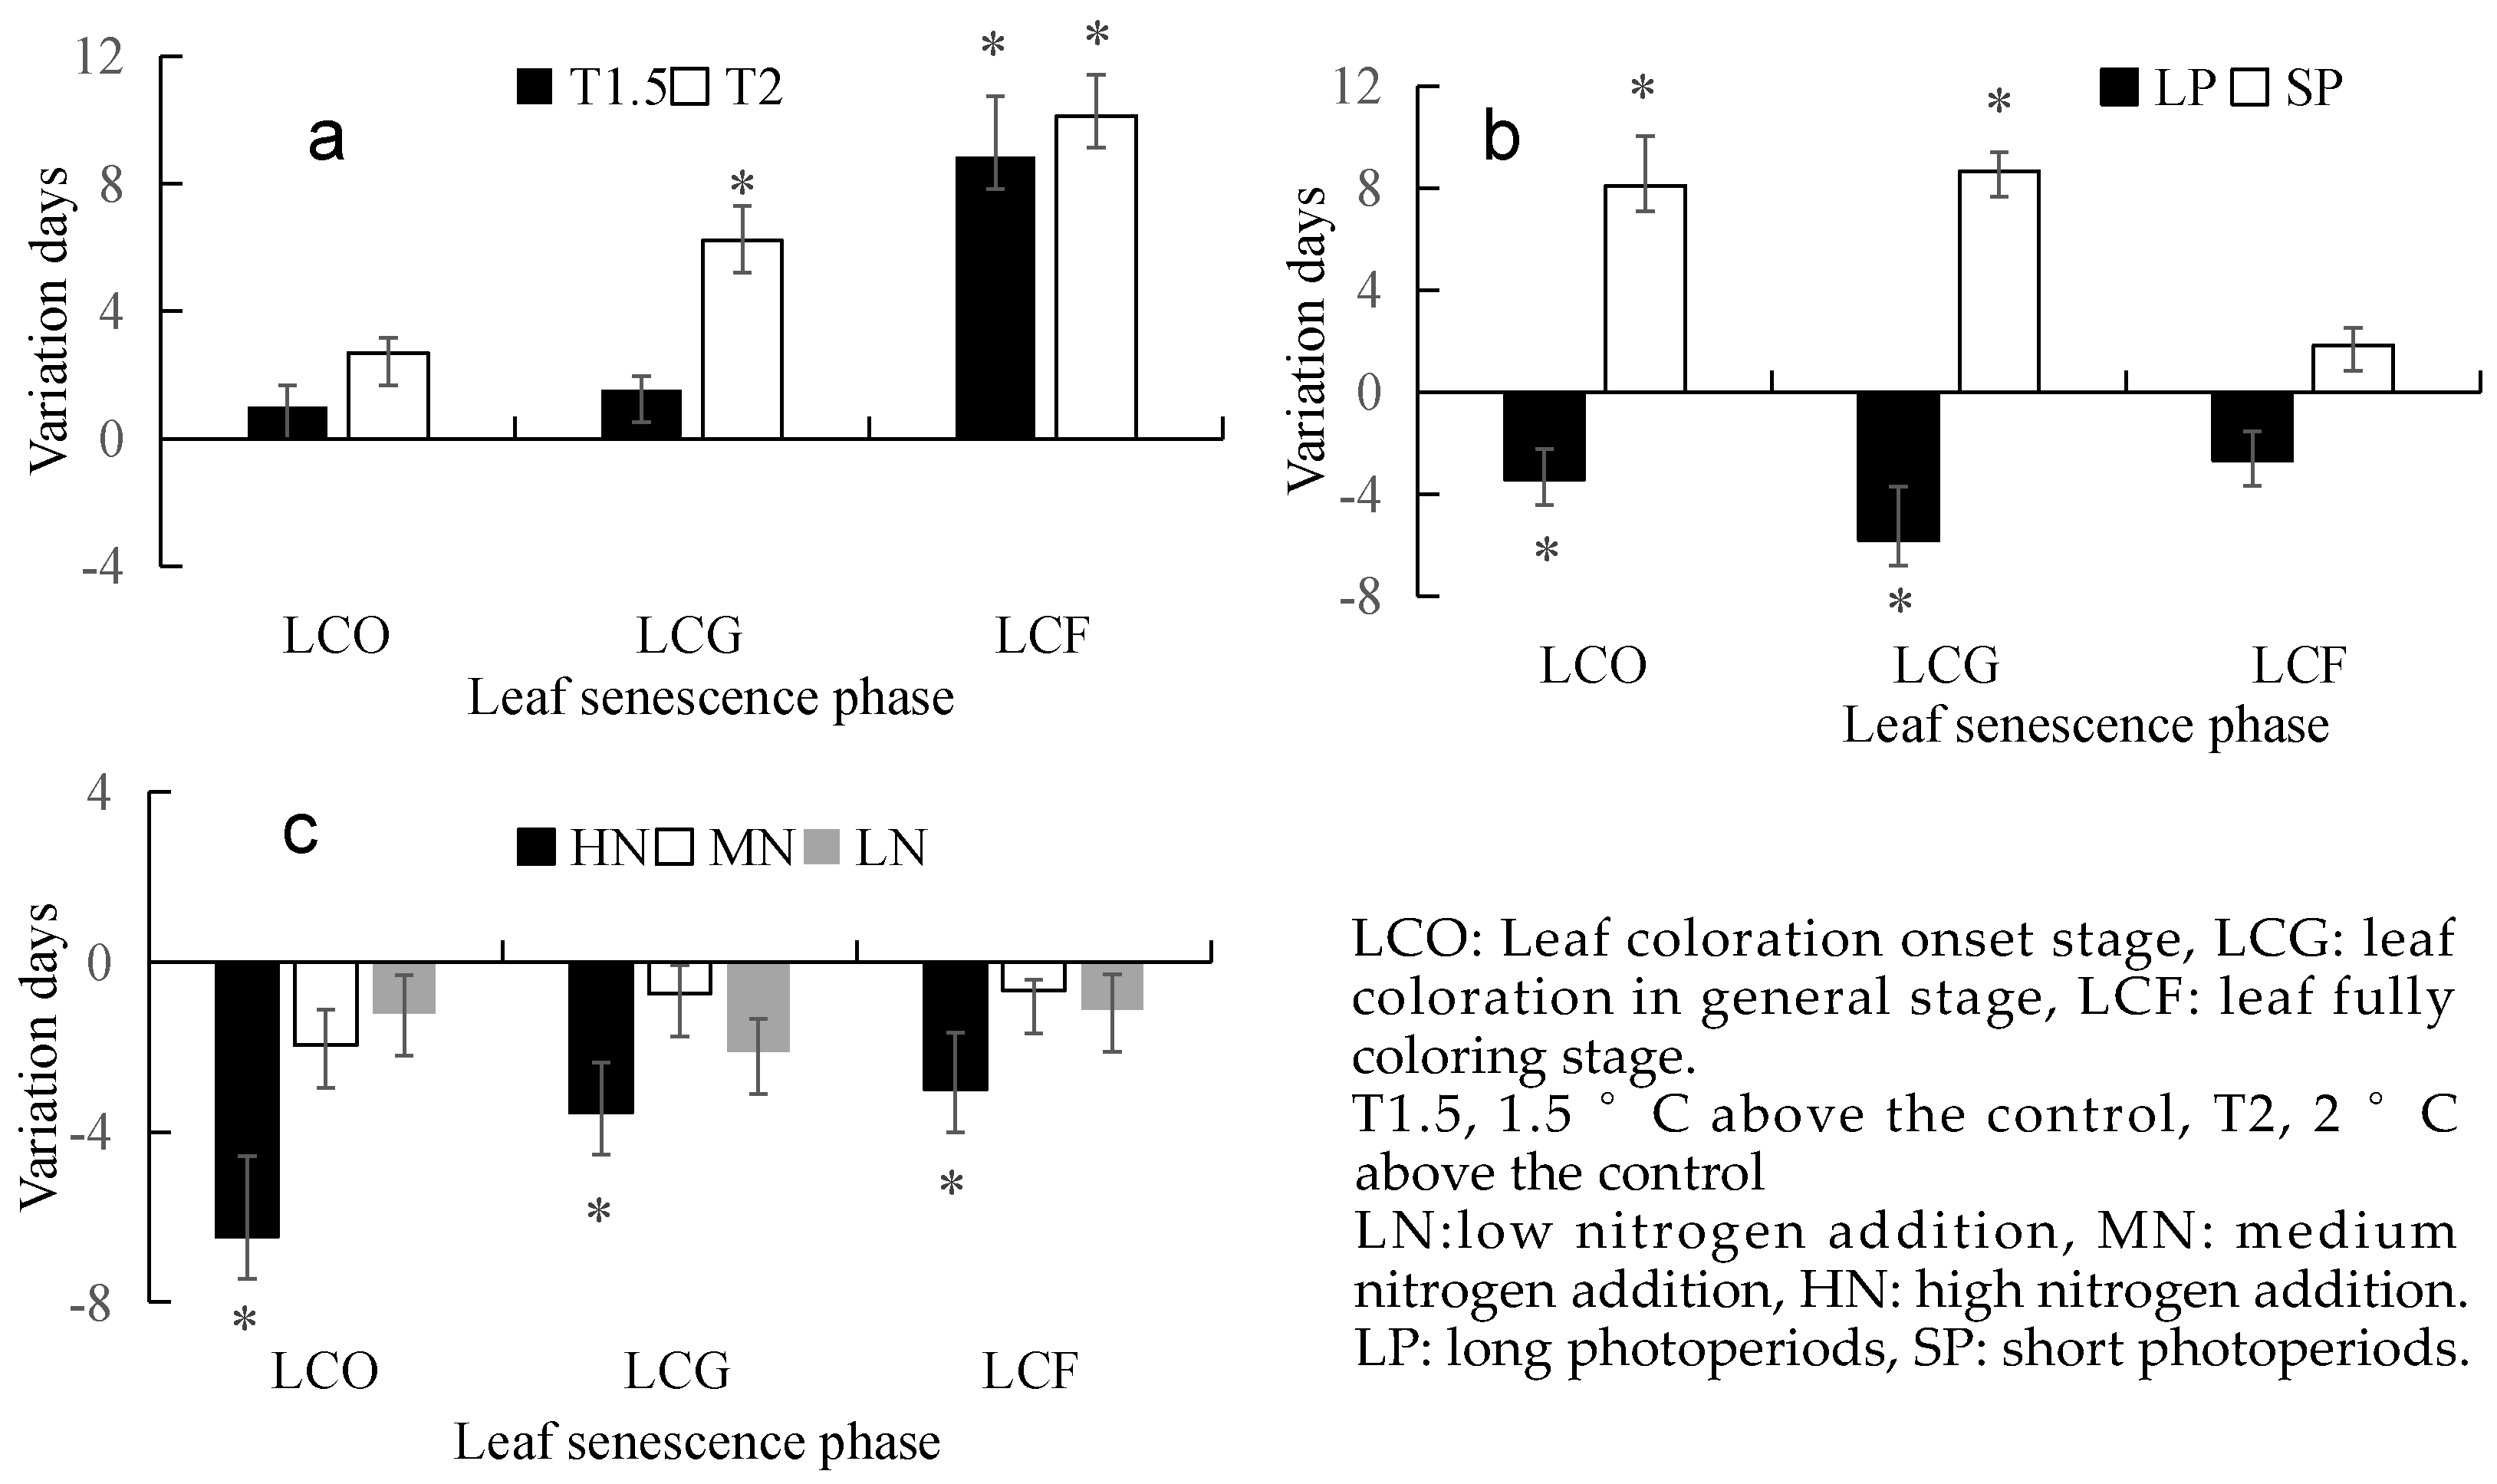
3.1. Effects of a Single Environmental Factor

The effects of temperature on leaf senescence in Stipa krylovii are illustrated in Figure 2a. Temperature significantly affected the leaf senescence phase (Table 2), showing a noticeable delay with rising temperatures, particularly for the LCG and LCF (p < 0.05). The LCO was delayed by 1.0 and 2.7 days with temperature increases of 1.5 °C and 2 °C, respectively. The LCG was delayed by 1.5 and 6.2 days, while the LCF experienced even greater delays of 8.8 and 10.1 days under the same temperature increases.
Compared to LCF, photoperiod changes exerted a more pronounced effect on the LCO and LCG (Figure 2b, p < 0.05). LP treatment accelerated the leaf senescence phase, while SP treatment delayed it. Specifically, LP treatment advanced the LCO, LCG, and LCF by 3.4, 5.8, and 2.7 days, respectively, while SP treatment delayed the LCO, LCG, and LCF by 8.1, 8.7, and 1.8 days, respectively.
N addition accelerated the leaf senescence phase, with the trend becoming more pronounced as nitrogen levels increased (Figure 2c). Only the HN had a significant effect on the leaf senescence phase (LCO, LCG LCF) of Stipa krylovii (p < 0.05). The LCO advanced by 1.2, 2.0, and 6.5 days for LN, MN and HN treatment, respectively. For the LCG, the advancements were 2.1, 0.7, and 3.5 days, respectively, while the advancements were 1.1, 0.7, and 3.0 days, respectively for the LCF.

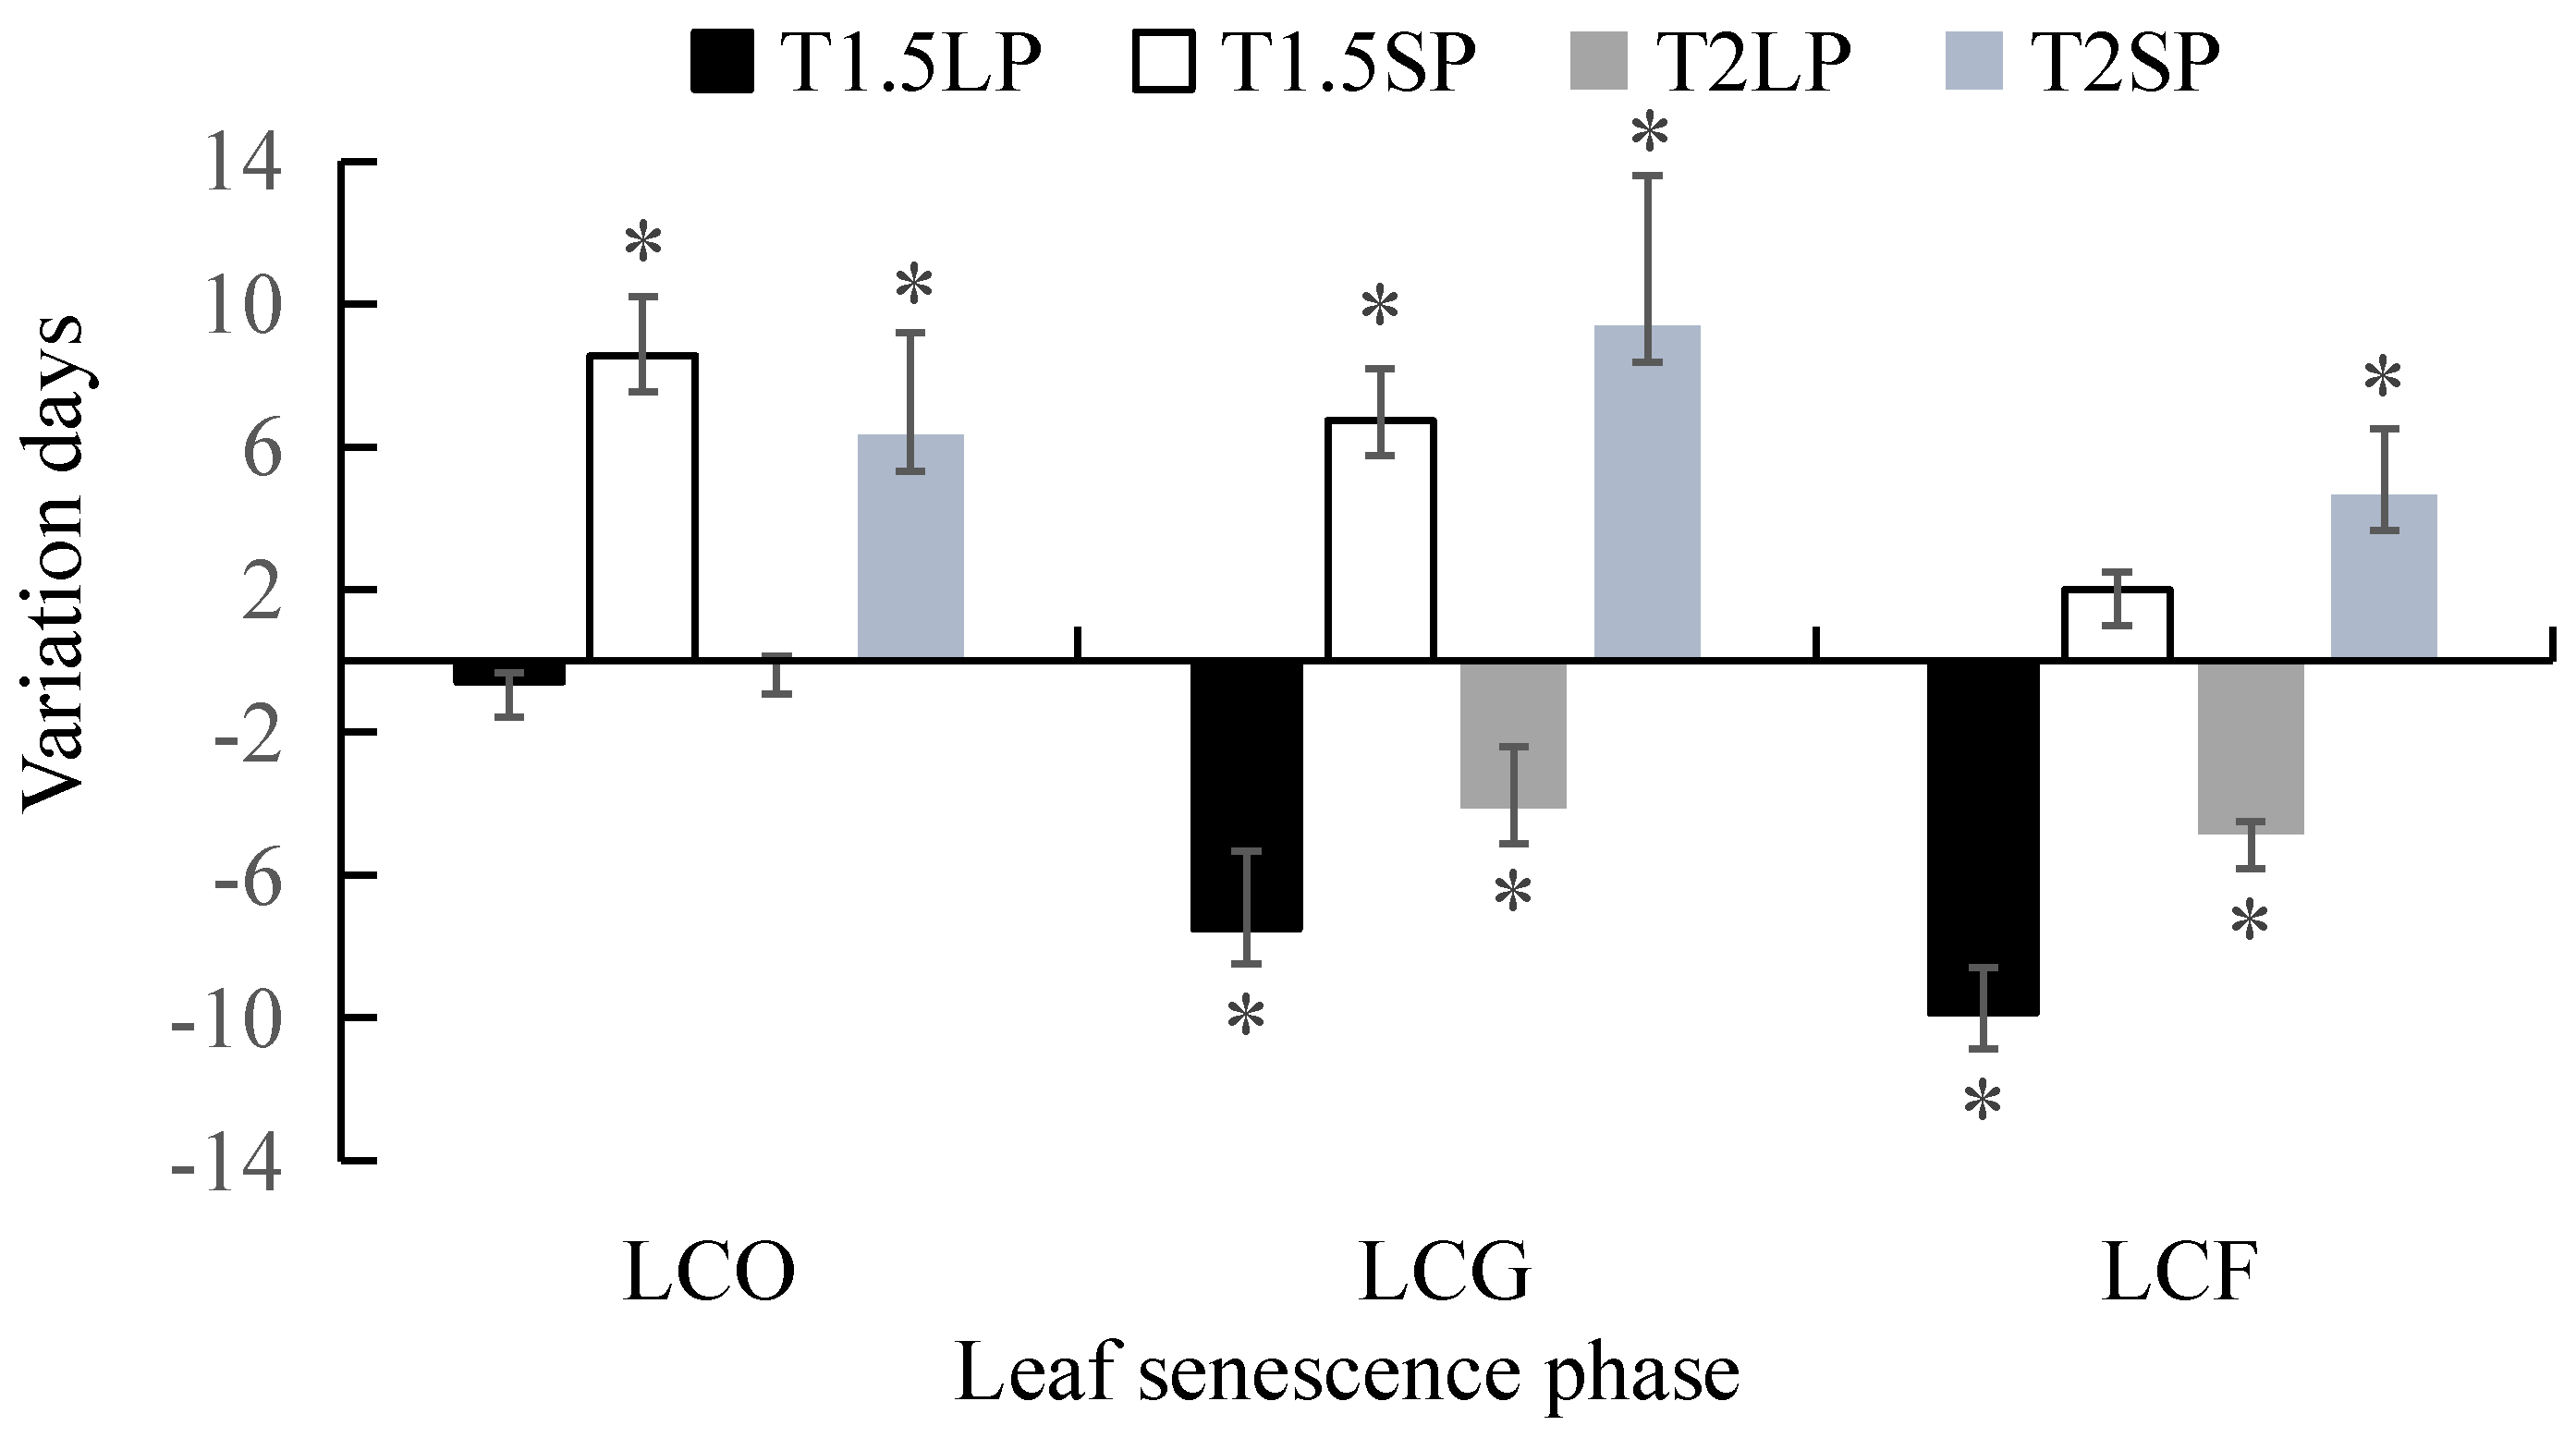
3.2. Effects of the Interaction between Temperature and Photoperiod

The synergistic effects of temperature and photoperiod on the leaf senescence phase are shown in Figure 3. The combined effect of increased temperature and LP treatment significantly accelerated the leaf senescence phase (p < 0.05), while the combination of increased temperature and SP treatment significantly delayed it (p < 0.05). When the temperature increased by 1.5 °C, LP treatment advanced the LCO, LCG, and LCF by 0.6, 7.5, and 9.9 days, respectively, whereas SP treatment delayed these stages by 8.5, 6.8, and 2.0 days, respectively. When the temperature increased by 2 °C, LP treatment advanced the LCO, LCG, and LCF by 0.1, 4.1, and 4.8 days, respectively, while SP treatment delayed these stages by 6.3, 9.4, and 4.7 days, respectively. Compared to the 1.5 °C increase, the advancement of leaf senescence under LP was reduced at 2 °C, while the delay under SP was amplified.

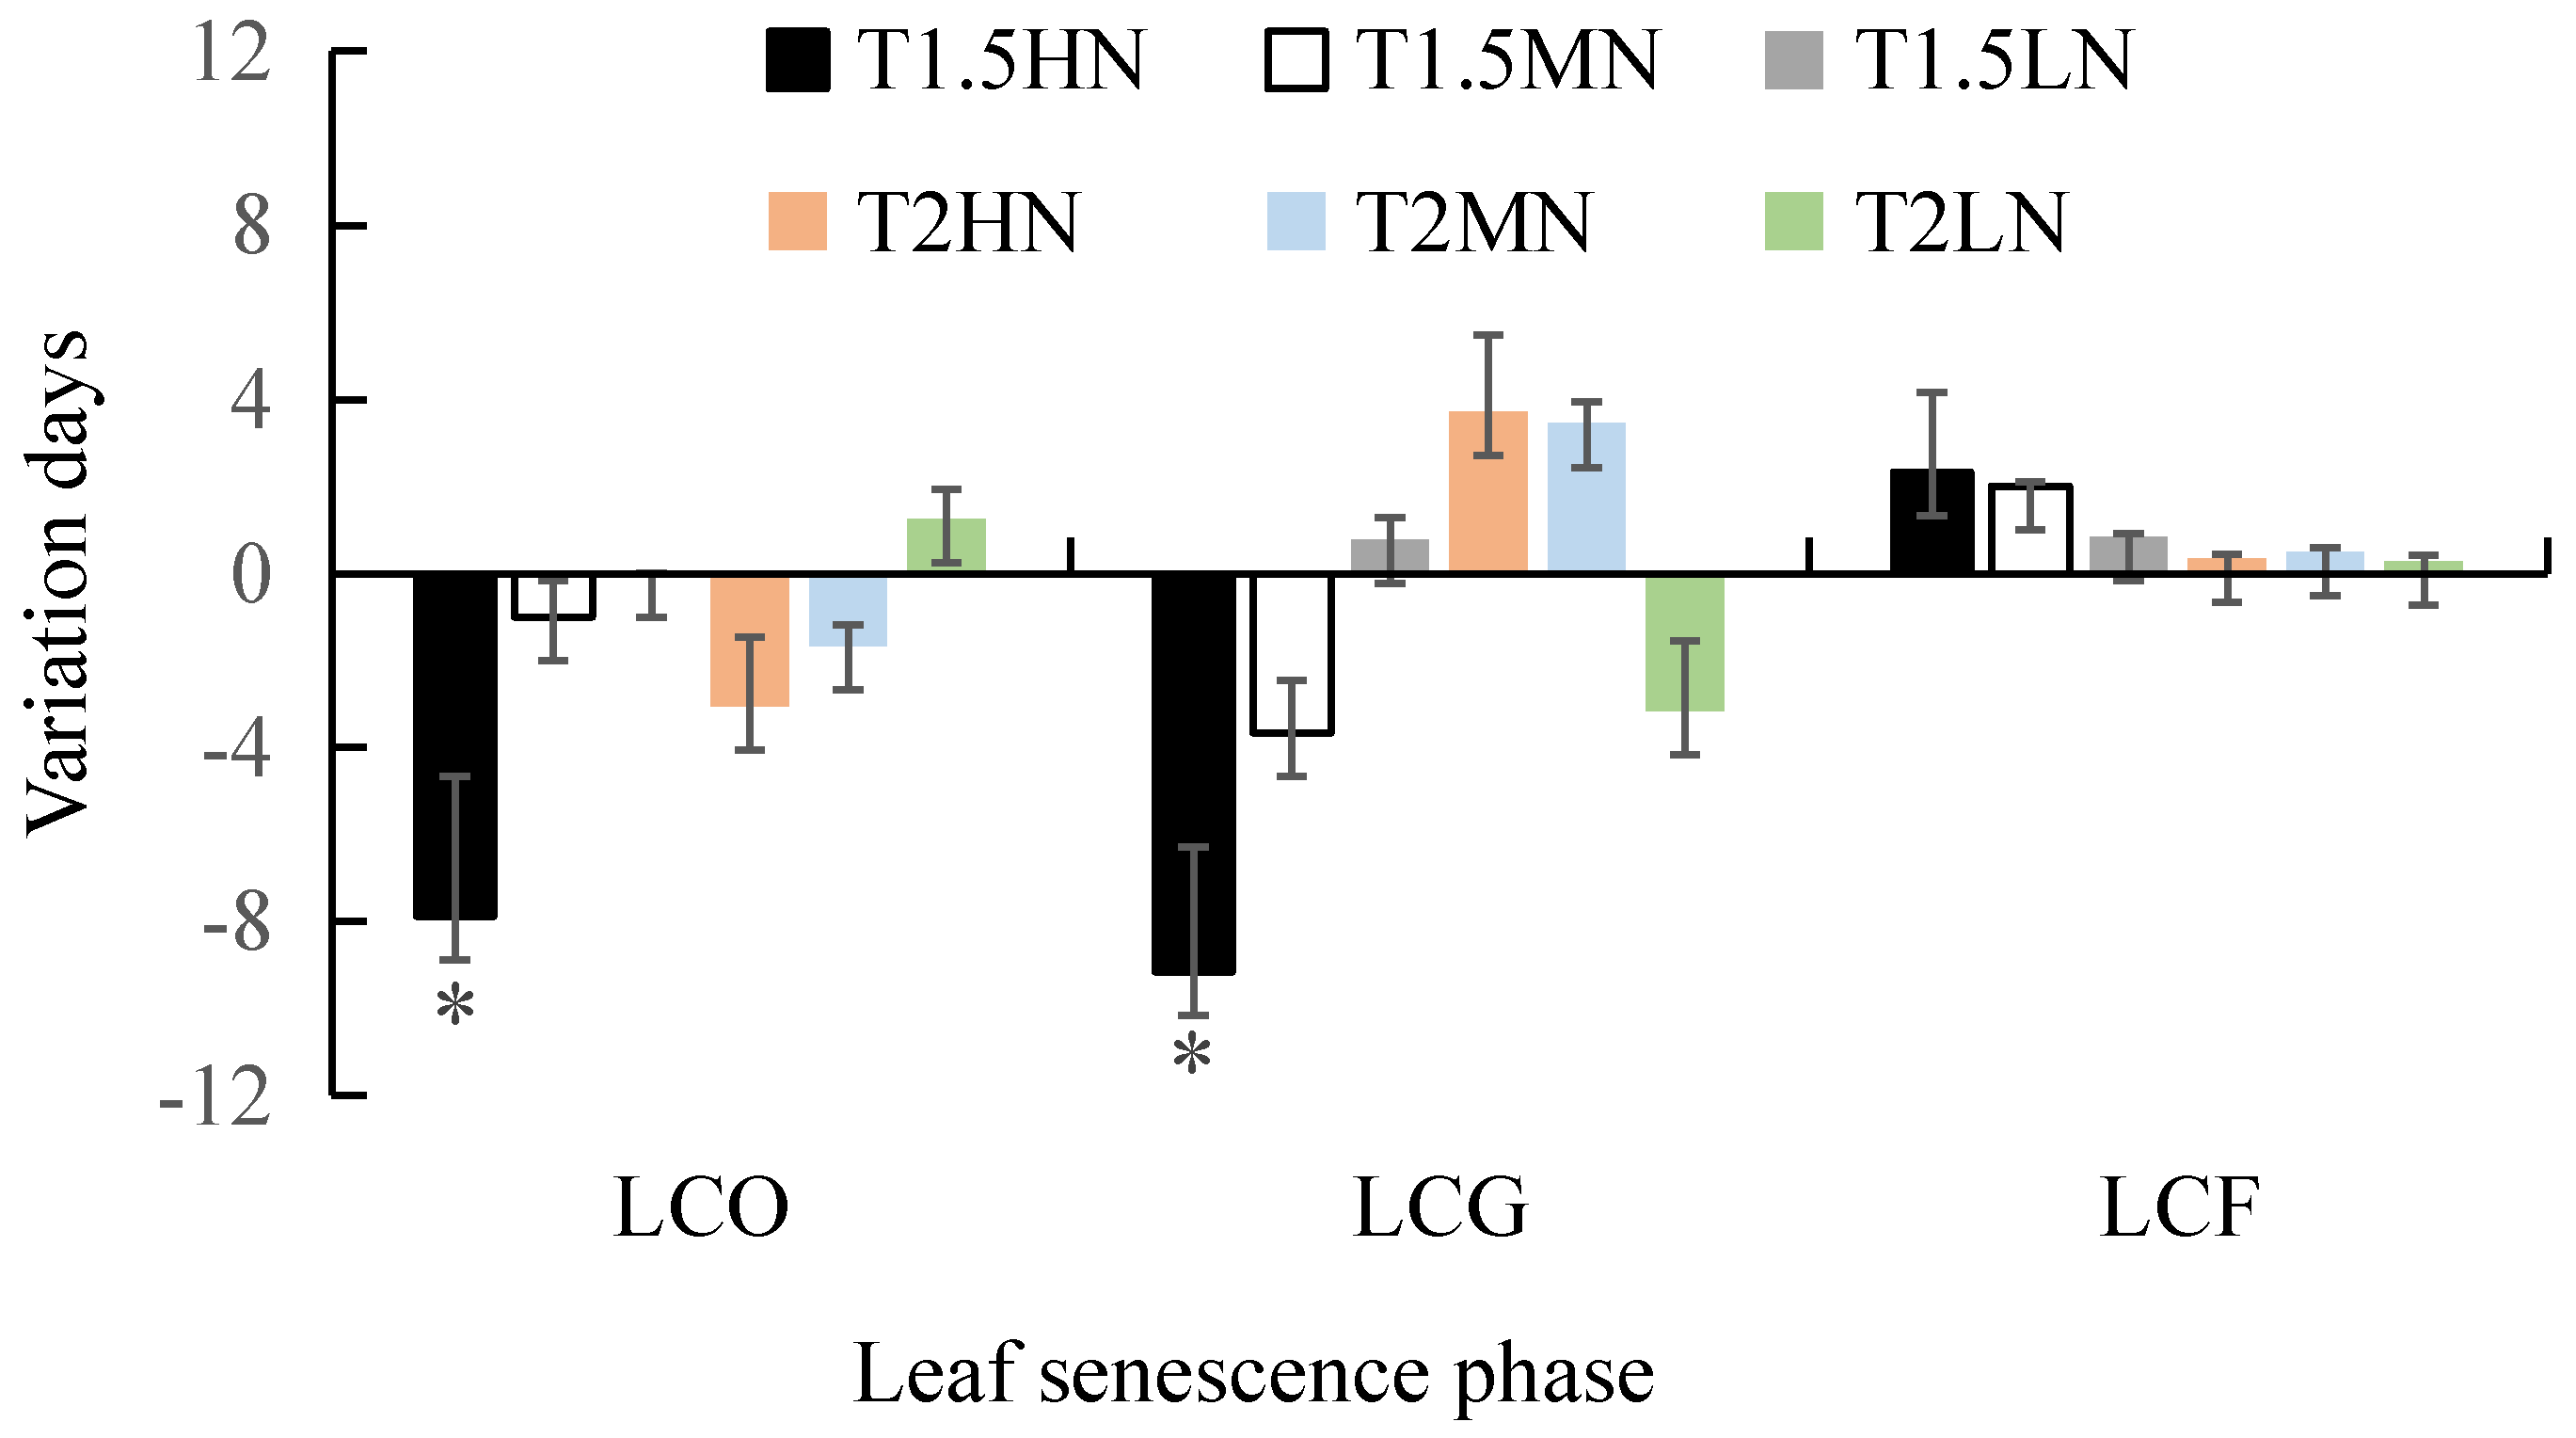
3.3. Effects of the Interaction between Temperature and Nitrogen Addition

The leaf senescence phase of Stipa krylovii under the combined effects of temperature and N addition is depicted in Figure 4. The synergistic effect of T1.5 and HN significantly impacted the LCO and LCG (p < 0.05). Different temperatures and N addition treatments produced varied impacts on the leaf senescence phase. Under MN and HN treatments, a 1.5 °C warming advanced both the LCO and LCG, while a 2 °C warming advanced the LCO but delayed the LCG. With N addition, both 1.5 °C and 2 °C warming caused an insignificant delay in the LCF.
When the temperature increased by 1.5 °C, LN treatments delayed the LCO and LCG by 0.0 and 0.8 days, respectively, while MN treatments and HN treatments advanced the LCO by 1.0 and 7.9 days, respectively, and these advancements were 3.7 and 9.2 days, respectively, for LCG. When the temperature increased by 2 °C, LN treatments delayed the LCO by 1.3 days and the LCG by 3.2 days. MN treatments and HN treatments advanced the LCO by 1.7 and 3.1 days, respectively, while delaying the LCG by 3.4 and 3.7 days, respectively. N addition did not cause a significant delay in the LCF under the warming treatment.

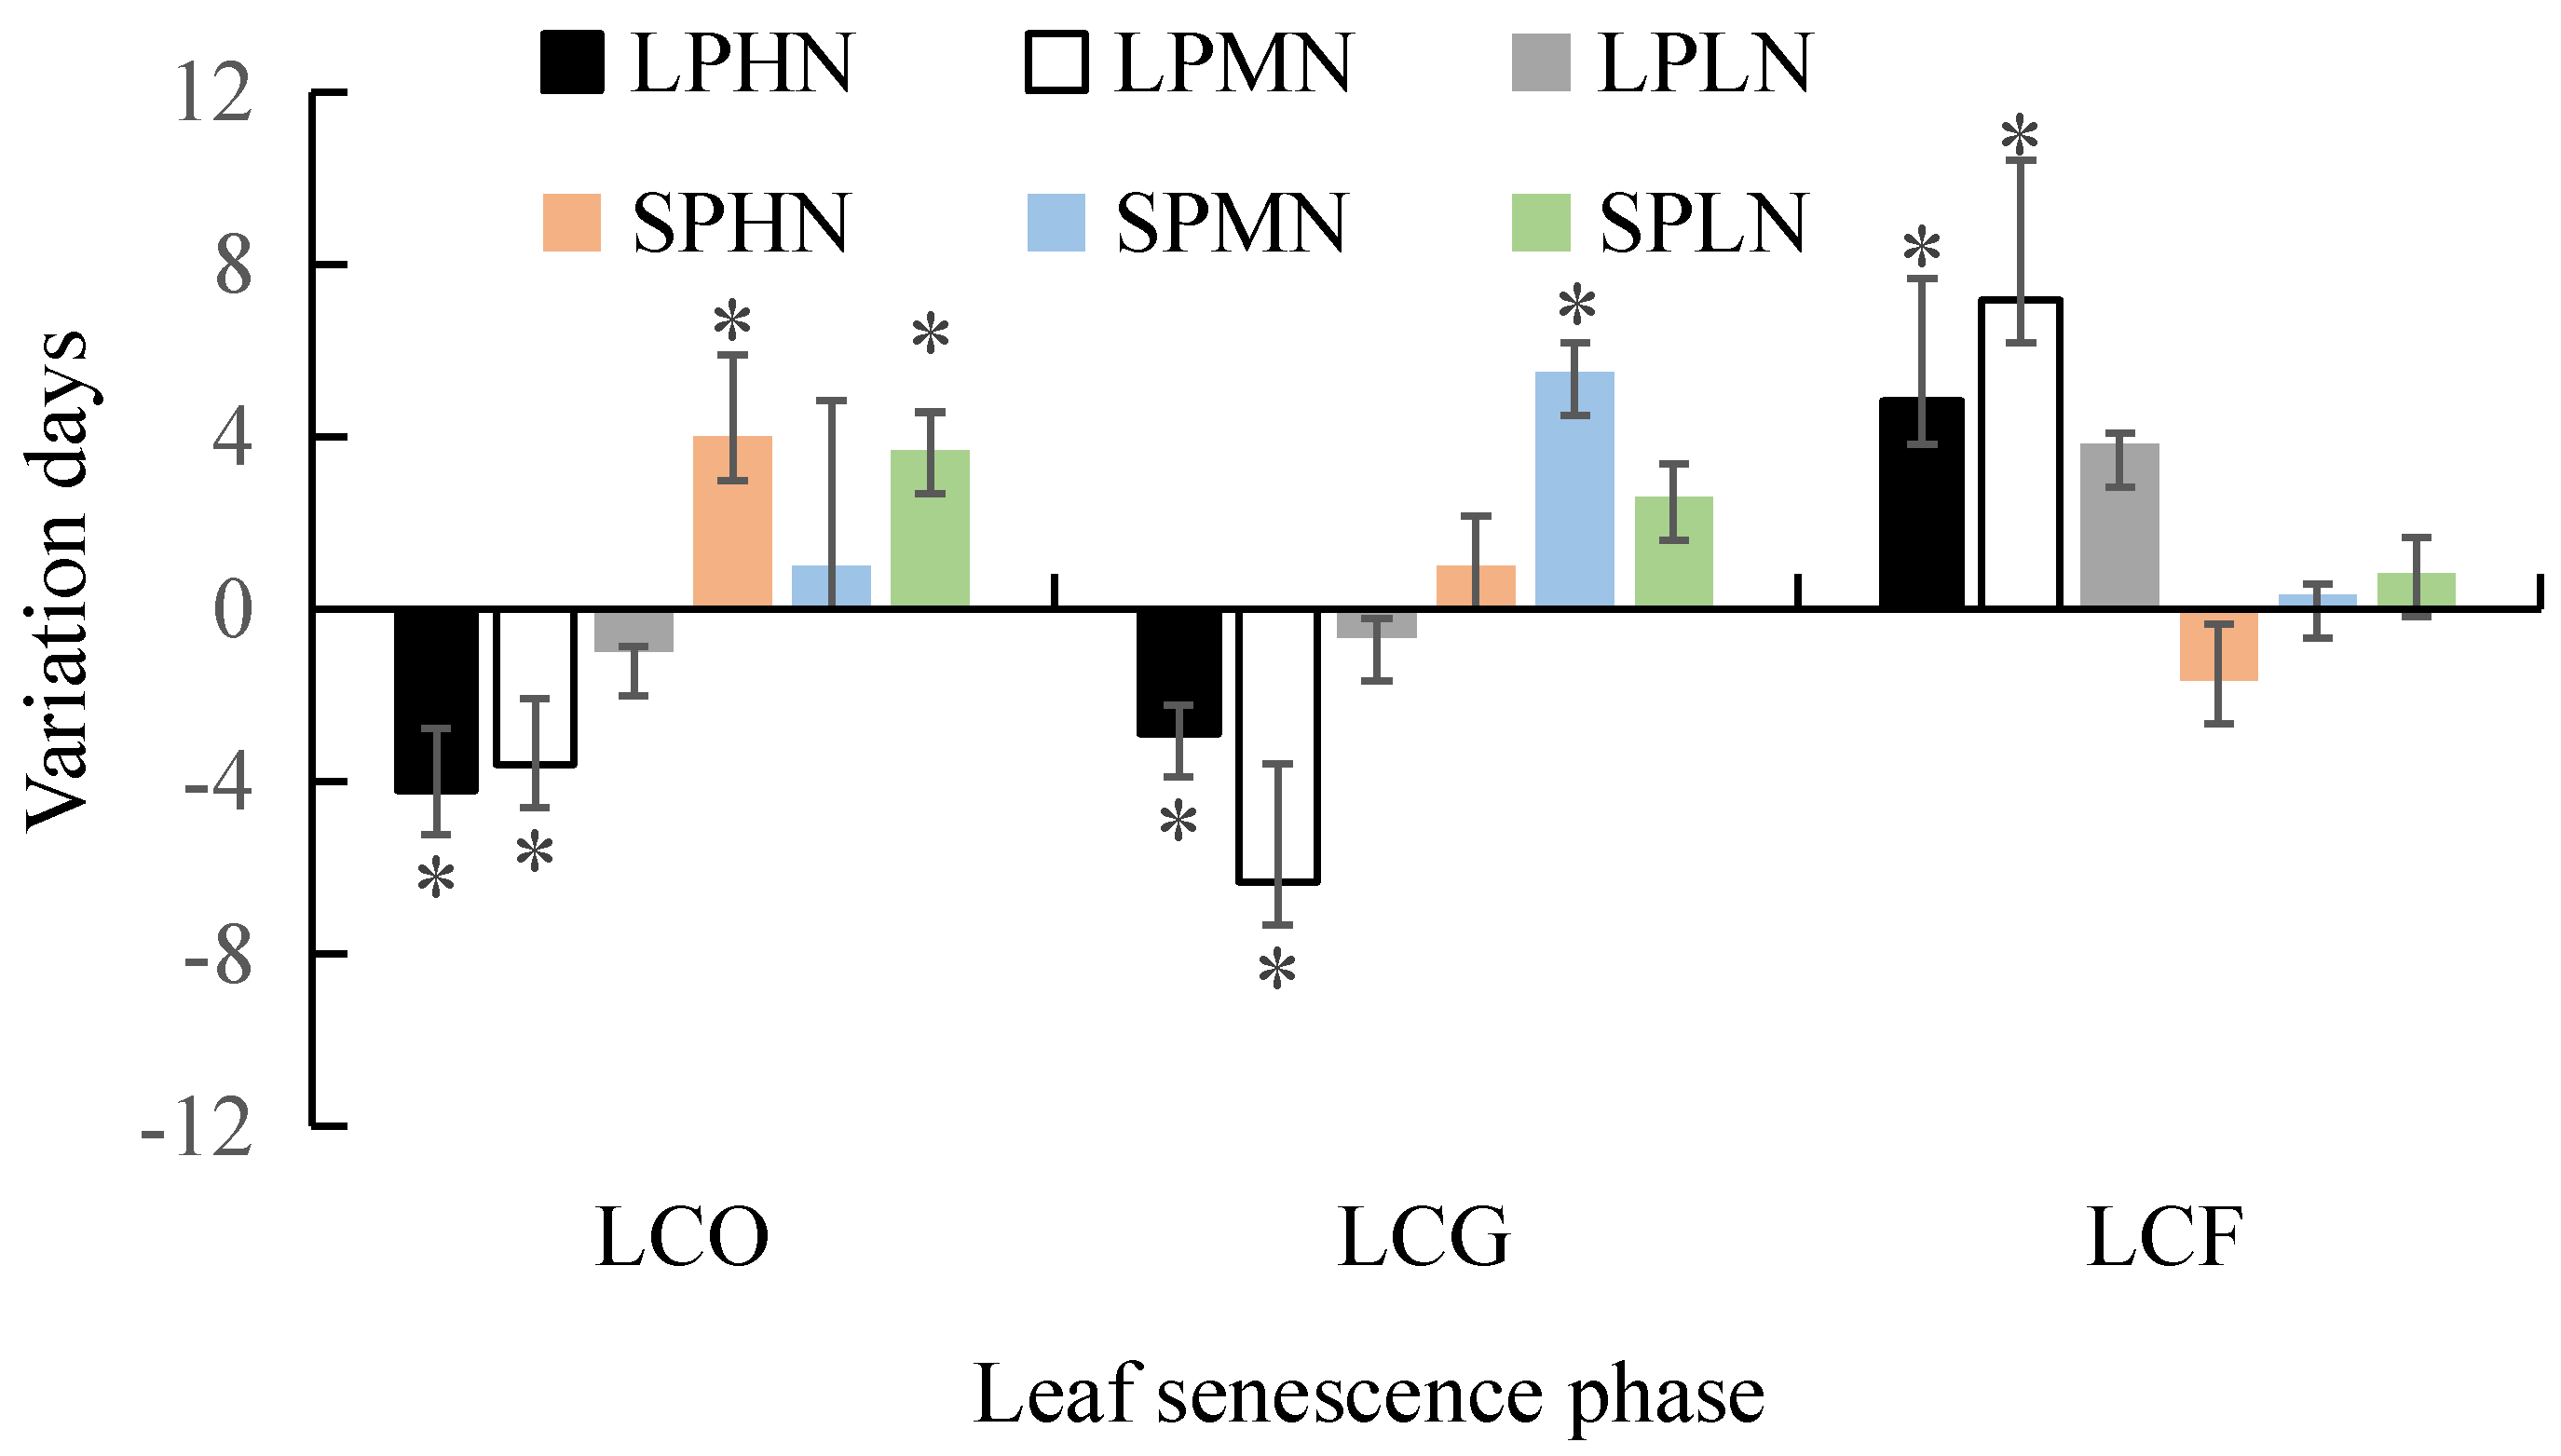
3.4. Effects of the Interaction between Photoperiod and Nitrogen Addition

The synergistic effect of the photoperiod and N addition affected LCO, LCG, and LCF differently (Figure 5). The interaction between the photoperiod and N addition significantly impacted the LCO and LCG in Stipa krylovii (p < 0.05), while the effect was significant for the LCF under the synergistic effect of LP and N addition (p < 0.05). Under LP treatments, LN, MN, and HN treatments advanced the LCO by 1.0, 3.6, and 4.2 days, respectively, and these advancements were 0.7, 6.3, and 2.9 days for LCG. Under SP treatments, LN, MN, and HN treatments delayed the LCO by 3.7, 1.0, and 4.0 days, respectively, and advanced the LCG by 2.6, 5.5, and 1.0 days, respectively. However, under LP treatments, LN, MN, and HN treatments delayed the LCF by 3.8, 7.2, and 4.8 days, respectively, whereas under SP treatments, LN, MN, and HN treatments advanced the LCF by 0.8, 0.3, and 1.7 days, respectively.

3.5. Effects from the Interactions among Temperature, Photoperiod, and Nitrogen Addition

The interactions among temperature, photoperiod, and N addition significantly influenced the leaf senescence phase of Stipa krylovii (p < 0.01, Table 2). The LCO, LCG, and LCF exhibited different responses to the combined effects of temperature, photoperiod, and N addition (Figure 6). Under a 1.5 °C warming with LP treatments, LN treatments delayed the LCO and LCG by 3.0 and 4.5 days, respectively, while MN and HN treatments advanced the LCO by 3.5 and 16 days, respectively, and these advancements were 0.5 and 20.2 days for LCG. With a 1.5 °C warming and SP treatments, LN, MN, and HM treatments advanced the LCO by 10.5, 13.0, and 14.5 days, respectively, with corresponding advancements of 4.2, 16.0, and 7.7 days for the LCG.
Under a 2.0 °C warming with LP treatments, LN, MN, and HM treatments advanced the LCO by 1.0, 3.6, and 4.2 days, respectively, with corresponding advancements of 0.7, 6.3, and 2.9 days for the LCG. With a 2.0 °C warming and SP treatments, LN and MN treatments delayed the LCO by 3.7 and 1.0 day, respectively, while HN treatments advanced the LCO by 4.0 days. LN, MN, and HM treatments delayed the LCG by 2.6, 5.5, and 1.0 day, respectively.
The response of the LCF to temperature, photoperiod, and N addition differed from that of the LCO and LCG. Under a 1.5 °C warming and LP treatments, LN, MN, and HM treatments delayed the LCF by 6.0, 14.0, and 15.5 days, respectively. Under a 2 °C warming and SP treatments, LCF was delayed by 3.8, 7.2, and 4.8 days for LN, MN, and HM treatments, respectively. Under a warming of 1.5 °C and SP treatments, LN, MN, and HM treatments advanced the LCF by 0.0, 2.0, and 5.0 days, respectively. Under a warming of 2 °C and LP treatments, the LCF was advanced by 0.8, 0.3, and 1.7 days for LN, MN, and HM treatments, respectively.

4. Discussion

Temperature, a crucial element in climate change, profoundly influences plant senescence [40]. It regulates plant growth rates and substantially affects fundamental physiological processes throughout the growth cycle. Temperature is widely accepted as the dominant controlling factor of plant phenology. Research indicates that rising temperatures have delayed autumn phenology. A 53-year dataset demonstrated a positive correlation between autumn temperatures and leaf senescence at most stations, suggesting that higher temperatures result in delayed autumn leaf senescence [41]. In China, leaf senescence in temperate grasslands has shown a significantly positive correlation with temperature [42]. Our findings confirm that increased temperature delays leaf senescence, aligning with autumn phenology studies; for instance, the mean leaf senescence date of F. sylvatica saplings were delayed by approximately 8 days when the temperature in the chambers were increased by 1 °C during autumn [43]. Additionally, research from alpine grasslands found that preseason warming delayed leaf senescence in the eastern and northwestern regions of the Tibetan Plateau [44]. Furthermore, a meta-analysis based on the data from Chinese Phenological Observation Network (CPON) established in 1963 revealed that 69.0% of the autumn phenophase records show later trends with global warming [8].
A continually declining daylength during autumn is an essential environmental cue that induces growth cessation, widely accepted as the primary mechanism by which photoperiod controls autumn phenology [45]. In cold regions, the process of leaf senescence in plants is triggered by shortened photoperiods [21], meaning that growth cessation and leaf senescence are strongly regulated by photoperiods [46,47]. Long photoperiods can inhibit the accumulation of abscisic acid, thereby delaying leaf senescence [48,49]. However, our findings contradict this, as long photoperiods (LP) advanced the leaf senescence phase, while short photoperiods (SP) delayed it. Plant sensitivity to photoperiods varies by species and phenological period [50,51], and previous studies have also shown that photoperiods alone could not account for the variations of leaf senescence onset across Europe [52,53], leading to significant uncertainty regarding the impact of photoperiod changes on the autumn phenology of plants. These uncertainties are likely due to differences in species, regional climate characteristics, research methods, and study periods [45]. A possible explanation in this study is that plants exposed to short photoperiods for extended periods experienced a significant reduction in photosynthesis duration. To compensate for reduced photosynthesis caused by insufficient daylength and maximize dry matter accumulation, plants must delay the leaf senescence phase. As a result, short photoperiods delayed the leaf senescence phase.
The role of nutrient N in phenological development remains largely unexplored [29]. Studies have shown that N addition can delay flowering in grasses, but slightly accelerate flowering in forbs [54]. Alpine forbs plants respond to N by flowering later, whereas graminoids flower earlier in response to N addition [28]. Results from controlled experiments have indicated that N alone did not show any significant effect on the phenology of Gnaphalium supinum L. [29]. These findings suggest species and regional differences in plant phenology’s response to N addition. Our results suggested that N addition advanced the leaf senescence phase, with the trend becoming more pronounced with increasing nitrogen levels. This highlights that varying levels of N addition will differently affect plant phenology and that the ongoing rise in atmospheric N deposition may alter these phenological responses. However, current research contains considerable uncertainty regarding the impact of N deposition on plant phenology, with few studies exploring the phenological responses of diverse species. Thus, it is crucial to highlight the need for continuing experiments testing the effects of N deposition on phenology [29].
The synergistic interplay of multiple environmental factors results in more complex phenological changes. From a plant physiology perspective, it is widely accepted that leaf senescence is controlled by photoperiod and temperature [21,55]. Recent studies have demonstrated that the temperature sensitivity of leaf-out has significantly decreased in deciduous tree species over the past three decades, likely because photoperiod limits further advance to protect leaves from potential frost damaging [45]. Autumn phenology represents the transition of plants from active growth to dormancy [46], governed by a complex interaction of environmental and biological factors. No single environmental factor can fully regulate leaf senescence, and the interplay among temperature, photoperiod, and other variables in controlling it remains under debate, creating great uncertainty about the combined impact of these factors. Controlled experiments in climate chambers in Europe have also indicated that shorter photoperiods significantly reduce the temperature sensitivity of plants, consistent with our findings that the advancement of leaf senescence due to the LP was diminished at 2 °C. Previous studies have detected a negative interactive effect between warming and N addition on plant phenology [54], suggesting that N addition may differently affect the temperature sensitivity of plant phenology across regions [56]. The ANOVA in our study demonstrated that temperature, photoperiod, and N addition interacted to affect the leaf senescence phase, with varying responses to their combined effects. Given the impact of N deposition in future climate scenarios, more attention should be paid to its effects on plant phenology. The mechanism by which multiple environmental factors influence plant phenology is intricate. Future research should focus on interactions among environmental factors and conduct longer-term controlled experiments to explore plant phenology’s responses to varying conditions. Simultaneously, studies should intensify on the physiological and ecological mechanisms driving plant phenological changes due to environmental shifts to deepen our understanding of these responses.

5. Conclusions

Using large artificial growth chambers, we investigated the effects of temperature, photoperiod, and N addition on the leaf senescence of Stipa krylovii. Our findings revealed that (1) temperature significantly delayed the leaf senescence phase, with a noticeable delay as temperatures increased; LP treatment advanced the leaf senescence phase, while SP treatment delayed it; N addition advanced the leaf senescence phase, with the trend becoming more pronounced with increasing nitrogen levels; (2) temperature altered the sensitivity of leaf senescence phase to photoperiod; and (3) the interactions among temperature, photoperiod, and N addition significantly influence the leaf senescence phase of Stipa krylovii (p < 0.01), with varying effects depending on the levels of temperature, photoperiod, and N addition.

Author Contributions

Conceptualization, G.Z. and X.S.; methodology, X.S.; software, X.S.; validation, G.Z. and X.S.; formal analysis, X.S.; data curation, X.S.; writing—original draft preparation, G.Z and X.S.; writing—review and editing, G.Z and X.S.; supervision, G.Z. All authors have read and agreed to the published version of the manuscript.

Funding

This research was funded by National Natural Science Foundation of China (42130514), and the Basic Research Fund of Chinese Academy of Meteorological Sciences (2022Y015).

Data Availability Statement

Data available on request.

Acknowledgments

Sincere thanks go to the editor and anonymous reviewers for their thoughtful comments that improved this manuscript.

Conflicts of Interest

The authors declare no conflicts of interest.

References

  1. Shen, X.; Shen, M.; Wu, C.; Peñuelas, J.; Ciais, P.; Zhang, J.; Freeman, C.; Palmer, P.I.; Liu, B.; Henderson, M.; et al. Critical role of water conditions in the responses of autumn phenology of marsh wetlands to climate change on the Tibetan Plateau. Glob. Change Biol. 2024, 30, e17097. [Google Scholar] [CrossRef] [PubMed]
  2. Menzel, A.; Fabian, P. Growing season extended in Europe. Nature 1999, 397, 659. [Google Scholar] [CrossRef]
  3. Zohner, C.M.; Renner, S.S. Common garden comparison of the leaf-out phenology of woody species from different native climates, combined with herbarium records, forecasts long-term change. Ecol. Lett. 2014, 17, 1016–1025. [Google Scholar] [CrossRef] [PubMed]
  4. Wang, H.; Gao, C.; Ge, Q. Low temperature and short daylength interact to affect the leaf senescence of two temperate tree species. Tree Physiol. 2022, 42, 2252–2265. [Google Scholar] [CrossRef]
  5. Keenan, T.F.; Gray, J.; Friedl, M.A.; Toomey, M.; Bohrer, G.; Hollinger, D.Y.; Munger, J.W.; O’Keefe, J.; Schmid, H.P.; Wing, I.S. Net carbon uptake has increased through warming-induced changes in temperate forest phenology. Nat. Clim. Chang. 2014, 4, 598–604. [Google Scholar] [CrossRef]
  6. Lin, S.; Wang, H.; Ge, Q.; Hu, Z. Effects of chilling on heat requirement of spring phenology vary between years. Agric. Forest Meteorol. 2022, 312, 108718. [Google Scholar] [CrossRef]
  7. Piao, S.; Liu, Q.; Chen, A.; Janssens, I.A.; Fu, Y.; Dai, J.; Liu, L.; Lian, X.; Shen, M.; Zhu, X. Plant phenology and global climate change: Current progresses and challenges. Glob. Chang. Biol. 2019, 25, 1922–1940. [Google Scholar] [CrossRef]
  8. Ge, Q.; Wang, H.; Rutishauser, T.; Dai, J. Phenological response to climate change in China: A meta-analysis. Glob. Change Biol. 2015, 21, 265–274. [Google Scholar] [CrossRef]
  9. Zhou, L.; Wang, Y.; Jia, Q.; Zhou, G. Increasing temperature shortened the carbon uptake period and decreased the cumulative net ecosystem productivity in a maize cropland in Northeast China. Field Crop Res. 2021, 267, 108150. [Google Scholar] [CrossRef]
  10. Zhu, W.; Tian, H.; Xu, X.; Pan, Y.; Chen, G.; Lin, W. Extension of the growing season due to delayed autumn over mid and high latitudes in North America during 1982–2006. Glob. Ecol. Biogeogr. 2012, 21, 260–271. [Google Scholar] [CrossRef]
  11. Garonna, I.; De Jong, R.; De Wit, A.J.W.; Mücher Caspar, A.; Schmid, B.; Schaepman, M.E. Strong contribution of autumn phenology to changes in satellite-derived growing season length estimates across Europe (1982–2011). Glob. Change Biol. 2015, 20, 3457–3470. [Google Scholar] [CrossRef] [PubMed]
  12. Bao, G.; Tuya, A.; Bayarsaikhan, S.; Dorjsuren, A.; Mandakh, U.; Bao, Y.; Li, C.; Vanchindorj, B. Variations and climate constraints of terrestrial net primary productivity over Mongolia. Quat. Int. 2022, 537, 112–125. [Google Scholar] [CrossRef]
  13. Wu, C.; Peng, J.; Ciais, P.; Peñuelas, J.; Wang, H.; Beguería, S.; Andrew Black, T.; Jassal, R.S.; Zhang, X.; Yuan, W.; et al. Increased drought effects on the phenology of autumn leaf senescence. Nat. Clim. Chang. 2022, 12, 943–949. [Google Scholar] [CrossRef]
  14. Maurya, J.P.; Bhalerao, R.P. Photoperiod- and temperature-mediated control of growth cessation and dormancy in trees: A molecular perspective. Ann. Bot. 2007, 120, 351–360. [Google Scholar] [CrossRef] [PubMed]
  15. Chuine, I.; Bonhomme, M.; Legave, J.M.; García de Cortázar-Atauri, I.; Charrier, G.; Lacointe, A.; Améglio, T. Can phenological models predict tree phenology accurately in the future? The unrevealed hurdle of endodormancy break. Glob. Change Biol. 2016, 22, 3444–3460. [Google Scholar] [CrossRef]
  16. Zhou, G.; Gu, W.; Liu, E.; Zhou, L.; Song, X.; Lv, X.; Ji, Y. Plant Phenology Simulation and Trigger Threshold Based on Total Climatic Production Factors—A Case Study of Stipa krylovii Phenology. Agronomy 2023, 13, 1768. [Google Scholar] [CrossRef]
  17. Lesica, P.; Kittelson, P.M. Precipitation and temperature are associated with advanced flowering phenology in a semi-arid grassland. J. Arid. Environ. 2010, 74, 1013–1017. [Google Scholar] [CrossRef]
  18. Zhang, X.; Ren, J.; Zhang, D. Phenological observations on Larix principis-rupprechtii Mayr. in primary seed orchard. J. For. Res. 2001, 12, 201–204. [Google Scholar] [CrossRef]
  19. Ren, S.; Li, Y.; Peichl, M. Diverse effects of climate at different times on grassland phenology in mid-latitude of the Northern Hemisphere. Ecol. Indic. 2020, 113, 106260. [Google Scholar] [CrossRef]
  20. Heide, O.M. Temperature rather than photoperiod controls growth cessation and dormancy in Sorbus species. J. Exp. Bot. 2011, 62, 5397–5404. [Google Scholar] [CrossRef]
  21. Lang, W.; Chen, X.; Qian, S.; Liu, G.; Piao, S. A new process-based model for predicting autumn phenology: How is leaf senescence controlled by photoperiod and temperature coupling? Agric. For. Meteorol. 2019, 268, 124–135. [Google Scholar] [CrossRef]
  22. Wolkovich, E.M.; Cook, B.I.; Allen, J.M.; Crimmins, T.M.; Cleland, E.E. Warming experiments underpredict plant phenological responses to climate change. Nature 2011, 485, 494–497. [Google Scholar] [CrossRef] [PubMed]
  23. Rutishauser, T.; Luterbacher, J.; Defla, C.; Frank, D.; Wanner, H. Swiss spring plant phenology 2007: Extremes, a multi-century perspective, and changes in temperature sensitivity. Geophys. Res. Lett. 2008, 35, L05703. [Google Scholar] [CrossRef]
  24. Yu, H.; Luedeling, E.; Xu, J. Winter and spring warming result in delayed spring phenology on the Tibetan Plateau. Proc. Natl. Acad. Sci. USA 2010, 107, 22151–22156. [Google Scholar] [CrossRef]
  25. Wang, X.; Xiao, J.; Li, X.; Cheng, G.; Ma, M.; Zhu, G.; Arain, M.A.; TA Black, T.A.; Jassal, R.S. No trends in spring and autumn phenology during the global warming hiatus. Nat. Commun. 2019, 10, 2389. [Google Scholar] [CrossRef]
  26. Fu, Y.; Zhao, H.; Piao, S.; Peaucelle, M.; Peng, S.; Zhou, G.; Ciais, P.; Huang, M.; Menzel, A.; Uelas, J.P. Declining global warming efects on the phenology of spring leaf unfolding. Nature 2015, 526, 104–107. [Google Scholar] [CrossRef] [PubMed]
  27. Liu, L.; Monaco, T.A.; Sun, F.; Liu, W.; Gan, Y.; Sun, G. Altered precipitation patterns and simulated nitrogen deposition effects on phenology of common plant species in a Tibetan Plateau alpine meadow. Agric. For. Meteorol. 2017, 236, 36–47. [Google Scholar] [CrossRef]
  28. Smith, J.; Sconiers, W.; Spasojevic, M.; Ashton, I.; Suding, K. Phenological changes in alpine plants in response to increased snowpack, temperature, and nitrogen. Arct. Antarct. Alp. Res. 2012, 44, 135–142. [Google Scholar] [CrossRef]
  29. Petraglia, A.; Tomaselli, M.; Mondoni, A.; Brancaleoni, L.; Carbognani, M. Effects of nitrogen and phosphorus supply on growth and flowering phenology of the snowbed forb Gnaphalium supinum L. Flora 2014, 209, 271–278. [Google Scholar] [CrossRef]
  30. Matson, P.; Lohse, K.A.; Hall, S.J. The globalization of nitrogen deposition: Consequences for terrestrial ecosystems. Ambio 2002, 31, 113–119. [Google Scholar] [CrossRef]
  31. Galloway, J.N.; Dentener, F.J.; Capone, D.G.; Boyer, E.W.; Howarth, R.W.; Seitzinger, S.P.; Asner, G.P.; Cleveland, C.C.; Green, P.A.; Holland, E.A.; et al. Nitrogen cycles: Past, present, and future. Biogeochemistry 2004, 70, 153–226. [Google Scholar] [CrossRef]
  32. Chen, X.; Li, J.; Xu, L.; Liu, L.; Ding, D. Modeling greenup date of dominant grass species in the Inner Mongolian Grassland using air temperature and precipitation data. Int. J. Biometeorol. 2013, 58, 463–471. [Google Scholar] [CrossRef] [PubMed]
  33. Yuan, W.; Zhou, G.; Wang, Y.; Han, X.; Wang, Y. Simulating phenological characteristics of two dominant grass species in a semi-arid steppe ecosystem. Ecol. Res. 2007, 22, 784–791. [Google Scholar] [CrossRef]
  34. Yu, H.; Zhou, G.; Lv, X.; He, Q.; Zhou, M. Effects of Phenological Changes on Plant Production-From the View of Stipa krylovii. Agronomy 2022, 12, 3208. [Google Scholar] [CrossRef]
  35. Wang, H.; Wang, H.; Ge, Q.; Dai, J. The Interactive Effects of Chilling, Photoperiod, and Forcing Temperature on Flowering Phenology of Temperate Woody Plants. Front. Plant Sci. 2020, 11, 443. [Google Scholar] [CrossRef]
  36. Pletsers, A.; Caffarra, A.; Kelleher, C.T.; Donnelly, A. Chilling temperature and photoperiod influence the timing of bud burst in juvenile Betula pubescens Ehrh. and Populus tremula L. trees. Ann. For. Sci. 2015, 72, 941–953. [Google Scholar] [CrossRef]
  37. Caffarra, A.; Donnelly, A.; Chuine, I.; Jones, M.B. Modelling the timing of Betula pubescens budburst. I. Temperature and photoperiod: A conceptual model. Clim. Res. 2011, 46, 147–157. [Google Scholar] [CrossRef]
  38. Ettinger, A.K.; Chamberlain, C.J.; Morales-Castilla, I.; Buonaiuto, D.M.; Flynn, D.F.B.; Savas, T.; Samaha, J.A.; Wolkovich, E.M. Winter temperatures predominate in spring phenological responses to warming. Nat. Clim. Chang. 2020, 10, 1137–1142. [Google Scholar] [CrossRef]
  39. China Meteological Administration (Ed.) Observation Criterion of Agicultural Meteorology; China Meterological Press: Beijing, China, 1993; pp. 131–164. (In Chinese) [Google Scholar]
  40. Tao, Z.; Wang, H.; Dai, J.; Alatalo, J.; Ge, Q. Modeling spatiotemporal variations in leaf coloring date of three tree species across China. Agric. For. Meteorol. 2018, 249, 310–318. [Google Scholar] [CrossRef]
  41. Doi, H.; Takahashi, M. Latitudinal patterns in the phenological responses of leaf colouring and leaf fall to climate change in Japan. Glob. Ecol. Biogeogr. 2008, 17, 556–561. [Google Scholar] [CrossRef]
  42. Yang, Y.; Guan, H.; Shen, M.; Liang, W.; Jiang, L. Changes in autumn vegetation dormancy onset date and the climate controls across temperate ecosystems in China from 1982 to 2010. Glob. Chang. Biol. 2015, 21, 652–665. [Google Scholar] [CrossRef] [PubMed]
  43. Fu, Y.H.; Piao, S.; Delpierre, N.; Hao, F.; Hnninen, H.; Liu, Y.; Sun, W.; Janssens, I.A.; Campioli, M. Larger temperature response of autumn leaf senescence than spring leaf-out phenology. Glob. Chang. Biol. 2018, 24, 2159–2168. [Google Scholar] [CrossRef] [PubMed]
  44. Cong, N.; Shen, M.; Piao, S. Spatial variations in responses of vegetation autumn phenology to climate change on the Tibetan Plateau. J. Plant Ecol. 2016, 10, 744–752. [Google Scholar] [CrossRef]
  45. Fu, Y.; Li, X.; Zhou, X.; Geng, X.; Guo, Y.; Zhang, Y. Progress in plant phenology modeling under global climate change. Sci. China Earth Sci. 2020, 63, 1237–1247. [Google Scholar] [CrossRef]
  46. Estiarte, M.; Penuelas, J. Alteration of the phenology of leaf senescence and fall in winter deciduous species by climate change: Effects on nutrient proficiency. Glob. Change Biol. 2015, 21, 1005–1017. [Google Scholar] [CrossRef]
  47. Soolanayakanahally, R.Y.; Guy, R.D.; Silim, S.N.; Song, M. Timing of photoperiodic competency causes phenological mismatch in balsam poplar (Populus balsamifera L.). Plant Cell Environ. 2013, 36, 116–127. [Google Scholar] [CrossRef]
  48. Zhang, Q.; Kong, D.; Shi, P.; Singh, V.P.; Sun, P. Vegetation phenology on the Qinghai-Tibetan Plateau and its response to climate change (1982–2013). Agric. For. Meteorol. 2018, 248, 408–417. [Google Scholar] [CrossRef]
  49. Zu, J.; Zhang, Y.; Huang, K.; Liu, Y.; Chen, N.; Cong, N. Biological and climate factors co-regulated spatial-temporal dynamics of vegetation autumn phenology on the Tibetan Plateau. Int. J. Appl. Earth Obs. 2018, 69, 198–205. [Google Scholar] [CrossRef]
  50. Basler, D.; Korner, C. Photoperiod sensitivity of bud burst in 14 temperate forest tree species. Agric. For. Meteorol. 2012, 165, 73–81. [Google Scholar] [CrossRef]
  51. Laube, J.; Sparks, T.H.; Estrella, N.; Höfler, J.; Ankerst, D.P.; Menzel, A. Chilling outweighs photoperiod in preventing precocious spring development. Glob. Chang. Biol. 2013, 20, 170–182. [Google Scholar] [CrossRef]
  52. Liu, Q.; Delpierre, N.; Campioli, M. Photoperiod alone does not explain the variations of leaf senescence onset across Europe. Agric. For. Meteorol. 2024, 355, 110134. [Google Scholar] [CrossRef]
  53. Flynn, D.F.B.; Wolkovich, E.M. Temperature and photoperiod drive spring phenology across all species in a temperate forest community. New Phytol. 2018, 219, 1353–1362. [Google Scholar] [CrossRef]
  54. Cleland, E.E.; Chiariello, N.R.; Loarie, S.R.; Mooney, H.A.; Field, C.B. Diverse responses of phenology to global changes in a grassland ecosystem. Proc. Natl. Acad. Sci. USA 2006, 103, 13740–13744. [Google Scholar] [CrossRef] [PubMed]
  55. Fracheboud, Y.; Luquez, V.; Bjorken, L.; Sjodin, A.; Tuominen, H.; Jansson, S. The control of autumn senescence in european Aspen. Plant Physiol. 2009, 149, 1982–1991. [Google Scholar] [CrossRef]
  56. Xia, J.; Wan, S. Independent effects of warming and nitrogen addition on plant phenology in the Inner Mongolian steppe. Ann. Bot. 2013, 111, 1207–1217. [Google Scholar] [CrossRef] [PubMed]
Figure 1. (a) The three large artificial climate chambers; (b) six cubicles in each chamber separated by wooden boards and opaque curtains; (c) sodium lamp.
Agronomy 14 02145 g001
Figure 2. Variation days of the leaf senescence of Stipa krylovii in temperature (a), photoperiod (b) and N addition (c). * means significant difference compared with control at 0.05 level (p < 0.05). Variation days in figures were calculated by subtracting the corresponding control values from the treatment values. Negative values indicate an advancement in the leaf senescence phase, while positive values indicate a delay.
Agronomy 14 02145 g002
Figure 3. Variation days of the leaf senescence of Stipa krylovii affected by interactive temperature and photoperiod. LCO: Leaf coloration onset stage, LCG: leaf coloration in general stage, LCF: leaf fully coloring stage. T1.5, 1.5 °C above the control, T2, 2 °C above the control, LP: long photoperiods, SP: short photoperiods. * means significant difference compared with control at 0.05 level (p < 0.05). Variation days in the figure were calculated by subtracting the corresponding control values from the treatment values. Negative values indicate an advancement in the leaf senescence phase, while positive values indicate a delay.
Agronomy 14 02145 g003
Figure 4. Variation days of the leaf senescence of Stipa krylovii affected by interactive temperature and N addition. LCO: Leaf coloration onset stage, LCG: leaf coloration in general stage, LCF: leaf fully coloring stage. T1.5, 1.5 °C above the control, T2, 2 °C above the control, LN: low nitrogen addition, MN: medium nitrogen addition, HN: high nitrogen addition. * means significant difference compared with control at 0.05 level (p < 0.05). Variation days in the figure were calculated by subtracting the corresponding control values from the treatment values. Negative values indicate an advancement in the leaf senescence phase, while positive values indicate a delay.
Agronomy 14 02145 g004
Figure 5. Variation days of the leaf senescence of Stipa krylovii affected by the interactive photoperiod and N addition. LCO: Leaf coloration onset stage, LCG: leaf coloration in general stage, LCF: leaf fully coloring stage. LP: long photoperiods, SP: short photoperiods, LN: low nitrogen addition, MN: medium nitrogen addition, HN: high nitrogen addition. * means significant difference compared with control at 0.05 level (p < 0.05). Variation days in the figure were calculated by subtracting the corresponding control values from the treatment values. Negative values indicate an advancement in the leaf senescence phase, while positive values indicate a delay.
Agronomy 14 02145 g005
Figure 6. Variation days of the leaf senescence of Stipa krylovii from the interactive effects of temperature, photoperiod, and N addition. LCO: Leaf coloration onset stage, LCG: leaf coloration in general stage, LCF: leaf fully coloring stage.T1.5, 1.5 °C above the control, T2, 2 °C above the control, LP: long photoperiods, SP: short photoperiods, LN: low nitrogen addition, MN: medium nitrogen addition, HN: high nitrogen addition. * means significant difference compared with control at 0.05 level (p < 0.05). Variation days in the figure were calculated by subtracting the corresponding control values from the treatment values. Negative values indicate an advancement in the leaf senescence phase, while positive values indicate a delay.
Agronomy 14 02145 g006
Table 1. Simulated climatic parameters during the experiment for every month.
MonthT
(°C)
T1.5
(°C)
T2
(°C)
P (h)LP (h)SP (h)RH (%)Rainfall (mm)IM (mL)
45.87.37.814181038.27.523.5
513.715.215.814181038.225.477.1
619.220.721.214181048.951.7162.2
721.923.423.914181058.577.6235.8
820.121.622.114181057.753.0161.2
913.414.915.414181052.023.874.6
104.35.86.314181052.512.838.8
T, the mean temperature of the original place of Stipa krylovii from 1989–2020, T1.5, 1.5 °C above the T, T2: 2 °C above the T, P: the average photoperiod of the original place of Stipa krylovii from 1989 to 2020, LP, 4 h above the P, SP, 4 h below the P, RH: Relative humidity (%), IM: Irrigation amount for every three days (mL).
Table 2. Analysis of variance for the effects of temperature (T), photoperiod (P), and nitrogen addition (N) on the leaf senescence of Stipa krylovii.
VariablesLCOLCGLCF
T11.9 **180.5 **511.5 **
P436.9 **800.7 **113.5 **
N57.4 **35.5 **12.6 **
T × P54.7 **6.9 **163.4 **
T × N12.5 **56.5 **28.1 **
P × N24.8 **81.5 **44.7 **
T × P × N84.8 **69.9 **25.8 **
The values shown are the F-statistic of the analysis of variance (ANOVA). ** p < 0.01; LCO: Leaf coloration onset stage, LCG: leaf coloration in general stage, LCF: leaf fully coloring stage.
Disclaimer/Publisher’s Note: The statements, opinions and data contained in all publications are solely those of the individual author(s) and contributor(s) and not of MDPI and/or the editor(s). MDPI and/or the editor(s) disclaim responsibility for any injury to people or property resulting from any ideas, methods, instructions or products referred to in the content.

