Article

Mainstream Planting Systems Influence Spatiotemporal Variations in the Soil Quality of Watershed Sloping Farmland

1
State Key Laboratory of Soil and Sustainable Agriculture, Institute of Soil Sciences, Chinese Academy of Sciences, 71 East Beijing Road, Nanjing 210008, China
2
College of Environment, Hohai University, Nanjing 210098, China
3
Robert R. McCormick School of Engineering and Applied Science, Northwestern University, 633 Clark Street, Evanston, IL 60208, USA
*
Author to whom correspondence should be addressed.
Agronomy 2024, 14(9), 2146; https://doi.org/10.3390/agronomy14092146
Submission received: 19 August 2024 / Revised: 16 September 2024 / Accepted: 17 September 2024 / Published: 20 September 2024
(This article belongs to the Section Farming Sustainability)

Abstract

:
Mainstream planting systems of watershed sloping farmland span the globe and are closely related to the variations in the soil quality of watershed sloping farmland. However, little information is available about how mainstream planting systems influence spatiotemporal variations in the soil quality of watershed sloping farmland. The soil of 0–20 cm was collected at fixed points in three mainstream planting systems (a low-altitude citrus orchard system, a mid-altitude double-cropping system, and a high-altitude single-cropping system) at a fixed time each year for 15 years in a typical agricultural watershed of the Three Gorges Reservoir area of China. Fourteen physicochemical properties of the sampled soil were measured. We found that (1) the soil quality indexes of the citrus orchard system, double-cropping system, and single-cropping system decreased from 0.75, 0.71, and 0.67 in 2004 to 0.68, 0.57, and 0.55 in 2019, respectively; (2) the order of the six master control factors influencing soil quality was sand content > bulk density > total nitrogen > clay content > pH > total phosphorus in the citrus orchard system, sand content > bulk density > clay content > pH > total phosphorus > total nitrogen in the double-cropping system, and sand content > clay content > total phosphorus > pH > bulk density > total nitrogen in the single-cropping system; and (3) the total effects of soil erosion and fertilization on soil quality were −0.496 and −0.308 in the citrus orchard system, −1.254 and 0.371 in the double-cropping system, and −0.844 and 0.013 in the single-cropping system, respectively. We suggest that the three mainstream planting systems influence soil quality through variations in their master control factors caused primarily by soil erosion and secondarily by fertilization. These findings are important for controlling soil degradation through controlling soil erosion and rational fertilization in watersheds.

1. Introduction

Sloping farmland is an important land use type [1] and plays a vital role in ensuring food security and maintaining regional ecological equilibrium [2]. However, soil quality degradation in sloping farmland is becoming increasingly serious because of soil erosion and excessive fertilizer worldwide [3,4]. Soil erosion leads to soil quality degradation by destroying the soil structure [5], thinning the top soil [6] and reducing the organic matter and nutrient contents [7]. Excessive fertilizer leads to soil quality degradation by decreasing soil pH [8], increasing soil BD [9], destroying the soil aggregation [10], and reducing soil permeability and water holding capacity [11]. In China, soil erosion has occurred over 2.67 × 10⁶ km2, accounting for 27.8% of the country’s total acreage [12], and the total nitrogen fertilizer application amount in 2021 was 1.75 × 10⁷ tons, accounting for approximately one third of the world’s total application amount [13]. Soil quality degradation in sloping farmland threatens agricultural productivity, the environment, and sustainable agricultural development [14,15]. Every watershed in the world has its own long-established mainstream planting systems, and each planting system in the watershed is closely related to variations in the soil quality of the watershed sloping farmland [16]. Therefore, it is very important to study the spatiotemporal variations in sloping farmland soil quality influenced by mainstream planting systems for the sustainable utilization of watershed sloping farmland worldwide.
Soil quality evaluation is an effective method for determining the soil quality status of sloping farmland [17,18]. A precise soil quality evaluation enables the identification of problematic regions and unfavorable patterns and provides guidance to farmers and policymakers regarding management strategies for preserving or enhancing soil quality [19]. At present, the soil quality index (SQI) [20], a quantitative method, has been used by many scholars in many different regions, and satisfactory evaluation results have been obtained [21,22,23,24]. Variation in the soil quality of sloping farmland is a dynamic process. However, previous studies have focused primarily on evaluating static soil quality in a given year. Few studies have investigated long-term trends in soil quality variations in sloping farmland, and little information is available about the master control factors of soil quality and the mechanisms influencing soil quality by different mainstream planting systems at the watershed scale, which are critical for properly distributing and effectively utilizing sloping farmland resources and preventing soil quality degradation and water pollution in watersheds.
The Three Gorges Reservoir area (TGRA) of China is a typical region with a sloping farmland distribution, in which farmland with slopes of 10 degrees and above accounts for 79.3% of the total farmed area, excluding paddy fields [25]. Soil erosion and nutrient losses are critical issues. In particular, soil erosion and nutrient losses became increasingly serious after the dam construction in 2006 because farmers reclaimed steeper land on mountains after 19,400 ha of high-quality farmland was inundated [26], and fertilization doubled to ensure agricultural productivity and income [27]. Currently, nutrients and sediments entering the Three Gorges Reservoir pose a serious threat not only to the sustainable agricultural development of this area but also to the safety of water quality [28]. The three mainstream planting systems in these sloping areas of the TGRA are the low altitude citrus orchard system (≤600 m), the mid-altitude double-cropping system (600–900 m), and the high-altitude single-cropping system (≥900 m). We chose a typical agricultural watershed in the TGRA to conduct fixed-point sampling of the soil in the three mainstream planting systems over 15 years. Our purpose was to identify (1) the spatiotemporal variations in soil quality, (2) the factors controlling soil quality variations, and (3) the mechanisms of soil erosion and fertilization influencing soil quality variations in the three mainstream planting systems of watershed sloping farmland. This study is critical for the proper management and effective utilization of sloping farmland resources and the prevention of soil quality degradation and water pollution in watersheds worldwide.

2. Materials and Methods

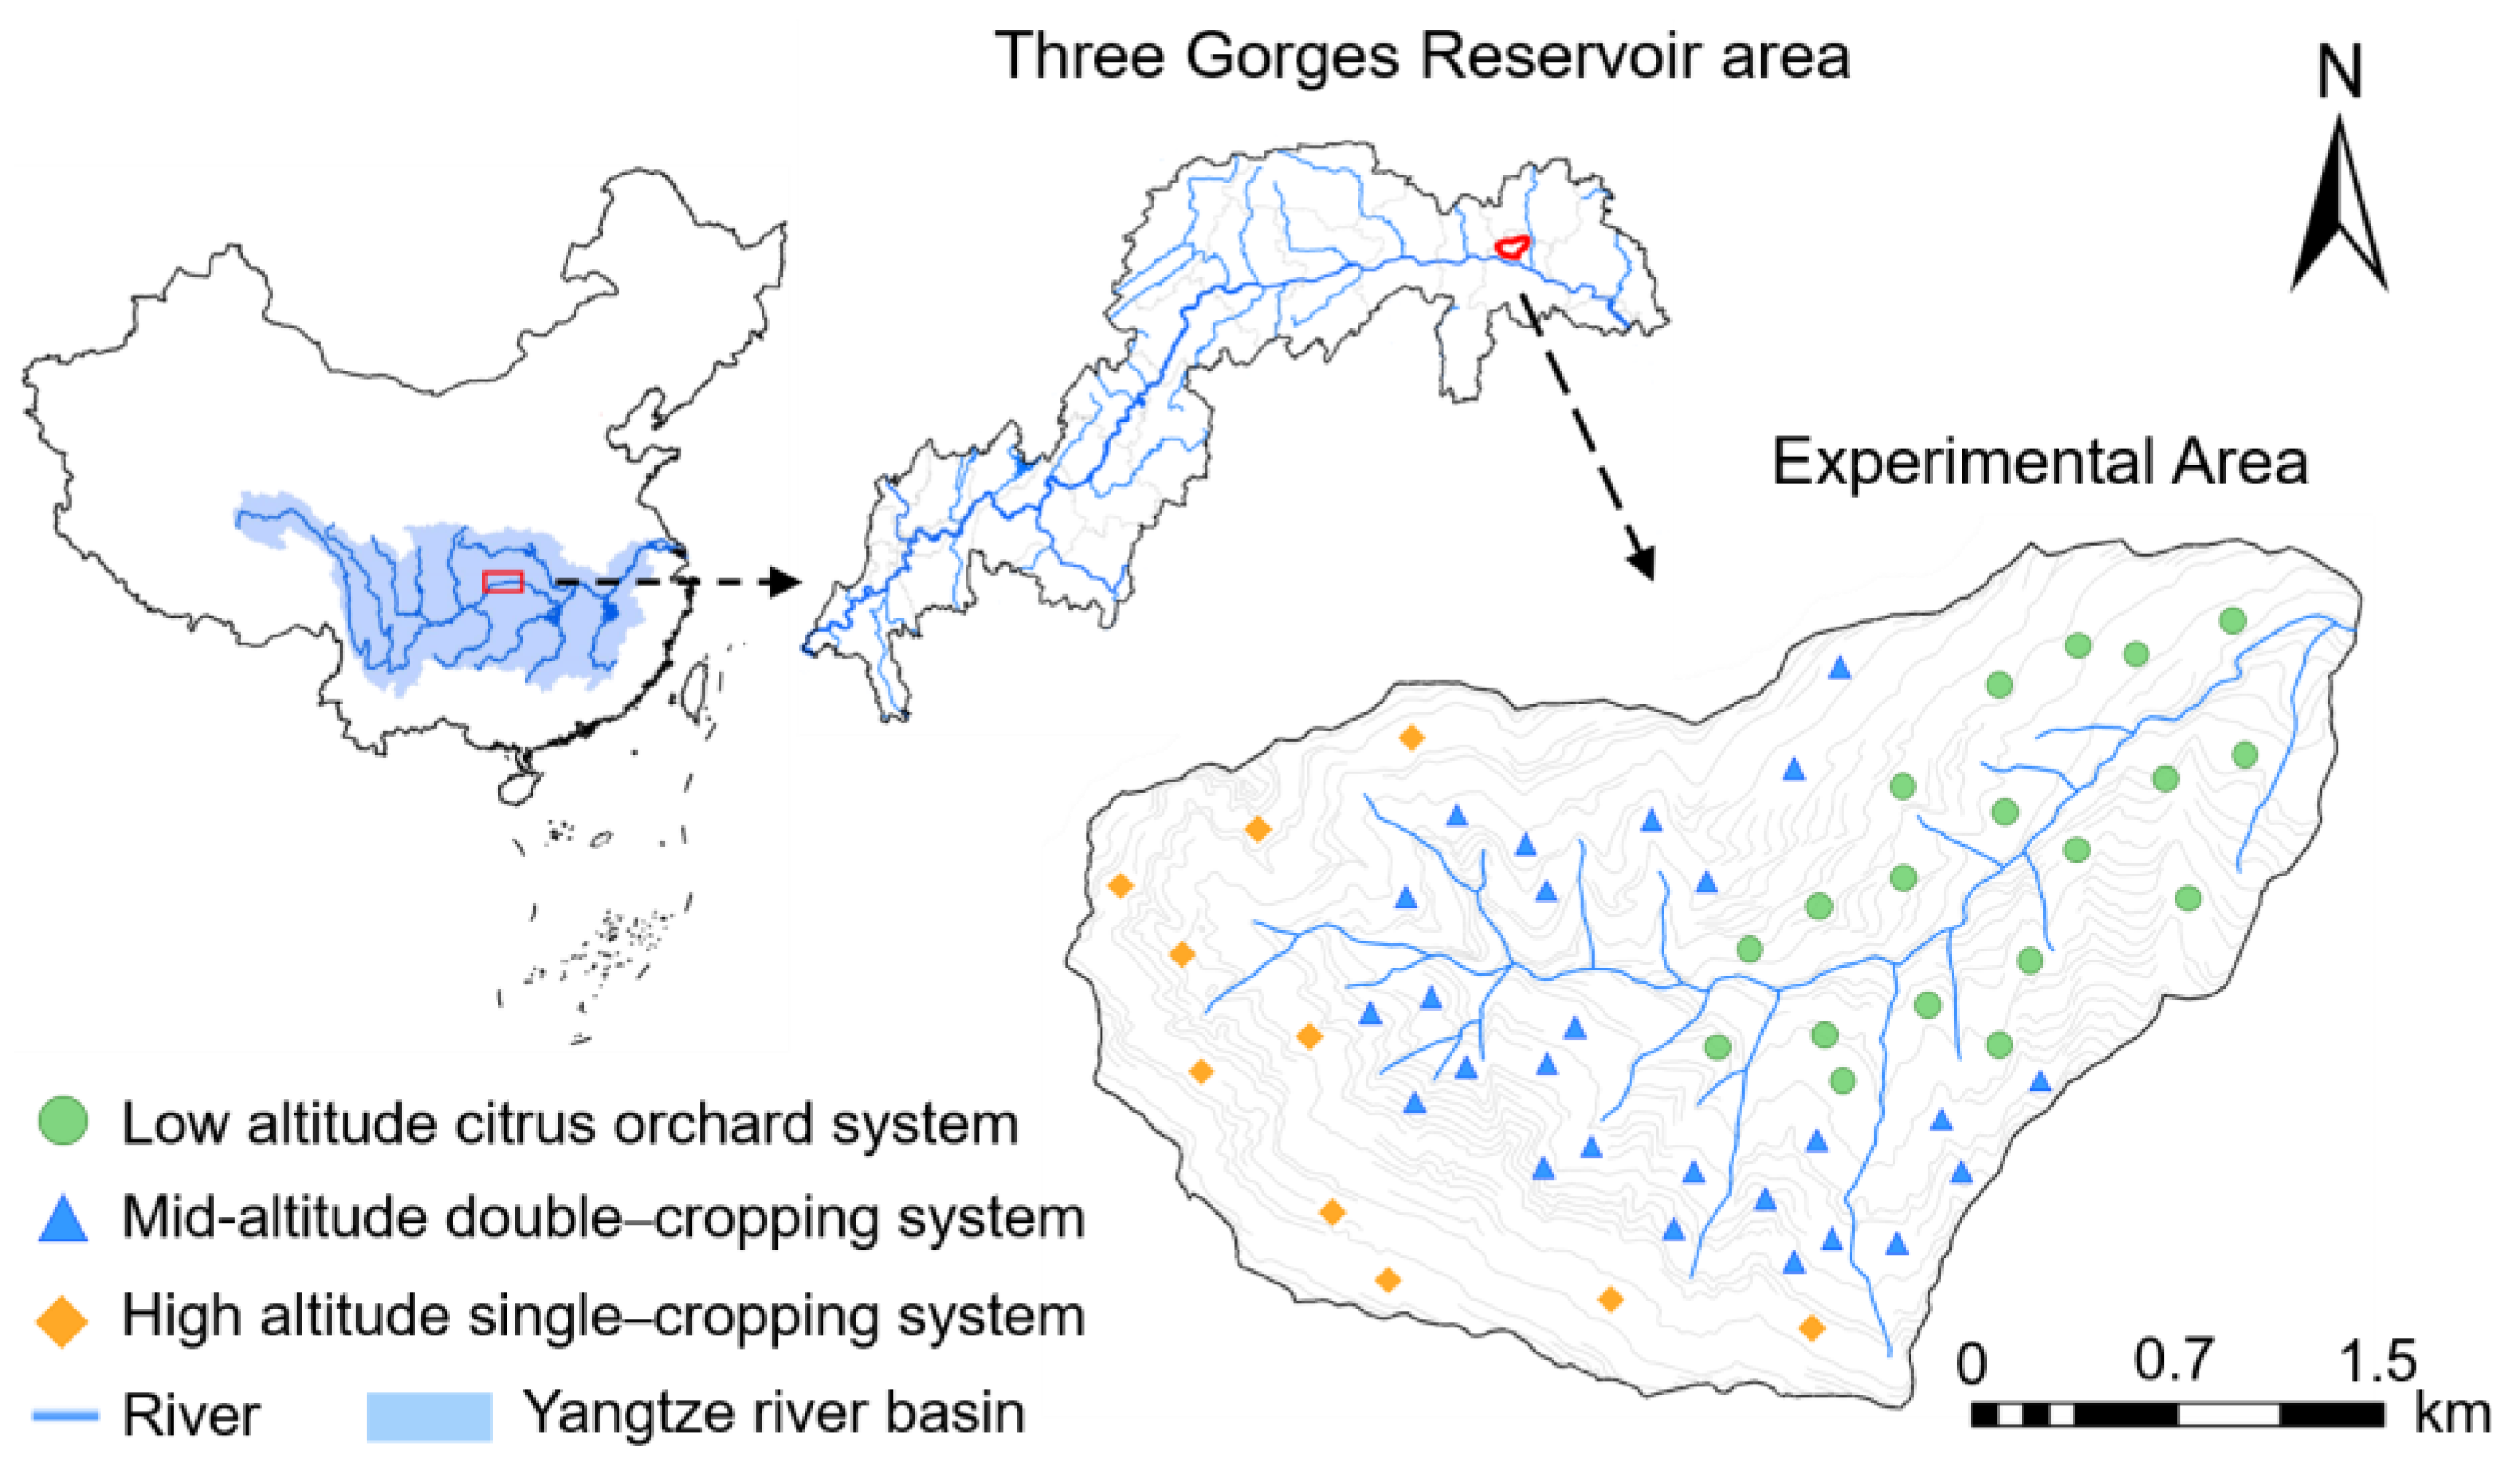
2.1. Study Watershed

The study watershed is located in the head region of the TGRA (31.04°–31.10° N, 110.59°–110.68° E) (Figure 1), and the watershed area is 12.0 km2, with minimum and maximum elevations of 185.2 m and 1187.8 m, respectively, and an average slope of 25.8°. The watershed is representative of the typical agroecosystem in the reservoir area. This area has a humid subtropical monsoon climate with an annual mean temperature and rainfall of 22.1 °C and 1114.9 mm, respectively [25]. The geological structure is mainly composed of a low mountain valley area of purple sand shale, and the landform is mainly mountainous and hilly. Inceptisols account for 78.7% of the soil in cultivated land. The mainstream planting systems are the low-altitude citrus orchard system (≤600 m), the mid-altitude double-cropping system (600–900 m), and the high-altitude single-cropping system (≥900 m).

2.2. Distribution of the Soil Sampling Sites

Fifty-five sampling sites were located in the study watershed, of which 19 sites were located in the low-altitude citrus orchard system (200–600 m), 26 sites were located in the mid-altitude double-cropping system (600–900 m), and 10 sites were located in the high-altitude single-cropping system (900–1200 m) (Figure 1). The planting systems and management methods (except the different magnitude of the annual increase in nitrogen fertilizer application rate) at the sampling sites have remained virtually unchanged since 2004. The crops include citrus at low altitude, maize or peanut (summer–autumn) and wheat (winter–spring) at medium altitude, and maize or peanut (summer–autumn) at high altitude.

2.3. Collection and Analysis of Soil Sample

Three random soil samples from the cultivated layer (0–20 cm depth) were collected at each sampling site and mixed thoroughly for homogeneity in September from 2004 to 2019, except 2009. The samples were air-dried for four weeks at room temperature and then crushed and sieved via a 2 mm sieve to measure all the soil properties except bulk density (BD). The BD and the soil porosity (SP) of the cultivated soil were measured via the cutting ring method and calculated via the soil density and BD, respectively [29,30]. The available nitrogen (AN) was considered equal to the sum of NH4+-N and NO3-N, which were determined via a colorimetric method [31]. The methods for determining other soil properties are shown in Table 1. The sample collection, pretreatment, and analyses were consistent over the study period.

2.4. Soil Quality Evaluation

2.4.1. Evaluation Factors Selection

Due to the fact that soil quality is mainly determined by soil physicochemical properties, and the soil physicochemical properties mainly include BD, SP, sand, silt, clay, pH, CEC, SOM, TN, TP, TK, AN, AP, and AK, we selected these 14 soil properties for comprehensive evaluation of soil quality.

2.4.2. Single-Factor Evaluation

Among the evaluation factors, the first category had a critical value, which included CEC, SOM, TN, TP, TK, AN, AP, and AK. These evaluation factors were evaluated via Formula (1) [38]. The other category had an optimal critical range, which included BD, SP, sand, silt, clay, and pH. These evaluation factors were evaluated via Formula (2).
S ( x ) =         1                           x x 0   x / x 0               x x 0
S ( x ) = 1                                                                                           b 1 x b 2                   ( x a 1 ) / ( b 1 a 1 )                               a 1 x b 1                   ( a 2 x ) / ( a 2 b 2 )                                   b 2 x a 2                   0                                                                                       x a 1   o r   x a 2
where x and S(x) are the value and the score function of the evaluation factor, and x0, a1, a2, b1, and b2 are the critical values of the evaluation factor determined according to the actual situation.

2.4.3. Calculation of the Weights of the Evaluation Factors

The communalities of the evaluation factors were calculated via principal component analysis [39]. The ratio of the communality of each factor to the sum of the communality of all factors was subsequently calculated as the weight of each factor [40,41] (Table 2).

2.4.4. The SQI Calculation

The SQI was calculated via Formula (3) [42]:
S Q I = i = 1 n W i S i
where i and n are the evaluation factors and their numbers and Wi and Si are the evaluation factor weights and scores, respectively.

2.5. Data Collection

We conducted a survey of 55 land users (19 users in the citrus orchard system, 26 users in the double-cropping system, and 10 users in the single-cropping system) at the sampling point. The nitrogen fertilizer applied was ammonium nitrogen fertilizer. Fertilization time was in early March, late May, and mid-November for the citrus orchard system, in early June and mid-October for the double-cropping system, and in early June for the single-cropping system. The amount of nitrogen fertilizer applied to each mainstream planting system was the average value of fertilizing amount provided by the land users for each planting system. The fertilizing amount survey and soil sample collection were conducted simultaneously for each planting system each year.

2.6. Soil Erosion Determination

The cumulative soil erosion data were obtained through three experimental runoff plots in the study watershed (31°4′ N, 110°41′ E, 224 m). Three experimental treatments were designed: citrus, double-cropping with a wheat (winter–spring) and peanut (summer–autumn) rotation, and single-cropping with peanut (summer–autumn). Each plot was designed with a 9 m × 5 m area and a slope of 25°. The bottom of each plot was connected to a runoff pool, which was designed with a 1 m × 1 m area and used to collect runoff water and sediment. The agricultural management methods such as fertilization, cultivation, and harvesting used for all the runoff plots were consistent with those in the study watershed.
The sediment samples were collected from April–November (rainy season) from 2004–2019, except in 2009. First, the water depth of the runoff pools was measured at the end of each rainfall event. Second, the water and sediment were mixed thoroughly for homogeneity, and the mixed samples were collected from the runoff pools in a 1 L bottle. Finally, the mixed samples were filtered through intermediate-speed quantitative filter paper, and the sediment on the filter paper was dried at 105 °C and weighed.
The amount of soil erosion (Ej, kg/ha) generated by each runoff event was calculated using Formula (4):
E j = ( S j × a × b × d j ) / ( A × B ) × 10 7
where j refers to the three experimental treatments (citrus, double-cropping with a wheat and peanut rotation, and single-cropping with peanut); Sj is the sediment weight of the mixed samples of each runoff pool after each runoff event (kg/L). a and A are the lengths of each runoff pool and each runoff plot, respectively (m); b and B are the widths of each runoff pool and each runoff plot, respectively (m); and dj is the water depth of each runoff pool after each runoff event (m).
The cumulative soil erosion amount (Etotal, kg/ha) of study years was calculated via Formula (5):
E t o t a l = 1 z ( E j 1 + E j 2 + + E j m 1 + E j m )
where m is the number of rainfall runoff events each year, and z refers to the number of study years.

2.7. K Factor of Soil Erodibility

Soil erodibility is closely related to soil properties and reflects the sensitivity of the soil to erosion [43]. Thus, the erosion–productivity impact calculator model [44] (Formula (6)) was used to calculate the K factor of soil erodibility, which has been shown to be the closest to the standard value in the distribution area of purple soil in the TGRA [45].
K = 0.2 + 0.3 e x p 0.0256 m s a n d ( 1 m s i l t / 100 ) × m s i l t / ( m c l a y + m s i l t ) 0.3 × 1 0.25 o r g C / o r g C + e x p ( 3.72 2.95 o r g C ) × 1 0.7 S N 1 / S N 1 + e x p ( 5.51 + 22.9 S N 1 ) × 0.1317
where msand, msilt, mclay, and orgC are the soil sand, silt, clay, and organic carbon contents, respectively, and SN1 = 1 − msand/100.

2.8. Statistical Analysis

The relationships between the SQI and the soil evaluation factors were examined via Pearson correlation analysis. The influence of soil erosion and fertilization on soil quality was studied via the partial least squares path model (PLS–PM). Models were evaluated using the goodness of fit (GoF) statistics [46]. The higher the index, the better. Acceptable good values within the PLS-PM community are GoF > 0.7. All the statistical analyses were performed via the statistical software package SPSS (version 23, SPSS, Inc., Chicago, IL, USA).

3. Results and Discussion

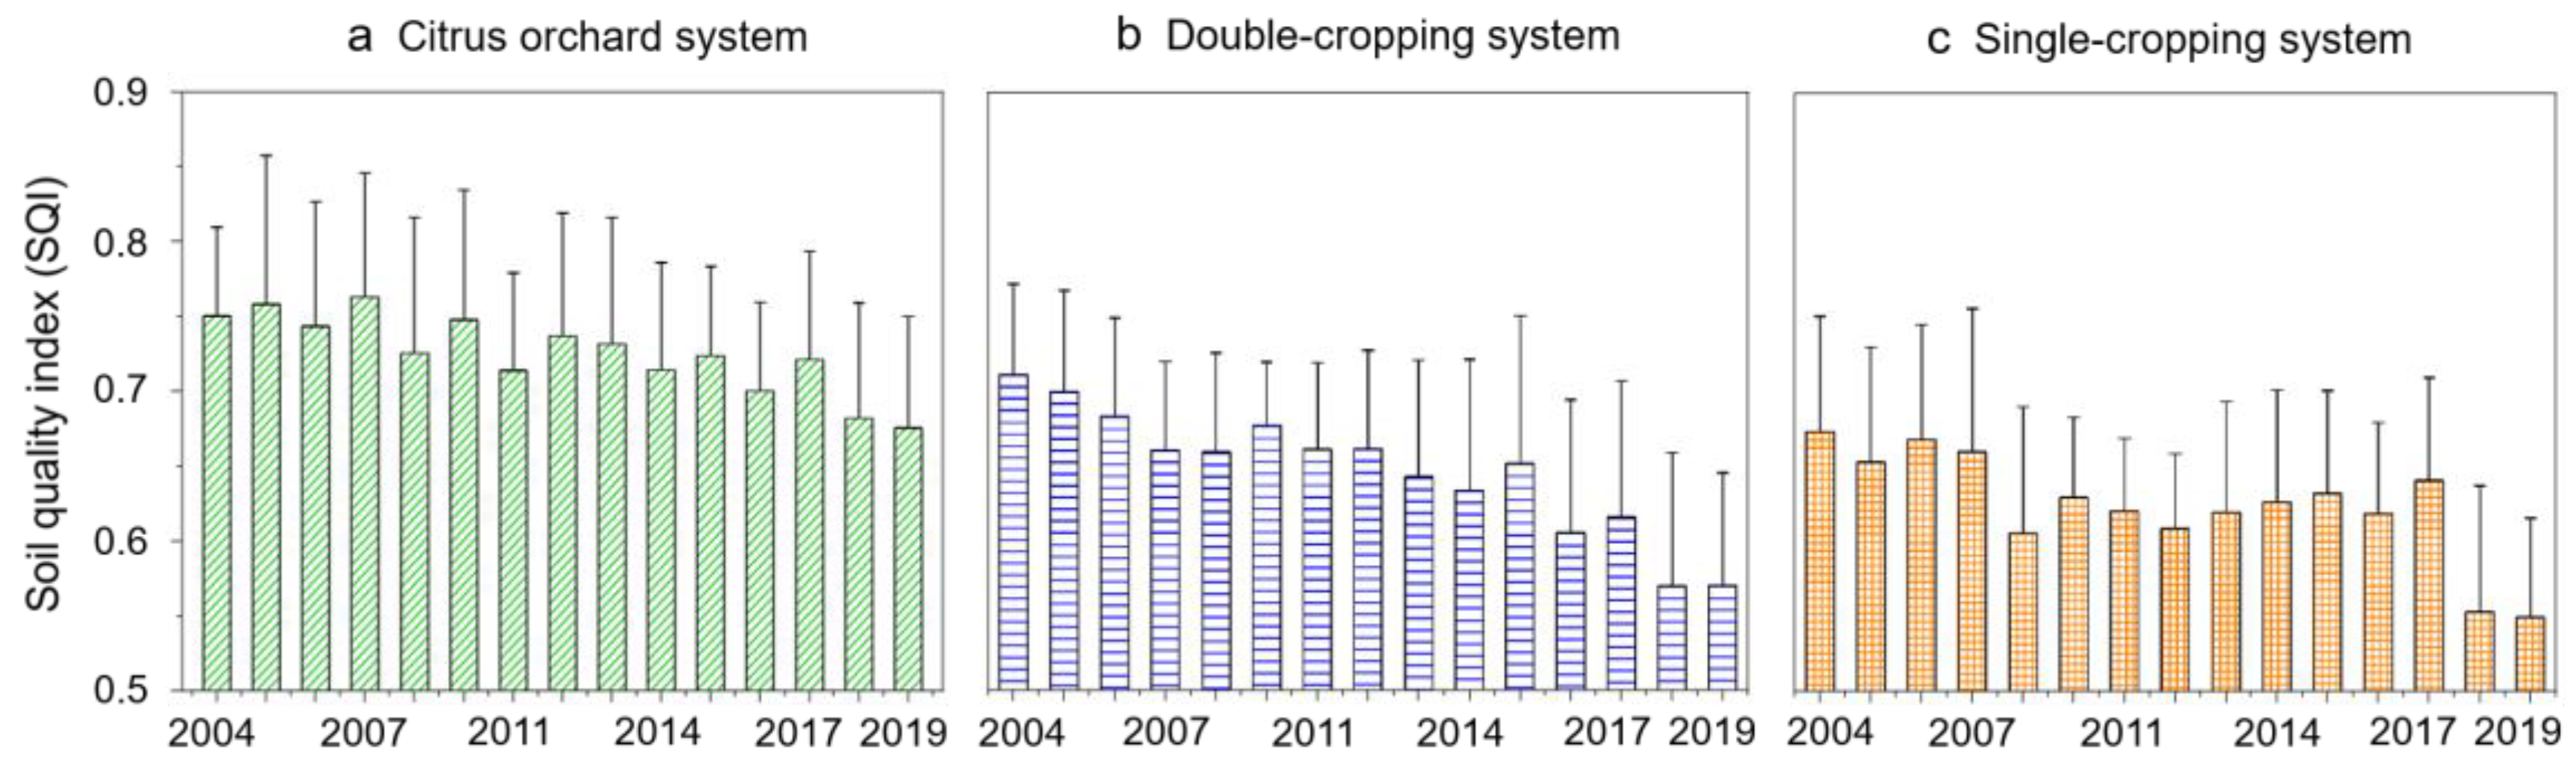
3.1. Variations in Soil Quality

Soil quality on sloping farmland was evaluated via the SQI based on the variations in 14 soil physicochemical properties of the most important components of soil quality in the low-altitude citrus orchard system, the mid-altitude double-cropping system and the high-altitude single-cropping system (Figure 2 and Figure 3). The SQI in the three planting systems decreased gradually over time during the study period (Figure 4). The SQI decreased by 0.07 for the low-altitude citrus orchard system, 0.14 for the mid-altitude double-cropping system, and 0.12 for the high-altitude single-cropping system from 2004 to 2019.
On the one hand, the results are consistent with the variation trends in the soil clay content, silt content, and the K factor of soil erodibility and opposite those of the cumulative soil erosion volume in the three planting systems over time (Figure 2c and Figure 5a,b). These findings demonstrate that soil erosion is an important factor influencing the soil quality in the three planting systems. The soil erosion decreased the soil clay content, silt content, and nutrient content, and increased the cumulative soil erosion volume in the three planting systems. Previous studies have shown that the soil clay content and silt content are more easily transported from high-altitude areas to low-altitude areas by soil erosion [47], and the sorting effect of the sediment transport process increases the spatial variations in soil quality [48]. Serious soil erosion not only destroys the soil structure and triggers the loss of fine soil particles and nutrients [49,50] but also increases the soil BD [51] and soil strength [52]. The loss of clay particles in the citrus orchard was the greatest due to high surface exposure and strong soil erosion. This finding was confirmed by the soil erosion in the watershed that we observed (Figure 5); the cumulative soil erosion in the citrus orchard was the greatest, followed by that in the double-cropping system and that in the single-cropping system during the study period. Over time, the cumulative soil erosion in the three mainstream planting systems increased, while the K factor of soil erodibility gradually decreased (Figure 5b). This is mainly due to the continuous loss of organic matter, clay particles, and sand particles in the soil, resulting in an increase in soil BD and soil strength. As a result, the soil’s resistance to erosion is enhanced, leading to a decrease in soil erodibility, i.e., a decrease in the K factor. A previous study in a small agricultural watershed of the TGRA corroborates these results [53], which found the soil K factor showed a negative correlation with the sand content but was positively related to the silt and clay contents. These results demonstrate that the amount and intensity of soil erosion gradually decreased over time in the study watershed, but the amount of erosion was still very large.
On the other hand, the SQI is inversely correlated with the amount of nitrogen fertilizer applied (Figure 5c), which demonstrates that the application of nitrogen fertilizer is also an important factor influencing the soil quality of the three mainstream planting systems. Reasonable application of nitrogen fertilizer can improve soil quality, but excessive application of nitrogen fertilizer can lead to soil acidification, changes in soil structure, and reduced soil fertility [8,11,54]. The application of nitrogen fertilizer in citrus orchard system has been increasing year by year (Figure 5c), with the average application rate of nitrogen fertilizer in 2019 being 2.59 times higher than the upper international safety limit for nitrogen fertilizer application (225 kg/ha). During the study period, the soil pH decreased by 1.28 and soil BD increased 0.21 g/cm3 in the citrus orchard systems (Figure 2a and Figure 3c). A previous study also reported that excessive nitrogen fertilization led to a decrease in soil pH and an increase in soil BD [3].
Therefore, the deterioration of the soil physicochemical properties caused by the soil erosion and the excessive application of nitrogen fertilizer led to soil degradation and the SQI decrease in the three planting systems. In the citrus orchard system, the soil SP, silt, clay, SOM, CEC, pH, TN, TP, and TK decreased by 7.91%, 9.85%, 3.89%, 2.79 g/kg, 2.72 cmol/kg, 1.28, 0.23 g/kg, 0.20 g/kg, and 2.09 g/kg, while the soil BD, sand, AN, AP, and AK increased by 0.21 g/cm3, 13.74%, 22.85 mg/kg, 16.22 mg/kg, and 71.52 mg/kg; in the double-cropping system, the soil SP, silt, clay, SOM, CEC, pH, TN, TP, TK, and AN decreased by 8.06%, 6.92%, 3.49%, 4.34 g/kg, 2.18 cmol/kg, 0.41, 0.27 g/kg, 0.15 g/kg, 1.49 g/kg, and 36.8 mg/kg, while the soil BD, sand, AP, and AK increased by 0.22 g/cm3, 10.41%, 7.67 mg/kg, and 44.66 mg/kg; in the single-cropping system, the soil SP, silt, clay, CEC, pH, TN, TP, TK, and AN decreased by 4.30%, 7.09%, 3.23%, 0.14 cmol/kg, 0.42, 0.20 g/kg, 0.17 g/kg, 2.05 g/kg, and 17.98 mg/kg, while the soil BD, sand, SOM, AP, and AK increased by 0.11 g/cm3, 10.32%, 0.23 g/kg, 12.07 mg/kg, and 28.16 mg/kg (Figure 2 and Figure 3). Thus, the difference in the degree of soil degradation and the SQI decline was due to the differences in soil physicochemical properties caused by the soil erosion and fertilizer application rate among the three planting systems during the study period.
The results revealed that the soil quality in the three planting systems decreased gradually; the soil quality of the mid-altitude double-cropping system decreased the most, followed by that of the high-altitude single-cropping system and the low-altitude citrus orchard system; and the soil erosion and the fertilizer application rate were important factors influencing the soil quality in the three planting systems.

3.2. Master Control Factors of Soil Quality Variation

We calculated the correlation coefficients between the interannual variations in each factor from the 14 physicochemical factors influencing the soil quality and the interannual variations in the SQI in the study watershed. We chose the pH, TN, TP, BD, clay content, and sand content as the master control factors influencing the soil quality in the three planting systems according to the magnitude of their correlation coefficients. The order of the six master control factors influencing soil quality was as follows: (1) sand content > BD > TN > clay content > pH > TP in the low-altitude citrus orchard system, (2) sand content > BD> clay content > pH > TP > TN in the mid-altitude double-cropping system; and (3) sand content > clay content > TP > pH > BD > TN in the high-altitude single-cropping system (Figure 6). These results can be explained by (1) the variations in the six factors and their weights having a greater combined impact on soil quality than the other factors do (Figure 2 and Figure 3, Table 2); (2) the severe soil erosion (Figure 5a) greatly decreasing the content of clay and salt-based cations; (3) the loss of clay removing the particulate phosphorus and nitrogen adsorbed by clay [55]; (4) the loss of salt-based cations caused decreasing the soil pH, and a lower pH also decreasing the soil fertility and destructing the soil structure [56,57]; and (5) the difference of order in the controlling factors among three planting systems caused by the degree of soil erosion and amount of nitrogen fertilizer applied among the three planting systems (Figure 5a,c).
The results demonstrate that the sand content, clay content, BD, TN, pH, and TP among the 14 physicochemical factors act as the master control factors in soil quality variations and that soil erosion and fertilization are important extrinsic and intrinsic factors influencing the variations in the soil quality of the low-altitude citrus orchard system, the mid-altitude double-cropping system and the high-altitude single-cropping system, respectively.

3.3. Mechanisms by Which Soil Erosion and Fertilization Influence Soil Quality

Section 3.1 and Section 3.2 demonstrated that soil erosion and fertilization are important extrinsic and intrinsic factors influencing the soil quality of the three mainstream planting systems, respectively, and that the pH, TN, TP, BD, clay content, and sand content are the six master control factors influencing soil quality variations in the three mainstream planting systems. On the basis of these findings, we studied how soil erosion and fertilization influenced soil quality through the six master control factors of the soil quality of three mainstream planting systems via PLS–PM (Figure 7).
In the low-altitude citrus orchard system, the total effects of soil erosion and fertilization on soil quality were −0.496 and −0.308, respectively (Figure 7a). Soil erosion influences soil quality primarily through the clay content, sand content, and BD (soil physical properties; effects = −0.570) and secondarily through the pH, TN, and TP (soil chemical properties; effects = 0.074). Fertilization influenced soil quality primarily through the pH, TN, and TP (soil chemical properties; effects = −0.364) and secondarily through the clay content, sand content, and BD (soil physical properties; effects = 0.056) (Figure 7a). These results occurred because the combined effects of soil erosion and fertilization in the low-altitude citrus orchard system (Figure 5a,c) decreased the clay content (3.89%), TN (0.23 g/kg), TP (0.20 g/kg), and pH (1.28) and increased the sand content (13.74%) and BD (0.21 g/cm3) during the study period (Figure 2a,c and Figure 3c–e). The results demonstrate that both soil erosion and fertilization decrease soil quality, soil erosion influences soil quality more than does fertilization, and fertilizer application exceeds the criteria for maintaining or improving soil quality in the low-altitude citrus orchard system.
In the mid-altitude double-cropping system, the total effects of soil erosion and fertilization on soil quality were −1.254 and 0.371, respectively (Figure 7b). Soil erosion influences soil quality primarily through the clay content, sand content, and BD (soil physical properties; effects = −0.832) and secondarily through the pH, TN, and TP (soil chemical properties; effects = −0.422). Fertilization influenced soil quality mainly through the clay content, sand content, and BD (soil physical properties; effects = 0.345) and secondarily through the pH, TN, and TP (soil chemical properties; effects = 0.026) (Figure 7b). The results are mainly due to the combined effects of soil erosion and fertilization in the mid-altitude double-cropping system (Figure 5a,c) decreasing the clay content (3.49%), TN (0.27 g/kg), TP (0.15 g/kg), and pH (0.41) and increasing the sand content (10.41%) and BD (0.214 g/cm3) during the study period (Figure 2a,c and Figure 3c–e). The results demonstrate that soil erosion decreases soil quality, while fertilization improves soil quality, and soil erosion influences soil quality more than does fertilization in the mid-altitude double-cropping system.
In the high-altitude single-cropping system, the total effects of soil erosion and fertilization on soil quality were −0.844 and 0.013, respectively (Figure 7c). Soil erosion influences soil quality primarily through the clay content, sand content, and BD (soil physical properties; effects = −0.556) and secondarily through the pH, TN, and TP (soil chemical properties; effects = −0.288). Fertilization influenced soil quality mainly through the clay content, sand content, and BD (soil physical properties; effects = 0.093) and secondarily through the pH, TN, and TP (soil chemical properties; effects = −0.080). The results occurred because the combined effects of soil erosion and fertilization in the high-altitude single-cropping system (Figure 5a,c) decreased the clay content (3.23%), TN (0.20 g/kg), TP (0.17 g/kg), and pH (0.42) and increased the sand content (10.32%) and BD (0.114 g/cm3) during the study period (Figure 2a,c and Figure 3c–e). The results demonstrate that soil erosion decreases soil quality, whereas fertilization slightly improves soil quality, and soil erosion influences soil quality far more than does fertilization in the high-altitude single-cropping system.
The above results of the three mainstream planting systems demonstrate that the extent to which soil erosion and fertilization influence soil quality differs among the three mainstream planting systems and that soil erosion influences soil quality more than does fertilization in the three mainstream planting systems. A previous study in an agricultural watershed of Northeast China also concluded that soil erosion significantly changed soil physicochemical properties, ultimately leading to soil degradation [58].

4. Conclusions

Based on the soil sampling at fixed points for 15 consecutive years in sloping farmland using three mainstream planting systems in a typical agricultural watershed of the TGRA of China, our findings demonstrate that (1) the influence of different planting systems on the variation in sloping farmland soil quality is different; (2) soil erosion and unseasonable fertilization are the first and second factors influencing the variation in sloping farmland soil quality in different planting systems; and (3) the effects of soil erosion and unseasonable fertilization on sloping farmland soil quality varies among different planting systems. Our findings imply that different strategies should be adopted for different planting systems to control soil erosion and fertilization in order to prevent soil quality degradation of sloping farmland. Future studies should focus on exploring how to take effective measures to control soil erosion in the three mainstream planting systems of sloping farmland, and how to apply fertilizers reasonably in orchards while ensuring yield.

Author Contributions

H.L.: Conceptualization, Methodology, Investigation, Writing—Original Draft, Writing—Review and Editing. J.T.: Conceptualization, Methodology, Writing—Review and Editing. N.Z.: Data curation, Writing—Review and Editing. J.W.: Software, Writing—Review and Editing. J.Q.: Writing—Review and Editing. All authors have read and agreed to the published version of the manuscript.

Funding

This work was supported by the China Postdoctoral Science Foundation (2022M723237), the Jiangsu Funding Program for Excellent Postdoctoral Talent (2022ZB458), and the Special Project of Three Gorges Watershed Environmental Monitoring, Ministry of Water Resources, China.

Data Availability Statement

Data will be made available on request.

Conflicts of Interest

The authors declare no conflicts of interest.

References

  1. d’Amour, C.B.; Reitsma, F.; Baiocchi, G.; Barthel, S.; Guneralp, B.; Erb, K.-H.; Haberl, H.; Creutzig, F.; Seto, K.C. Future urban land expansion and implications for global croplands. Proc. Natl. Acad. Sci. USA 2017, 114, 8939–8944. [Google Scholar] [CrossRef] [PubMed]
  2. Gou, M.M.; Li, L.; Ouyang, S.; Shu, C.; Xiao, W.F.; Wang, N.; Hu, J.W.; Liu, C.F. Integrating ecosystem service trade-offs and rocky desertification into ecological security pattern construction in the Daning river basin of southwest China. Ecol. Indic. 2022, 138, 108845. [Google Scholar] [CrossRef]
  3. Guo, J.H.; Liu, X.J.; Zhang, Y.; Shen, J.L.; Han, W.X.; Zhang, W.F.; Christie, P.; Goulding, K.W.T.; Vitousek, P.M.; Zhang, F.S. Significant acidification in major Chinese croplands. Science 2010, 327, 1008–1010. [Google Scholar] [CrossRef]
  4. Do, V.H.; La, N.; Bergkvist, G.; Dahlin, A.S.; Mulia, R.; Nguyen, V.T.; Őborn, I. Agroforestry with contour planting of grass contributes to terrace formation and conservation of soil and nutrients on sloping land. Agric. Ecosyst. Environ. 2023, 345, 108323. [Google Scholar] [CrossRef]
  5. Han, Z.; Li, J.W.; Li, Y.H.; Gu, X.J.; Chen, X.Y.; Wei, C.F. Assessment of the size selectivity of eroded sediment in a partially saturated sandy loam soil using scouring experiments. CATENA 2021, 201, 105234. [Google Scholar] [CrossRef]
  6. Lenka, N.K.; Dass, A.; Sudhishri, S.; Patnaik, U.S. Soil carbon sequestration and erosion control potential of hedgerows and grass filter strips in sloping agricultural lands of eastern India. Agric. Ecosyst. Environ. 2012, 158, 31–40. [Google Scholar] [CrossRef]
  7. Gitari, H.I.; Gachene, C.K.K.; Karanja, N.N.; Kamau, S.; Nyawade, S.; Schulte-Geldermann, E. Potato-legume intercropping on a sloping terrain and its effects on soil physico-chemical properties. Plant Soil 2019, 438, 447–460. [Google Scholar] [CrossRef]
  8. Zhang, Y.J.; Ye, C.; Su, Y.W.; Peng, W.C.; Lu, R.; Liu, Y.X.; Huang, H.C.; He, X.H.; Yang, M.; Zhu, S.S. Soil Acidification caused by excessive application of nitrogen fertilizer aggravates soil-borne diseases: Evidence from literature review and field trials. Agric. Ecosyst. Environ. 2022, 340, 108176. [Google Scholar] [CrossRef]
  9. Guo, L.Y.; Wu, G.L.; Li, Y.; Li, C.H.; Liu, W.J.; Meng, J.; Liu, H.T.; Yu, X.F.; Jiang, G.M. Effects of cattle manure compost combined with chemical fertilizer on topsoil organic matter, bulk density and earthworm activity in a wheat–maize rotation system in Eastern China. Soil Tillage Res. 2016, 156, 140–147. [Google Scholar] [CrossRef]
  10. Guo, Z.; Li, W.; UL Islam, M.; Wang, Y.; Zhang, Z.; Peng, X. Nitrogen fertilization degrades soil aggregation by increasing ammonium ions and decreasing biological binding agents on a Vertisol after 12 years. Pedosphere 2022, 32, 629–636. [Google Scholar] [CrossRef]
  11. Wang, X.J.; Tian, L.; Wang, T.L.; Zhang, E.H. Replacing nitrogen in mineral fertilizers with nitrogen in maize straw increases soil water-holding capacity. Sci. Rep. 2024, 14, 9337. [Google Scholar] [CrossRef] [PubMed]
  12. MWR. China Soil and Water Conservation Bulletin in 2021; Ministry of Water Resources of PRC: Beijing, China, 2022. [Google Scholar]
  13. NBS. China Statistical Yearbook in 2022; China Statistics Press: Beijing, China, 2022. [Google Scholar]
  14. Liang, X.Y.; Jin, X.B.; Yang, X.H.; Xu, W.Y.; Lin, J.H.; Zhou, Y.K. Exploring cultivated land evolution in mountainous areas of Southwest China, an empirical study of developments since the 1980s. Land Degrad. Dev. 2021, 32, 546–558. [Google Scholar] [CrossRef]
  15. Strauss, V.; Paul, C.; Cenk, D.; Löbmann, M.; Helming, K. Sustainable soil management measures: A synthesis of stakeholder recommendations. Agron. Sustain. Dev. 2023, 43, 17. [Google Scholar] [CrossRef]
  16. Wang, Y.Q.; Zhang, X.C.; Huang, C.Q. Spatial variability of soil total nitrogen and soil total phosphorus under different land uses in a small watershed on the loess plateau, China. Geoderma 2009, 150, 141–149. [Google Scholar] [CrossRef]
  17. Li, X.; Wang, D.; Ren, Y.; Wang, Z.; Zhou, Y. Soil quality assessment of croplands in the black soil zone of Jilin Province, China: Establishing a minimum data set model. Ecol. Indic. 2019, 107, 105251. [Google Scholar] [CrossRef]
  18. Faloye, O.T.; Ajayi, A.E.; Kamchoom, V.; Akintola, O.A.; Oguntunde, P.G. Evaluating impacts of biochar and inorganic fertilizer applications on soil quality and maize yield using principal component analysis. Agronomy 2024, 14, 1761. [Google Scholar] [CrossRef]
  19. Marion, L.F.; Schneider, R.; Cherubin, M.R.; Colares, G.S.; Wiesel, P.G.; da Costa, A.B.; Lobo, E.A. Development of a soil quality index to evaluate agricultural cropping systems in southern Brazil. Soil Tillage Res. 2022, 218, 105293. [Google Scholar] [CrossRef]
  20. Sharma, K.L.; Mandal, U.K.; Srinivas, K.; Vittal, K.P.R.; Mandal, B.; Grace, J.K.; Ramesh, V. Long-term soil management effects on crop yields and soil quality in a dryland Alfisol. Soil Tillage Res. 2005, 83, 246–259. [Google Scholar] [CrossRef]
  21. Bravo-Medina, C.; Goyes-Vera, F.; Arteaga-Crespo, Y.; Garcia-Quintana, Y.; Changoluisa, D. A soil quality index for seven productive landscapes in the Andean-Amazonian foothills of Ecuador. Land Degrad. Dev. 2021, 32, 2226–2241. [Google Scholar] [CrossRef]
  22. Paramesh, V.; Singh, S.K.; Mohekar, D.S.; Arunachalam, V.; Misra, S.D.; Jat, S.L.; Kumar, P.; Nath, A.J.; Kumar, N.; Mahajan, G.R. Impact of sustainable land-use management practices on soil carbon storage and soil quality in Goa State, India. Land Degrad. Dev. 2022, 33, 28–40. [Google Scholar] [CrossRef]
  23. Jiang, Y.Y.; Sun, Z.X.; Liu, S.; Wang, J.Q. Construction and Application of the Phaeozem Health Evaluation System in Liaoning Province, China. Agronomy 2024, 14, 1754. [Google Scholar] [CrossRef]
  24. Wan, P.X.; Zhou, Z.K.; Yuan, Z.Q.; Wei, H.H.; Huang, F.Q.; Li, Z.S.; Li, F.M.; Zhang, F. Fungal community composition changes and reduced bacterial diversity drive improvements in the soil quality index during arable land restoration. Environ. Res. 2024, 244, 117931. [Google Scholar] [CrossRef] [PubMed]
  25. MEE. Bulletin on Ecological and Environmental Monitoring of the Three Gorges Project of the Yangtze River in 2018; Ministry of Ecology and Environment of PRC: Beijing, China, 2018.
  26. Zhang, J.X.; Liu, Z.J.; Sun, X.X. Changing landscape in the Three Gorges Reservoir Area of Yangtze River from 1977 to 2005: Land use/land cover, vegetation cover changes estimated using multi-source satellite data. Int. J. Appl. Earth Obs. Geoinf. 2009, 11, 403–412. [Google Scholar] [CrossRef]
  27. Xu, X.B.; Tan, Y.; Yang, G.S. Environmental impact assessments of the Three Gorges Project in China: Issues and interventions. Earth-Sci. Rev. 2013, 124, 115–125. [Google Scholar] [CrossRef]
  28. Sang, C.; Tan, L.; Cai, Q.H.; Ye, L. Long-term (2003–2021) evolution trend of water quality in the Three Gorges Reservoir: An evaluation based on an enhanced water quality index. Sci. Total Environ. 2024, 915, 169819. [Google Scholar] [CrossRef]
  29. Grossman, R.B.; Reinsch, T.G. Bulk density and linear extensibility. In Methods of Soil Analysis, Part 4: Physical Methods; Dane, J.H., Topp, G.C., Eds.; Soil Science Society of America: Madison, WI, USA, 2002; pp. 201–228. [Google Scholar]
  30. Li, W.; Wang, Q.J.; Wei, S.P.; Shao, M.A.; Yi, L. Soil desiccation for Loess soils on natural and regrown areas. For. Ecol. Manag. 2008, 255, 2467–2477. [Google Scholar] [CrossRef]
  31. Bao, S.D. Soil Agricultural Chemical Elements Analysis; China Agriculture Press: Beijing, China, 2000. [Google Scholar]
  32. Liu, Y.P.; Tong, J.; Li, X.N. Analysing the silt particles with the Malvern Mastersizer 2000. Water Conserv. Sci. Technol. Econ. 2005, 11, 329–331. [Google Scholar]
  33. Marzaioli, R.; D’Ascoli, R.; De Pascale, R.A.; Rutigliano, F.A. Soil quality in a Mediterranean area of Southern Italy as related to different land use types. Appl. Soil Ecol. 2010, 44, 205–212. [Google Scholar] [CrossRef]
  34. Pansu, M.; Gautheyrou, J. Handbook of Soil Analysis—Mineralogical, Organic and Inorganic Methods; Springer: Heidelberg, Germany, 2006. [Google Scholar]
  35. Bremner, J.M.; Tabatabai, M.A. Use of an ammonia electrode for determination of ammonium in Kjeldahl analysis of soils. Commun. Soil Sci. Plant Anal. 1972, 3, 159–165. [Google Scholar] [CrossRef]
  36. Murphy, J.; Riley, J.P. A modified single solution method for determination of phosphate in natural waters. Anal. Chim. Acta 1962, 27, 31–36. [Google Scholar] [CrossRef]
  37. Hanway, J.J.; Heidel, H. Soil analysis methods as used in Iowa State College Soil Testing Laboratory. Iowa State Coll. Agric. Bull. 1952, 57, 1–31. [Google Scholar]
  38. Wang, J.G.; Yang, L.Z.; Shan, Y.H. Application of fuzzy mathematics to soil quality evaluation. Acta Pedol. Sin. 2001, 38, 176–183. [Google Scholar] [CrossRef]
  39. Ferretti, G.; Rosinger, C.; Diaz-Pines, E.; Faccini, B.; Coltorti, M.; Keiblinger, K.M. Soil quality increases with long-term chabazite-zeolite tuff amendments in arable and perennial cropping systems. J. Environ. Manag. 2024, 354, 120303. [Google Scholar] [CrossRef] [PubMed]
  40. Johnson, R.A.; Wichern, D.W. Applied Multivariate Statistical Analysis, 6th ed.; Pearson Prentice Hall: London, UK, 2007. [Google Scholar]
  41. Zhang, G.L.; Bai, J.H.; Xi, M.; Zhao, Q.Q.; Lu, Q.Q.; Jia, J. Soil quality assessment of coastal wetlands in the Yellow River Delta of China based on the minimum data set. Ecol. Indic. 2016, 66, 458–466. [Google Scholar] [CrossRef]
  42. Andrews, S.S.; Karlen, D.L.; Mitchell, J.P. A comparison of soil quality indexing methods for vegetable production systems in Northern California. Agric. Ecosyst. Environ. 2002, 90, 25–45. [Google Scholar] [CrossRef]
  43. Han, Y.; Zhao, W.; Ding, W.J.; Santos Ferreira, C.S. Soil erodibility for water and wind erosion and its relationship to vegetation and soil properties in China’s drylands. Sci. Total Environ. 2023, 903, 166639. [Google Scholar] [CrossRef]
  44. Williams, J.R.; Sharpley, A.N. EPIC-Erosion/productivity Impact Calculator: 1. Model Documentation; Technical Bulletin No. 1768; USDA Agricultural Research Service: Washington, DC, USA, 1989.
  45. Shi, D.M.; Chen, Z.F.; Jiang, G.Y.; Jiang, D. Comparative study on estimation methods for soil erodibility K in purple hilly area. J. Beijing For. Univ. 2012, 34, 32–38. [Google Scholar] [CrossRef]
  46. Sanchez, G. PLS Path Modeling with R; Trowchez Editions: Berkeley, CA, USA, 2013. [Google Scholar]
  47. Laceby, J.; Evrard, O.; Smith, H.; Blake, W.; Olley, J.; Minella, J.; Owens, P. The challenges and opportunities of addressing particle size effects in sediment source fingerprinting: A review. Earth-Sci. Rev. 2017, 169, 85–103. [Google Scholar] [CrossRef]
  48. Geng, R.; Zhang, G.H.; Hong, D.L.; Ma, Q.H.; Jin, Q.; Shi, Y.Z. Response of soil detachment capacity to landscape positions in hilly and gully regions of the Loess Plateau. CATENA 2021, 196, 104852. [Google Scholar] [CrossRef]
  49. Wang, C.S.; Zhang, G.H.; Zhu, P.Z.; Chen, S.Q.; Wan, Y.Q. Spatial variation of soil functions affected by land use type and slope position in agricultural small watershed. CATENA 2023, 225, 107029. [Google Scholar] [CrossRef]
  50. Zhu, J.X.; Dai, Q.; Xiao, Y.Y.; Liu, C.A.; Zhang, J.; Zhuo, L.; Han, D.W. Microphysics-based rainfall energy estimation using remote sensing and reanalysis data. J. Hydrol. 2023, 627, 130314. [Google Scholar] [CrossRef]
  51. Moore, I.D. Effect of surface sealing on infiltration. Trans. ASAE 1981, 24, 1546–1553. [Google Scholar] [CrossRef]
  52. Bradford, J.; Truman, C.; Huang, C. Comparison of three measures of resistance of soil surface seals to raindrop splash. Soil Technol. 1992, 5, 47–56. [Google Scholar] [CrossRef]
  53. Huang, X.F.; Lin, L.R.; Ding, S.W.; Tian, Z.C.; Zhu, X.Y.; Wu, K.; Zhao, Y.Z. Characteristics of soil erodibility k value and its influencing factors in the Changyan Watershed, southwest Hubei, China. Land 2022, 11, 134. [Google Scholar] [CrossRef]
  54. Yu, C.Q.; Huang, X.; Chen, H.; Godfray, H.C.J.; Wright, J.S.; Hall, J.W.; Gong, P.; Ni, S.; Qiao, S.; Huang, G.; et al. Managing nitrogen to restore water quality in China. Nature 2019, 567, 516–520. [Google Scholar] [CrossRef] [PubMed]
  55. Li, Y.; Are, K.S.; Huang, Z.; Guo, H.; Wei, L.; Abegunrin, T.P.; Gu, M.H.; Qin, Z. Particulate N and P exports from sugarcane growing watershed are more influenced by surface runoff than fertilization. Agric. Ecosyst. Environ. 2020, 302, 107087. [Google Scholar] [CrossRef]
  56. Juo, A.S.R.; Dabiri, A.; Franzluebbers, K. Acidification of a kaolinitic Alfisol under continuous cropping with nitrogen fertilization in West Africa. Plant Soil 1995, 171, 245. [Google Scholar] [CrossRef]
  57. Dong, L.; Li, J.; Zhang, Y.; Bing, M.; Liu, Y.; Wu, J.; Hai, X.; Li, A.; Wang, K.; Wu, P.; et al. Effects of vegetation restoration types on soil nutrients and soil erodibility regulated by slope positions on the Loess Plateau. J. Environ. Manag. 2022, 302, 113985. [Google Scholar] [CrossRef]
  58. Zhang, J.; Zheng, F.; Li, Z.; Feng, Z. A novel optimal data set approach for erosion-impacted soil quality assessments—A case-study of an agricultural catchment in the Chernozem region of Northeast China. Land Degrad. Dev. 2022, 33, 1062–1075. [Google Scholar] [CrossRef]
Figure 1. Location of the study watershed and distribution of soil sampling sites.
Agronomy 14 02146 g001
Figure 2. Variations in soil physical properties in the study watershed from 2004 to 2019. (a) Soil bulk density; (b) Soil porosity; (c) Soil texture.
Agronomy 14 02146 g002
Figure 3. Variations in soil chemical properties in the study watershed from 2004 to 2019. (a) Soil organic matter; (b) Cation exchange capacity; (c) Soil pH; (d) Total nitrogen; (e) Total phosphorus; (f) Total potassium; (g) Available nitrogen; (h) Available phosphorus; (i) Available potassium.
Agronomy 14 02146 g003
Figure 4. Variations in the soil quality index of citrus orchard system (a), double-cropping system (b) and single-cropping system (c) in the study watershed from 2004 to 2019.
Agronomy 14 02146 g004
Figure 5. Variations in the cumulative soil erosion (a), the K factor (b), and the amount of nitrogen fertilizer applied (c) in the study watershed from 2004 to 2019.
Agronomy 14 02146 g005
Figure 6. Influence of the master control factors of sand content (a), clay content (b), TN (c), TP (d), bulk density (e) and pH (f) on the SQI on sloping farmland using three mainstream planting systems. The variations in the six factors and the SQI refers to the interannual variations in each factor and the interannual variations in the SQI (n = 14). Green, blue and orange lines indicate the trends in the correlations between the ΔSQI and the Δmaster control factors at low, intermediate and high altitudes, respectively.
Agronomy 14 02146 g006
Figure 7. Mechanisms involving soil erosion and fertilization influence soil quality in the citrus orchard system (a), the double-cropping system (b) and the single-cropping system (c). The number on the arrow represents the standardized path coefficient. The width of the arrow indicates the strength of the direct effect; the wider the arrow is, the greater the strength. The solid line indicates a positive effect, and the dashed line indicates a negative effect. Models were assessed via goodness of fit (GoF) statistics. The GoFs of (ac) were 0.832, 0.861, and 0.778, respectively.
Agronomy 14 02146 g007
Table 1. Methods for determining soil properties.
Soil PropertiesUnitsMethodsReference
PhysicalSoil particle size
(sand, silt and clay)
%Laser diffraction method[32]
ChemicalHydrogen ion concentration (pH) (in water)-Potentiometric method[33]
Cation exchange capacity (CEC)cmol kg−1Ammonium acetate method[34]
Soil organic matter (SOM)g kg−1Dichromate method[34]
Total nitrogen (TN)g kg−1Kjeldahl digestion procedure[35]
Total phosphorus (TP)g kg−1Sodium carbonate fusion method[36]
Total potassium (TK)g kg−1Sodium hydroxide fusion method[37]
Available phosphorus (AP)g kg−1Molybdenum antimony anticolorimetric method[31]
Available potassium (AK)g kg−1Flame photometer method[31]
Table 2. Communality and weights of the evaluation factors.
Data SetBDSPSandSiltClaypHCECSOMTNTPTKANAPAK
Communality0.9190.9120.9610.8940.9340.8760.7880.9130.7280.9120.6670.3270.9110.791
Weight0.0800.0790.0830.0780.0810.0760.0680.0790.0630.0790.0580.0280.0790.069
Disclaimer/Publisher’s Note: The statements, opinions and data contained in all publications are solely those of the individual author(s) and contributor(s) and not of MDPI and/or the editor(s). MDPI and/or the editor(s) disclaim responsibility for any injury to people or property resulting from any ideas, methods, instructions or products referred to in the content.

