Abstract
Long-term intensive tillage has led to soil environment degradation, reduced fertility, and difficulty in increasing crop yield in the Mollisol region of northeast China. In order to improve the soil’shydrothermal environment and nutrient content, we conducted field experiments to investigate the effects of different tillage practices and the amount of straw mulching on soil hydrothermal environment and nutrient content in agricultural soils in seasonal permafrost areas. Four treatments were established: no-tillage without straw (NT0), no-tillage with half straw mulching (NT1), no-tillage with full straw mulching (NT2), and rotary tillage without straw (CK) as the control treatment. The results indicate that the no-tillage with straw mulching treatments increased the soil ammonium nitrogen (NH4+-N) and nitrate nitrogen (NO3−-N) content, accompanied by improvements in the soil’s water content and regulation of soil temperature changes, as compared to the CK treatment. Specifically, the soil’s NH4+-N and NO3−-N content in the NT2 treatment were significantly increased by 25.65% and 38.81%, respectively. Our study indicates that NT2 treatment is the most suitable tillage practice and straw-returning method in the Mollisol region of northeast China. This study can provide a theoretical basis and reference for the efficient utilization of farmland soil in seasonal permafrost areas.
1. Introduction
Heilongjiang Province’s black soil area is an important grain production base in China, and the fertile soil and high organic matter content provide favorable conditions for grain production. Heilongjiang Province is located in the region of seasonal permafrost, and seasonal freezing and thawing have both advantages and disadvantages for the soil condition of farmland, including, on the one hand, the reduction of soil moisture evaporation during the freezing period and the increase of soil water content during the thawing period to alleviate the spring drought [1,2]. On the other hand, freezing and thawing cause changes in soil bulk density and aggregate structure, and phase changes in soil moisture, leading to degradation of farmland soil structure and more serious nutrient loss [3,4]. At the same time, the lack of conservation tillage measures has led to the thinning and hardening of the tillage layer, seriously restricting the utilization of black soil productivity and the enhancement of food production capacity [5].
Conservation tillage is a farming measure centered on “no-tillage and less-tillage, straw return to the field”, which is an important measure to protect black soil arable land and guarantee national food security [6]. No-tillage protects soil structure and improves water infiltration by leaving the topsoil undisturbed, and the crop residue left on the soil surface reduces soil erosion, facilitates the survival of soil microorganisms, and maintains soil ecosystem stability [7]. In addition to raising the soil’s temperature and moisture content, straw mulching can enhance soil quality and balance the loss of mineralized carbon and nitrogen in agricultural soils [8,9]. The straw mulching on the surface can inhibit soil heat loss to a degree, effectively slow down the decline rate of soil temperate during the freezing period, facilitate the straw’s conversion into light energy by absorbing sunlight, raise the temperature of the soil, prevent the formation of frozen soil, and help alleviate spring drought. It can be seen that the change in soil temperature is not only the change in soil thermal condition but also the comprehensive reflection of various physical and chemical phenomena. Seasonal frozen soil is a special type of soil; the study of its temperature change is helpful in understanding its physical characteristics and heat change, and it has positive practical significance for guiding spring crop planting. Therefore, the dual conservation tillage practices of no-tillage and straw mulching are crucial for sustainable agricultural development. More studies have been conducted by related scholars on the effects of conservation tillage practices on soil and crop yield during the growing season of crops [10,11,12,13]. However, fewer studies have been conducted on the hydrothermal and nutrient changes in agricultural permafrost in the black soil zone with no-tillage and different amounts of straw mulching. Tang Wenzheng et al. [14] found that straw mulching has a significant warming effect on seasonal permafrost soils. Wu Chundong [15] showed that 10 cm straw mulching thickness was optimal for soil water retention during the seasonal freeze–thaw period. Sun Kai [16] found that no-tillage can promote the accumulation of inorganic nitrogen in farmland soil during the freeze–thaw period better than tilling and provide good nutrient conditions for spring-sown soil. Therefore, the study of conservation tillage measures coupled with no-tillage and straw mulching is of great significance to regulating the soil’s habitat condition of farmland in seasonal freeze–thaw areas, alleviating spring drought, and guaranteeing food security in black soil areas.
In order to investigate the effects of no-tillage and straw mulching on soil water and heat conditions and nutrient content during the freezing and thawing periods, this paper, based on previous research, makes full use of the rich straw resources in Heilongjiang Province [17], and analyzes the temporal and spatial changes in soil moisture, temperature, ammonium nitrogen and nitrate nitrogen content during freezing and thawing periods under the conditions of no-tillage and different straw mulching in seasonal permafrost area using field experiments. The study proposed an application model suitable for the regulation of soil environmental health in the seasonal frozen soil area, which provided an important guarantee for grain production.
2. Materials and Methods
2.1. Study Site
The study site was located at the Water Conservancy Technology Research Station of the Heilongjiang Province Hydraulic Research Institute (126°36′ E, 45°43′ N) in Harbin City, Heilongjiang Province, northeast China. The soil in the experiment station is classified as Mollisol according to the international standard of soil texture classification; the soil texture is silty loam in the 0–60 cm layer. The proportion of silt and clay is 39.39% and 37.78%, respectively. The average dry bulk density of soil was 1.22 g·cm−3, the soil’s porosity was 47.32%, and the average field water holding capacity (mass fraction) was 29.4%. The soil’s properties in the 0–50 cm layer prior to the experiment are shown in Table 1 [18]. The station has a temperate continental monsoon climate with a mean annual air temperature of −4–5°C and an average annual precipitation of 400–660 mm, with more than 70% occurring between July and September. Annual mean evaporation and the frost-free period in the region are 796 mm and 130–140 d, respectively. The station has a reference climate station (Huayun Ground Monitoring Software, OSSMO2004v3.0.1), during this study (October 2020 to May 2021), the total solar radiation during the experimental period was 180.96 kJ/cm2, the lowest total solar radiation was in December at 20.06 kJ/cm2, January is the coldest month, with an average temperature of −18.96 °C, and the average daily minimum temperature occurred on January 7 at −24.93 °C, Changes in average daily temperature, solar radiation and the monthly precipitation during the experimental period are shown in Figure 1 and Figure 2, respectively.

Table 1.
Basic fertility of 0–50 cm soil of tested field [18].
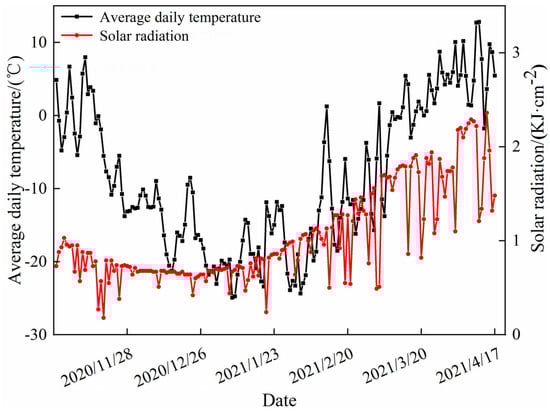
Figure 1.
Curves of average daily temperature and solar radiation.
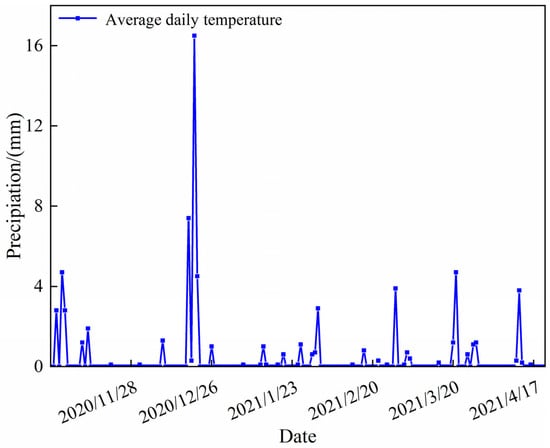
Figure 2.
Curves of the amount of precipitation.
2.2. Experimental Design
The experiment was set up with two types of tillage: no-tillage (NT) and conventional rotary tillage (CK). Under the no-tillage method, three treatments were set up: no-tillage without straw mulching (NT0), no-tillage with half straw mulching (NT1 with 3750 kg·ha−1), and no-tillage with full straw mulching (NT2 with 7500 kg·ha−1). The maize variety “Jin He 3000” was sown on 5 May 2020 and harvested on 1 October 2020. The planting density of the maize was 60,000 plants per hectare. Compound fertilizer was applied as basal fertilizer in each plot; the nitrogen (N), phosphate (P2O5), and potassium (K2O) levels were 108 kg·ha−1, 135 kg·ha−1 and 162 kg·ha−1, respectively. We employed the artificial hole sowing method for seeding and applied basal fertilizer. The basal fertilizer was placed in the hole, and topdressing was applied by spreading. The corn stalks were crushed uniformly to a length of 5–10 cm after the 2020 fall harvest and spread evenly on the surface. In the spring, the crop was seeded without any tillage. In the traditional rotary tillage treatment (CK), all the straw was removed from the field after the fall harvest, and the field was rotary tilled to a depth of 15–20 cm. The experimental plots were set up with rotary tillage (CK), no-tillage without straw mulching (NT0), no-tillage with half straw mulching (NT1) and no-tillage with full straw mulching (NT2), totaling four treatments with three replications per treatment, and a total of 12 plots. The plots were designed in a randomized block design, and each plot was of size 10 × 10 m.
2.3. Sampling and Measurement
2.3.1. Soil Temperature
In the experiment, an automatic monitoring device (PT100, Yangzhou Shangyi Instrument Co. Ltd., Yangzhou, China) was buried in each plot to record the soil temperature in the 0–50 cm layer every hour during the entire freeze–thaw period. This allowed us to assess the impact of different practices on soil temperature. Daily data were recorded to analyze the effects of different tillage practices and the amount of straw mulching on soil temperature at different times. The monitoring points are listed in Table 2.
Table 2.
Location of soil temperature and moisture content monitoring points.
The depth of the monitoring point is the distance from the surface.
2.3.2. Soil Moisture Content
The soil moisture content was measured by drying. All the plots were collected twice in the initial freezing period, five times in the stable freezing period and three times in the thawing period. Artificial electric soil auger was used for layered soil sampling, with a 10 cm interval between each layer, resulting in the retrieval of a total of 5 layers. These samples were measured wet soil weights and dried at 105 °C to a constant weight for the determination of dry soil weight. Soil moisture content (S%) was calculated using the following formula based on the wet and dry soil weights measured. The monitoring points are listed in Table 2.
where S (%) is the soil moisture content, and M1 (g) and M2 (g) are wet and dry soil weights, respectively.
2.3.3. Determination of Soil Ammonium Nitrogen
In the experiment, all the plots were collected twice in the initial freezing period, three times in the stable freezing period and twice in the thawing period. A 20 g sample of fresh soil was taken and put in a 200 mL conical flask. Then, 100 mL of KCl solution (Tianjin Guangfu Technology Development Co. Ltd., Tianjin, China) was added, and the mixture was oscillated for an hour. Afterward, it was left to stand, and 2~10 mL of surface clear liquid was taken from it and added to a 50 mL volumetric flask. KCl solution was added to replenish up to 10 mL, followed by 5 mL of phenol solution (Tianjin Komeo Chemical Reagent Co. Ltd., Tianjin, China) and 5 mL of sodium hypochlorite alkaline solution (Tianjin Komeo Chemical Reagent Co. Ltd., Tianjin, China). The mixture was shaken well and left at room temperature for an hour. Then, 1 mL of masking agent (Tianjin Komeo Chemical Reagent Co. Ltd., Tianjin, China) was added, and the volume was fixed with distilled water to the scale. The ammonium nitrogen concentration was determined by colorimetry at 625 nm on a UV–visible spectrophotometer (Specord 200 Plus, Jena Analytical Instruments Co. Ltd., Germany, European), and the soil’s ammonium nitrogen content was calculated using the following Equation (2).
2.3.4. Determination of Soil Nitrate Nitrogen
All the plots were collected twice in the initial freezing period, three times in the stable freezing period and twice in the thawing period. A 20 g sample of fresh soil was taken and put in a 250 mL polyethylene bottles. Then, 100 mL of KCl leaching solution (Tianjin Guangfu Technology Development Co. Ltd., Tianjin, China) was added and the mixture was oscillated for an hour. Then, about 50 mL of suspension was transferred into 100 mL polyethylene centrifuge tubes, centrifuged for 10 min, and 30 mL of supernatant was transferred to 100 mL polyethylene bottles to be measured. The ammonium nitrate nitrogen concentration was determined by colorimetry at 220 nm and 275 nm on a UV–visible spectrophotometer (Specord 200 Plus, Jena Analytical Instruments Co. Ltd., German, European), and the soil’s nitrate nitrogen content was calculated using the following Equation (2).
where (mg·kg−1) is the soil’s ammonium nitrogen or nitrate nitrogen content; (μg·mL−1) is the concentration of the developing solution from the standard curve; V (mL) is the volume of the developing solution; is the partition multiple; and m (g) is the quality of dried samples.
2.4. Statistical Analysis
The statistical analysis was performed using SPSS 19.0, and the figures were created using Origin 9.0. The effects of different tillage practices and the amount of straw mulching on NH4+-N and NO3−-N were measured using a one-way analysis of variance (ANOVA). When the F-values were significant, the differences between the means for treatments were compared using a least significant difference (LSD) test at the 0.05 probability level.
3. Results
3.1. Temporal and Spatial Variations of Soil Profile Temperature
The soil’s temperature dynamics can be elucidated by observing the variations in soil profile temperature over time, as depicted in Figure 3, which illustrates the contour change curves of soil profile temperature for each treatment. It is evident from the figure that the trends in soil profile temperatures remained relatively consistent across treatments, indicating a general pattern of increasing soil temperature with depth during the freezing period and decreasing temperature during the thawing period. Additionally, the soil temperatures for all treatments exhibited a similar progression of decreasing temperatures, followed by sustained low temperatures, and increasing during the freezing and thawing periods. According to the soil’s vertical profile temperatures, the temperature contours are tightest in the top layer of the soil and gradually become thinner from the top layer downward, indicating that the temperature of the top layer of the soil is changing rapidly with a large temperature difference. The amplitude of temperature change between soil layers decreased with the increase of soil depth. The average variation in the 0–50 cm soil layer for the NT0, NT1, NT2, and CK treatments was 3.65~1.6 °C, 2.7~1.45 °C, 2.4~1.15 °C, and 5.1~1.55 °C, respectively, during the stabilization freezing period. During the thawing period, the average variation was 0.8~0.1 °C, 0.65~0.05 °C, 0.2~0 °C, and 1.65~0.25 °C, respectively. From the perspective of soil temperature changes over time, the NT1, NT2 and CK treatments all lagged behind the NT0 treatment to enter the stable freezing period, lagging by 7 d, 18 d and 4 d, respectively. In contrast, the CK treatment entered the thawing period earlier than the NT0, NT1 and NT2 treatments, by 4 d, 16 d and 22 d, respectively. This indicates that straw mulching treatments lagged behind the influence of air temperature changes on soil temperature, and this lagging effect increased with the increase in straw mulching amount. This indicates that the straw mulching treatments delayed the effects of temperature changes on soil temperature, and this delay increased as the amount of straw mulching increased. The no-tillage and straw mulch treatments had a warming effect on the soil layer during the freezing period. Compared to CK, the NT1 and NT2 treatments increased by an average of 0.33 °C and 3.76 °C, respectively. During the thawing period, these treatments prevented the soil layer from warming, with an average drop of 1.20 °C and 1.88 °C, respectively. The soil temperature changes in each treatment had varying rates of warming and cooling over the freeze–thaw period, with the maximum average temperature cooling rates of 1.1 °C/d, 0.78 °C/d, 0.25 °C/d, and 1.27 °C/d, and the maximum average temperature warming rates of 1.3 °C/d, 0.75 °C/d, 0.37 °C/d, and 1.37 °C/d for the NT0, NT1, NT2, and CK treatments, respectively. This indicates that the change rate of soil temperature under rotating tillage was much higher than that under no-tillage straw mulching during the freeze–thaw period, and it decreased with the increase in the straw mulching amount.
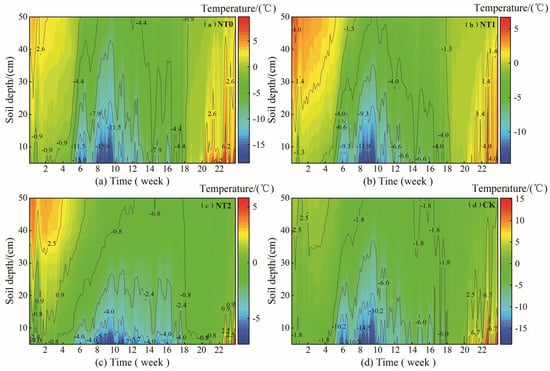
Figure 3.
Contours of temporal and spatial variations in soil profile temperature.
3.2. Changes in Soil Moisture Dynamics
The dynamic change in soil moisture is closely related to the process of soil freezing and thawing. Figure 4 illustrates the change curves of soil water content at various soil depths during the freeze–thaw period for each treatment. The soil’s moisture content was low during the initial freezing period and comparatively high during the thawing period throughout the freeze–thaw period, as shown in Figure 4. Freezing occurs from early November to mid-December. The soil’s water content of each treatment within 20 cm from the surface increased as the soil layer became deeper, and the lower layer’s water content decreased until it reached its maximum value at 40 cm, forming the moisture aggregation zone. This could be because the temperature of the soil layer between 0 and 20 cm was below zero during this stage, and the water content increased with the thickness of the freezing layer. Conversely, as a result of the upward recharging of the matrix potential gradient, the moisture in the soil beneath the soil layer 40 cm below the surface flowed toward the freezing front, creating a high-value zone of water content. In the initial freezing period, the NT0, NT1, NT2, and CK treatments formed the moisture aggregation zone at 40 cm were 26.19%, 26.27%, 27.95%, and 26.79%, respectively. Mid-December to early March is when the stable freezing period, with the passage of time, the depth of soil freezing deepened, and the time, location and duration of soil moisture accumulation areas were different. The soil moisture accumulation areas of the NT0 and CK treatments appeared at 40–50 cm and 50 cm below the surface from 14 December to 22 February of the next year, while the soil moisture accumulation areas of the NT1 and NT2 treatments appeared at 40 cm below the surface from January 4 and January 22 to March 9 of the next year, respectively. The soil moisture contents of the NT0, NT1, NT2, and CK treatments were 27.21~29.28%, 28.64~29.97%, 29.33~30.42%, and 27.09~28.23%, respectively. In the thawing period, the soil moisture content was higher than in the freezing period, in which the soil moisture content was higher in the NT1 and NT2 treatments than that of the NT0 and CK treatments. Compared with CK, the increase in soil moisture content was NT2, NT1, and NT0 in descending order, indicating that no-tillage and straw mulching had an effect on water storage and moisture conservation, and the effect was optimal when the amount of straw mulching was 7500 kg·ha−1.
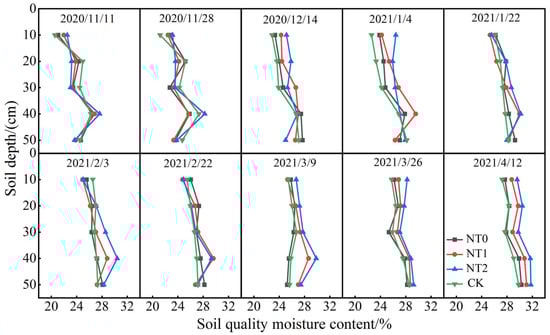
Figure 4.
Soil moisture dynamics.
3.3. Changes in Soil Ammonium Nitrogen Content
The temporal and spatial variation patterns of the soil’s NH4+-N content in the 0–50 cm soil layer of each treatment were similar, as depicted in Figure 5, and all the spatial variations decreased as the soil depth increased. Compared with CK, the increase in NT1 and NT2 treatments gradually decreased and leveled off with deeper soil depths. Over time, they all demonstrate that the soil’s NH4+-N content rises during the initial freezing period, rises, and then falls during the stable freezing period, and rises again during the thawing period. As shown in Figure 5a, in the 0–10 cm soil layer. The soil’s NH4+-N content was elevated in all treatments at the beginning of freezing, with CK elevated to 1.61 mg/kg, which was 88.21%, 71.81%, and 64.28% of the NT0, NT1, and NT2 treatments, respectively. During the stable freezing period, the NT1 and NT2 treatments exhibited significantly higher levels compared to CK, with increases ranging from 30.13% to 46.40% (p < 0.05) and 46.13% to 72.13% (p < 0.05), respectively. During the thawing period, although the NT1 and NT2 treatments remained significantly higher than CK, the magnitude of increase was smaller compared to the stable freezing period, ranging from 19.87% to 26.65% (p < 0.05) and 28.01% to 46.62% (p < 0.05), respectively.
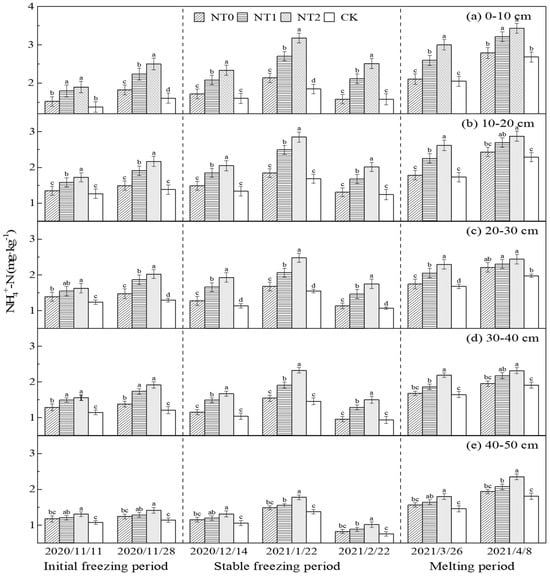
Figure 5.
Changes in soil ammonium nitrogen content. Different lowercase letters indicate significant differences (p < 0.05) between the situations.
As depicted in Figure 5b, within the 10–20 cm soil layer during the freeze–thaw period, the soil’s NH4+-N content of the NT0 treatment was slightly higher than that of the CK treatment, but the difference was not significant (p > 0.05). Conversely, the soil’s NH4+-N content of the NT1 and NT2 treatments consistently surpassed that of CK, with significant increases that were positively correlated with the amount of straw mulching applied, ranging from 13.16% to 47.88% (p < 0.05) and 25.91% to 62.06% (p < 0.05), respectively. Figure 5c illustrates that in the 20–30 cm soil layer, with the exception of the thawing period’s end, where no significant difference was observed between the NT0 and CK treatments in terms of the soil’s NH4+-N content (p > 0.05), the NT0, NT1, and NT2 treatments were significantly increased compared to CK. These increases were measured at 11.77% to 13.74% (p < 0.05), 16.57% to 45.57% (p < 0.05), and 23.33% to 69.35% (p < 0.05). As shown in Figure 5d, within the 30–40 cm soil layer. The soil’s NH4+-N content of the NT0 treatment was significantly higher than CK only during the initial freezing period, with an increase of 12.38% to 14.09% (p < 0.05). However, both the NT1 and NT2 treatments consistently demonstrated significantly higher soil NH4+-N content than CK throughout the freeze–thaw period. The increase was positively correlated with the amount of straw mulching, ranging from 13.18% to 56.80% (p < 0.05) and 21.22% to 81.06% (p < 0.05), respectively. Figure 5e illustrates that in the 40–50 cm soil layer during the freeze–thaw period, both the NT1 and CK treatments did not significantly differ from NT0 (p > 0.05), whereas both the NT1 and NT2 treatments were significantly higher than CK, with increases ranging from 12.21% to 16.16% (p < 0.05) and from 22.75% to 33.59% (p < 0.05), respectively. The soil’s NH4+-N content was increased with the amount of straw mulching applied. In summary, no-tillage and straw mulching treatments were more conducive to soil NH4+-N accumulation, and a greater amount of straw mulching led to a more obvious accumulation of soil NH4+-N.
3.4. Changes in Soil Nitrate Nitrogen Content
The soil’s NO3−-N content in the 0–50 cm soil layer for each treatment during the freeze–thaw period is shown in Figure 6. The soil’s NO3−-N content trends over time under varying tillage techniques and straw mulching quantities were inconsistent, although they all showed geographic variations of a continuous decline with increasing soil depth, and the soil layers exhibited consistent trends over time. In particular, the soil’s NO3−-N content decreased under the NT0 and CK treatments during the initial freezing period, while it increased under the NT1 and NT2 treatments. The soil’s NO3−-N content of the NT0 and CK treatments decreased and then slightly increased, while the NT1 and NT2 treatments’ soil NO3−-N content gradually increased during the stable freezing period. During the thawing period, the soil’s NO3−-N content exhibited an increase across all treatments. As depicted in Figure 6a, within the 0–10 cm soil layer during the initial freezing period, the soil’s NO3−-N content decreased by 10.74% and 15.95% in the NT0 and CK treatments, respectively, whereas it increased by 8.59% and 10.47% in the NT1 and NT2 treatments. By the end of this period, the NT0, NT1, and NT2 treatments were significantly higher than CK by 12.73% (p < 0.05), 54.42% (p < 0.05), and 68.52% (p < 0.05), respectively. This indicated that no-tillage was more effective at enhancing soil NO3−-N content compared to rotary tillage, with the combined effect of no-tillage and straw mulching having the most significant increase. During the stable freezing period, the soil’s NO3−-N content in the NT1 and NT2 treatments continued to decline, reaching minimum values of 9.87 mg/kg and 12.12 mg/kg, respectively. In contrast, the NO3−-N content in the NT0 and CK treatments decreased to 8.65 mg/kg and 7.56 mg/kg before increasing to 10.37 mg/kg and 9.10 mg/kg, respectively.
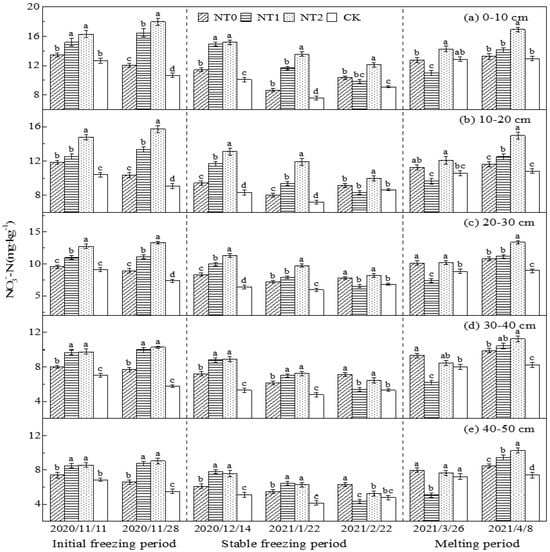
Figure 6.
Changes in soil nitrate nitrogen content. Different lowercase letters indicate significant differences (p < 0.05) between the situations.
Throughout the thawing period, soil NO3−-N content rose in all treatments. Specifically, the NT0 and CK treatments experienced rapid increases followed by stabilization, while the NT1 and NT2 treatments increased gradually at first and then more rapidly. The NO3−-N content in the NT0, NT1, and NT2 treatments during this period remained higher than that of CK overall, with increases ranging from 2.23% to 13.97%, 8.42% to 9.04%, and 10.97% to 33.17% (p < 0.05), respectively. Notably, the differences between NT2 and CK treatments were significant, suggesting that a larger amount of straw mulch was more efficacious in augmenting soil NO3--N content. As illustrated in Figure 6b, within the 10–20 cm soil layer, the soil’s NO3−-N content was significantly higher in the NT0, NT1, and NT2 treatments compared to CK during the initial freezing period, with increases of 14.12% to 14.30% (p < 0.05), 20.86% to 47.35% (p < 0.05), and 42.45% to 73.70% (p < 0.05), respectively. During this period, the NT0 and CK treatments decreased by 1.49 mg/kg and 1.32 mg/kg, respectively, while the NT1 and NT2 treatments increased by 0.81 mg/kg and 0.96 mg/kg, respectively. Throughout the stable freezing period, the NT0, NT1, and NT2 treatments were significantly higher than CK, except at the period’s end, with increases ranging from 11.42% to 13.12% (p < 0.05), 30.53% to 40.17% (p < 0.05), and 57.68% to 65.66% (p < 0.05), respectively.
During the thawing period, the soil’s NO3−-N content in the NT0 treatment consistently exceeded that of CK, albeit non-significantly (p > 0.05). However, the NT1 and NT2 treatments at the end of thawing were significantly higher by 15.53% (p < 0.05) and 38.46% (p < 0.05) compared to CK. Figure 6c reveals that within the 20–30 cm soil layer, the soil’s NO3−-N content across all treatments exhibited a trend of initial decrease followed by an increase during the freezing and thawing periods. The lowest values for the NT0 and CK treatments occurred on January 22 of the following year, while the NT1 and NT2 treatments reached their nadir on February 22. With the exception of NT0 on November 11th and NT1 at the end of the freezing period, which were not significantly different from CK (p > 0.05), and NT1 being significantly lower than CK at the onset of thawing (p < 0.05), the NT0, NT1, and NT2 treatments were all significantly higher than CK throughout the freezing and thawing periods (p < 0.05). The increases ranged from 14.37% to 30.18% (p < 0.05), 20.50% to 56.15% (p < 0.05), and 15.09% to 81.19% (p < 0.05), respectively. As shown in Figure 6d, within the 30–40 cm soil layer during the initial freezing period, the soil’s NO3−-N content decreased by 0.34 mg/kg and 1.24 mg/kg in the NT0 and CK treatments, respectively, while it increased by 0.27 mg/kg and 0.48 mg/kg in NT1 and NT2 treatments, respectively. During the stable freezing period, the NO3−-N content in the NT0 and CK treatments initially declined to 6.18 mg/kg and 4.77 mg/kg, respectively, before rising to 7.14 mg/kg and 5.29 mg/kg. Conversely, NT1 and NT2 treatments continued to decrease to 5.39 mg/kg and 6.47 mg/kg, respectively. During the thawing period, compared to CK, the NT0, NT1, and NT2 treatments were significantly higher by 19.98% (p < 0.05), 26.49% (p < 0.05), and 36.41% (p < 0.05), respectively. Figure 6e demonstrates that within the 40–50 cm soil layer during the initial freezing period, there was no significant difference in soil NO3−-N content between NT1 and NT2 treatments (p > 0.05); however, both were significantly higher than CK with increases ranging from 24.38% to 59.66% (p < 0.05) and 25.04% to 64.94% (p < 0.05), respectively. During the stable freezing period, the NT0 and CK treatments decreased by 0.62 mg/kg and 0.93 mg/kg before increasing by 0.81 mg/kg and 0.63 mg/kg, respectively, while NT1 and NT2 treatments decreased by 3.42 mg/kg and 2.31 mg/kg. At the conclusion of the thawing period, compared to CK, the NT0, NT1, and NT2 treatments were significantly higher by 14.54% (p < 0.05), 28.11% (p < 0.05), and 39.11% (p < 0.05), respectively. In conclusion, both no-tillage and straw mulching were found to increase soil NO3−-N content, with a more pronounced effect observed as the amount of straw mulching increased. Consequently, the combined application of no-tillage and straw mulching effectively promoted the accumulation of soil NO3−-N within the 0–50 cm soil layer.
4. Discussion
Freeze–thaw soil hydrothermal systems play an important role in agricultural production and the field of land and water resources. However, no-tillage improves the soil’s hydrothermal environment, not only during the crop growth period but also during the freeze–thaw period. The suitable plowing methods can effectively break the plow subsoil layer, enhance the infiltration capacity of rain and snow, facilitate the downward transfer of temperature from the upper layers of the soil, and change the condition of soil moisture, fertilizer, air and heat. No-tillage had a higher capacity to retain water and soil moisture was greatly enhanced, according to Pang Xu´s study on the effects of various conservation tillage techniques on soil water storage and moisture retention [19]. Zhang Dingchen studied the effects of different tillage methods on soil respiration and hydrotherm, and the results showed that no-tillage reduced soil moisture and increased soil respiration rate [20]. In this study, no-tillage and straw mulching improved the hydrothermal environment of seasonal freeze–thaw soil, and the results showed that straw mulching could effectively increase the soil temperature in the freezing period and inhibit the soil temperature in the thawing period. The hysteresis effect of the temperature change on the soil temperature was stronger as the amount of straw mulching increased, which was consistent with the results of the study on the influence of straw mulching thickness on the soil temperature during the freezing and thawing periods by Xing Shuyan et al. [21], which was attributed to the fact that straw mulching formed a relatively sparse isolation layer between the soil and the atmosphere, which prevents direct solar radiation, reduces soil heat loss during the freezing period, and weakens the heat exchange between the ground and the air during the thawing period [22]. The temperature variation of the 0–50 cm soil layer in each treatment decreased from shallow to deep, with the no-tillage and straw mulching treatments showing relatively small temperature variation, which indicated that shallow soil was more severely influenced by external air temperature and solar radiation, and weakened as soil depth increased. Still, no-tillage and straw mulching could effectively mitigate the influence of external climatic variables on soil temperature.
Freeze–thaw soil moisture movement is an important part of the water cycle, and serious evaporation of surface moisture during the thawing period will lead to insufficient subsoil moisture for spring sowing in the following year, so it is particularly important to take reasonable measures to inhibit evaporation from the surface and improve soil/subsoil moisture. In this study, it was found that the soil moisture content was higher during the thawing period than during the freezing period, and the soil moisture content was higher in the straw mulching treatment than in the without straw mulching treatment. This is because as temperatures rise, the snow on the soil surface melts and infiltrates, and the frozen layer begins to melt in both directions; the ice collected in the frozen layer ablated, whereas straw mulching could effectively impede the water transport between the ground and air and reduce the water dissipation.
Previous studies showed that straw mulching treatments greatly increased the soil water content during the freeze–thaw period and affected soil moisture movement so that the soil moisture profiles of different treatments showed different vertical distributions, in which the moisture aggregation zone of the bare ground appeared at 40 cm, while the moisture aggregation zone of the straw mulched plots appeared at the ground surface and at 30~50 cm from the ground surface [23]. In this experiment, the timing and location of moisture accumulation zones differed among treatments during the stable freezing periods, with the moisture accumulation zones delayed and closer to the soil surface in straw mulching treatments, which was consistent with the results of the study by Chen Junfeng [24], which was probably due to the fact that the phase change in soil moisture occurred with the lowering of the soil temperature, resulting in decreased liquid water content and reduced soil matrix potential, and the soil water migrated towards the freezing front under the action of the matrix potential gradient, making the moisture content increase at the freezing front, while the soil temperature of straw mulching treatments were higher than other treatments, with the freezing front moving downward in the freezing process, soil water migrated from deep to shallow layers, with a higher rate of water migration than the rate of freezing front movement, leading to the formation of moisture accumulation zones closer to the surface, which indicated that straw mulching had the effect of retaining and increasing the moisture content of the seasonally frozen soil.
Freezing and thawing not only affect soil hydrothermal conditions but also influence soil nutrient cycling and utilization by affecting soil physical and chemical properties and microbial activity [25,26,27]. However, no-tillage improves soil nutrient content not only during the crop growth period but also freeze–thaw period. By studying the effects of different tillage methods on soil nutrients, Nie found that compared with conventional tillage, no-tillage significantly increased the content of ammonium nitrogen in soil [28]. Inorganic nitrogen in soil mainly consists of ammonium nitrogen and nitrate nitrogen; nitrate nitrogen is reduced to form ammonium nitrogen, which can be directly absorbed and utilized by plants, which are important indicators for evaluating soil fertility. In this study, soil NH4+-N content was temporally shown to increase during the initial freezing period, increase and then decrease during the stable freezing period, and continue to increase during the thawing period, which may be due to the microbial cell rupture caused by the low temperature in the freezing process, releasing part of the ammonium nitrogen, and the existence of the permafrost layer makes the surface of the soil particles to form a closed anoxic environment, which inhibits nitrification and is conducive to the accumulation of ammonium nitrogen [29,30,31], the decline at the end of the stable freezing period may be caused by the following: the soil temperature rises in response to rising outdoor air temperatures, which in turn increases the activity of nitrifying bacteria, and nitrification lowers the ammonium nitrogen content. It enters into the thawing period; the freezing soil then melts, promoting the release of ammonium nitrogen that is unavailable in the organic and inorganic colloid. In addition, under suitable hydrothermal conditions, soil microorganisms multiply rapidly, and their activity is enhanced, which causes the mineralization of organic nitrogen enhancement of the soil’s NH4+-N concentration [32]. The soil’s NO3−-N content of each treatment was temporally expressed as follows: during the initial freezing, the soil’s NO3−-N content of the without straw mulching treatment was decreased, while the straw mulching treatment was increased. This phenomenon could be explained by the warming effect of the straw mulching, which enhances microbial activity, facilitates mineralization, and increases NO3−-N content.
During the stable freezing period, the without straw mulching treatments’ soil NO3−-N content decreased and then slightly increased, while the straw mulching treatments’ soil NO3−-N content gradually decreased, which may be due to the fact that at the end of the freezing period, the soil temperature increased due to the influence of the outside air temperature, but the permafrost had not yet thawed, making the nitrifying bacteria more sensitive to the external environment, especially to the temperature. Thus, the NO3−-N content of the treatment without straw mulching increased slowly, and the closed environment formed by straw mulch inhibited nitrification, which enhanced denitrification and decreased the NO3−-N content [33,34,35]. During the thawing period, both mineralization and nitrification were enhanced as soil temperatures continued to rise, resulting in a gradual increase in NO3−-N levels.
Previous studies [4,32] have shown that soil NH4+-N and NO3−-N contents decrease with the increase of soil depth during the freeze–thaw period, soil NH4+-N and NO3−-N contents slightly increase at the initial freezing period, gradually decrease during the stable freezing period, and gradually increase during the thawing period, and the spatial pattern of the change in the soil’s NH4+-N and NO3−-N contents in the previous study are consistent with the results of the present study. However, the changes in the soil’s NH4+-N and NO3−-N contents during the stable freezing period were slightly different from the results of this study, which may be due to the differences caused by the application of biochar in the previous study. In contrast, the soil’s NH4+-N and NO3−-N content changes in this study were influenced by the freeze–thaw of soil moisture and the dual effects of no-tillage and straw mulching amounts, which affected soil ammonium nitrogen and nitrate nitrogen content changes by affecting soil porosity, changing soil structure, and creating alternating anaerobic and aerobic environments, which in turn affected nitrification and denitrification [36,37].
Based on the above analysis, it can be concluded that the optimum amount of straw mulching was 7500 kg·ha−1 for improving spring-sowing moisture content and nutrient levels in farmland soils.
5. Conclusions
The no-tillage and straw mulching had a positive impact on the soil’s hydrothermal environment and nutrient content. Compared to the CK treatment, the NT1 and NT2 treatments effectively increased the mean soil temperature by 1.42 °C and 1.95 °C in the 0–50 cm soil layer during the freezing period, while it inhibited the increase of soil temperature during the thawing period, and it decreased by 2.35 °C and 3.36 °C. The no-tillage and straw mulching treatments were effective in water storage and moisture retention, and the effect was enhanced with increasing straw mulching; the soil water content of the NT1 and NT2 treatments can be increased by up to 11.09% and 15.56%. Furthermore, the no-tillage and straw mulching treatments significantly increased the soil’s NH4+-N and NO3−-N contents in the 0–50 cm soil layer, with the soil’s NH4+-N and NO3−-N contents of the NT2 treatment consistently significantly higher than CK, and it increased by 25.65% and 38.81% during the thawing period, respectively. In future experiments, we will study the effects of consecutive years of straw mulching on the soil’s hydrothermal environment and nutrient content during the freeze–thaw period.
Author Contributions
Conceptualization, B.W. and Y.H.; methodology, B.W.; literature search, H.W.; creating the figures and tables, H.W.; formal analysis, Z.F.; investigation, B.W.; resources, B.W.; data curation, Z.F.; writing—original draft preparation, Z.F.; writing—review and editing, B.W.; supervision, Y.H.; project administration, B.W.; funding acquisition, B.W. All authors have read and agreed to the published version of the manuscript.
Funding
This research was funded by the National Natural Science Foundation of China (52079050).
Data Availability Statement
The original contributions presented in the study are included in the article; further inquiries can be directed to the corresponding author.
Acknowledgments
We are grateful to the staff of the Water Conservancy Technology Research Station of the Heilongjiang Province Hydraulic Research Institute for their technical assistance.
Conflicts of Interest
The authors declare no conflicts of interest.
References
- Cheng, H.; Wang, G.; Hu, H.; Wang, Y. The Variation of Soil Temperature and Water Content of Seasonal Frozen Soil with Different Vegetation Coverage in the Head Water Region of the Yellow River, China. Environ. Geol. 2008, 54, 1755–1762. [Google Scholar] [CrossRef]
- Fu, Q.; Hou, R.J.; Li, T.X.; Ma, Z.A.; Peng, L. Soil Moisture-Heat Transfer and Its Action Mechanism of Freeing and Thawing Soil. Trans. Chin. Soc. Agric. 2016, 47, 99–110. [Google Scholar]
- Niu, H. Effect of Freeze-Thaw Process on Aggregate Stability of Black Soil in Northeast China. Master’s Thesis, Northwest A&F University, Xi’an, China, 2020. [Google Scholar]
- Shi, G.X. Effects of Combined Regulation of Biochar and Tillage on Habitat Health and Crop Growth in Seasonal Frozon Soil Area. Ph.D. Thesis, Northeast Agricultural University, Harbin, China, 2023. [Google Scholar]
- Yang, X. Effect Mechanism of Biochar on Soil Water-Soil Environment and Carbon and Nitrogen Cycle under Freeze-Thaw Conditions. Master’s Thesis, Northeast Agricultural University, Harbin, China, 2022. [Google Scholar]
- Zhang, F. The Effect of Freeze-Thaw-Snow Melt on Soil Aggregate of Black Soil. Master’s Thesis, Shenyang Agricultural University, Shenyang, China, 2023. [Google Scholar]
- Dai, Z.J. Effects of Conservation Tillage on Soil Nitrogen Conversion in Weibei Arid Plateau. Ph.D. Thesis, Northwest A&F University, Xi’an, China, 2023. [Google Scholar]
- Akhtar, K.; Wang, W.Y.; Ren, G.X.; Yang, G.H. Changes in Soil Enzymes, Soil Properties, and Maize Crop Productivity under Wheat Straw Mulching in Guanzhong, China. Soil Tillage Res. 2018, 182, 94–102. [Google Scholar] [CrossRef]
- Cheng, Z.H.; Wang, H.Y.; Liu, G.X.; Yang, X.W.; Zhao, X.L.; Lu, D.J.; Zhou, J.M.; Li, C.Z. Changes in Soil Microbial Community and Organic Carbon Fractions under Short-term Straw Return in a Rice-wheat Cropping System. Soil Tillage Res. 2017, 165, 121–127. [Google Scholar] [CrossRef]
- Pang, Y.; Yuan, J.Y.; Yan, L.J.; Du, M.Y.; Li, G. Effects of Conservation Tillage on Soil Nitrogen Mineralization in Dry Wheat Fields on the Loess Platrau. Arid Zone Res. 2023, 40, 1446–1456. [Google Scholar]
- Zhang, P.; Wei, T.; Jia, Z.K.; Wang, Y.; Han, Q.F.; Ren, X.L. Soil Aggregate and Crop Yield Changes with Different Rates of Straw Incorporation in Semiarid Areas of Northwest China. Geoderma 2014, 230, 41–49. [Google Scholar] [CrossRef]
- Gong, X.Y.; Zhao, J.; Yang, X.G. Hydrothermal Effects of the Conservation Tillage in Soybean Farmland in Northeast China: A Meta-analy. Chin. J. Agrometeorol. 2022, 11, 867–880. [Google Scholar]
- Qiu, Y.; Wan, X. Effects of Tillage Patterns on Soil Moisture and Soybean Yield in Sloping Fields. Trans. CSAE 2018, 22, 128–137. [Google Scholar]
- Tang, W.Z.; Wang, C.X.; Lan, M.J.; Fan, W.B. An Experimental Research on Surface Covers Effects on the Temperature of the Soil Plough Layer in the Freezing and Thawing Period of the Northern Xinjiang Area. China Rural Water Hydropower 2016, 8, 44–48. [Google Scholar]
- Wu, C.D. Research on the Soil Moisture and Heat Regimes under Different Straw Mulching Thickness during Freezing-Thawing Period. Master’s Thesis, Northeast Agricultural University, Harbin, China, 2016. [Google Scholar]
- Sun, K. Study on the Control Techniques of Autumn Tillage on Farmland Soil Moisture, Heat and Nitrogen in Freeze-Thaw Period. Master’s Thesis, Shihezi University, Shihezi, China, 2022. [Google Scholar]
- Hao, X.Y.; Chen, M.M. Present Fertilizer Utilization of Crop Straw Situation and Suggestions for its Development: A Case Study of Heilongjiang Province. J. Hebei Agric. Univ. 2021, 6, 108–114. [Google Scholar]
- Song, F.; Liu, M.; Zhang, Z.X.; Qi, Z.J.; Li, T.C.; Du, S.C.; Li, A.; Liu, J. No-Tillage with Straw Mulching Increased Maize Yield and Nitrogen Fertilizer Recovery Rate in Northeast China. Agric. Water Manag. 2024, 292, 108687. [Google Scholar] [CrossRef]
- Pang, X.; He, W.Q.; Yan, C.R. Effects of Tillage Practices on Soil Hydrothermal Characteristics and Microbial Biomass Carbon. Acta. Ecol. Sin. 2013, 33, 1308–1316. [Google Scholar] [CrossRef][Green Version]
- Zhang, D.C.; Cai, D.X.; Dai, K. Soil Respiration and Response to Hydrothermal Factors under Different Tillage in Dry Farmland. Acta. Ecol. Sin. 2013, 33, 1916–1925. [Google Scholar] [CrossRef][Green Version]
- Xing, S.Y.; Liu, H.; Zheng, X.Q.; Liu, M.P. A Class of Closed Forms of Euler of Sum with Parameters. J. Taiyuan Univ. Technol. 2012, 43, 741–780. [Google Scholar]
- Shan, X.Q. Experimental Study on Dynamic Changes of Soil Moisture and Temperature under Different Combinations of Water and Nitrogen and Surface Coverage during Seasonal Freeze-Thaw Period. Master’s Thesis, Taiyuan University of Technology, Taiyuan, China, 2018. [Google Scholar]
- Xing, S.Y.; Zheng, X.Q.; Chen, J.F. Experimental Study on Effect of Corn Residue Management on Soil Water Content during Freezing-thawing Period. Trans. CSAE 2012, 28, 90–93. [Google Scholar]
- Chen, J.F.; Zheng, X.Q.; Qin, Z.D.; Liu, P.; Zang, H.F.; Sun, M. Effects of Maize Straw Mulch on Spatiotemporal Variation of Soil Moisture and Temperature during Freeze-thaw Period. Trans. CSAE 2013, 29, 102–108. [Google Scholar]
- Iwata, Y.; Hirota, T.; Hayashi, M. Effects of Frozen Soil and Snow Cover on Cold-season Soil Water Dynamics in Tokachi, Japan. Hydrol. Process. 2010, 24, 1755–1765. [Google Scholar] [CrossRef]
- Sharma, S.; Szele, Z.; Schilling, R.; Schloter, M. Influence of Freeze-thaw Stress on the Structure and Function of Microbial Communities and Denitrifying Populations in Soil. Appl. Environ. Microbiol. 2006, 2, 2148–2154. [Google Scholar] [CrossRef]
- Yang, Y.L.; Wu, F.Z.; Yang, W.Q.; Tang, B.; Kang, L.N. Effects of Snow Pack Removal on Soil Hydrolase Enzyme Activities in an Alpine Abies faxoniana Forest of Western Sichuan. Acta Ecol. Sin. 2012, 32, 7045–7052. [Google Scholar] [CrossRef]
- Nie, X.J.; Zhang, H.B.; Li, S.Y. Effects of Irrigation and Tillage on Soil Organic Carbon and Nutrients in Mining-induced Subsided Cropland. Soil Res. 2019, 57, 513–519. [Google Scholar] [CrossRef]
- Deluca, T.H.; Keeney, D.R.; Mccarty, G.W. Effect of Freeze-thaw Events on Mineralization of Soil Nitrogen. Biol. Fert. Soils 1992, 14, 116–120. [Google Scholar] [CrossRef]
- Li, Y. The Influence of Hydrothermal Conditions Change on Nitrogen Transformation and Enzyme Activities in Black Soil in Northeast China. Master’s Thesis, Northeast Normal University, Changchun, China, 2015. [Google Scholar]
- Teepe, R.; Brumme, R.; Beese, F. Nitrous Oxide Emissions from Soil during Freezing and Thawing Periods. Soil Biol. Biochem. 2001, 33, 1269–1275. [Google Scholar] [CrossRef]
- Gao, Y. Study on the Regulation Mechanism of Biochar on Soil Water-Heat, Carbon and Nitrogen Processes in Seasonal Frozen Soil Region. Ph.D. Thesis, Northeast Agricultural University, Harbin, China, 2021. [Google Scholar]
- Xie, Q.Y.; Gao, Y.H. The Effects of Freezing-thawing on Soil Carbon, Nitrogen and Phosphorus Availabilities in Alpine Meadow on the Qinghai-Tibetan Plateau. J. Soil Water Conserv. 2015, 29, 137–142. [Google Scholar]
- Zhou, W.M.; Wang, J.D.; Liu, J.S.; Qin, S.J.; Wang, Y. Effects of Freezing and Thawing on Dissolved Organic Carbon and Nitrogen Pool and Nitrogen Mineralization in Typical Wetland Soils from Sanjiang Plain, Heilongjiag, China. J. Ecol. Rural Environ. 2008, 3, 1–6. [Google Scholar]
- Herrmann, A.; Witter, E. Sources of C and N Contributing to the Flush in Mineralization Upon Freeze-thaw Cycles in Soils. Soil Biol. Biochem. 2002, 34, 1495–1505. [Google Scholar] [CrossRef]
- Jiang, N.; Juan, Y.H.; Tian, L.L.; Chen, X.D.; Sun, W.T.; Chen, L.J. Soil Water Contents Control the Responses of Dissolved Nitrogen Pools and Bacterial Communities to Freeze-Thaw in Temperate Soils. BioMed Res. Int. 2020, 3, 6867081. [Google Scholar] [CrossRef]
- Zhao, Q.; Wu, J.W.; Guo, C.Y. Effects of Freezing-Thawing Processes on Net Nitrogen Mineralization in Salinized Farmland Soil. Agron. J. 2022, 12, 2986. [Google Scholar] [CrossRef]


Disclaimer/Publisher’s Note: The statements, opinions and data contained in all publications are solely those of the individual author(s) and contributor(s) and not of MDPI and/or the editor(s). MDPI and/or the editor(s) disclaim responsibility for any injury to people or property resulting from any ideas, methods, instructions or products referred to in the content. |
© 2024 by the authors. Licensee MDPI, Basel, Switzerland. This article is an open access article distributed under the terms and conditions of the Creative Commons Attribution (CC BY) license (https://creativecommons.org/licenses/by/4.0/).