Article

Determination of Critical Crop Water Stress Index of Tea under Drought Stress Based on the Intercellular CO2 Concentration

1
School of Agricultural Engineering, Jiangsu University, Zhenjiang 212013, China
2
Jiangsu Province and Education Ministry Co–Sponsored Synergistic Innovation Center of Modern Agricultural Equipment, Zhenjiang 212013, China
3
Nanjing Institute of Agricultural Mechanization, Ministry of Agriculture and Rural Affairs, Nanjing 210000, China
4
Yunnan Academy of Agricultural Sciences, Kunming 650204, China
*
Author to whom correspondence should be addressed.
Agronomy 2024, 14(9), 2154; https://doi.org/10.3390/agronomy14092154
Submission received: 30 July 2024 / Revised: 18 September 2024 / Accepted: 19 September 2024 / Published: 21 September 2024

Abstract

:
Climatic changes have caused seasonal drought to occur frequently in tea fields of low-mountain and hill regions over the past decades. This leads to huge losses in the quality and yields of famous tea, which restricts the economic development of the tea industry. It is crucial to implement suitable irrigation scheduling. The crop water stress index (CWSI) is the main index to assess the water status of the crop. When the crop suffers irreversible drought stress, its critical water status cannot be easily evaluated using the CWSI. The change from stomatal limitations (SLs) to non-stomatal limitations (NSLs) of photosynthesis is vital for accurately recognizing crop drought stress. Thus, the objective of this research is to determine the critical crop water stress index of tea based on intercellular CO2 concentration (Ci) dynamic responses to drought stress. During two sensitive periods of water stress (famous tea harvest season and summer drought season, which are from March to April and July to August, respectively), the dynamic changes in the CWSI in tea were calculated and analyzed based on the CWSI theoretical model. The upper and lower baselines were determined on a daily basis and during a certain period. A critical value of the CWSI represents irreversible drought damage. This was determined by the characteristic response of the Ci of tea leaves during extreme drought stress. The results showed the following: (1) during the famous tea harvest season and summer drought season, the daily variation in CWSI was similar. During a certain period, the former maintained a stable fluctuation, while the latter increased in fluctuation. (2) The Ci showed a trend of fluctuating downward to a low point and then upward during extreme drought stress. After reaching the low point, it quickly increased in the former and stabilized for a day in the latter. When the Ci reached the low point, the upper benchmark of this critical point was 13.9 μmol·mol−1, the lower benchmark was 3.4, and the CWSI was 0.27. This critical CWSI could be used as an irrigation threshold point to ensure normal production for tea fields.

1. Introduction

Seasonal drought occurs frequently in the middle and lower Yangtze river regions, which are the main production areas of famous tea with high quality and value, leading to huge economic and yield losses [1]. To ensure the normal growth and safe harvest of famous tea, rational agricultural irrigation is one of the indispensable links. Considering the scarcity of water resources and the high cost of irrigation, it is vital to improve irrigation efficiency and change irrigation strategies to enhance the crop water use efficiency in modern agricultural water management [2,3,4].
Tea plants face various abiotic stresses that can significantly impact their growth, development, and productivity [5]. These stresses include drought and water deficiency, which affect nutrient uptake and photosynthesis; temperature extremes, such as heat causing leaf scorching and cold, leading to shoot damage; and salinity, which results in osmotic stress and ion toxicity. Additionally, light stress from both excessive and insufficient light can impair photosynthesis, while nutrient imbalances from deficiencies or toxicities hinder growth [6,7]. Heavy metals, soil pH extremes, flooding, and high winds also pose significant challenges, causing toxicity, nutrient availability issues, root damage, and physical harm. Understanding these stresses is essential for developing effective management strategies to ensure optimal tea plant health and high-quality production.
Drought status used to rely on the soil moisture and water stress index, but the plant is regulated by both soil water and atmospheric evaporation demand, so it is erroneous to only use the soil moisture status to identify the drought impacts on plants [8,9,10]. Other methods for monitoring crop water conditions include soil moisture balance calculations and the direct or indirect measurement of plant water conditions through stomatal conductance and leaf water potential. The crop water stress index (CWSI), developed with the aid of the difference between the plant surface temperature and air temperature and atmospheric vapor pressure deficit, has been successfully used for the past three decades in irrigation schedules and accurately reflects the degree of crop water shortages [11,12,13,14,15,16,17]. Jackson used the difference between the crop canopy temperature and air temperature as an indicator of crop water stress [18,19], proposing an empirical model to calculate the CWSI [2]. Jackson further improved this by applying an energy balance equation to calculate the CWSI and, through a theoretical limit approach, established the relationship between the canopy–air temperature difference and air saturation vapor pressure difference, presenting a theoretical model for calculating the CWSI [20]. Bo et al. performed an assessment of crop water deficit levels under different film mulch irrigation conditions using the CWSI [21]. Liu et al. evaluated the applicability of the CWSI in a cork oak plantation and used the CWSI based on canopy–air temperature differences to monitor and evaluate the water status of forest ecosystems [22]. Although the CWSI has been widely used as an effective tool to measure the degree of crop water stress, research on the resistance mechanisms of tea plants under drought conditions and their critical threshold values remains relatively limited. Determining the critical point of crop water stress is important for ensuring and defining the minimum water requirements of plants. It also serves as a crucial indicator for plants transitioning from mild-to-moderate drought stress to severe drought stress [23]. Understanding this transition point is valuable for crop drought identification and classification [24].
Moisture is directly related to plant photosynthesis, and under mild and moderate drought stress, plants cannot supply enough water to the leaves, and then, leaf water potential decreases leading to a reduction in stomatal opening, an increase in the stomatal resistance point, and the difficulty of plants to absorb CO2, but this reduces the further water deficit from leaves, which is how stomatal limitations (SLs) protect plants from drought [25,26,27]. On the other hand, non-stomatal limitations (NSLs) are mainly due to reduced photosynthetic capacity following damage to photosynthetic organs mediated by a disruption of the electron origin system, transfer of electron transfer receptors, changes in chloroplast structures with damage to plant membranes, and degradation of photosynthetic pigments as a result of excessive drought stress. As an important signal for stomatal change, CO2 can be a good indicator when crop photosynthesis changes from being subjected to SL to NSL [28,29,30,31]. At the beginning of drought stress, the plants are at the SL stage, stomatal resistance is increased, and the CO2 entering the cells is decreased, but the photosynthetic organs are not damaged, so CO2 consumption remains unchanged, and the intercellular CO2 concentration (Ci) shows a decreasing trend. When the drought stress intensifies, the plants change from the SL stage to the NSL stage, the photosynthetic organs are damaged, the CO2 consumption continues to decrease, and the Ci increases again. Therefore, the SL-to-NSL transformation can be obtained by monitoring changes in the CO2 concentration. Plant drought is a gradually evolving dynamic process and an accumulating one influenced by various meteorological factors. Continuous monitoring of the CWSI indeed enables the accurate assessment of crop drought severity. However, it fails to determine when drought stress becomes irreversible damage to plants. The SL-to-NSL-transformation point provides an explanation for this. Therefore, we believe that there is a critical point in the drought stress level reflected by the CWSI. Failure to implement irrigation measures at this point will result in permanent damage to plants, leading to reduced yields and plant death.
This paper aims to determine the critical crop water stress index of tea based on Ci dynamic responses to drought stress. During two sensitive periods of water stress (March to April and July to August), the dynamic changes in the CWSI in tea plants were calculated and analyzed based on the CWSI theoretical model. The determination of upper and lower baselines was both on a daily basis and during a certain period. The critical value of the CWSI represents irreversible drought damage. This was determined by the characteristic response of the Ci of tea leaves during extreme drought stress. This provides a more precise reference for crop water management and a scientific basis for the design of efficient irrigation systems and ensures the survival of tea plants, thereby reducing economic losses during the drought season.

2. Materials and Methods

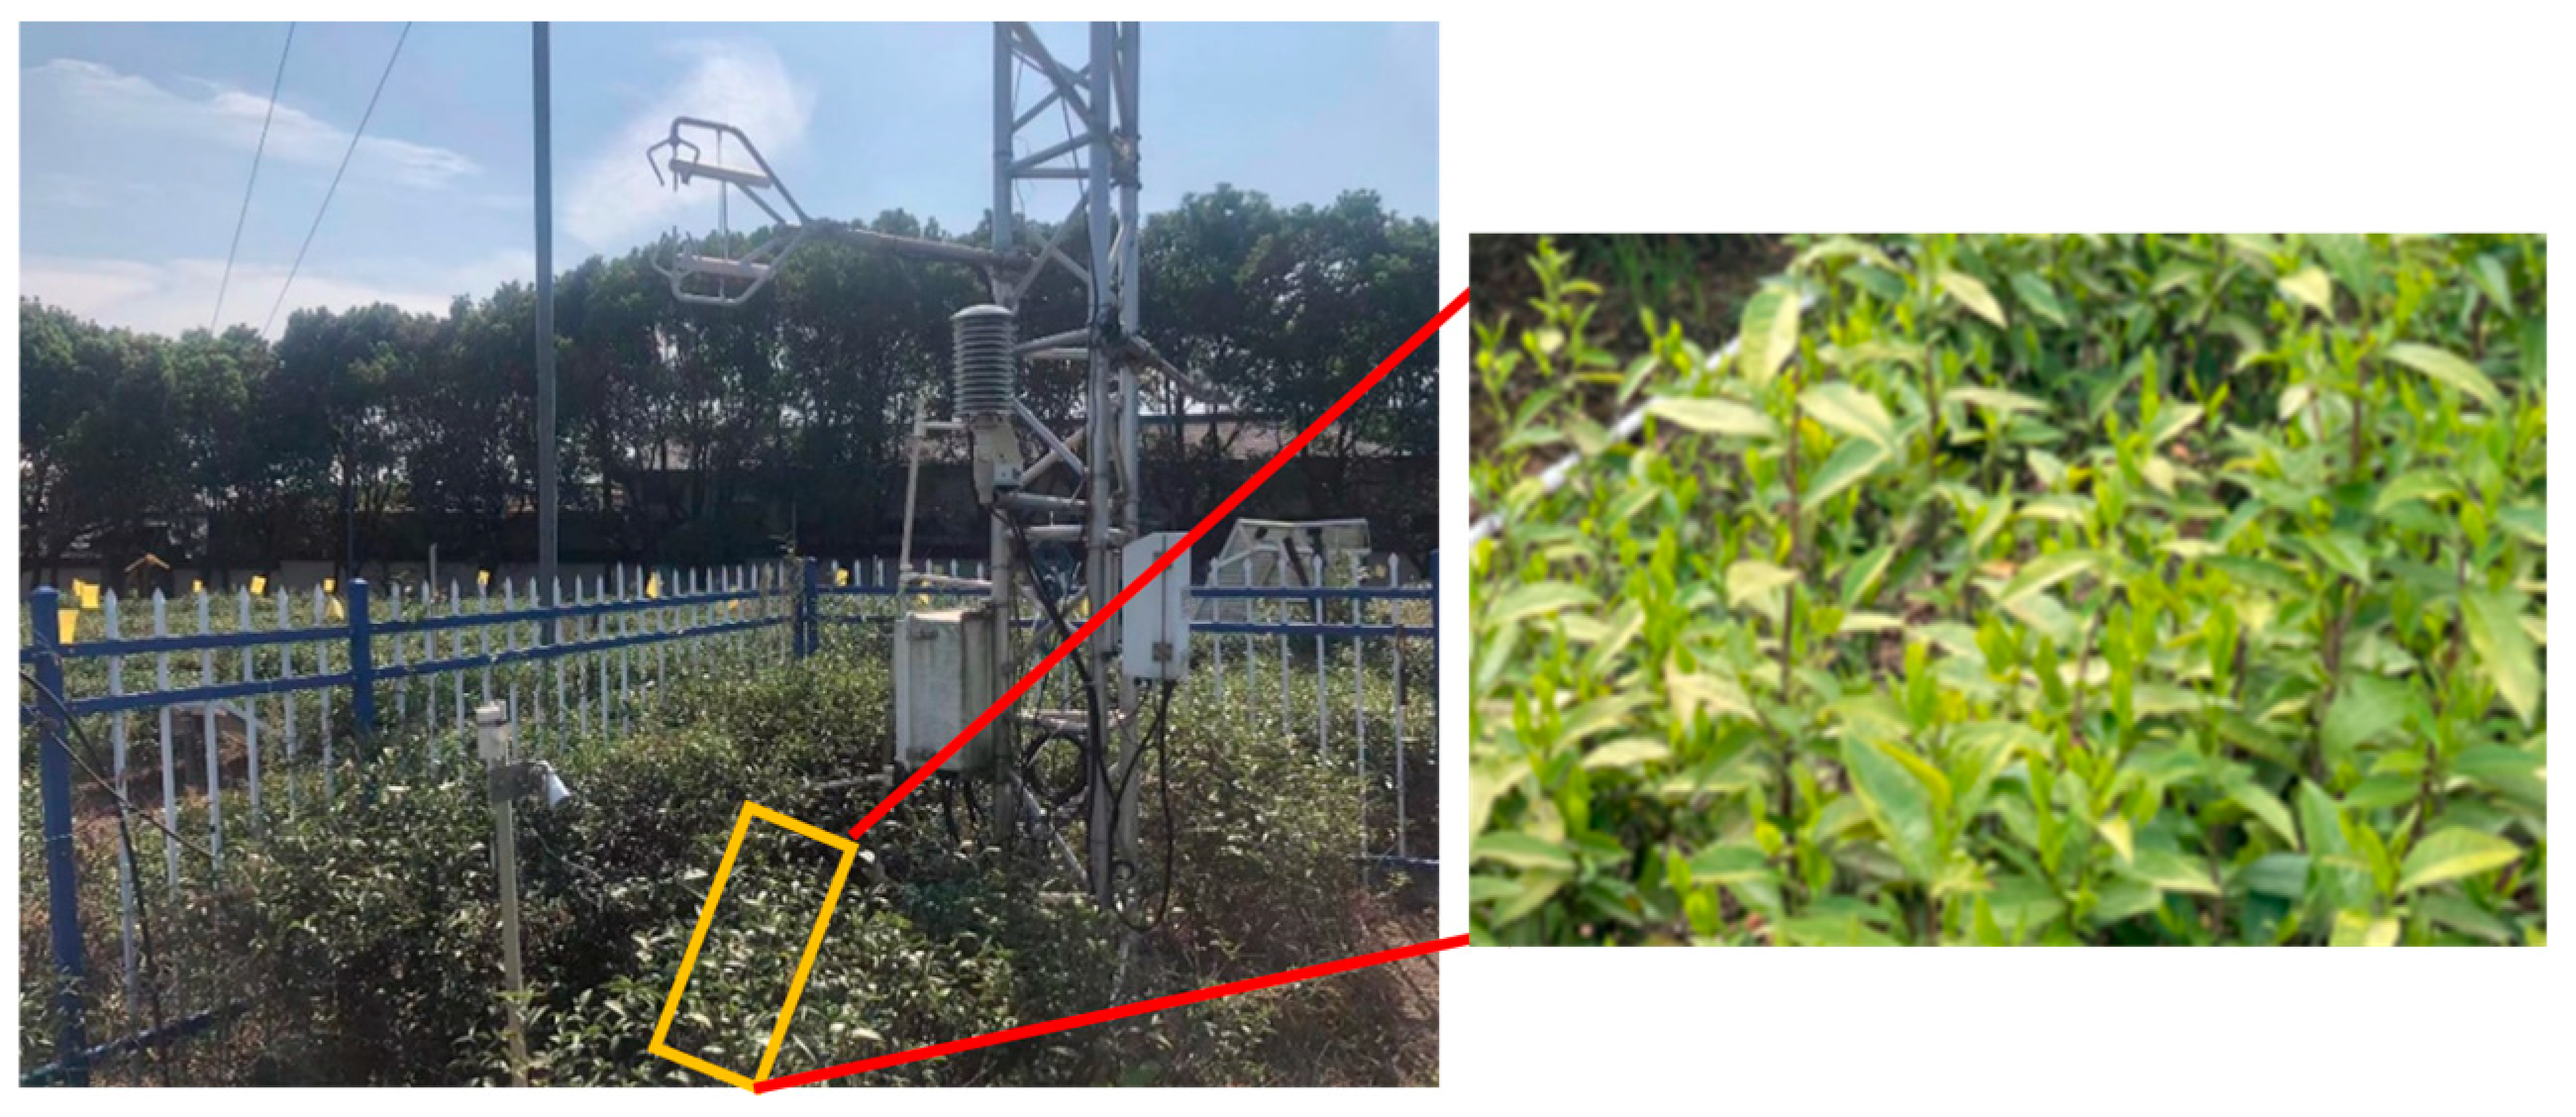
2.1. Experimental Site

The experimental tea field is located at the Yinchunbiya Tea Farm in Danyang, Jiangsu (latitude 32°01′35″ north (N), longitude 119°40′21″ east (E)), which is a prominent region for the cultivation of high-quality green tea in China (Figure 1). It is in the low-gradient hilly terrain of the middle and lower reaches of the Yangtze River region in China, with an average altitude of 18.5 m. It is characterized by a subtropical climate, with an annual average precipitation of approximately 1029.0 mm and an average temperature of around 15.5 °C. The cultivar of experimental tea plants was “Maolu” at 10 years of age. Due to the seasonal irregularities in precipitation, rainfall is predominantly concentrated between April and September, with diminished precipitation observed in early spring, late autumn, and winter. During July to August of 2022, an extended duration of extremely high temperatures exceeding 35.0 °C for over 30 consecutive days led to significant drought stress for the local tea field. To investigate the diurnal variation patterns of canopy–air temperature differences, the tea canopy and air temperatures were collected from 5 July 2022, to 12 July 2022. The average air temperature was 35.3 °C, and the average rainfall was zero.

2.2. Soil Physical Properties of Experimental Site

The classification of soil texture is based on the World Reference Base (WRB) soil classification system. The soil was collected from the experimental site at the depths of 0–10.0 cm, 10.0–20.0 cm, 20.0–30.0 cm, 30.0–40.0 cm, 40.0–50.0 cm, and 50.0–60.0 cm. The bulk density and saturated volumetric water content (VWC) were measured using the oven dry method. A laser diffraction particle size analyzer (Mastersizer 3000, Malvern Panalytical Co. Ltd., Malvern, UK) was used to measure the particle composition. The soil texture at a depth of 0~30.0 cm was sandy loam. At a depth of 30.0 cm to 60 cm, it was loam (Table 1).
In the 0–10.0 cm layer, the field capacity was 26.5%, accompanied by a bulk density of 1.34 g·cm−3. Moving to the 10.0–20.0 cm layer, the field capacity increased marginally to 27.1%, while the bulk density rose slightly to 1.36 g·cm–3. Similarly, in the 20.0–30.0 cm layer, the field capacity was 26.6%, with a bulk density of 1.38 g·cm–3. Notably, the maximal discrepancy in the field capacity reached 0.6%, with a minimal variance of 0.04 g·cm−3 in bulk density. Within the 30.0–40.0 cm layer, the field capacity was 25.9%, while in the subsequent 40.0–50.0 cm layer, it diminished slightly to 25.5%. In the 50.0–60.0 cm layer, the field capacity further decreased to 25.3%. The maximum variation in field capacity remained consistent at 0.6%.

2.3. Fertilizer Management during the Experiment

The total amount of nitrogen applied in routine fertilization is 23.0 kg per 667 m2, administered as base fertilizer in autumn and topdressing in summer, with a distribution ratio of 6:4. The only fertilizer used is urea, applied by trenching and soil covering. Fertilization is performed manually through broadcasting and rotary tillage in late October and early May each year, after pruning the tea trees. Tea plants were placed in a north–south row with a row spacing of 1.8 m. The VWC of experimental site was 28.5%. The pH of soil was 5.34. The organic matter content and ammonium nitrogen of soil was 14.26 g·kg−1 and 5.11 mg·kg−1, respectively. The available phosphorus and potassium were 11.32 mg·kg−1 and 203 mg·kg−1, respectively.

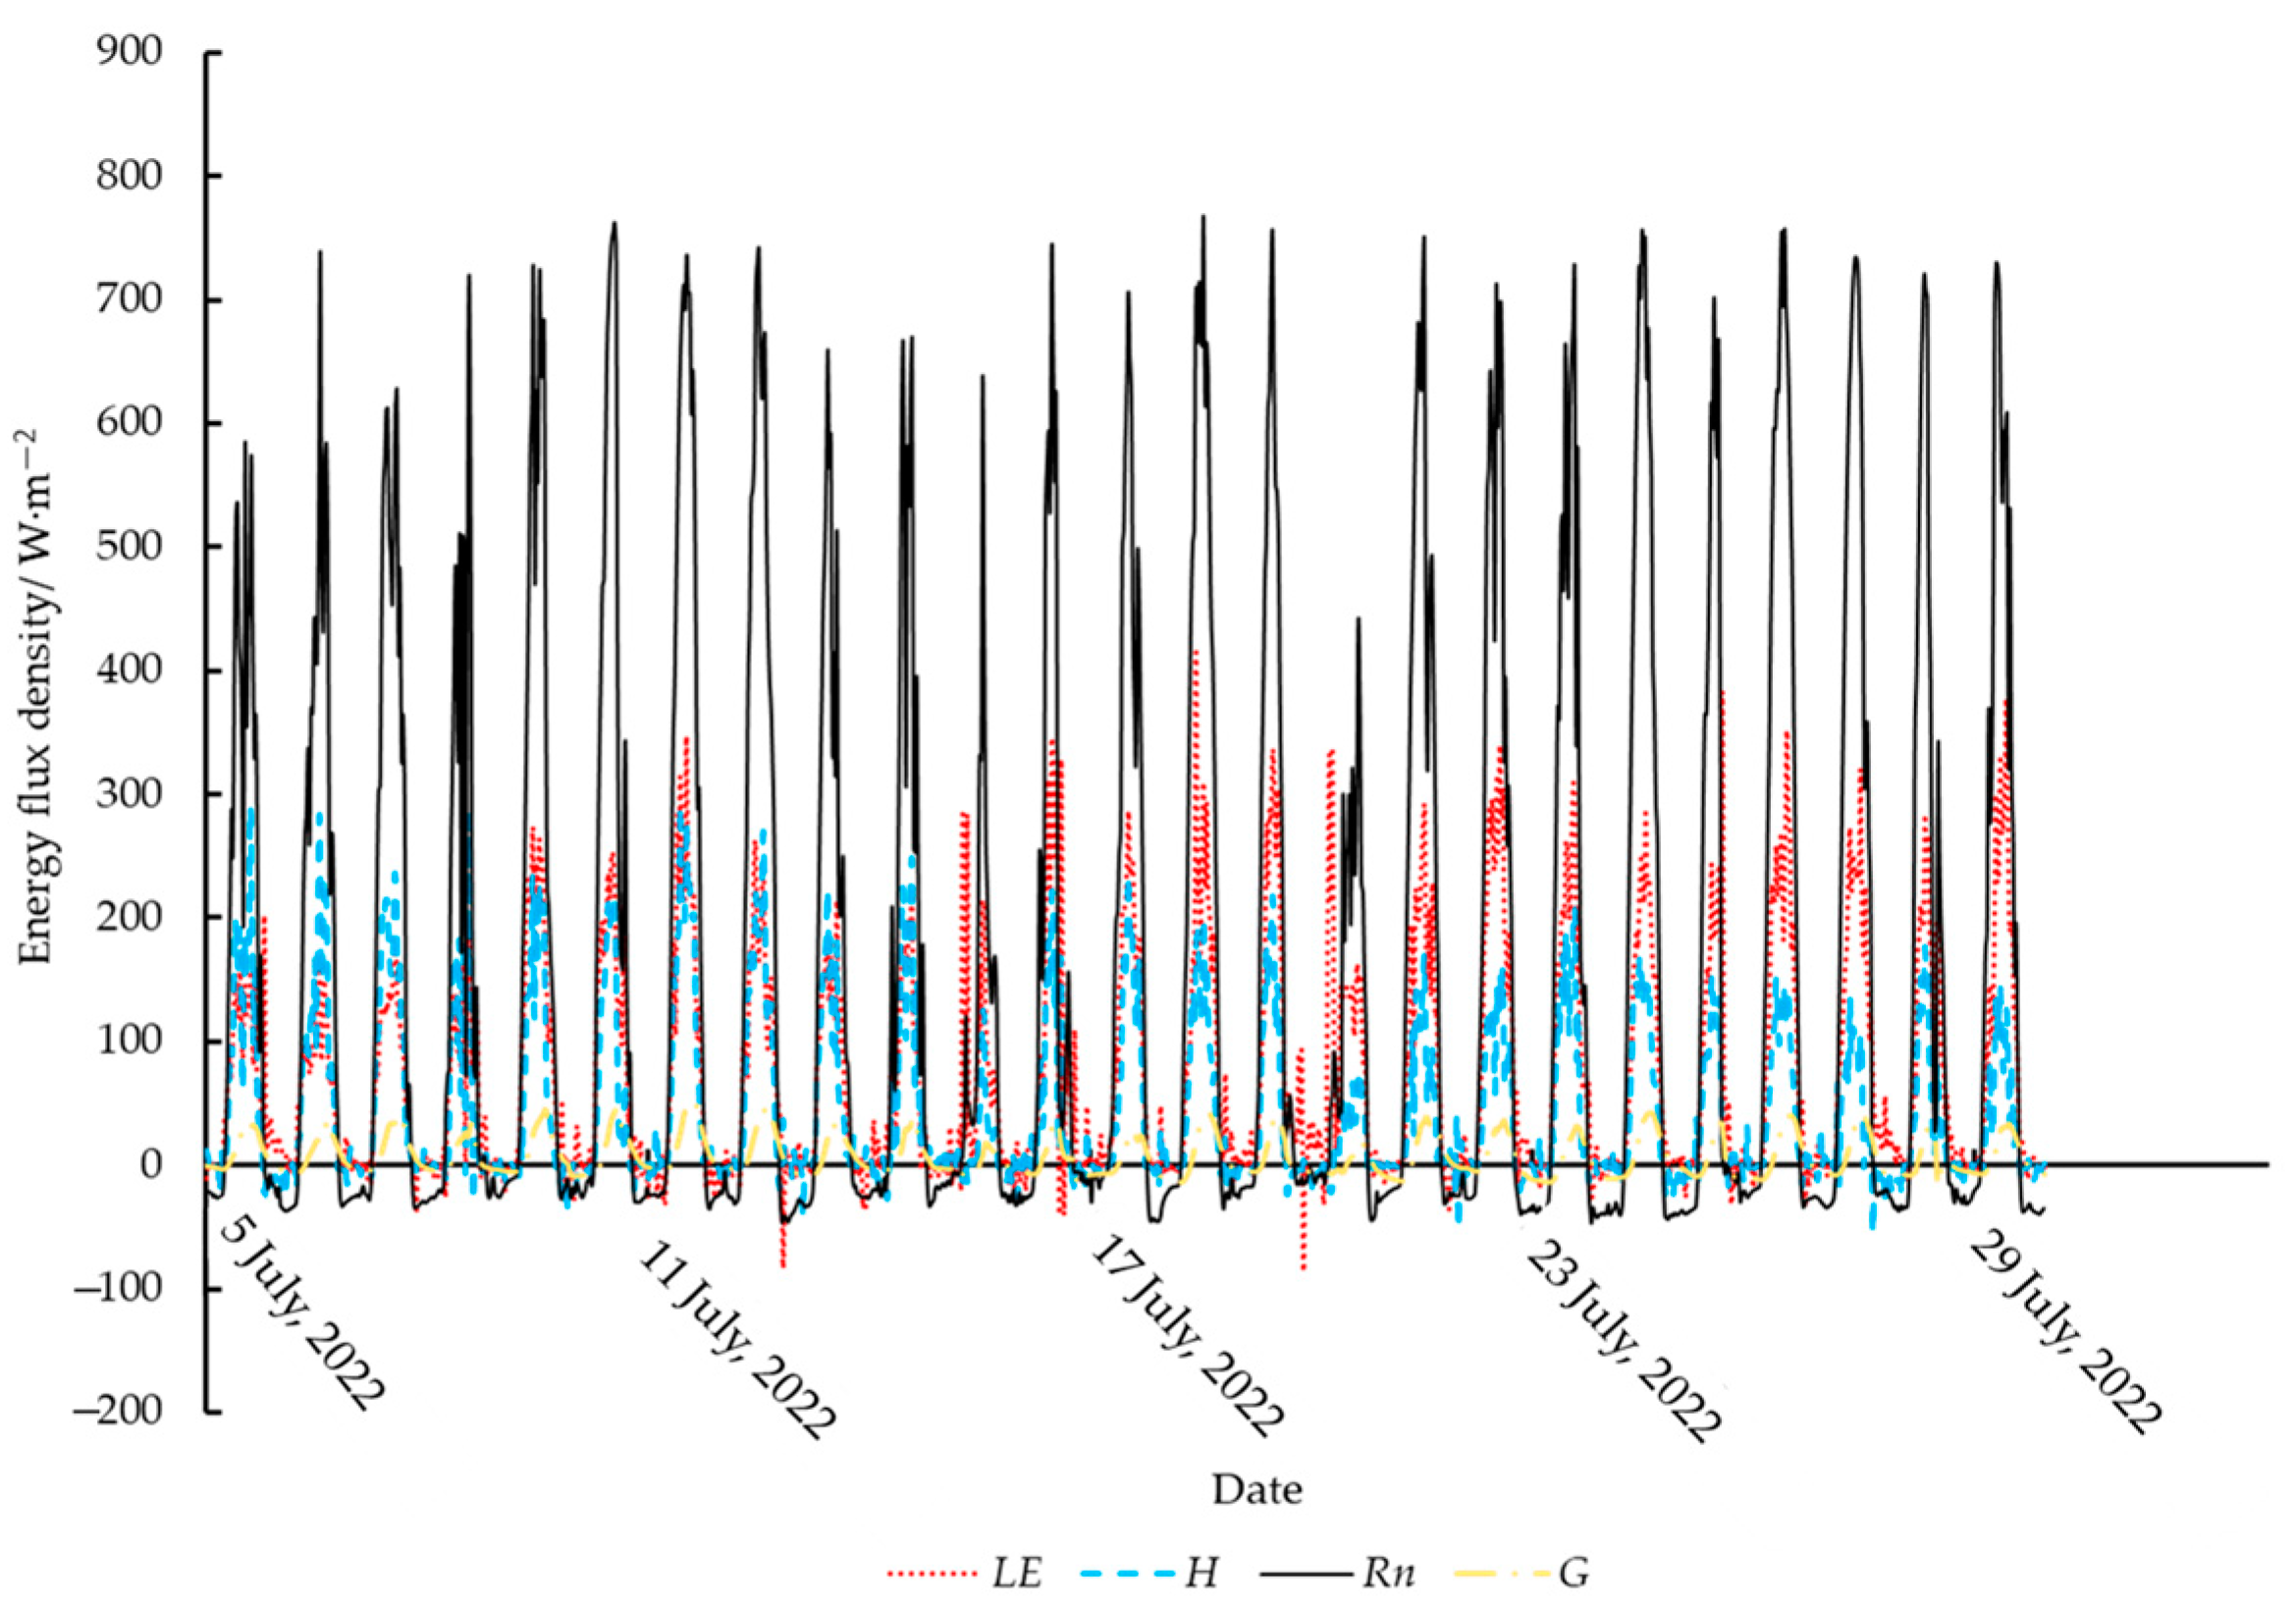
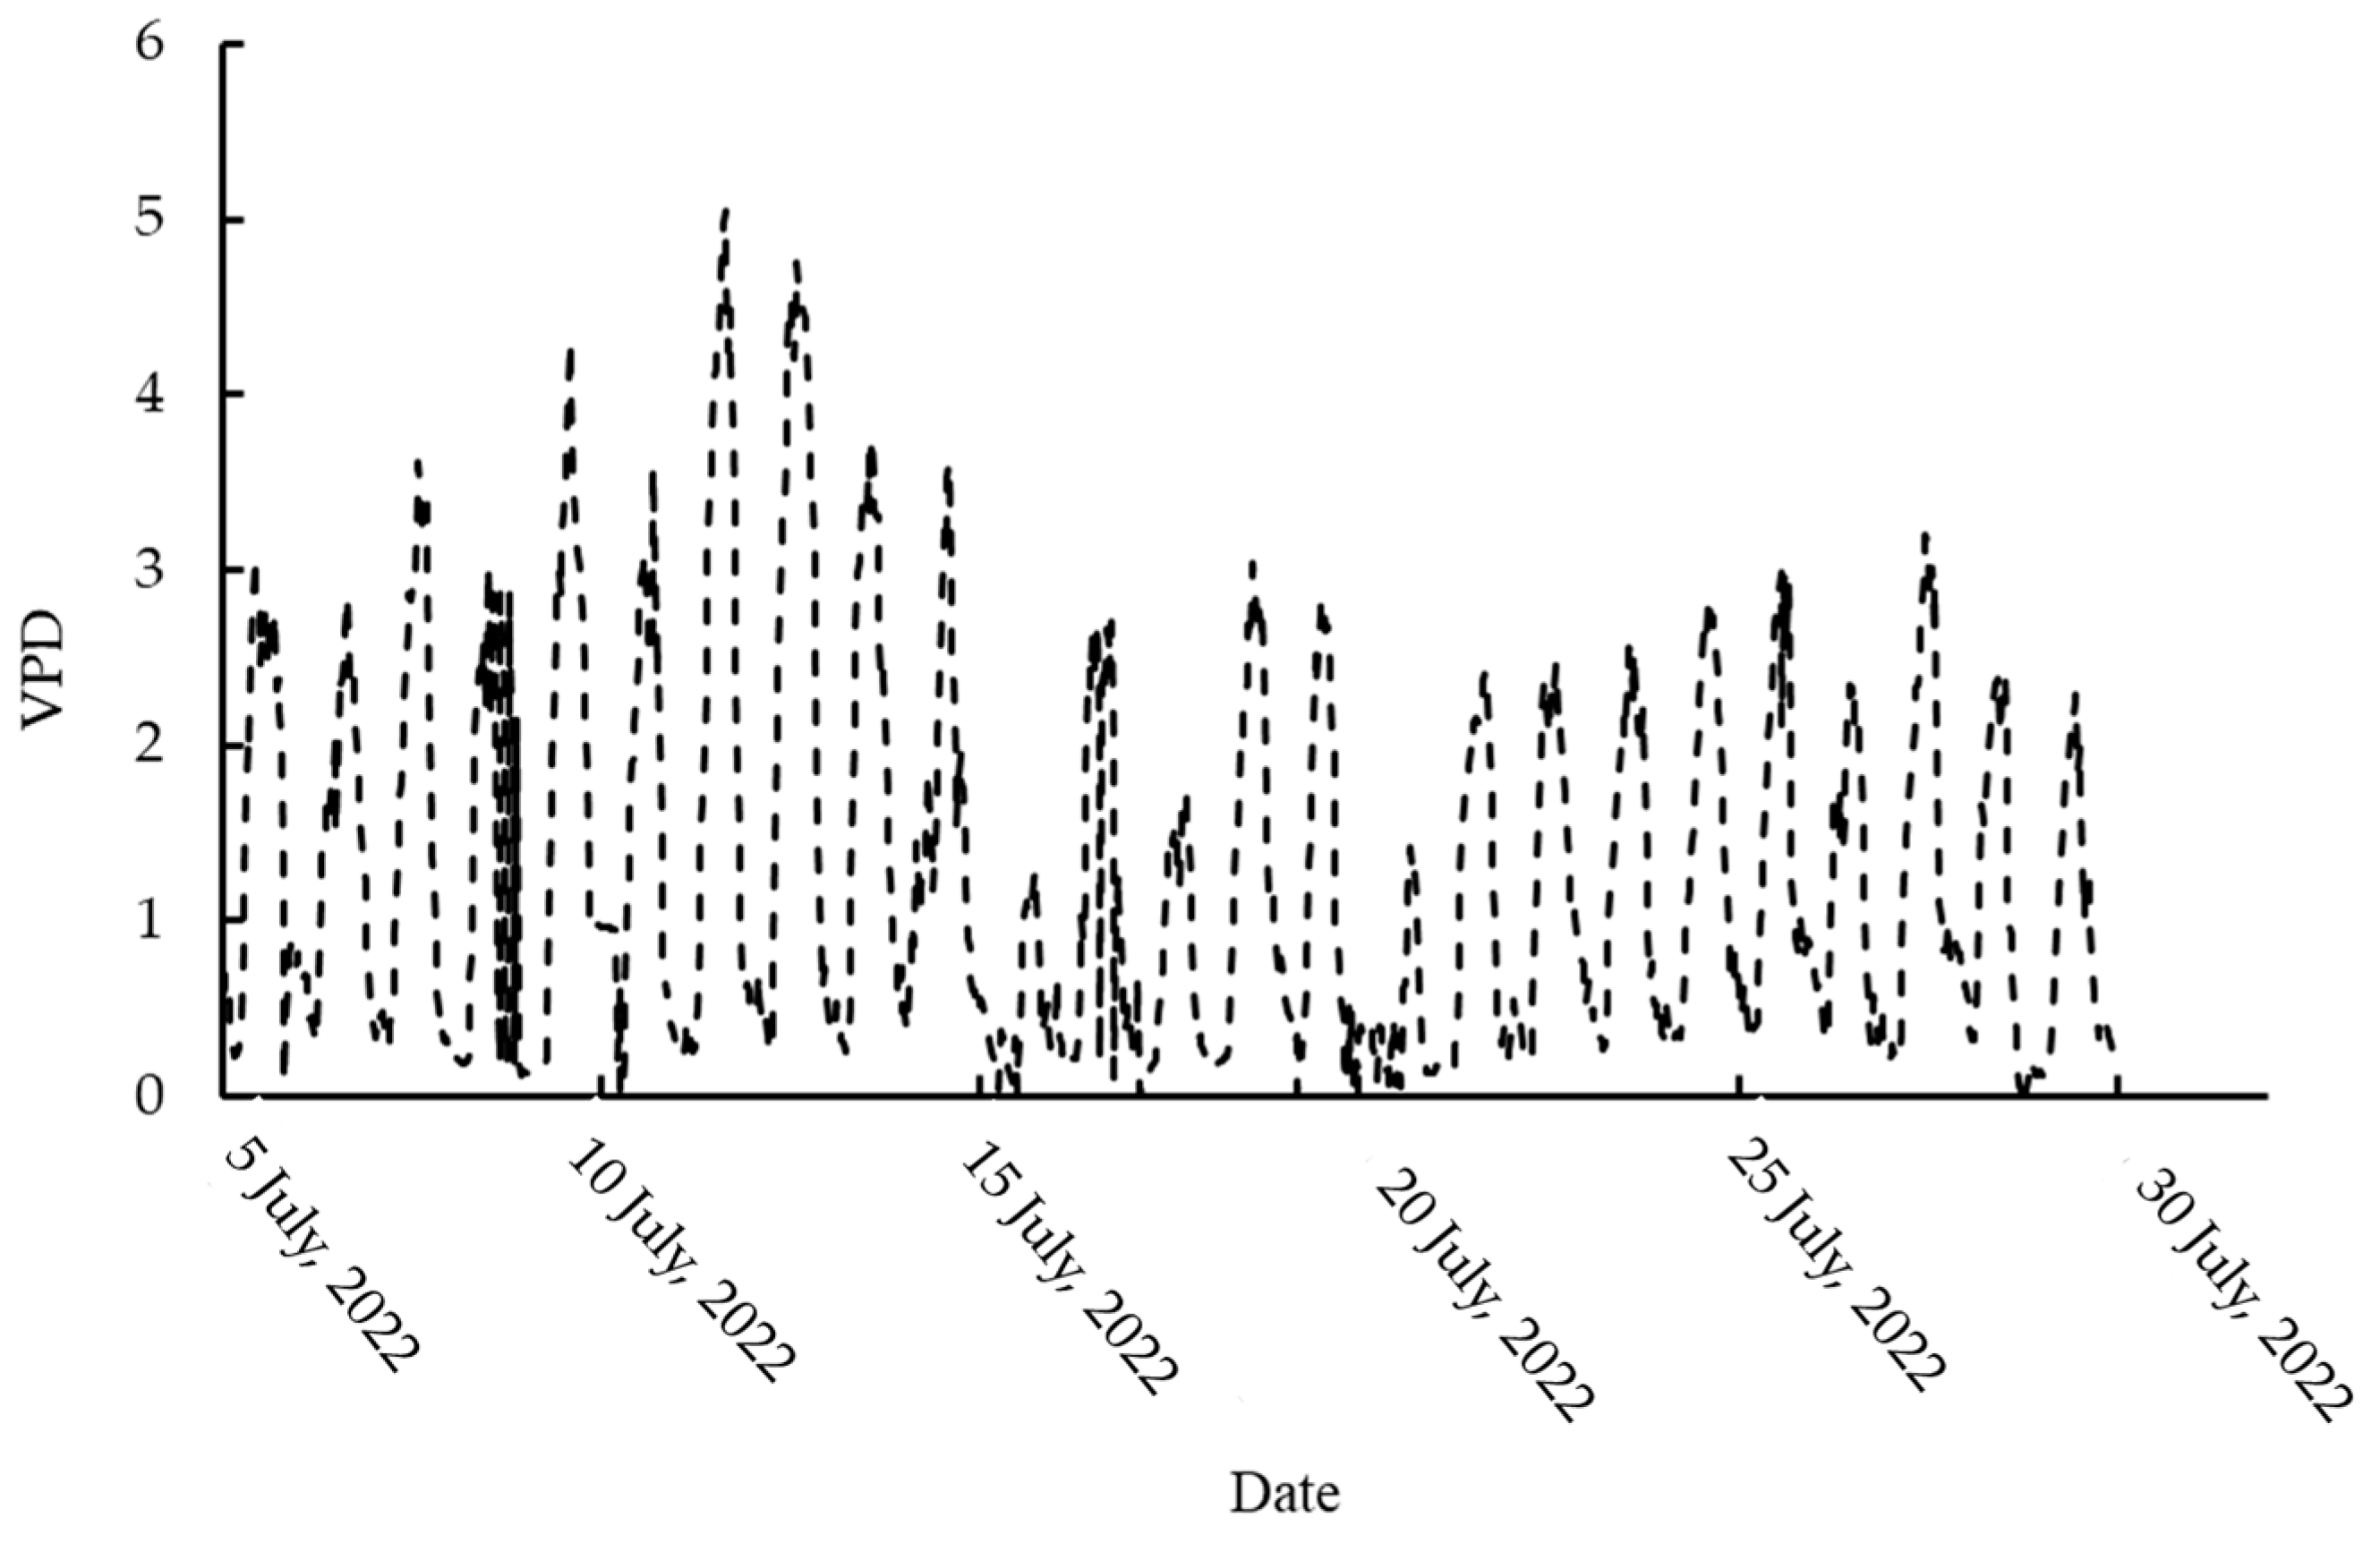
2.4. Micrometeorological Data Collection

The micrometeorological observation system consisted of a CR3000 data logger (CR3000, Campbell Scientific Co. Ltd., Logan, UT, USA), the air temperature and humidity sensor (HC2S3, Campbell Scientific Co. Ltd., Logan, USA), the four-component net radiation sensor (CNR4, Kipp & Zonen Co. Ltd., Delft, The Netherlands), the 3–D Sonic Anemometer (CSAT3, Campbell Scientific Co. Ltd., Logan, USA), the open–circuit CO2/H2O gas analyzer (EC150, Campbell Scientific Co. Ltd., Logan, USA), the soil heat flux plate (HFP01SC, Hukseflux thermal sensor Co. Ltd., Delft, The Netherlands), the air temperature and moisture sensor (HMP60–L, Campbell Scientific Co. Ltd., Logan, USA), the infrared thermometer (SI–111, Campbell Scientific Co. Ltd., Logan, USA), the soil thermocouple sensor (TCAV–L, Campbell Scientific Co. Ltd., Logan, USA), and the soil moisture sensor (CS655, Campbell Scientific Co. Ltd., Logan, USA) (Figure 2).
The thermocouple is positioned at a height of 1.2 m within the tea canopy, while the infrared radiometer is arranged 2.0 m above the canopy to measure the canopy temperature. The net radiometer sensor is placed at a height of 2.5 m above the ground to measure both downward and upward shortwave radiation (Rsd and Rsu), as well as downward and upward longwave radiation (Rls and Rlu). A three–dimensional sonic anemometer is positioned at a height of 2.5 m to measure the wind speed (u) and wind direction. The soil heat flux sensor is situated 5.0 cm below the surface to measure the soil heat flux (G). Additionally, two soil temperature and humidity sensors are placed at different depths (2.0 cm and 8.0 cm) to measure the surface soil temperature (Tsoil) and soil volumetric water content (VWC). The sensors are configured to collect data at a sampled frequency of 10 Hz. The output data were collected with an interval of 30.0 min.

2.5. Intercellular CO2 Concentration (Ci)

To investigate the diurnal variation patterns in the tea canopy–air temperature differences, canopy and air temperatures were selected in the period from 5 July 2022 to 11 July 2022. To determine the critical CWSI of tea, daytime microclimate data from 12 July 2022 to 29 July 2022 were collected. The Ci was selected as a parameter to characterize the irrecoverable threshold. The tea tree variety tested was “Maolu”, 10 years old, planted in a north–south row with a row spacing of 1.8 m.
The study was conducted in the experimental tea field on 15 July 2022, following approximately 15 days of sustained high temperatures without rainfall. Continuous drought treatment was applied to the experimental area by constructing a rain shelter, and the experiment spanned from 15 July 2022 to 29 July 2022, mainly under clear-sky conditions. A portable chlorophyll photosynthesis system (LI–6400XT, Li–COR Co. Ltd., Lincoln, NE, USA) was employed to monitor the Ci of tea plants under continuous drought stress for multiple days. The third or fourth functional leaf of tea was randomly selected for measurements, and the measured parameters were averaged three times around 14:00 each day. To mitigate the potential effects of midday rest observed in tea plants during summer, a repeated experiment was conducted on 21 December 2022, in the same tea plantation. The experimental tea field had experienced prolonged drought conditions since 1 December 2022 and exhibited noticeable drought stress on the day of the experiment.

2.6. Crop Water Stress Index (CWSI)

The CWSI was determined empirically as recommended by Idso et al. [32].
C W S I = T c T a T c T a l l T c T a u l T c T a l l
where Tc is the plant canopy temperature, °C; Ta is the air temperature; (TcTa)ll is the lower limit for water stress, °C; and (TcTa)ul is upper limit for full water stress of the plants, °C.
The theoretical model is based on the principle of energy balance:
R n = G + H + L E
where Rn is the net radiation, W/m2; G is the soil heat flux, W/m2; H is the sensible heat flux, W/m2; and LE is the latent heat flux, W/m2. Moreover, based on the theory of large-leaf models (single–layer models), H and LE can also be expressed as follows [29]:
H = ρ c p ( T c T a ) r a
L E = ρ c p ( e c e a ) γ ( r a + r c )
where ρ is the air density, kg·m3; Cp is the specific heat of air, J·kg−1·°C−1; e c is the vapor pressure of air, Pa; γ is the humidity constant, Pa·°C−1; ra is the aerodynamic resistance, s·m−1; and rc is the canopy resistance to water vapor transport, s·m−1.
Equations (2)–(4) are discretized. Since the value of soil heat flux is very small, accounting for less than 10% of the total net radiation, it can be directly ignored. At the same time, it is defined as e c e a / T c T a , to obtain the following equation:
T c T a = r a R n ρ c p γ ( 1 + r c r a ) Δ + γ ( 1 + r c r a ) e c e a Δ + γ ( 1 + r c r a )
where Δ is the slope of the saturation vapor pressure curve at T, MPa·K−1. Equation (5) relates the canopy–air temperature difference to the saturated vapor pressure difference, net radiation, aerodynamic drag, and canopy resistance to water vapor transport, providing a method for directly estimating the canopy–air temperature difference using micrometeorological parameters.
In the theoretical derivation, when the crop is subjected to very severe water stress, the canopy–air temperature difference will reach a maximum, and transpiration can be considered to be completely inhibited; the canopy’s resistance to water vapor transport reaches infinity (lim rc → ∞), which is the upper limit of the canopy–air temperature difference, and can be expressed by Equation (6):
T c T a = r a R n ρ c p
When the crop is fully irrigated, its transpiration will not be limited in any way, and the theoretical canopy resistance to water vapor transport will be zero, which is the lower limit of the canopy–air temperature difference, and Equation (5) can be expressed as follows:
T c T a = r a R n ρ c p γ Δ + γ e c e a Δ + γ
From Equations (5) and (7), the canopy–temperature difference is linearly related to the saturated water vapor pressure difference (VPD = e c ea). When fully irrigated, rc will be small but not zero, and it is necessary to use the canopy resistance to potential evapotranspiration (rcp) as the canopy resistance rc at the lower baseline, so rcp = rc is often used in calculations [33,34,35]. Then, Equation (5) can be expressed as the following equation and can be used [36,37]:
T c T a = r a R n ρ c p γ ( 1 + r c p r a ) Δ + γ ( 1 + r c p r a ) e a e a Δ + γ ( 1 + r c p r a )
Δ = 45.03 + 3.014 T + 0.05345 T 2 + 0.00224 T 3
where T is the average of the air temperature above the canopy and the canopy temperature (Tc + Ta)/2, °C.
The air resistance ra can optionally be calculated under neutral conditions (surface temperature approximately equal to the air temperature) [35]:
r a = ln 2 z d 0 z 0 κ 2 u ( z )
where, κ is Carmen’s constant, laboratory and atmospheric near–surface layer measured values are between 0.35 and 0.43, the present study took 0.40; d is the zero–plane displacement, generally 0.65 times the height of the canopy layer [35]; u(z) is the wind speed at height z, m·s−1; and z0 is the roughness length, which is approximately 0.123 times (0.06 to 0.14) the canopy height, m.
Canopy resistance and air resistance can be derived from the Penman–Monteith formula:
r c = r a Δ R n G + ρ c p ( e s e a ) r a L E ( γ + Δ ) γ L E
According to the modified Tetens formula [28], the saturated water vapor pressure expression is as follows:
e ( T z ) = 0.6108 exp ( 17.27 T z T z + 237.3 )
where, Tz is the air temperature at the height, K.

3. Results

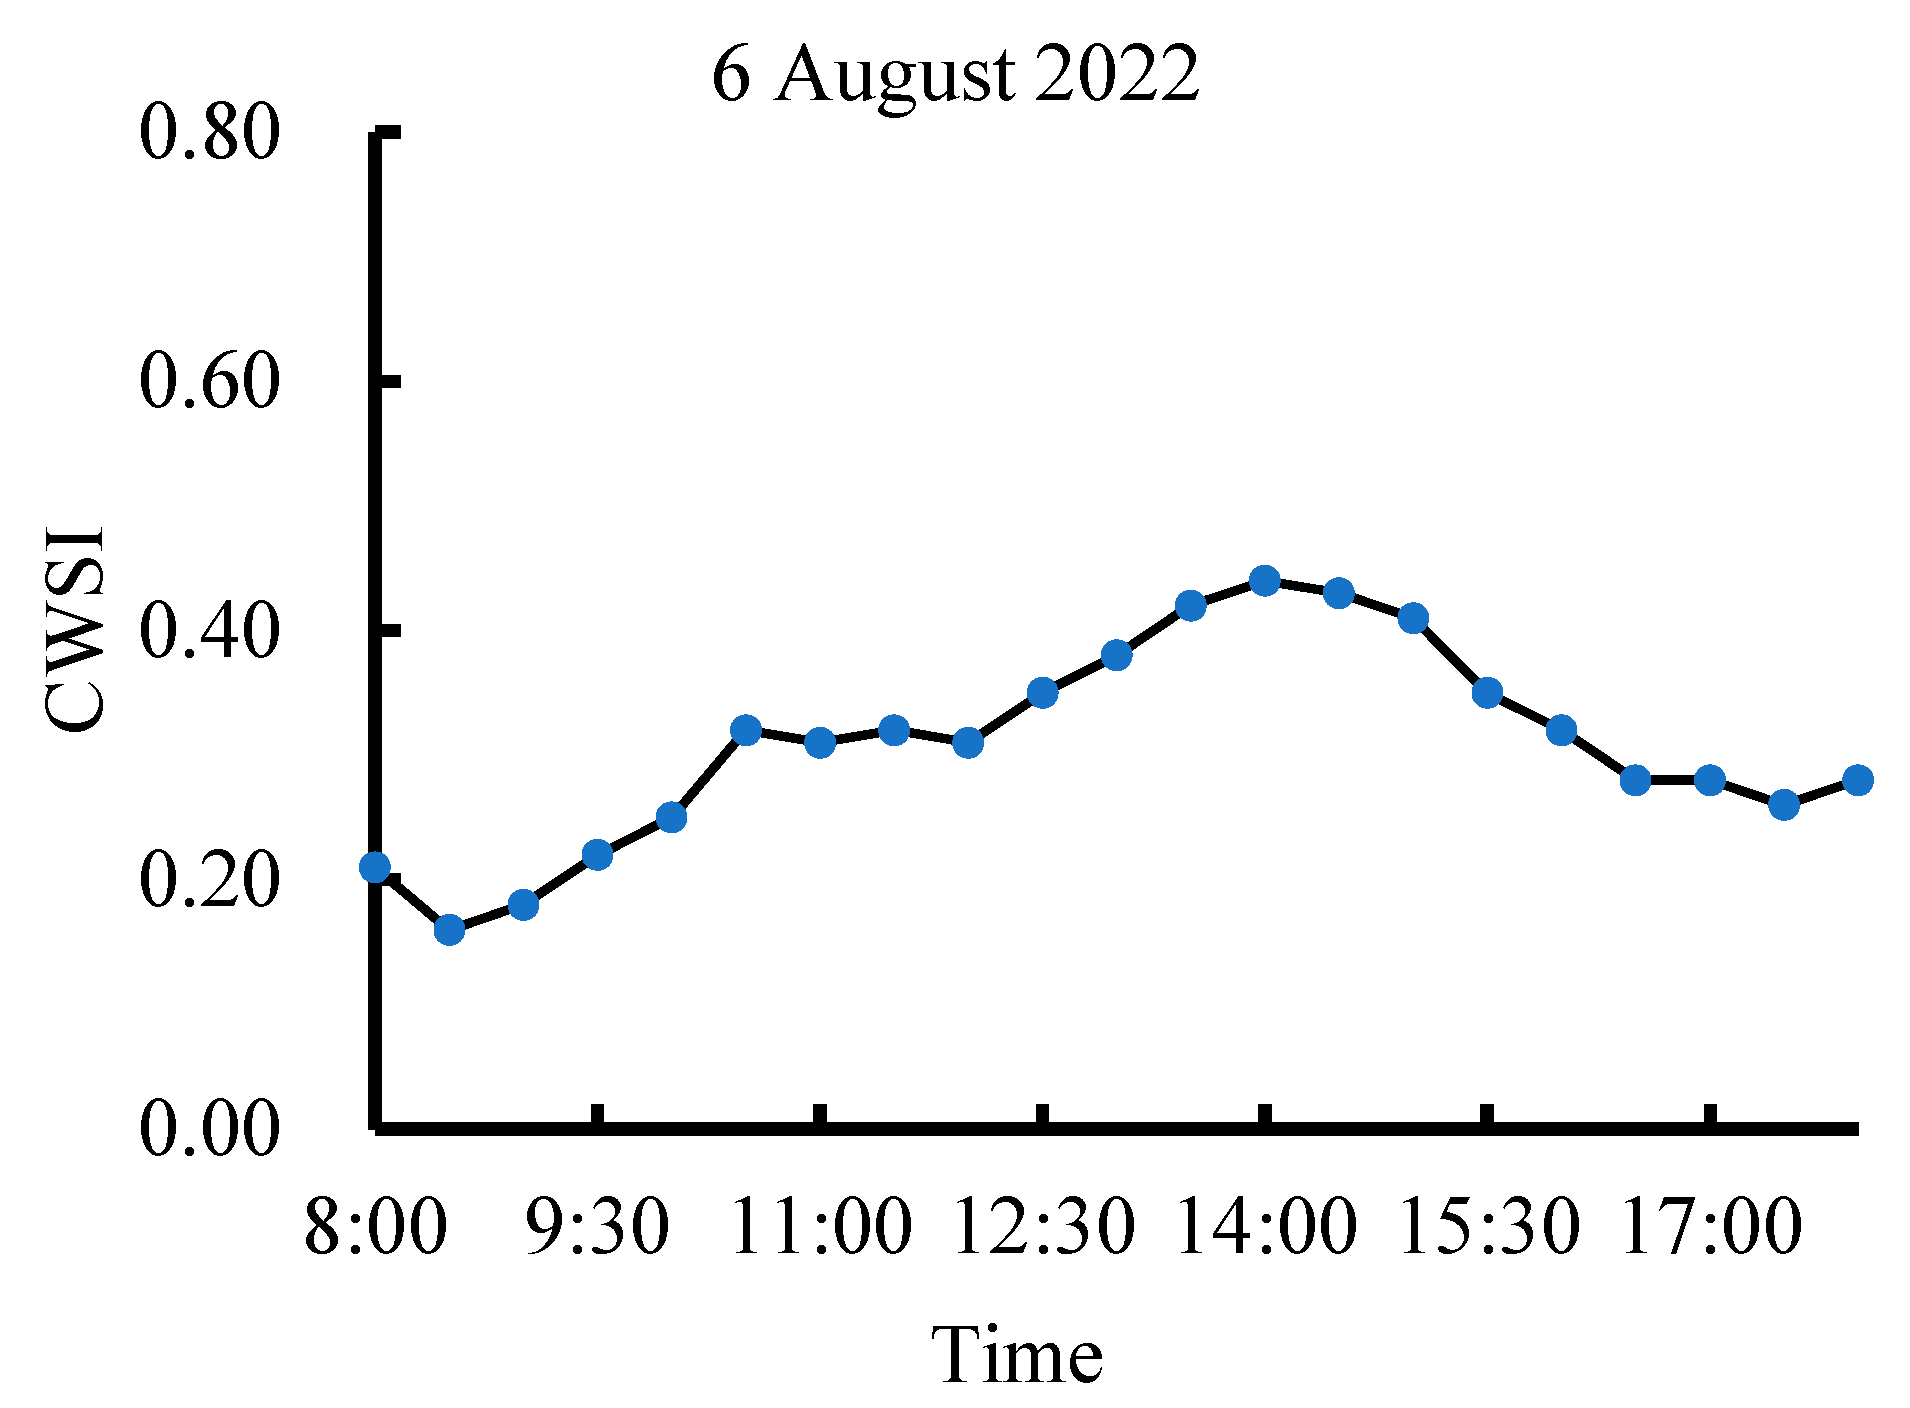
3.1. Variations in the Diurnal Canopy–Air Temperature Difference of Tea Plants

The background detailed micrometeorological data during the field experiment are shown in the Figure 3, Figure 4 and Figure 5. During drought conditions, the intensity of LE is significantly higher than that of H. The increased Rn is primarily converted into LE, causing its daily maximum to occur at around 13:00. This suggests that the increase in LE is associated with the onset of drought. Additionally, the rise in Ta and VPD enhances the transpiration rate of tea trees, further increasing the intensity of LE.
The canopy–air temperature difference can be directly calculated using microclimate parameters, such as differences in the saturated vapor pressure, net radiation, aerodynamic resistance, and canopy resistance to water vapor transport. During 5 July 2022 to 11 July 2022, the daily trend of the canopy–air temperature difference exhibited a consistent pattern and remined stable with minimal fluctuations during the night and gradually increased after sunrise. The canopy–air temperature difference peaked between 11:00 and 15:00 each day, gradually decreased thereafter, and reached its minimum during the night. The diurnal variations were more pronounced compared to the nocturnal period (Figure 6).
From 5 July 2022 to 11 July 2022, the maximum differences between the canopy and air temperatures were 3.52 °C, 3.06 °C, 2.51 °C, 2.61 °C, 2.55 °C, 3.05 °C, and 3.86 °C, occurring at 12:00, 13:00, 15:00, 14:00, 12:00, 14:00, and 13:00, respectively. The timing of the maximum canopy–air temperature difference was influenced by weather conditions. In clear weather, it occurred at around noon at 12:00. In cloudy or overcast conditions, it was delayed by approximately 2.0 h. This indicates that under high temperatures and strong solar radiation, the maximum canopy–air temperature difference tends to occur at 14:00. This phenomenon is attributed to the combined effects of solar radiation, ambient temperature, and crop transpiration.

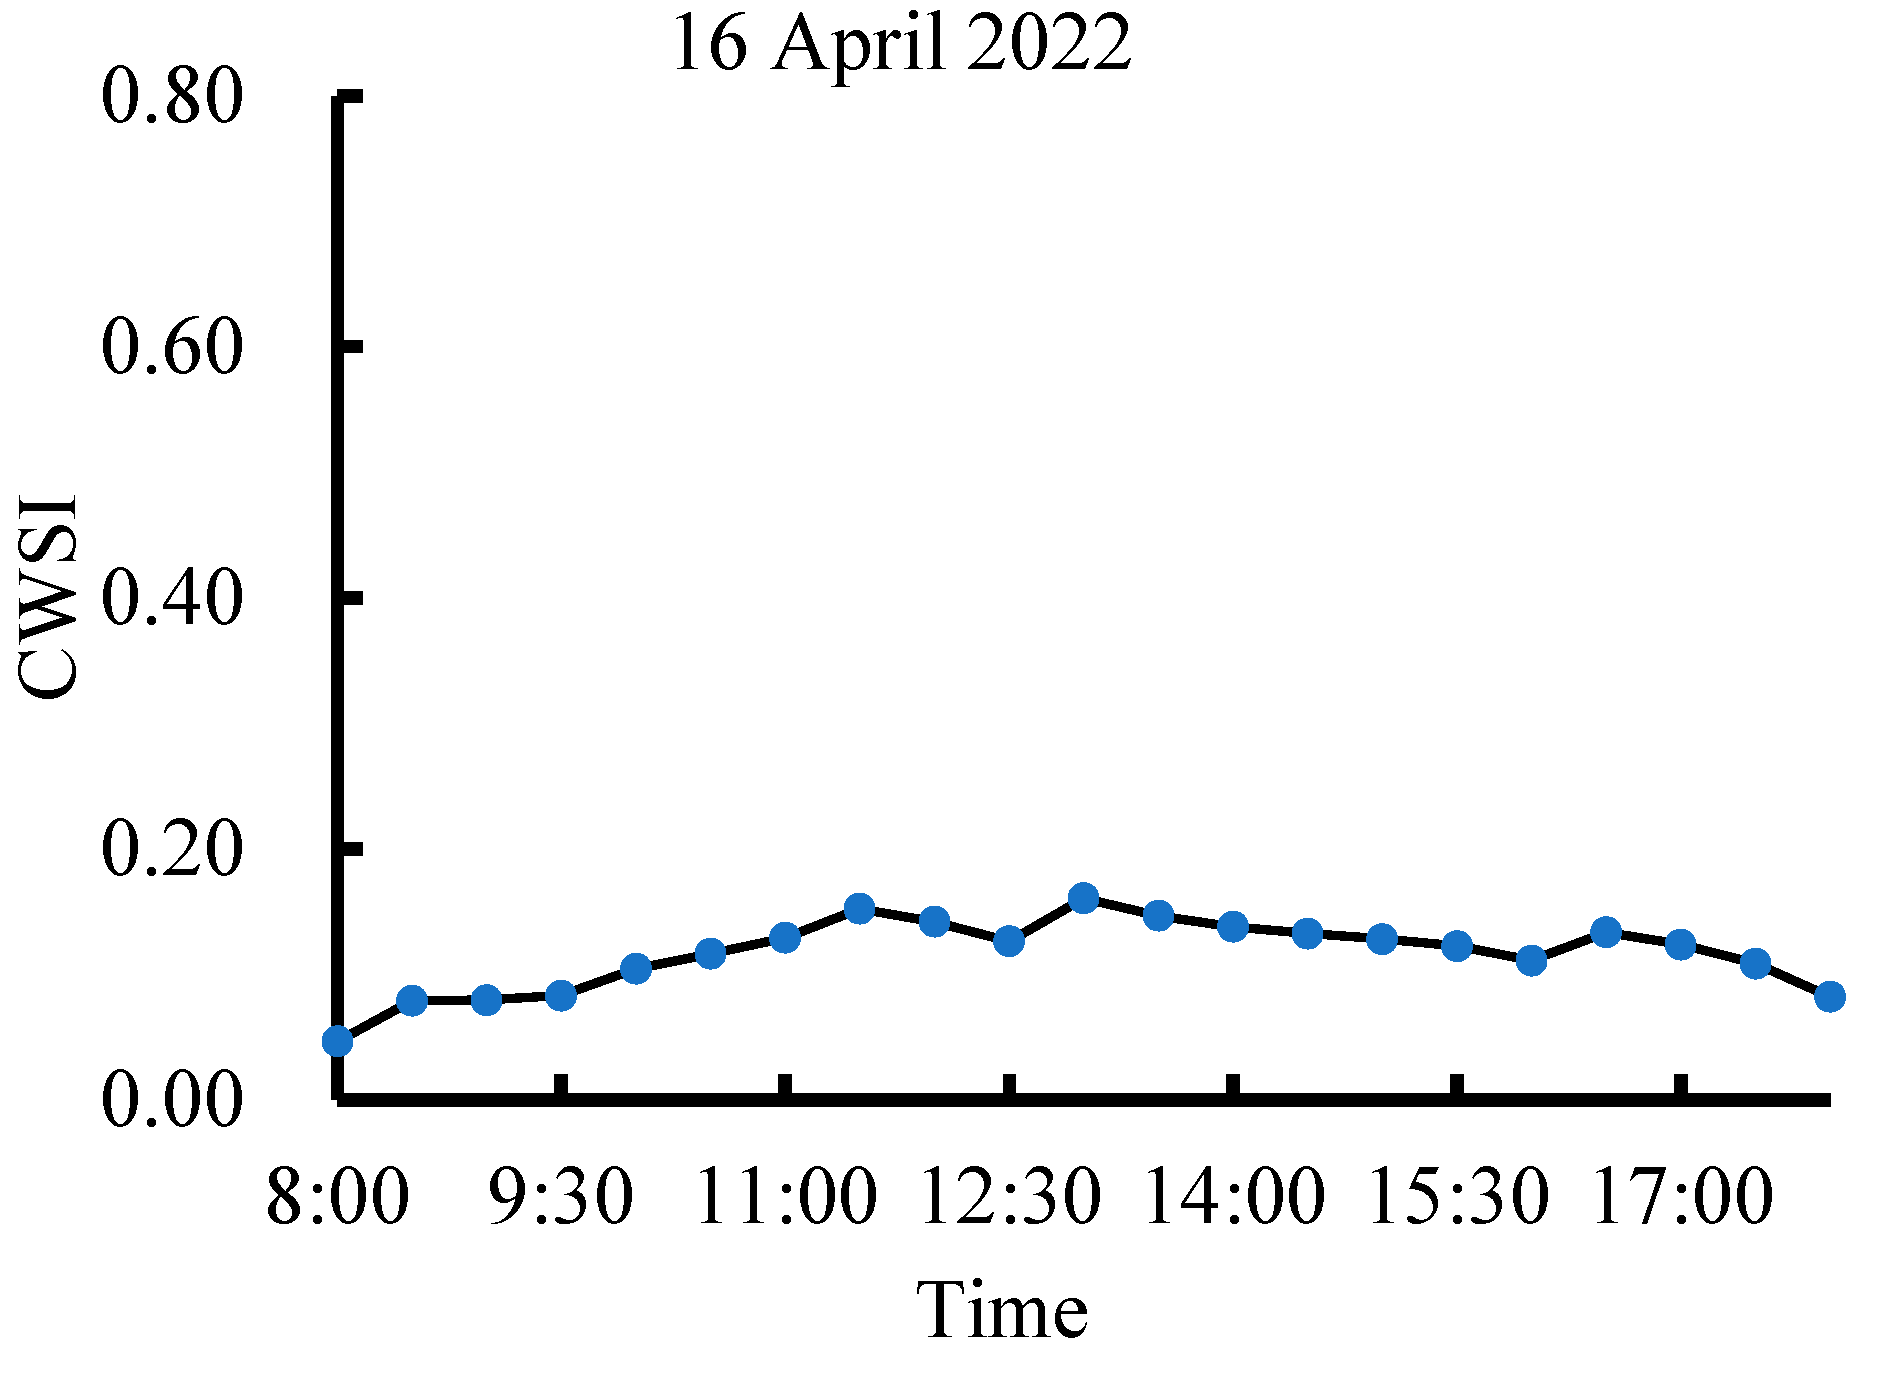
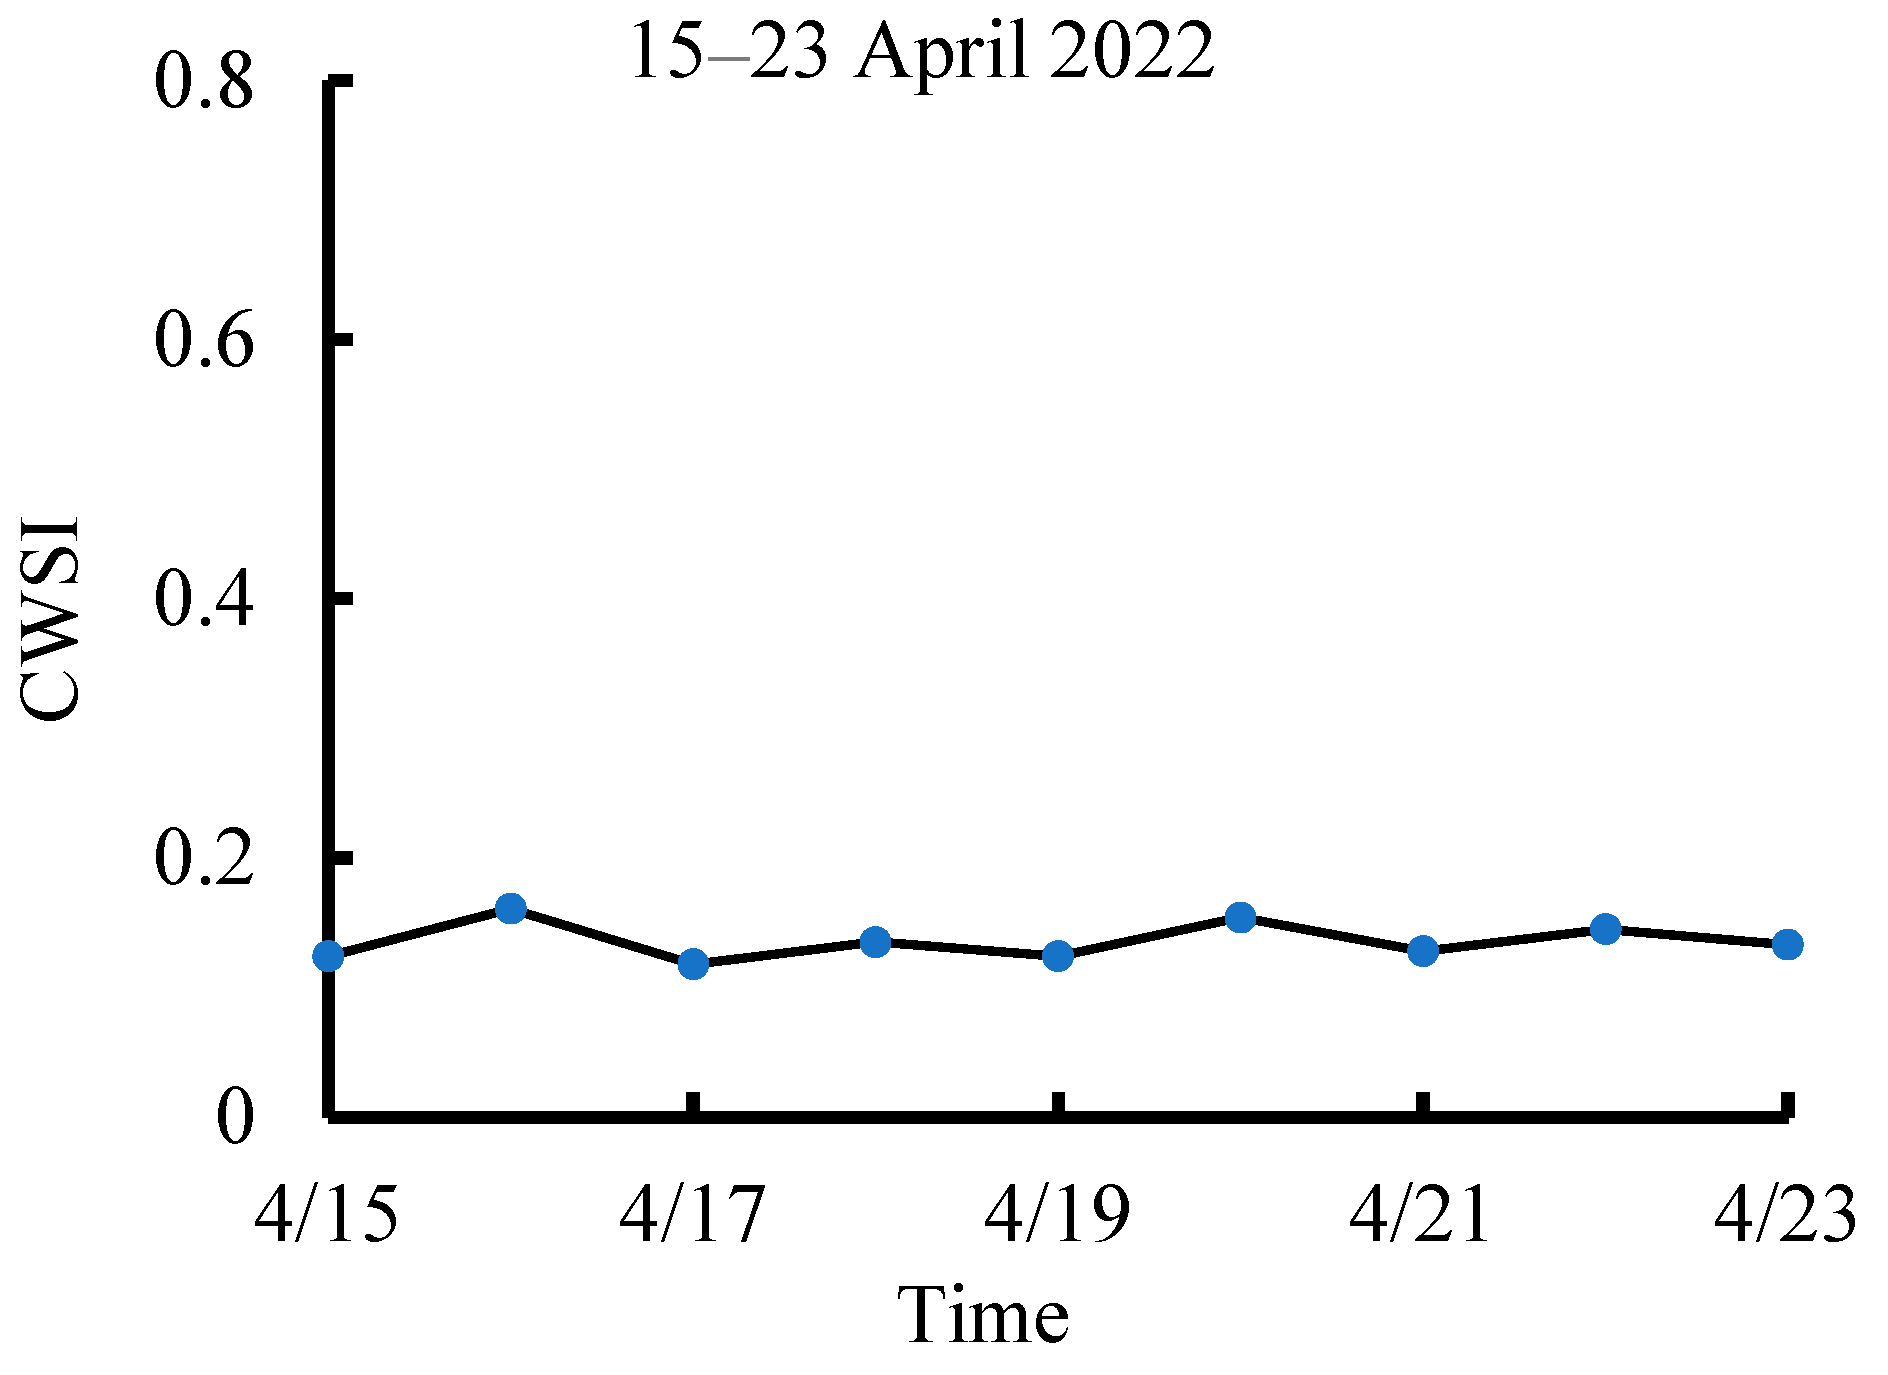
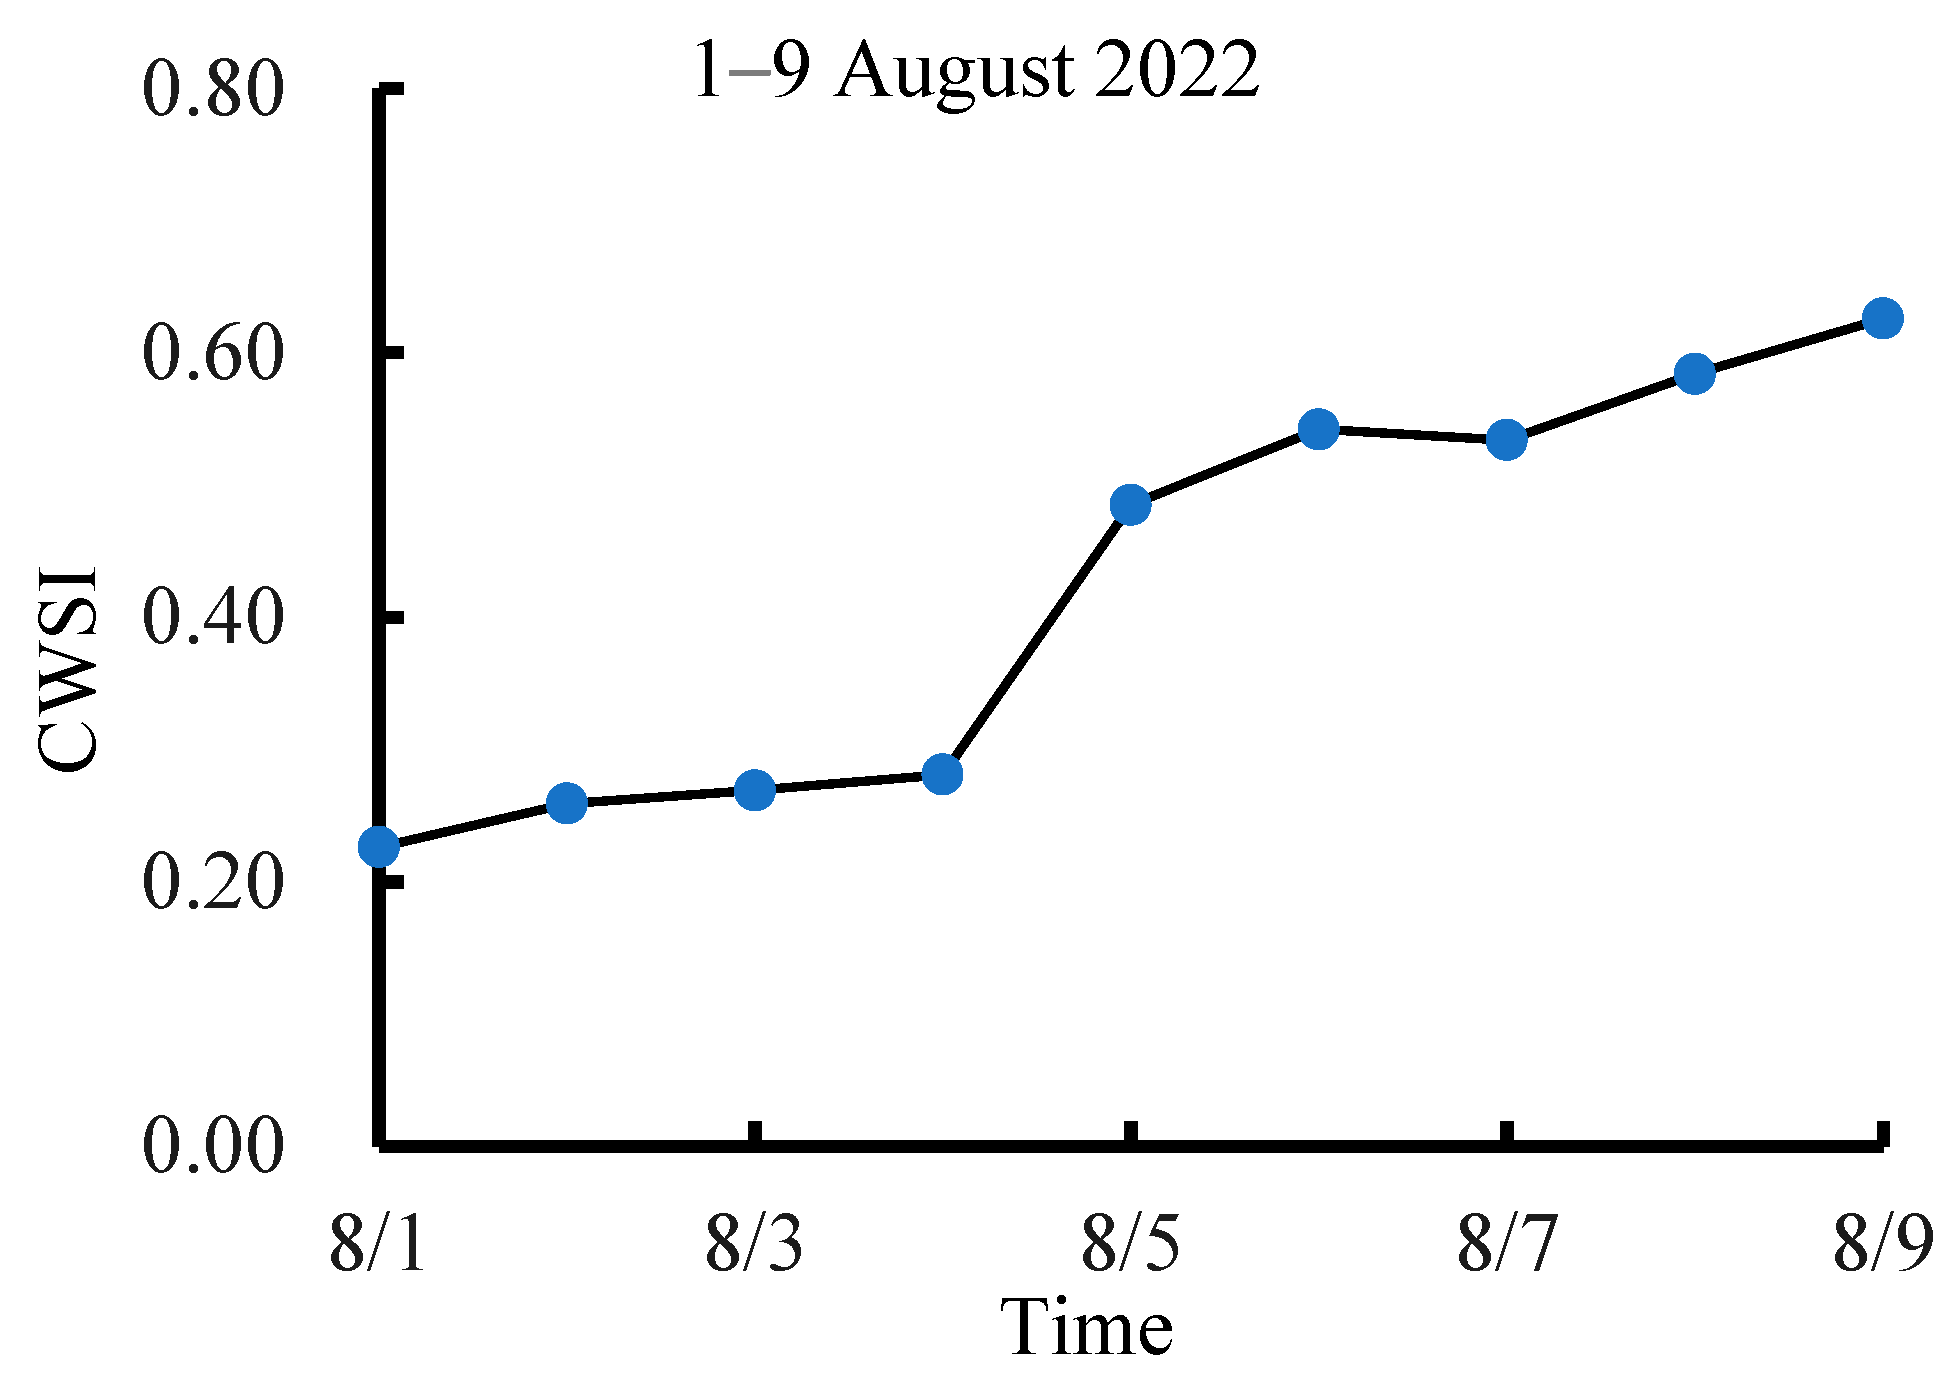
3.2. Dynamic Change in CWSI Characteristics at Different Growth Stages of Tea Plants

During the spring famous tea harvest season, the trend of the CWSI was the same as that of the canopy–air temperature difference, displaying an initial increase followed by a subsequent decline. The values ranged from 0.047 to 0.082, with a notable morning minimum of 0.047 and a peak at 13:00 with a CWSI value of 0.161, signifying the highest level of stress during the day (Figure 7).
For the summer drought season, the value of the CWSI exhibited a continuous rise over time, closely resembling the canopy–air temperature difference. Rapid warming in the early morning and fast evaporation of air moisture during the day contributed to an overall higher CWSI level for tea plants during experimental period. The values ranged from 0.21 to 0.28, and a noticeable peak occurred at 8:30, surpassing the peak CWSI value of the tea harvest season in spring. Additionally, CWSI values for tea plants in the summer exhibited a greater fluctuation range, reaching a difference of 0.28 (Figure 8).
Under conditions of moderate temperature and limited water evaporated, the CWSI of tea plants exhibited a narrow range of fluctuation during the spring famous tea harvest season. The values ranged from 0.124 to 0.161, and this indicated slight variations throughout the day (Figure 9).
In the severe high–temperature and drought period in the Zhenjiang region, intense evaporation and substantial field water loss contributed to a daily increasing trend in the CWSI. The typical day that we selected represents a specific manifestation of tea plants experiencing severe water stress (6 August). From 1 August to 9 August, the CWSI values progressively increased to 0.226, 0.259, 0.269, 0.281, 0.485, 0.542, 0.534, 0.584, and 0.626 (Figure 10).

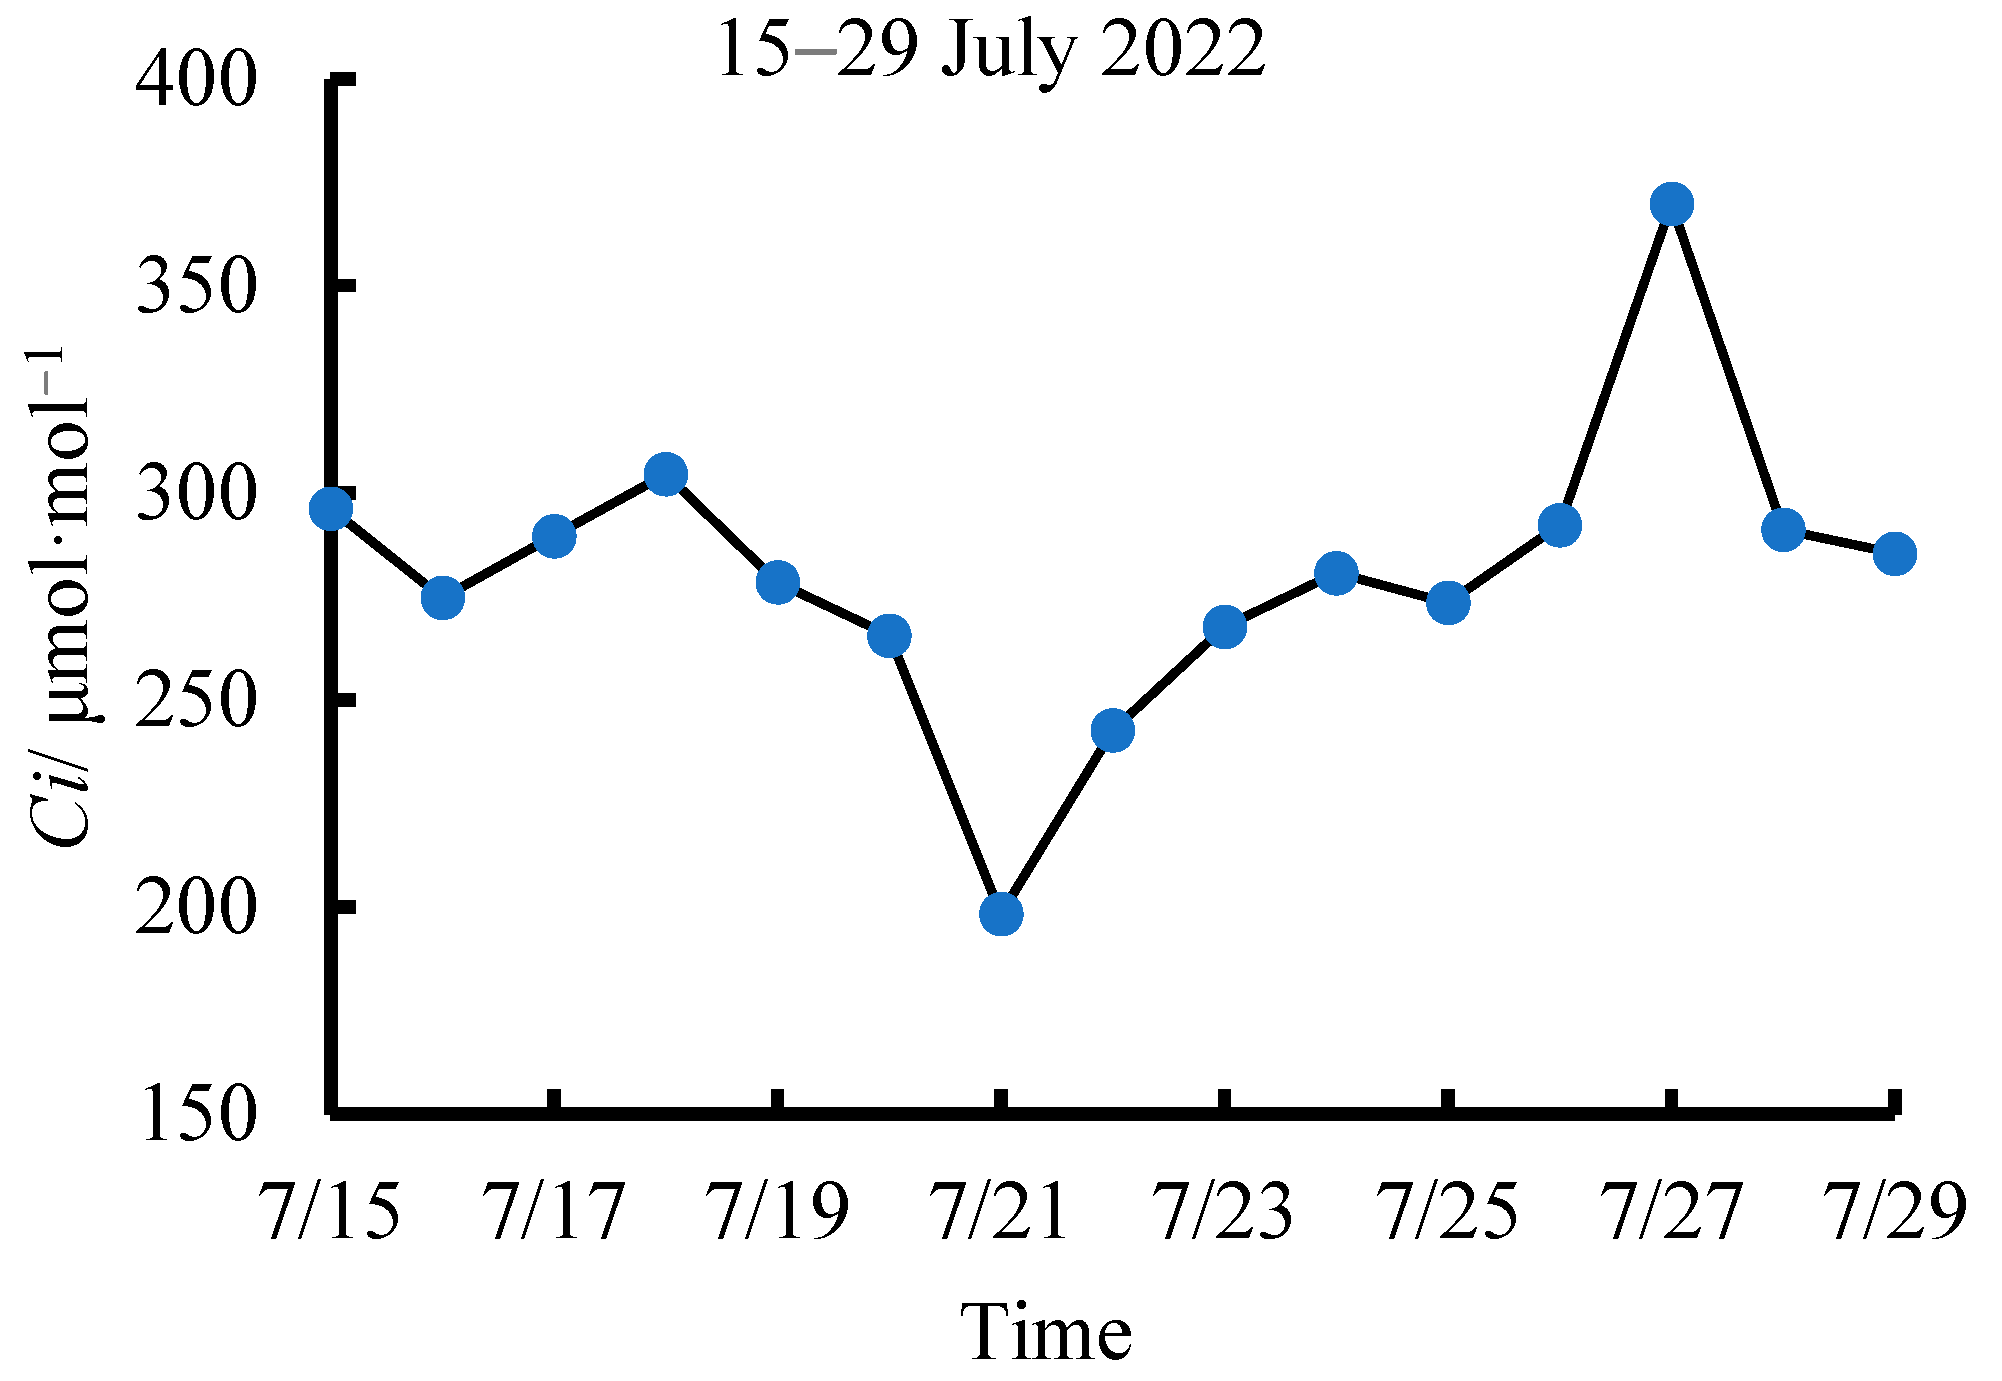
3.3. Determining the Critical CWSI Based on Ci

When utilizing the CWSI as a guide for tea plantation irrigation timing, it is necessary to assume the existence of a critical threshold in the time-varying CWSI that characterizes a state of irreparable damage. During photosynthesis in tea plants, stomata are in an open state, allowing intercellular CO2 to enter chloroplasts for photosynthesis. Under sufficient light, the photosynthetic rate exceeds the respiration rate, leading to a decline in Ci. However, as tea plants begin to experience drought stress, stomatal closure occurs, and stomatal conductance (Gs) decreases with the severity of stress. This results in a reduction in the influx of CO2 into cells. Although photosynthesis is less affected and the consumption of CO2 remains relatively constant, the Ci decreases. As water stress intensifies, damage to the chloroplast structure inhibits photosynthesis, leading to a decrease in CO2 consumption. Consequently, Ci exhibits a phenomenon of an initial decline followed by an increase. This observation provides a basis for determining the critical CWSI; the severity of water stress, stomatal conductance, and photosynthetic activity are key to the dynamics of Ci [38,39].
During the period of continuous drought from 15 to 29 July, the dynamics of the intercellular CO2 concentration changed and Ci values fluctuated around 300.0 μmol·mol−1 on 15 July. A gradual decline commenced on the day of the 18th and reached a minimum of 198.0 μmol·mol−1 between the 20th and 21st. Subsequently, a slow increase in Ci began from the 21st and returned to around 300.0 μmol·mol−1 by the 26th. A sharp increase to approximately 360.0 μmol·mol−1 was observed on the day of the 26th and 27th. Following this observation, thorough irrigation was administered on the evening of the 27th. This revealed a decline in Ci, which returned to around 300.0 μmol·mol−1 on the following day (28 July). The depicted phenomenon demonstrates the impact of irrigation on Ci during a period of prolonged drought (Figure 11).
During the prolonged period of high temperatures with the daily maximum temperature consistently exceeding 35.0 °C, except on the 26th, the weather was cloudy and overcast with an air temperature of approximately 31.5 °C. However, Ci remained relatively stable, showing no significant fluctuations compared to the previous day (Figure 12).
During the continuous drought period, the CWSI generally exhibited a gradual upward trend, with a slight decrease observed only on 18 July due to overcast conditions and a slightly lower air temperature (Ta was around 31.5 °C). Subsequently, the occurrence of several days of high temperatures led to a progressive increase in the tea plant CWSI. After thorough irrigation on 27 July, a noticeable decrease in the CWSI was observed on 28 July, indicating a reduction in the level of water stress. This trend was consistent with the dynamic changes observed in Ci, as mentioned earlier (Figure 13).
To mitigate the potential impact of midday stomatal closure on experimental results, a repeated experiment was conducted under continuous drought conditions during winter (21 December 2022). The results revealed that the dynamic changes in Ci exhibited a similar trend to the experiment conducted during the summer (15 July 2022 to 29 July 2022) (Figure 14). Both experiments showed an initial fluctuation followed by a decline, reaching a low point before gradually rising. The distinction lied in the delay of one day in the onset of the rise after reaching the low point during the winter experiment. This delay may be attributed to the lower evaporation rate and less severe drought stress during the winter compared to the summer. As drought intensified, Ci increased instead of decreasing, and this indicated a direct impact on the leaf photosynthetic capacity due to a reduced water supply.
Based on the experimental data from 15 July 2022 to 29 July 2022, 27 July was identified as the turning point for Ci. Utilizing the microclimate parameters on that day and Equations (6)–(12), the upper baseline was calculated as 13.9 and the lower baseline as 3.4, resulting in a CWSI of 0.27. This value was determined to be the critical CWSI for irrigation in the tea fields (Figure 13).

4. Discussion

The canopy temperature (Tc) provides valuable information for assessing water deficits in crops. In this experiment, the increase in the canopy–air temperature difference was strongly correlated with escalating stress levels. This finding aligned with previous studies that observed similar results for cotton under varying irrigation schedules [14,16,40,41].
As shown in Figure 6, from 5 July 2022 to 11 July 2022, the maximum differences between the canopy and air temperatures were 3.52 °C, 3.06 °C, 2.51 °C, 2.61 °C, 2.55 °C, 3.05 °C, and 3.86 °C, occurring at 12:00, 13:00, 15:00, 14:00, 12:00, 14:00, and 13:00, respectively. This indicated that under high temperatures and strong solar radiation, the maximum canopy–air temperature difference tended to occur at 14:00, consistent with observations for other crops [42,43,44,45]. The daily variation in the CWSI showed a pattern of being low in the morning and evening but high at noon. Under sustained drought stress, the CWSI exhibited a day-to-day increase, which aligned with the diurnal and daily changes observed in the CWSI for olive trees [46]. Similarly, the CWSI for cotton under different irrigation treatments also demonstrated a gradual increase under prolonged stress [40]. Kirnak et al. observed that the CWSI of pumpkins was significantly higher under water deficit conditions compared to well-irrigated plants across different irrigation levels [36].
Diurnal temperature fluctuations significantly affect the CWSI and Ci in plants, including tea. As temperatures rise during the day, plants experience increased transpiration and potential water stress, leading to a higher CWSI [47]. Elevated daytime temperatures typically result in higher evaporation rates and increased water demand, causing stomatal closure to conserve moisture. This closure reduces CO2 influx into the leaves, thereby decreasing Ci. Conversely, cooler nighttime temperatures reduce water stress, allowing stomata to open and stabilize Ci [48]. Consequently, daily temperature fluctuations directly impact the plant water status and gas exchange processes, which are crucial for developing effective irrigation strategies based on the CWSI and Ci dynamics [49].
The shift from stomatal limitation (SL) to non-stomatal limitation (NSL) in photosynthesis is an important physiological response to severe drought stress. This transition marks a shift in crop production constraints from environmental to physiological and ecological factors, providing a critical indicator of drought conditions. The accurate identification of SL and NSL in crop photosynthesis is essential for assessing and classifying crop drought stress. In tea plants, the direction of Ci variation under prolonged drought stress is crucial for determining whether photosynthesis is limited by SL or NSL. As shown in Figure 12 and Figure 13, under continuous drought from 15 to 29 July, Ci values fluctuated around 300.0 μmol·mol−1 on July 15th. A gradual decline commenced in the day of the 18th and reached a minimum of 198.0 μmol·mol−1 between the 20th and 21st. Subsequently, a slow increase in Ci began from the 21st and returned to around 300.0 μmol·mol−1 by the 26th. A sharp increase to approximately 360.0 μmol·mol−1 was observed on the day of the 26th and 27th. The dynamic changes in Ci exhibited a similar trend to the experiment conducted during the winter (21 December 2022 to 7 January 2023) (Figure 14). This study simultaneously captured daily variations in the CWSI during both high-temperature drought conditions and cold–dry winter periods, revealing the inflection point of Ci during drought stress. This finding is consistent with observations of a tipping point in Ci at different growth stages of drought-stressed maize, indicating a shift from SL to NSL under drought conditions [50]. This phenomenon is attributed to SL in photosynthesis. As drought stress intensifies, reduced leaf water content (LWC) leads to an increased leaf temperature, decreased chloroplast and Rubisco activity, and reduced regeneration of RuBP, ultimately diminishing photosynthetic capacity. These processes characterize NSL in photosynthesis [28,29,51]. Our study observed that as drought progressed, the photosynthesis in tea leaves shifted from SL to NSL, aligning with these findings.
To enhance insights in future studies on the CWSI, researchers should consider several approaches. First, the observation period should be extended over multiple years to capture variations in climate and weather patterns. Second, multiple tea cultivars should be studied to account for genetic differences in the drought response and photosynthetic behavior. Third, advanced remote sensing and physiological monitoring technologies should be utilized to obtain more precise and comprehensive data. Finally, comparative studies across different geographic regions and environmental conditions should be conducted to establish universally applicable critical CWSI thresholds for tea cultivation.

5. Conclusions

This study conducted continuous observations of meteorological data and Ci in tea gardens during summer and winter, calculating the CWSI of tea based on the energy balance theory. It determined the critical CWSI for tea under drought stress by analyzing the Ci response, following the theory that photosynthesis changes from SL to NSL under drought conditions.
The study found a consistent diurnal variation in canopy–air temperature differences, with stable nighttime values and peak differences between 11:00 am and 3:00 pm. The diurnal amplitude was more pronounced during the day, with greater variations during the high-temperature and drought periods in summer compared to the spring tea-picking period. During continuous drought, the Ci of tea exhibited a wave-like decrease, increasing after reaching a low point, which occurred a day later in winter due to lower evaporation and less severe drought stress.
In the high-temperature and drought-associated summer tea field, the upper baseline was 13.9, the lower baseline was 3.4, and the CWSI was 0.27, which was used as the irrigation critical CWSI of the tea garden. The study acknowledges limitations, including data from only one year and one tea cultivar. Future research will focus on multiple tea cultivars and extended observations over additional years to determine universal CWSI values for various regions and climate conditions globally.

Author Contributions

Conceptualization, Y.L. and Y.H.; methodology, H.H. and Y.L.; software and data collection, H.H., J.Z. and Y.L.; validation, Y.L.; investigation, J.Z., H.H. and Y.L.; writing—original draft preparation, J.Z. and Y.L.; writing—review and editing, Q.P., Y.H. and L.C.; supervision, Y.L. and Y.H.; project administration, Y.L. and Y.H; funding acquisition, Y.H. and Y.L. All authors have read and agreed to the published version of the manuscript.

Funding

This research was funded by the project of Jiangsu Province and Education Ministry Co–Sponsored Synergistic Innovation Center of Modern Agricultural Equipment (XTCX2013), the project of Key Laboratory of Modern Agricultural Equipment and Technology, Jiangsu University (MAET202119), the Key Research and Development Program of Jiangsu Province (BE2021340), and the Priority Academic Program Development of Jiangsu Higher Education Institutions (PAPD–2023–87).

Data Availability Statement

The original contributions presented in the study are included in the article, further inquiries can be directed to the corresponding author.

Acknowledgments

The authors are extremely indebted to all sensor providers and their staff for establishing the micrometeorological observation stations used in the current study. We also wish to express our gratitude to the School of Agricultural Engineering, Jiangsu University, for providing essential infrastructure and instruments, without which this work would not have been possible. We would like to thank the anonymous reviewers and editors for their precious attention.

Conflicts of Interest

The authors declare no conflicts of interest.

References

  1. Park, S.; Im, J.; Jang, E.; Rhee, J. Drought Assessment and Monitoring through Blending of Multi-Sensor Indices Using Machine Learning Approaches for Different Climate Regions. Agric. For. Meteorol. 2016, 216, 157–169. [Google Scholar] [CrossRef]
  2. Han, M.; Zhang, H.; DeJonge, K.C.; Comas, L.H.; Gleason, S. Comparison of Three Crop Water Stress Index Models with Sap Flow Measurements in Maize. Agric. Water Manag. 2018, 203, 366–375. [Google Scholar] [CrossRef]
  3. Luan, Y.; Xu, J.; Lv, Y.; Liu, X.; Wang, H.; Liu, S. Improving the Performance in Crop Water Deficit Diagnosis with Canopy Temperature Spatial Distribution Information Measured by Thermal Imaging. Agric. Water Manag. 2021, 246, 106699. [Google Scholar] [CrossRef]
  4. Vicente-Serrano, S.M.; Peña-Angulo, D.; Beguería, S.; Domínguez-Castro, F.; Tomás-Burguera, M.; Noguera, I.; Gimeno-Sotelo, L.; El Kenawy, A. Global Drought Trends and Future Projections. Philos. Trans. R. Soc. Math. Phys. Eng. Sci. 2022, 380, 20210285. [Google Scholar] [CrossRef]
  5. Hu, H.; Lu, Y.; Hu, Y.; Ding, R. Evaluation of Two Surface Renewal Methods for Calculating the Sensible Heat Flux over a Tea Field Ecosystem in Hilly Terrain. Agronomy 2023, 13, 1302. [Google Scholar] [CrossRef]
  6. Ma, S.; Zheng, L.; Liu, X.; Zhang, K.; Hu, L.; Hua, Y.; Huang, J. Genome-Wide Identification of Brassicaceae Hormone-Related Transcription Factors and Their Roles in Stress Adaptation and Plant Height Regulation in Allotetraploid Rapeseed. Int. J. Mol. Sci. 2022, 23, 8762. [Google Scholar] [CrossRef]
  7. Zhang, X.; Yu, Y.; Zhang, J.; Qian, X.; Li, X.; Sun, X. Recent Progress Regarding Jasmonates in Tea Plants: Biosynthesis, Signaling, and Function in Stress Responses. Int. J. Mol. Sci. 2024, 25, 1079. [Google Scholar] [CrossRef]
  8. Jin, J.; Zhao, M.; Jing, T.; Zhang, M.; Lu, M.; Yu, G.; Wang, J.; Guo, D.; Pan, Y.; Hoffmann, T.D.; et al. Volatile Compound-Mediated Plant–Plant Interactions under Stress with the Tea Plant as a Model. Hortic. Res. 2023, 10, uhad143. [Google Scholar] [CrossRef]
  9. Rigden, A.J.; Mueller, N.D.; Holbrook, N.M.; Pillai, N.; Huybers, P. Combined Influence of Soil Moisture and Atmospheric Evaporative Demand Is Important for Accurately Predicting US Maize Yields. Nat. Food 2020, 1, 127–133. [Google Scholar] [CrossRef]
  10. Wilson, T.G.; Kustas, W.P.; Alfieri, J.G.; Anderson, M.C.; Gao, F.; Prueger, J.H.; McKee, L.G.; Alsina, M.M.; Sanchez, L.A.; Alstad, K.P. Relationships between Soil Water Content, Evapotranspiration, and Irrigation Measurements in a California Drip-Irrigated Pinot Noir Vineyard. Agric. Water Manag. 2020, 237, 106186. [Google Scholar] [CrossRef]
  11. Braunworth, W.S.; Mack, H.J. The Possible Use of the Crop Water Stress Index as an Indicator of Evapotranspiration Deficits and Yield Reductions in Sweet Corn. J. Am. Soc. Hortic. Sci. 1989, 114, 542–546. [Google Scholar] [CrossRef]
  12. Sezen, S.M.; Yazar, A.; Daşgan, Y.; Yucel, S.; Akyıldız, A.; Tekin, S.; Akhoundnejad, Y. Evaluation of Crop Water Stress Index (CWSI) for Red Pepper with Drip and Furrow Irrigation under Varying Irrigation Regimes. Agric. Water Manag. 2014, 143, 59–70. [Google Scholar] [CrossRef]
  13. Yan, H.; Deng, S.; Zhang, C.; Wang, G.; Zhao, S.; Li, M.; Liang, S.; Jiang, J.; Zhou, Y. Determination of Energy Partition of a Cucumber Grown Venlo–Type Greenhouse in Southeast China. Agric. Water Manag. 2023, 276, 108047. [Google Scholar] [CrossRef]
  14. Yan, H.; Yu, J.; Zhang, C.; Wang, G.; Huang, S.; Ma, J. Comparison of Two Canopy Resistance Models to Estimate Evapotranspiration for Tea and Wheat in Southeast China. Agric. Water Manag. 2021, 245, 106581. [Google Scholar] [CrossRef]
  15. Yan, H.; Li, M.; Zhang, C.; Zhang, J.; Wang, G.; Yu, J.; Ma, J.; Zhao, S. Comparison of Evapotranspiration Upscaling Methods from Instantaneous to Daytime Scale for Tea and Wheat in Southeast China. Agric. Water Manag. 2022, 264, 107464. [Google Scholar] [CrossRef]
  16. Zhang, C.; Zhang, W.; Yan, H.; Ni, Y.; Akhlaq, M.; Zhou, J.; Xue, R. Effect of Micro-Spray on Plant Growth and Chlorophyll Fluorescence Parameter of Tomato under High Temperature Condition in a Greenhouse. Sci. Hortic. 2022, 306, 111441. [Google Scholar] [CrossRef]
  17. Huang, S.; Yan, H.; Zhang, C.; Wang, G.; Acquah, S.J.; Yu, J.; Li, L.; Ma, J.; Opoku Darko, R. Modeling Evapotranspiration for Cucumber Plants Based on the Shuttleworth-Wallace Model in a Venlo-Type Greenhouse. Agric. Water Manag. 2020, 228, 105861. [Google Scholar] [CrossRef]
  18. Jackson, R.D.; Kustas, W.P.; Choudhury, B.J. A Reexamination of the Crop Water Stress Index. Irrig. Sci. 1988, 9, 309–317. [Google Scholar] [CrossRef]
  19. Jackson, R.D.; Reginato, R.J.; Idso, S.B. Wheat Canopy Temperature: A Practical Tool for Evaluating Water Requirements. Water Resour. Res. 1977, 13, 651–656. [Google Scholar] [CrossRef]
  20. Jackson, R.D.; Idso, S.B.; Reginato, R.J.; Pinter, P.J. Canopy Temperature as a Crop Water Stress Indicator. Water Resour. Res. 1981, 17, 1133–1138. [Google Scholar] [CrossRef]
  21. Bo, L.; Guan, H.; Mao, X. Diagnosing Crop Water Status Based on Canopy Temperature as a Function of Film Mulching and Deficit Irrigation. Field Crops Res. 2023, 304, 109154. [Google Scholar] [CrossRef]
  22. Liu, L.; Gao, X.; Ren, C.; Cheng, X.; Zhou, Y.; Huang, H.; Zhang, J.; Ba, Y. Applicability of the Crop Water Stress Index Based on Canopy-Air Temperature Differences for Monitoring Water Status in a Cork Oak Plantation, Northern China. Agric. For. Meteorol. 2022, 327, 109226. [Google Scholar] [CrossRef]
  23. Bacelar, E.A.; Moutinho–Pereira, J.M.; Gonçalves, B.C.; Lopes, J.I.; Correia, C.M. Physiological Responses of Different Olive Genotypes to Drought Conditions. Acta Physiol. Plant. 2009, 31, 611–621. [Google Scholar] [CrossRef]
  24. Pilon, C.; Snider, J.L.; Sobolev, V.; Chastain, D.R.; Sorensen, R.B.; Meeks, C.D.; Massa, A.N.; Walk, T.; Singh, B.; Earl, H.J. Assessing Stomatal and Non-Stomatal Limitations to Carbon Assimilation under Progressive Drought in Peanut (Arachis hypogaea L.). J. Plant Physiol. 2018, 231, 124–134. [Google Scholar] [CrossRef] [PubMed]
  25. Bhusal, N.; Han, S.-G.; Yoon, T.-M. Impact of Drought Stress on Photosynthetic Response, Leaf Water Potential, and Stem Sap Flow in Two Cultivars of Bi-Leader Apple Trees (Malus × Domestica Borkh.). Sci. Hortic. 2019, 246, 535–543. [Google Scholar] [CrossRef]
  26. Buckley, T.N.; Mott, K.A. Modelling Stomatal Conductance in Response to Environmental Factors. Plant Cell Environ. 2013, 36, 1691–1699. [Google Scholar] [CrossRef]
  27. Tombesi, S.; Nardini, A.; Frioni, T.; Soccolini, M.; Zadra, C.; Farinelli, D.; Poni, S.; Palliotti, A. Stomatal Closure Is Induced by Hydraulic Signals and Maintained by ABA in Drought-Stressed Grapevine. Sci. Rep. 2015, 5, 12449. [Google Scholar] [CrossRef] [PubMed]
  28. Flexas, J.; Barón, M.; Bota, J.; Ducruet, J.-M.; Gallé, A.; Galmés, J.; Jiménez, M.; Pou, A.; Ribas-Carbó, M.; Sajnani, C.; et al. Photosynthesis Limitations during Water Stress Acclimation and Recovery in the Drought-Adapted Vitis Hybrid Richter-110 (V. berlandieri × V. rupestris). J. Exp. Bot. 2009, 60, 2361–2377. [Google Scholar] [CrossRef]
  29. Grassi, G.; Magnani, F. Stomatal, Mesophyll Conductance and Biochemical Limitations to Photosynthesis as Affected by Drought and Leaf Ontogeny in Ash and Oak Trees. Plant Cell Environ. 2005, 28, 834–849. [Google Scholar] [CrossRef]
  30. Maxwell, K.; Johnson, G.N. Chlorophyll Fluorescence—A Practical Guide. J. Exp. Bot. 2000, 51, 659–668. [Google Scholar] [CrossRef]
  31. Signarbieux, C.; Feller, U. Non–Stomatal Limitations of Photosynthesis in Grassland Species under Artificial Drought in the Field. Environ. Exp. Bot. 2011, 71, 192–197. [Google Scholar] [CrossRef]
  32. Idso, S.B. Non-Water-Stressed Baselines: A Key to Measuring and Interpreting Plant Water Stress. Agric. Meteorol. 1982, 27, 59–70. [Google Scholar] [CrossRef]
  33. Idso, S.B.; Jackson, R.D.; Pinter, P.J.; Reginato, R.J.; Hatfield, J.L. Normalizing the Stress-Degree-Day Parameter for Environmental Variability. Agric. Meteorol. 1981, 24, 45–55. [Google Scholar] [CrossRef]
  34. Idso, S.B.; Jackson, R.D.; Reginato, R.J. Remote-Sensing of Crop Yields. Science 1977, 196, 19–25. [Google Scholar] [CrossRef]
  35. Pereira, L.S.; Allen, R.G.; Smith, M.; Raes, D. Crop Evapotranspiration Estimation with FAO56: Past and Future. Agric. Water Manag. 2015, 147, 4–20. [Google Scholar] [CrossRef]
  36. Kirnak, H.; Irik, H.A.; Unlukara, A. Potential Use of Crop Water Stress Index (CWSI) in Irrigation Scheduling of Drip–Irrigated Seed Pumpkin Plants with Different Irrigation Levels. Sci. Hortic. 2019, 256, 108608. [Google Scholar] [CrossRef]
  37. Yuan, G.; Luo, Y.; Sun, X.; Tang, D. Evaluation of a Crop Water Stress Index for Detecting Water Stress in Winter Wheat in the North China Plain. Agric. Water Manag. 2004, 64, 29–40. [Google Scholar] [CrossRef]
  38. Song, Z.; Wang, L.; Lee, M.; Yue, G.H. The Evolution and Expression of Stomatal Regulators in C3 and C4 Crops: Implications on the Divergent Drought Tolerance. Front. Plant Sci. 2023, 14, 1100838. [Google Scholar] [CrossRef] [PubMed]
  39. Brodribb, T. Dynamics of Changing Intercellular CO2 Concentration (Ci) during Drought and Determination of Minimum Functional Ci. Plant Physiol 1996, 111, 179–185. [Google Scholar] [CrossRef]
  40. Baker, J.T.; Mahan, J.R.; Gitz, D.C.; Lascano, R.J.; Ephrath, J.E. Comparison of Deficit Irrigation Scheduling Methods That Use Canopy Temperature Measurements. Plant Biosyst.—Int. J. Deal. All Asp. Plant Biol. 2013, 147, 40–49. [Google Scholar] [CrossRef]
  41. Yan, H.; Zhang, C.; Coenders Gerrits, M.; Acquah, S.J.; Zhang, H.; Wu, H.; Zhao, B.; Huang, S.; Fu, H. Parametrization of Aerodynamic and Canopy Resistances for Modeling Evapotranspiration of Greenhouse Cucumber. Agric. For. Meteorol. 2018, 262, 370–378. [Google Scholar] [CrossRef]
  42. DeJonge, K.C.; Taghvaeian, S.; Trout, T.J.; Comas, L.H. Comparison of Canopy Temperature-Based Water Stress Indices for Maize. Agric. Water Manag. 2015, 156, 51–62. [Google Scholar] [CrossRef]
  43. Irmak, S.; Haman, D.Z.; Bastug, R. Determination of Crop Water Stress Index for Irrigation Timing and Yield Estimation of Corn. Agron. J. 2000, 92, 1221–1227. [Google Scholar] [CrossRef]
  44. Taghvaeian, S.; Comas, L.; DeJonge, K.C.; Trout, T.J. Conventional and Simplified Canopy Temperature Indices Predict Water Stress in Sunflower. Agric. Water Manag. 2014, 144, 69–80. [Google Scholar] [CrossRef]
  45. Wang, D.; Gartung, J. Infrared Canopy Temperature of Early-Ripening Peach Trees under Postharvest Deficit Irrigation. Agric. Water Manag. 2010, 97, 1787–1794. [Google Scholar] [CrossRef]
  46. Agam, N.; Cohen, Y.; Berni, J.A.J.; Alchanatis, V.; Kool, D.; Dag, A.; Yermiyahu, U.; Ben-Gal, A. An Insight to the Performance of Crop Water Stress Index for Olive Trees. Agric. Water Manag. 2013, 118, 79–86. [Google Scholar] [CrossRef]
  47. Park, S.; Ryu, D.; Fuentes, S.; Chung, H.; O’Connell, M.; Kim, J. Dependence of CWSI-Based Plant Water Stress Estimation with Diurnal Acquisition Times in a Nectarine Orchard. Remote Sens. 2021, 13, 2775. [Google Scholar] [CrossRef]
  48. Moore, C.E.; Meacham-Hensold, K.; Lemonnier, P.; Slattery, R.A.; Benjamin, C.; Bernacchi, C.J.; Lawson, T.; Cavanagh, A.P. The Effect of Increasing Temperature on Crop Photosynthesis: From Enzymes to Ecosystems. J. Exp. Bot. 2021, 72, 2822–2844. [Google Scholar] [CrossRef]
  49. Bozkurt Çolak, Y.; Yazar, A.; Alghory, A.; Tekin, S. Evaluation of Crop Water Stress Index and Leaf Water Potential for Differentially Irrigated Quinoa with Surface and Subsurface Drip Systems. Irrig. Sci. 2021, 39, 81–100. [Google Scholar] [CrossRef]
  50. Song, X.; Zhou, G.; He, Q.; Zhou, H. Stomatal Limitations to Photosynthesis and Their Critical Water Conditions in Different Growth Stages of Maize under Water Stress. Agric. Water Manag. 2020, 241, 106330. [Google Scholar] [CrossRef]
  51. Wang, Q.; He, Q.; Zhou, G. Applicability of Common Stomatal Conductance Models in Maize under Varying Soil Moisture Conditions. Sci. Total Environ. 2018, 628–629, 141–149. [Google Scholar] [CrossRef]
Figure 1. Location of the experimental tea field.
Agronomy 14 02154 g001
Figure 2. Micrometeorological observation system.
Agronomy 14 02154 g002
Figure 3. Energy flux density dynamic change in the experiment site from 5 to 29 July 2022.
Agronomy 14 02154 g003
Figure 4. Relative humidity dynamic change in the experiment site from 5 to 29 July 2022.
Agronomy 14 02154 g004
Figure 5. VPD dynamic change in the experiment site from 5 to 29 July 2022.
Agronomy 14 02154 g005
Figure 6. Daily variation in the air and canopy temperature difference from 5 to 11 July 2022. Note: The highlighted part represented the time period of 12:00 to 14:00.
Agronomy 14 02154 g006
Figure 7. Diurnal variation in CWSI during the famous tea harvest season in spring.
Agronomy 14 02154 g007
Figure 8. Diurnal variation in the CWSI under the drought season in summer.
Agronomy 14 02154 g008
Figure 9. Daily variation in the CWSI under drought stress in the famous tea harvest season.
Agronomy 14 02154 g009
Figure 10. Daily variation in the CWSI under drought stress in summer.
Agronomy 14 02154 g010
Figure 11. Daily variation in Ci under drought stress in summer.
Agronomy 14 02154 g011
Figure 12. Ta at 14:00 on every experimental day.
Agronomy 14 02154 g012
Figure 13. Dynamic changes in the daily mean CWSI under drought stress in summer.
Agronomy 14 02154 g013
Figure 14. Dynamic changes in Ci under drought stress in the winter season.
Agronomy 14 02154 g014
Table 1. Physical properties and the particle composition of the soil for the experiment.
Sampling Depth (cm)Size CompositionBulk Density (g·cm−3)Saturated VWC (%)Field Capacity (%)Soil Texture
<0.002 (mm)0.002–0.02 (mm)0.02–2 (mm)
0~10.01.2%32.3%66.5%1.3435.526.5Sandy loam
Sandy loam Sandy loam
Loam
10.0~20.02.0%29.3%68.7%1.3636.927.1
20.0~30.01.4%31.5%67.1%1.3836.726.6
30.0~40.06.1%42.6%51.3%1.5640.425.9
40.0~50.09.4%41.2%49.4%1.6441.825.5Loam
Loam
50.0~60.08.4%41.4%50.2%1.6441.525.3
Disclaimer/Publisher’s Note: The statements, opinions and data contained in all publications are solely those of the individual author(s) and contributor(s) and not of MDPI and/or the editor(s). MDPI and/or the editor(s) disclaim responsibility for any injury to people or property resulting from any ideas, methods, instructions or products referred to in the content.

