Article

Reducing the Sodium Adsorption Ratio Improves the Soil Aggregates and Organic Matter in Brackish-Water-Irrigated Cotton Fields

1
Key Laboratory of Crop Water Use and Regulation, Ministry of Agriculture and Rural Affairs, Farmland Irrigation Research Institute, Chinese Academy of Agricultural Sciences, Xinxiang 453002, China
2
College of Water Conservancy and Architectural Engineering, Tarim University, Alaer 843300, China
3
Western Agricultural Research Center, Chinese Academy of Agricultural Sciences, Changji 831100, China
4
School of Water Resources and Hydropower, North China University of Water Resources and Electric Power, Zhengzhou 450046, China
5
College of Agriculture, Zhengzhou University, Zhengzhou 450000, China
*
Authors to whom correspondence should be addressed.
Agronomy 2024, 14(9), 2169; https://doi.org/10.3390/agronomy14092169
Submission received: 13 August 2024 / Revised: 13 September 2024 / Accepted: 20 September 2024 / Published: 23 September 2024
(This article belongs to the Section Farming Sustainability)

Abstract

:
The assessment of soil health relies on key parameters such as soil aggregates and organic matter content. Therefore, examining the impact of irrigation water ion composition and variations in salinity on soil aggregates and organic matter is imperative, which is key to developing a theoretical basis for the sustainable utilization of saline water resources, particularly in extremely arid regions. This experiment was conducted to investigate the impact of different irrigation water salinity treatments (T3: 3 g/L, T5: 5 g/L, and T7: 7 g/L) on the root zone soil of cotton fields. Each salinity treatment included three variations of the sodium adsorption ratio (SAR) at S10: 10 (mmol/L)1/2, S15: 15 (mmol/L)1/2, and S20: 20 (mmol/L)1/2. Local freshwater irrigation served as the control, resulting in a total of 10 treatments. Our findings show that the soil Ca2+ and Mg2+ content increased with higher irrigation water salinity but decreased with increasing irrigation water SAR. The relative macroaggregate stability and the content of water-stable macroaggregates and soil organic matter (SOM) decreased as the irrigation water salinity and SAR increased. In comparison to T3S20, T5S10 did not improve the soil Na+ content but significantly increased the soil Ca2+ content by 147.76%, while the water-stable aggregate and SOM saw a notable increase of 7.66% and 9.86%, respectively. Reducing the SAR in brackish water lessens its negative impact on soil aggregates in cotton fields. This is primarily because Ca2+ counteracts the dispersive effect of high Na+ concentrations and promotes aggregate formation. Irrigation water with a salinity of 3 g/L and an SAR of 10 (mmol/L)1/2 positively affected the stabilization of soil aggregates and organic matter.

1. Introduction

As a key cash crop, cotton is not only the main source of income for agricultural producers in many countries and regions around the world but also an important part of international trade, and its trading scale and price trends have a significant impact on the world economy [1]. Xinjiang is a vast region with vast arable land resources, and the cotton industry occupies a central position in Xinjiang’s agriculture. In 2023, Xinjiang’s cotton planting area was 2,369,300 hectares, with a total output of 5,112,000 tonnes, which accounted for 84.98% and 90.99% of the country’s total [2], and the production safety of Xinjiang’s cotton is directly related to the healthy and stable development of the national cotton industry. However, the shortage of freshwater resources in Xinjiang, which seriously limits the growth and development of cotton and its yield, and how to reasonably and safely use the region’s brackish groundwater for agricultural irrigation to make up for the lack of irrigation water has become an urgent problem.
Irrigation with highly saline water leads to the accumulation of ions in the soil, altering the physicochemical properties of the soil and potentially damaging the soil environment, hindering crop production. Numerous national and international experimental results have confirmed the feasibility of saline water (brackish water) irrigation and provided theoretical foundations and scientific support for saline water (brackish water) irrigation under different soil conditions in different ecological regions. The Water-Saving Dryland Agriculture Experiment Station of Hebei Academy of Agricultural and Forestry Sciences conducted numerous experiments on irrigating cotton with saline water in clay soil. Research found that soil SAR increased with increasing irrigation water salinity and SAR [3,4]. The thresholds for saline water mineralization in irrigation that do not impact soil health have been suggested to be 5.4 g/L and 2.2 g/L, corresponding to irrigation water SAR values of 44.55 (mmol/L)1/2 and 23.15 (mmol/L)1/2, respectively. Some studies suggest that the irrigation of cotton with brackish water with a salinity of less than 6 g/L will not affect soil quality in sandy loam soil with the main ion composition of Na+, SO42−, and Cl in northern Xinjiang [5,6]. Rodrigues et al. [7] found that the soil structure changed when the mineralization of irrigation water exceeded 3.2 g/L, causing a reduction in soil permeability, but irrigation with brackish water with mineralization up to 6 g/L did not cause the accumulation of salts on the surface of sandy loam soils [8]. This is mainly because brackish water irrigation can significantly increase soil porosity and water-stable aggregates, which improves the soil structure under brackish water irrigation compared to freshwater irrigation, which in turn affects the process of water and salt transport in the soil [9]. However, long-term brackish water irrigation can lead to soil structure degradation, soil quality reduction, soil microbial activity and community structure alteration, and ultimately a decline in soil fertility and agricultural productivity [10]. In addition, the irrigation water salinity and ionic composition of brackish water in different regions [3,5,7,11] and the different ionic compositions of irrigation water under saline irrigation conditions inevitably affect the soil microecological environments. Therefore, research tailored to local conditions is required.
The effects of brackish water irrigation on soil structure and organic matter are complex and often negative. Studies have shown that irrigation with brackish water results in an increase in soil weight, a decrease in porosity, and a decrease in the saturated hydraulic conductivity of the soil [12] and that the stability of soil aggregates is compromised with an increase in the concentration of Na+ in the soil irrigation water, which in turn reduces the stability of the soil structure [13]. The concentration of Na+ is the stability, and even a low concentration of brackish water with mineralization of 3 g/L promotes the flocculation of clay particles in the soil during infiltration, which affects the stability of the soil structure [14]. The change in soil structure affects the physicochemical properties of the soil, which in turn affect the activities of soil microorganisms as well as the decomposition and synthesis processes of organic matter, thus reducing the organic matter content in the soil [15].
Soil organic matter plays an indispensable role in cotton production by helping to improve the physical structure of the soil and increase the porosity of the soil [16] so that the soil aeration is enhanced, which is conducive to the respiration of the cotton root system, and is decomposed under the action of microorganisms, releasing nitrogen, phosphorus, potassium, and other large elements and a variety of trace elements to promote the growth of the root system and nutrient uptake [17], to meet the nutritional requirements of cotton’s growth stage. In the case of scarce freshwater resources, the use of brackish water to irrigate cotton fields will increase the soil salinity content and accelerate the decomposition of soil organic matter in cotton fields, and the organic matter content with the increase in the salinity of the irrigation water is significantly reduced, seriously affecting the growth and development of the crop [18].Therefore, when implementing irrigation strategies, it is essential to fully recognize the potential hazards of brackish water and take appropriate measures to mitigate its harmful effects on the soil to ensure better soil health and the sustainability of agricultural production.
In the unique climate of southern Xinjiang, characterized by low rainfall and high evaporation, the soil structure of farmland is relatively fragile. The use of saline water to irrigate is likely to result in the further deterioration of the soil structure, resulting in the loss of water storage and soil fertility, posing a threat to crop growth and food security [4,19,20,21]. Therefore, it is crucial to investigate the mechanism of influence of differences in the ionic composition of saline water irrigation on the soil structure in southern Xinjiang, as it is essential to propose strategies for brackish water irrigation and sustainable agriculture in saline–alkaline areas. Therefore, this study focuses on cotton field soils in the arid region of northwest China as the research object and uses the sodium adsorption ratio (SAR) to characterize the ionic composition of salt water. Field experiments were conducted with different combinations of different irrigation water salinities and SARs to study the effects of various interactions between the irrigation water salinity and SAR on the Na+, Ca2+, Mg2+, and other important ion contents in the soil, as well as on soil aggregates and organic matter. The aim of the study was (1) to elucidate the mechanism of action of differences in the ionic composition of irrigation water on the soil structure, (2) to propose irrigation water mineralization and corresponding SARs that do not affect the soil structure and organic matter in brackish-water-irrigated cotton fields on the southern border, and (3) to provide theoretical foundations and technical support for the efficient use of saline water resources in extremely dry regions.

2. Materials and Methods

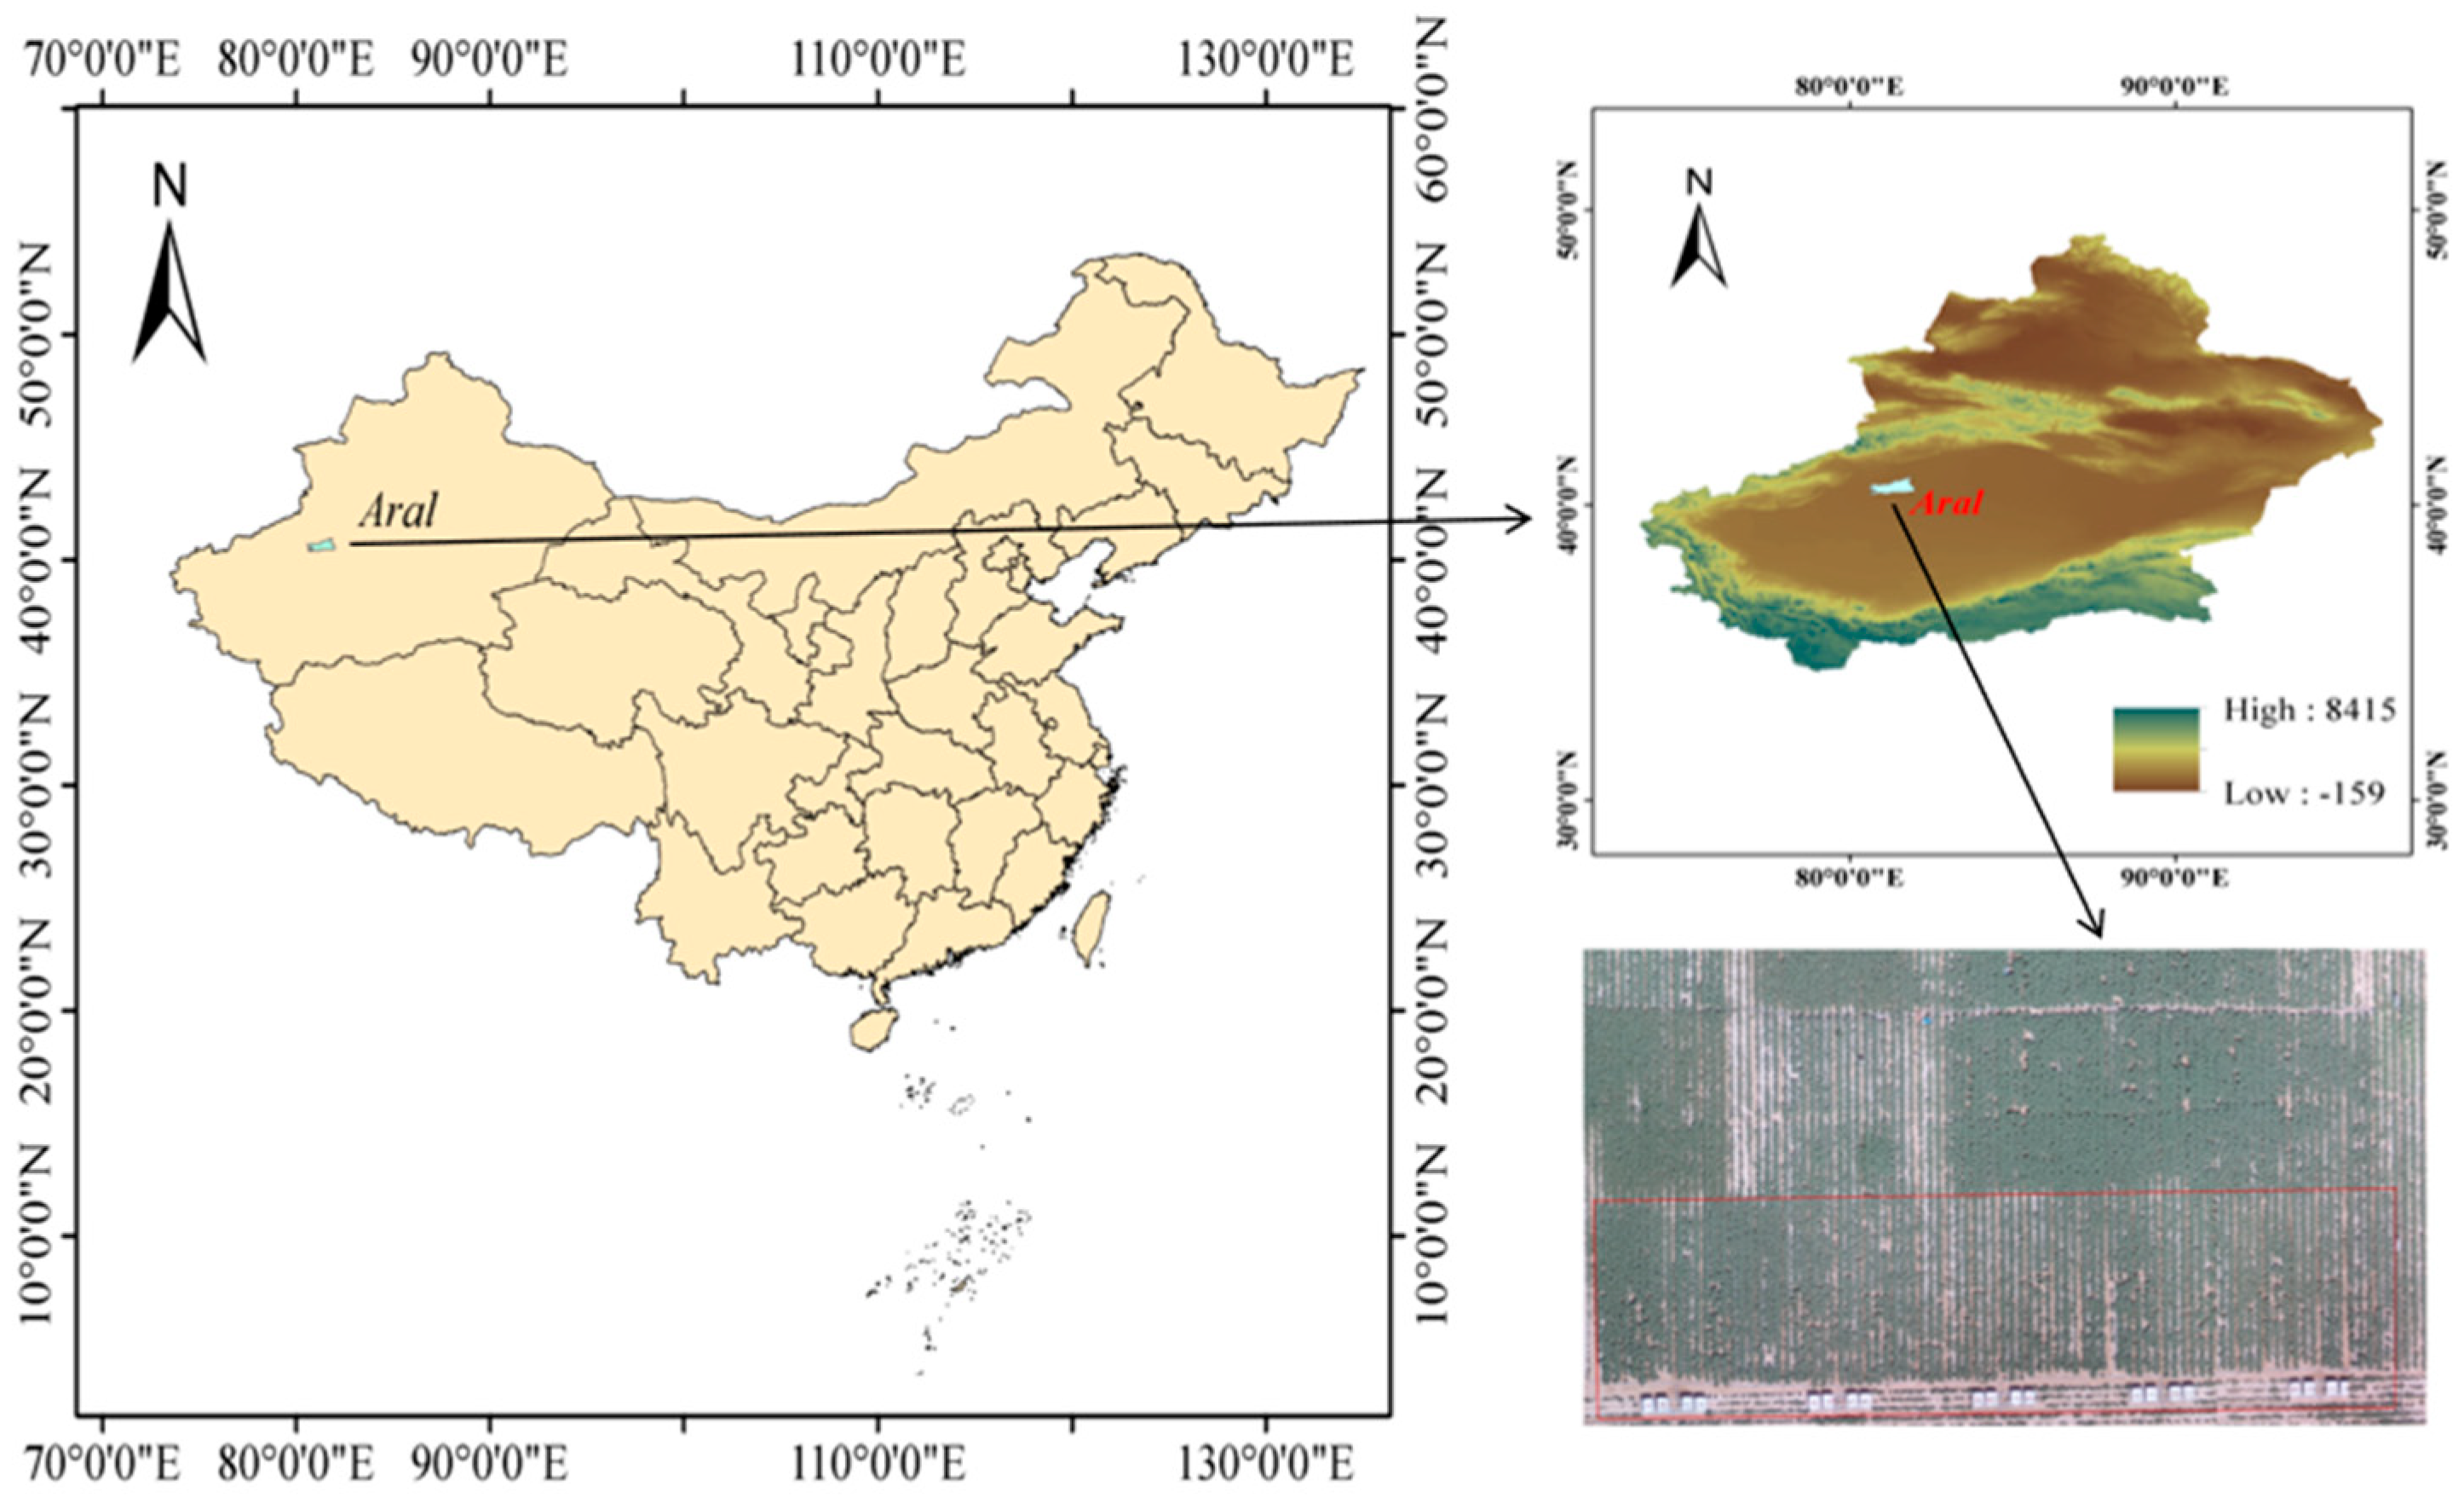
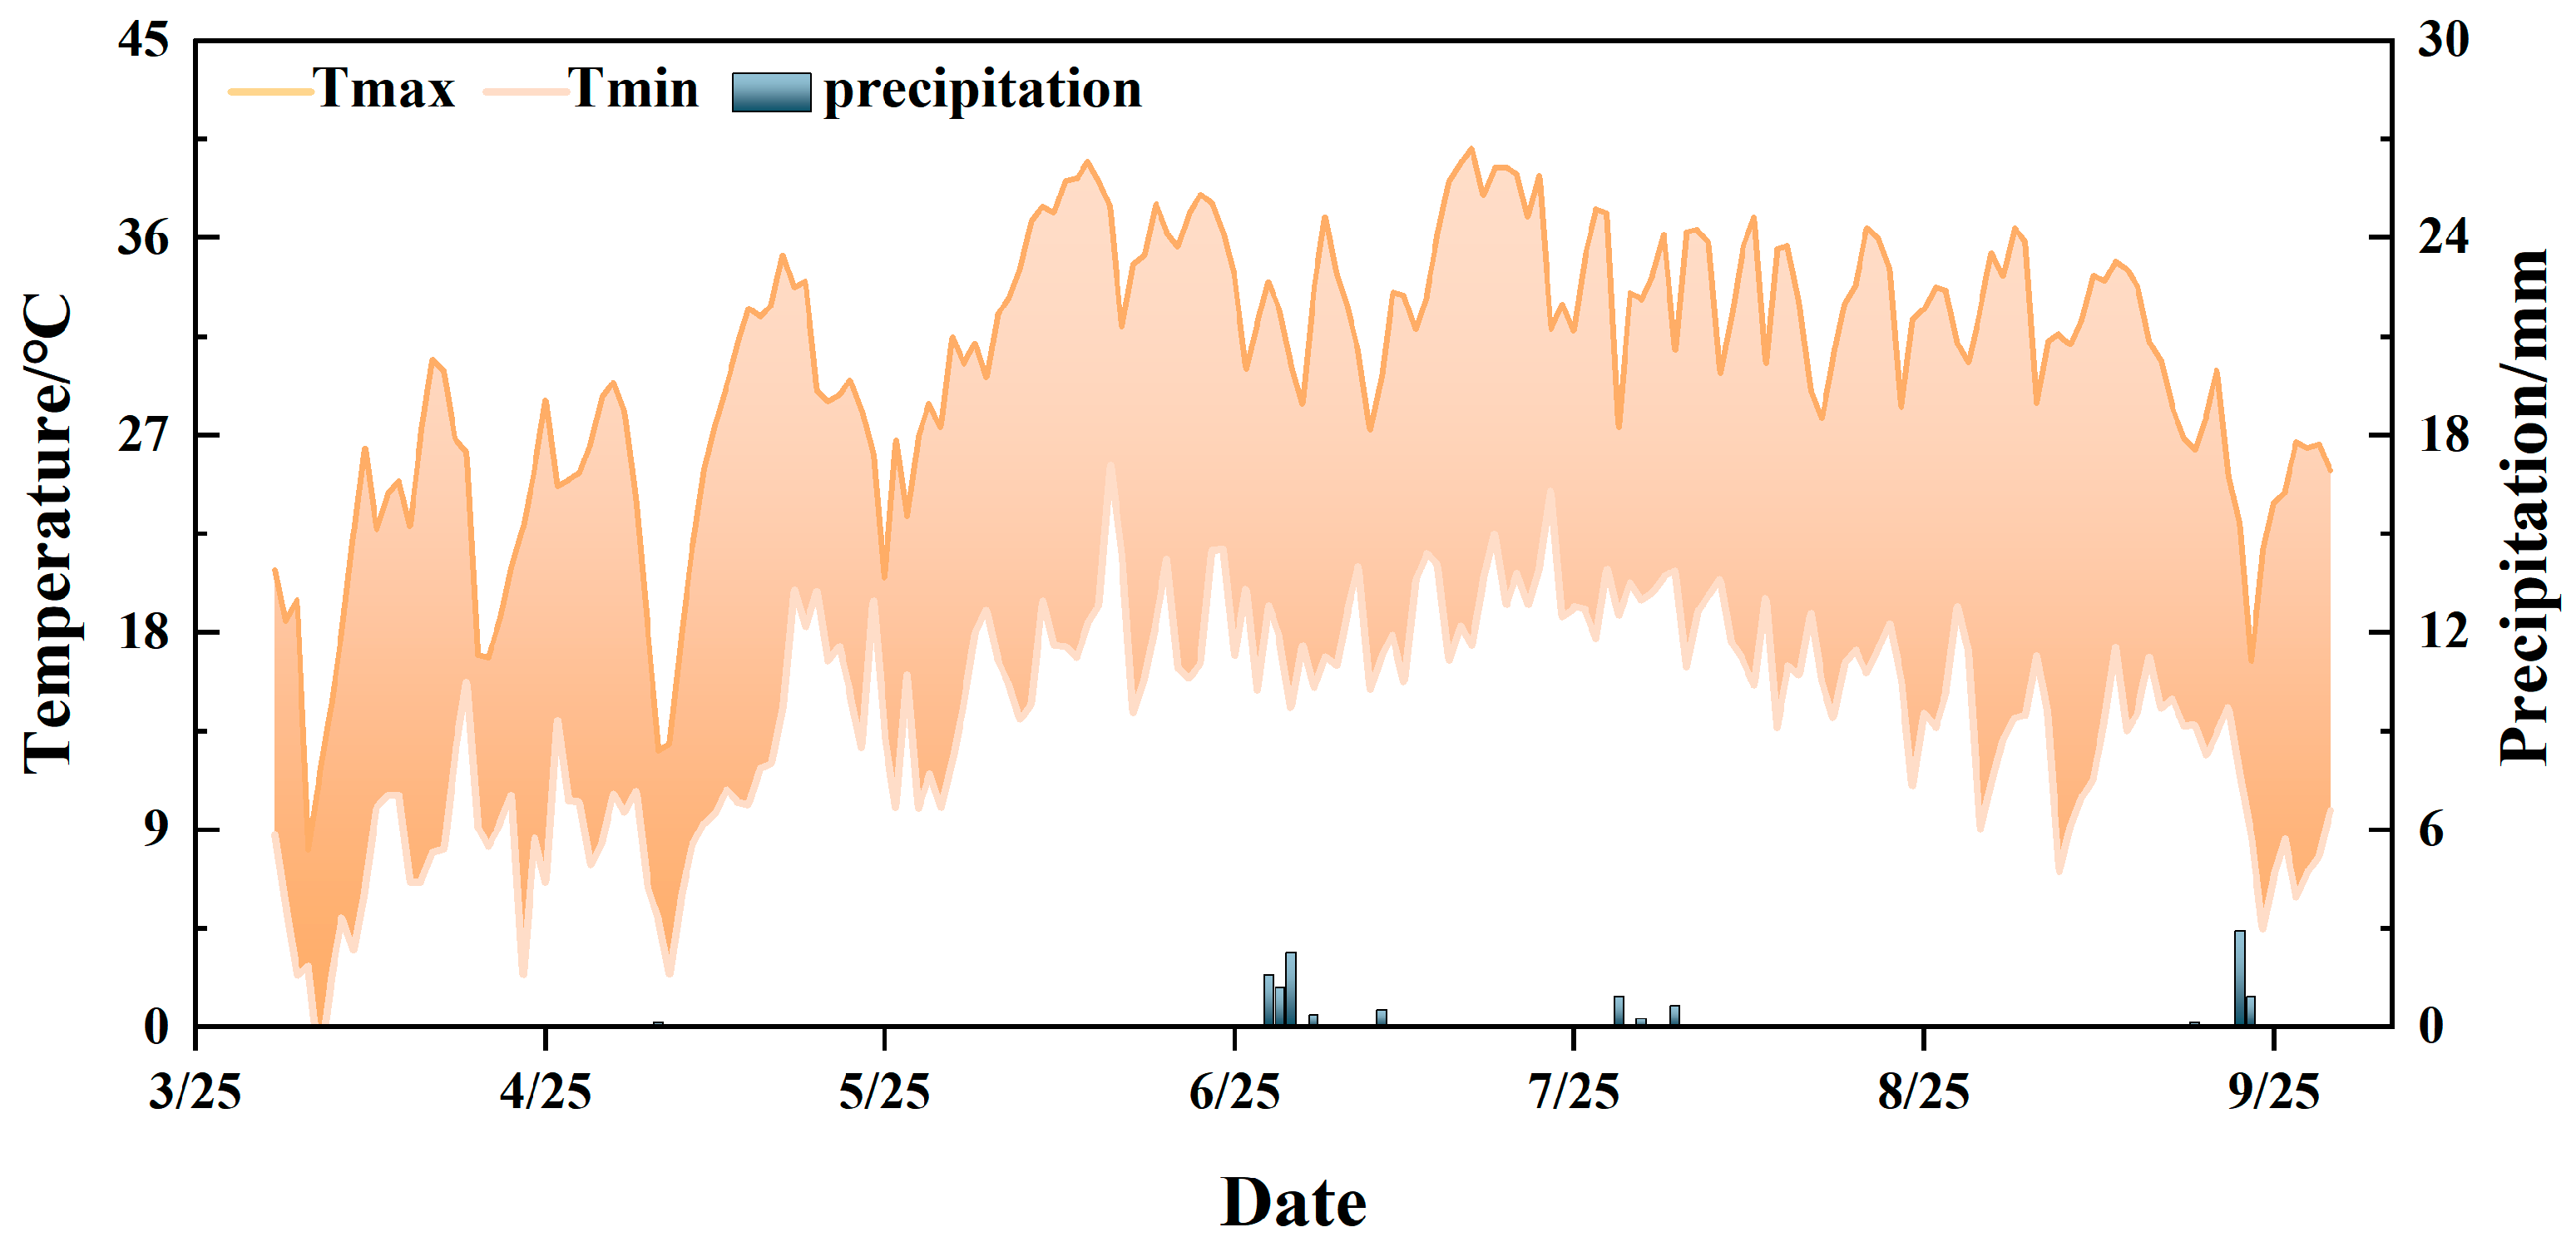
2.1. Overview of Experimental Area

Field experiments were conducted from April 2023 to October 2023 at the Xinjiang Alar Modern Agricultural Comprehensive Experimental Station (81°17′56.52″ E, 40°32′36.90″ N) (Figure 1). The experimental area has a temperate continental climate with an annual precipitation of about 18 mm, an average annual temperature of 14.49 °C (Figure 2), and an average groundwater depth of about 3 m [22]. The soil physical and chemical properties before experiments are presented in Table 1; the soil particle size is classified using the USDA.

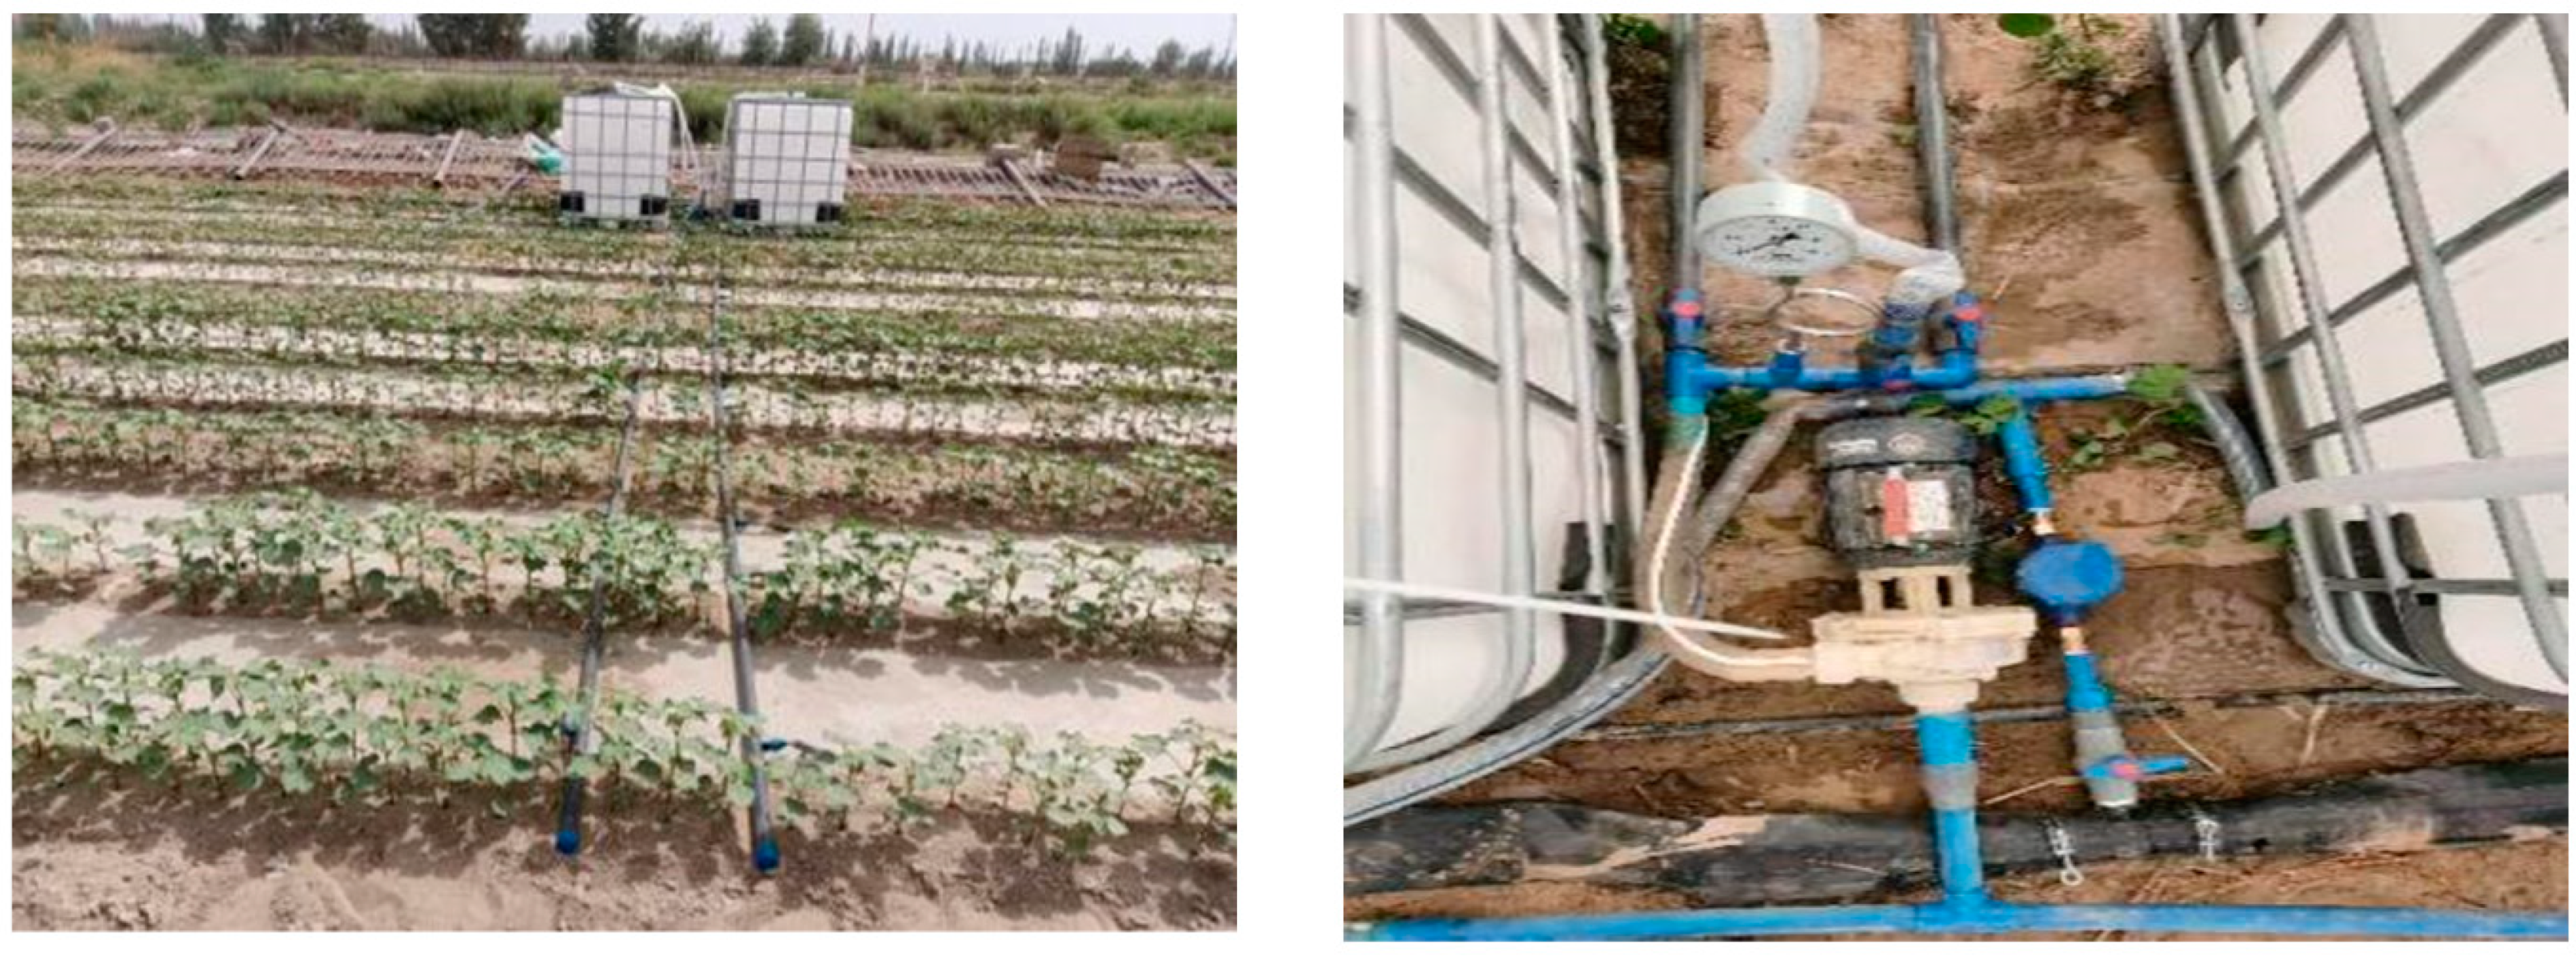
2.2. Experimental Design

The cotton was sown at the beginning of April using the mechanical seeding method with a film and three belts in six rows. The film width was 2.28 m, and the row spacing was configured at 10 cm + 66 cm + 10 cm + 66 cm + 10 cm, with a cotton crop configuration with wide and narrow rows and a plant spacing of 10 cm. Drip irrigation tapes were arranged on the inside of the two edge rows and on the sides of the middle row, making a total of three drip irrigation tapes. This experiment focused on 0~20 cm soil in cotton fields and used a split-plot experimental design. The main plot was designed with three different irrigation water salinities: T3: 3 g/L, T5: 5 g/L, and T7: 7 g/L. The subplot was designed with three different levels of the sodium adsorption ratio (SAR) of irrigation water: S10: 10 (mmol/L)1/2, S15: 15 (mmol/L)1/2, and S20: 20 (mmol/L)1/2. Local freshwater irrigation served as a control. There was a total of 10 treatments, with each treatment having three replicates, resulting in a total of 30 plots (6.48 m × 7 m). The specific treatment codes and different ion contents of irrigation water are listed in Table 2. By adding NaCl and CaCl2 to local well water, different levels of irrigation water salinity and the sodium adsorption ratio (SAR) were achieved. To accurately control the irrigation volume of each treatment, each treatment was supplied with water using a drip irrigation system consisting of a mixing tank, a pressure gauge, a water meter, valves, and a small self-priming pump (Figure 3). During irrigation, the local well water was first connected to the valve via an underground pipe. The other end of the valve was connected to a hose that led into a mixing tank. When the water meter showed a sufficient amount of water, the valve was closed, and NaCl and CaCl2 were added to the mixing container and stirred evenly. The valve for irrigating the field was then opened, and the small self-priming pump was connected to the power source. The working pressure was set at 0.1 MPa, with a maximum flow rate of 3 L/h per drip head. The irrigation water was then injected into each plot through PVC pipes connected to the drip irrigation tapes until all the irrigation water in the tank was used up.
The cotton entered the bud stage, and irrigation with the first water was initiated with a watering rate of 37.5 mm [23], after which the experiment applied irrigation based on crop evapotranspiration (ETc), and the calculation of crop water requirements followed the single crop coefficient method recommended by FAO-56, using reference-to-reference crop evapotranspiration (ETo). The cotton coefficient was calculated based on experimental data from the research group in 2021 and 2022, with the average ETa/ETo at the bud and boll stages being 0.77 and 1.14, respectively [24].
The irrigation interval was seven days, and irrigation was carried out eleven times throughout the entire growth period of cotton, and the irrigation rate was the same in all treatments. Fertilization followed the local conventional fertilization system, as listed in Table 3. Before plowing, 84 kg/ha of pure N was applied as base fertilizer. N, P, and K fertilizers were applied at each irrigation and kept consistent with the conventional field fertilization.

2.3. Sampling and Field Measurements

2.3.1. Determination of Soil Ions and Sodium Adsorption Ratio (SAR)

After the completion of the irrigation experiment during the reproductive phase (at the late flowering stage), soil samples were collected using augers at a depth of 0~20 cm. The collected soil samples were naturally air-dried, gently ground, and sieved through a 1 mm sieve. Soil water was extracted with distilled water in the ratio of 1:5, and soil leachate was taken into a volumetric flask. Aluminum sulphate solution was added, diluted with water, and poured into a beaker and then placed on a flame photometer for sodium ion determination, and the readings were noted. The soil leachate was taken into a conical flask, sodium hydroxide was added, and the flask was shaken well for 1 min; then, a glass spoon was used to add a little K-B indicator, the flask was shaken well, and then a burette was used to add EDTA standard solution. The preparation was dropped with shaking; at the end, the wine-red solution suddenly changed to pure blue, and the number of milliliters of EDTA used (V1) was recorded. Another soil leachate was added slowly to an ammonia solution, shaken well, a little K-B indicator was added, shaken well, and this was immediately titrated with EDTA standard solution added to the solution, changing from burgundy to pure blue as the end point; the number of milliliters of EDTA used (V2) was recorded [25].
The oxidation–colorimetric method of potassium dichromate was used for the determination. The soil samples were air-dried and sieved through a 0.15 mm sieve, potassium dichromate solution and concentrated sulfuric acid were added, followed by heating in a water bath, and the absorbance was measured by a UV–visible spectrophotometer (UV-1200, MAPADA, Shanghai, China). The content of soil organic matter was calculated according to the following formula [15]:
The sodium adsorption ratio (SAR) refers to the quantity of sodium ions relative to calcium and magnesium ions in irrigation water or soil solution. It is calculated as follows [26]:
S o i l   C a 2 + = c × V 1 × 2 m × 10 × 1000 × 0.0200 × 10
S o i l   M g 2 + = c × ( V 2 V 1 ) × 2 m × 10 × 1000 × 0.0122 × 10
O M = m 1 × 1.724 × 1.08 m 2 × 100
S A R = [ N a + ] C a 2 + + M g 2 + 1 / 2
where c is the concentration of EDTA standard solution (mol/L); m is the mass of dry soil (g) in the volume of leachate obtained during the analysis; OM is the soil organic matter content, g/kg; m1 is the soil carbon content from the uptake value against the standard curve, mg; m2 is the weighed mass of soil, g; 1.724 is the coefficient for the conversion of soil organic carbon to organic matter (based on an average carbon content of 58 percent of soil organic matter); and 1.08 is the oxidation correction factor. [Na+], [Ca2+], and [Mg2+] represent the concentrations of sodium, calcium, and magnesium ions in irrigation water or soil solution, respectively, measured in mmol/L.

2.3.2. Soil Aggregates

After the completion of the irrigation experiment during the reproductive phase (at the late flowering stage), soil samples were collected from the undisturbed soil between the films at a depth of 0–20 cm. Soil samples (16 × 16 × 8 cm3) were collected and placed in rigid-walled sample containers with a capacity of 1.5 L, sealed, and stored. During transportation, compression and strong movement were strictly avoided. After air drying, the soil blocks were manually broken into pieces about 1 cm in diameter along natural fractures, and all plant and animal residues as well as small stones were removed from the soil samples for later use.
Determination method for non-water-stable aggregates [26]: The prepared soil samples were mixed thoroughly, and 500 g of the mixture was placed into interlocking sieves with pore sizes of 5 mm, 3 mm, 2 mm, 1 mm, 0.5 mm, and 0.25 mm. After covering the top with a lid, the sieves were placed on a horizontal shaker and shaken horizontally at a speed of 180 rpm for 50 s. After shaking, the soil remaining on each sieve was collected and weighed (to the nearest 0.01 g), determining the mass of non-water-stable aggregates in seven size classes, <0.25 mm, 0.25~0.5 mm, 0.5~1 mm 1~2 mm, 2~3 mm, 3~5 mm, and >5 mm, and calculating the percentage of each size class.
Determination method for water-stable aggregates [27,28,29]: According to the percentage of aggregates of each size class obtained by dry sieving, 50 g of air-dried samples was mixed in proportion to each size class and then placed on stacked sieves with pore sizes of 5 mm, 3 mm, 2 mm, 1 mm, 0.5 mm, and 0.25 mm. The stacked sieves were placed on the swing frame of the soil aggregate analyzer (TPF-100) and shaken for 10 min at a frequency of 30 times per minute and an amplitude of 5 cm (during shaking, the soil should not exceed the water level). After the specified time, the water-stable aggregates remaining on each sieve were washed with distilled water in aluminum containers, dried at 60 °C, and weighed. Seven particle size fractions were obtained: <0.25 mm, 0.25~0.5 mm, 0.5~1 mm, 1~2 mm, 2~3 mm, 3~5 mm, and >5 mm.
The calculation formulas for soil aggregate stability indices, including aggregate destruction (PAD), mean weight diameter (MWD), geometric mean diameter (GMD), and fractal dimension (D), are as follows [27,30]:
P A D = W D W W W D
M W D = i = 1 7 r 1 w 1 w
G W D = e x p i = 1 7 w i l n R i = 1 n w i
l g w i ( r < R ¯ t ) w = ( 3 D ) l g R ¯ R m a x
In the formulas, WD represents the percentage (%) of non-water-stable aggregates with a dry sieve particle size >0.25 mm. Ww represents the percentage (%) of water-stable aggregates with a wet sieve particle size >0.25 mm. Wi represents the mass (g) of the size class of aggregates after wet screening. W represents the total mass (g) of the aggregates after wet screening. ri represents the average diameter (mm) of aggregate size class i after wet screening. i is enough from 1 to 7 and provides aggregates with sizes >5 mm, 3~5 mm, 2~3 mm, 1~2 mm, 0.5~1 mm, 0.25~0.5 mm, and <0.25 mm. r represents the average diameter (mm) of aggregates for a given size class after wet screening. Rmax represents the maximum diameter (mm) of the aggregates after wet screening.

2.4. Data Processing and Analysis

The experimental data underwent analysis of variance (ANOVA) tailored to the experimental design in order to evaluate the effect of treatments on soil Na+, Ca2+, Mg2+, SAR, soil aggregates, and soil SOM. The GLM procedure in SPSS [31] (Version 22.0, IBM Corp., Armonk, NY, USA) was employed for conducting the analysis of variance. Treatment means were compared using Duncan’s multiple range tests at a significance of 5%, 1%, and 0.1%. Graphs were created using Origin Pro 2021 software.

3. Results

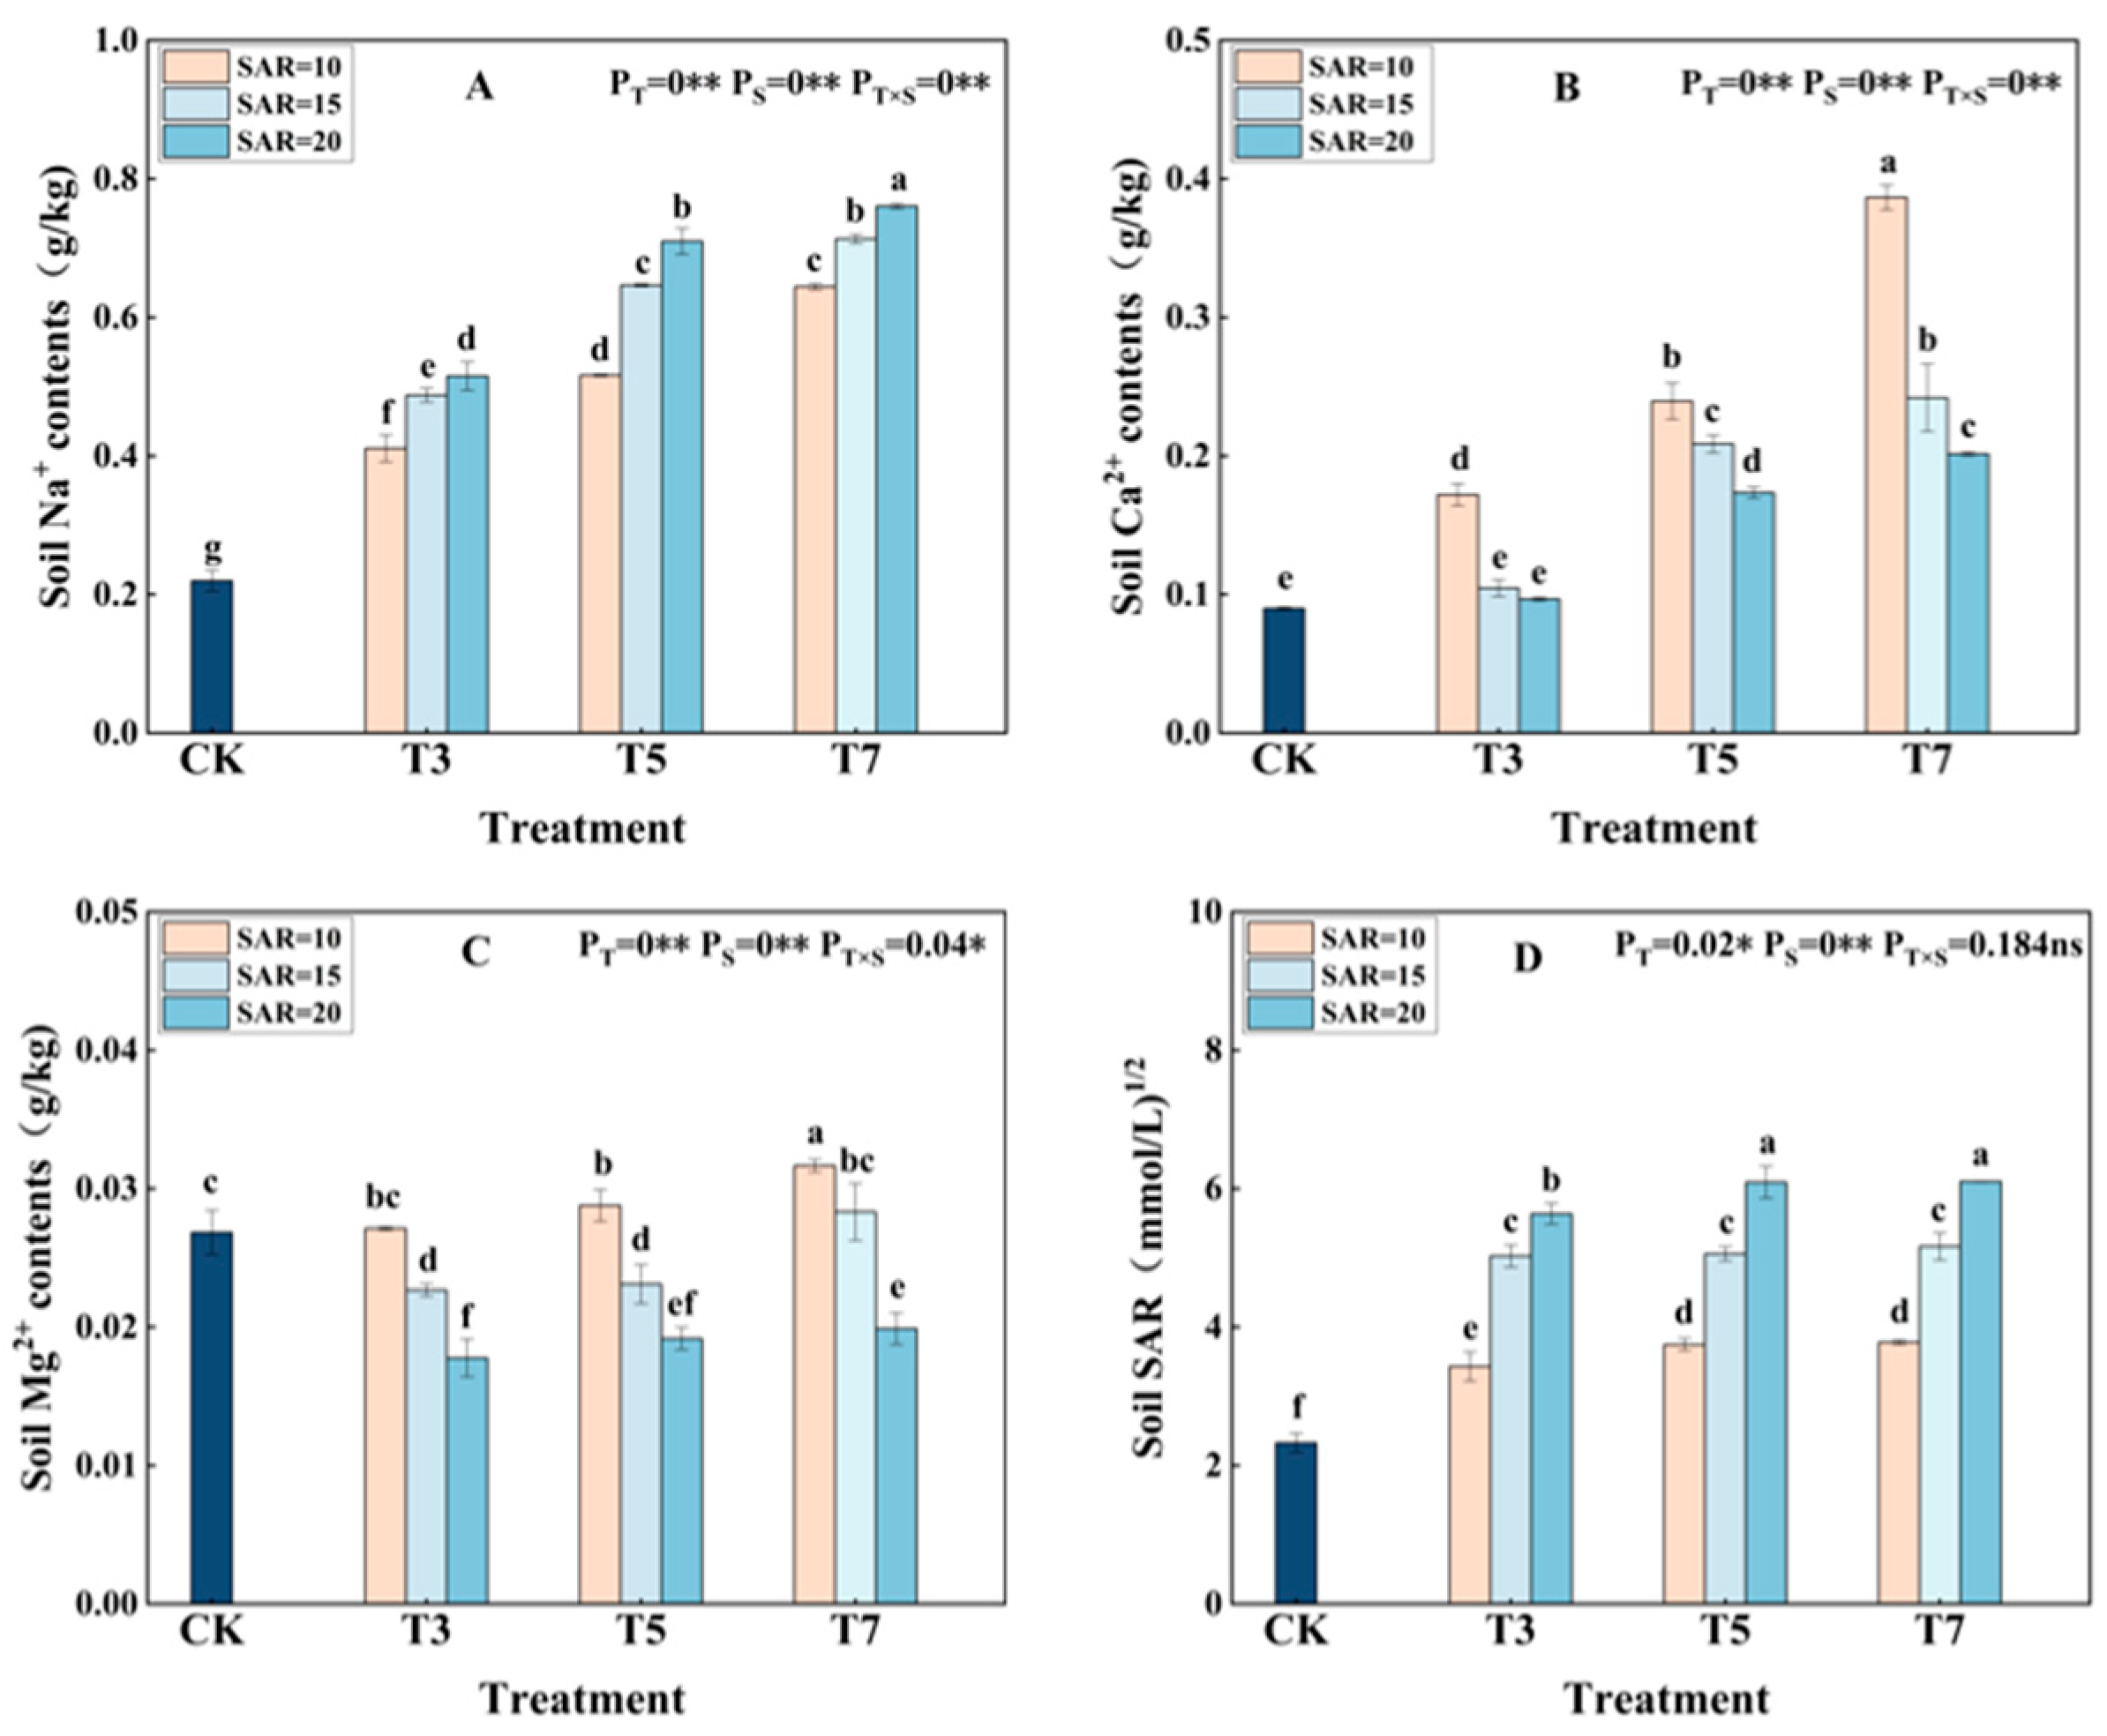
3.1. Impact of Saline Water Irrigation on Soil Ion Content and Soil SAR

3.1.1. Impact of Saline Water Irrigation on Soil Na+, Ca2+, and Mg2+ Content

The soil Na+, Ca2+, and Mg2+ ion contents in the 0~20 cm layer under different irrigation water salinity and sodium adsorption ratio (SAR) conditions are shown in Figure 4. Both the irrigation water salinity and the SAR had highly significant effects on the soil Na+, Ca2+, and Mg2+ content, and their interaction had a highly significant effect on soil Na+ and Ca2+ and a significant effect on Mg2+. Under the same irrigation water salinity conditions, soil Na+ content increased with an increasing irrigation water SAR value, while Ca2+ and Mg2+ content decreased with an increasing SAR value. Compared with CK treatment, the average soil Na+ content increased by 138.44%, 180.31%, and 201.27% in treatments S10, S15, and S20, respectively, and the differences were all significant, indicating that saline water irrigation introduced a large amount of Na+ into the soil. The average soil Ca2+ content increased by 195.94%, 105.91%, and 74.89% in treatments S10, S15, and S20. The average soil Mg2+ content increased by 8.76% in the S10 treatment but decreased by 7.99% and 29.40% in the S15 and S20 treatments, respectively. Under the same SAR conditions of irrigation water, the soil Na+, Ca2+, and Mg2+ contents increased with the increasing irrigation water salinity. Compared with the CK treatment, the average soil Na+ content increased significantly by 114.52%, 184.16%, and 221.35% in treatments T3, T5, and T7. The average soil Ca2+ content increased significantly by 38.43%, 130.50%, and 207.81% in treatments T3, T5, and T7. The average soil Mg2+ content significantly decreased by 16.08%, 11.74%, and 0.80% in treatments T3, T5, and T7, respectively. It can also be seen from Figure 4 that compared to the T3S20 treatment, although the total salinity of the T5S10 treatment increased by 66.7%, the Na+ content in the soil did not increase significantly, while the Ca2+ and Mg2+ contents increased significantly by 147.76% and 61.96%, respectively. Compared with the T5S20 treatment, the total salinity of the T7S10 treatment increased by 40%, but the soil Na+ content decreased significantly by 9.25%, while the Ca2+ and Mg2+ content significantly decreased by 122.85% and 65%, respectively.

3.1.2. Impact of Saline Irrigation on Soil SAR

The soil SAR in the 0~20 cm soil layer under different conditions of irrigation water salinity and SAR is shown in Figure 4D. The salinity of the irrigation water significantly influenced the soil SAR at 0~20 cm, while the SAR of the irrigation water had a highly significant influence on the SAR of the soil, and their interaction had no influence on the SAR of the soil. Under the same conditions of irrigation water salinity, the soil SAR value increased with the increase in the irrigation water SAR value. Compared with the CK treatment, the average soil SAR content increased significantly by 56.93%, 118.41%, and 155.40% in treatments S10, S15, and S20. Under the same irrigation water SAR conditions, the soil SAR showed an increasing trend with increasing irrigation water salinity. Compared with the CK treatment, the average soil SAR increased significantly by 101.85%, 113.36%, and 115.52% in treatments T3, T5, and T7. However, the difference between the T5 and T7 treatments did not reach a significant level, indicating that moderate to high salinity did not have a significant impact on the soil SAR. This suggests that the ion content of soil, such as Na+, Ca2+, and Mg2+, was not only influenced by the salinity of irrigation water but also limited by differences in the ion composition of the irrigation water.

3.2. Impact of Saline Water Irrigation on Soil Aggregates

3.2.1. Impact of Saline Water Irrigation on Soil Macroaggregate Stability

The particle size distribution of soil macroaggregate stability in the soil layer at 0~20 cm under different conditions of irrigation water salinity and SAR for cotton is shown in Figure 5A–C. Large aggregates (LAs) refer to aggregates with a diameter of >2 mm; small aggregates (SAs) refer to aggregates with a diameter of >0.25 mm and <2 mm; and microaggregates (IAs) refer to aggregates with a diameter of >0.25 mm [32]. The different salinity and SAR of irrigation water significantly impacts LAs, SAs, and IAs. The interaction between the irrigation water salinity and SAR had an extremely significant impact on LAs and IAs and a significant impact on SAs. Under the same salinity conditions of the irrigation water, the relative content of LAs and SAs decreases with an increasing SAR value of irrigation water, while the relative LA content increases with an increasing SAR value of irrigation water. Compared with the CK treatment, the average relative soil LA content decreased by 13.26%, 28.56%, and 33.52% in treatments S10, S15, and S20. The average relative SA content decreased by 0.28%, 2.62%, and 10.42%, respectively. The average relative IA content increased by 28.11%, 60.34%, and 78.71%, respectively. Under the same SAR conditions of the irrigation water, the relative IA and SA contents decreased with increasing irrigation water salinity, while the relative LA content increased with increasing irrigation water salinity. Compared with the CK treatment, the average relative content of large soil aggregates decreased by 13.63%, 24.73%, and 37.43% in treatments T3, T5, and T7, respectively. There was no significant difference in the average relative content of small aggregates in treatment T10, while the average relative content of soil SAs decreased by 3.54% and 10.40% in treatments T15 and T20, respectively. The average relative content of microaggregates in treatments T10, T15, and T20 increased by 27.08%, 53.70%, and 86.38%, respectively. Therefore, increasing the salinity and SAR of irrigation water mainly disturbs large and small soil aggregates, resulting in the dispersion of soil structure and an increase in microaggregate content. In addition, it can be seen from Figure 5A–C that there were no significant differences in the ratio of the LA and SA content between the CK treatment and the T3S10 treatment. Compared with the T3S20 treatment, the T5S10 treatment showed a significant increase in the relative LA content by 18.21%, while the relative SA content did not increase significantly, and the relative LA content decreased significantly by 20.35%. Compared with the T5S20 treatment, the T7S10 treatment showed a significant increase in the relative LA content of 7.43%, a significant increase in the relative SA content of 8.35%, and a significant decrease in the relative IA content of 8.37%. This indicates that a moderate reduction in the irrigation water SAR at medium to high irrigation water salinity can stabilize both large and small soil aggregates, thereby mitigating the extent of soil aggregate structure degradation.

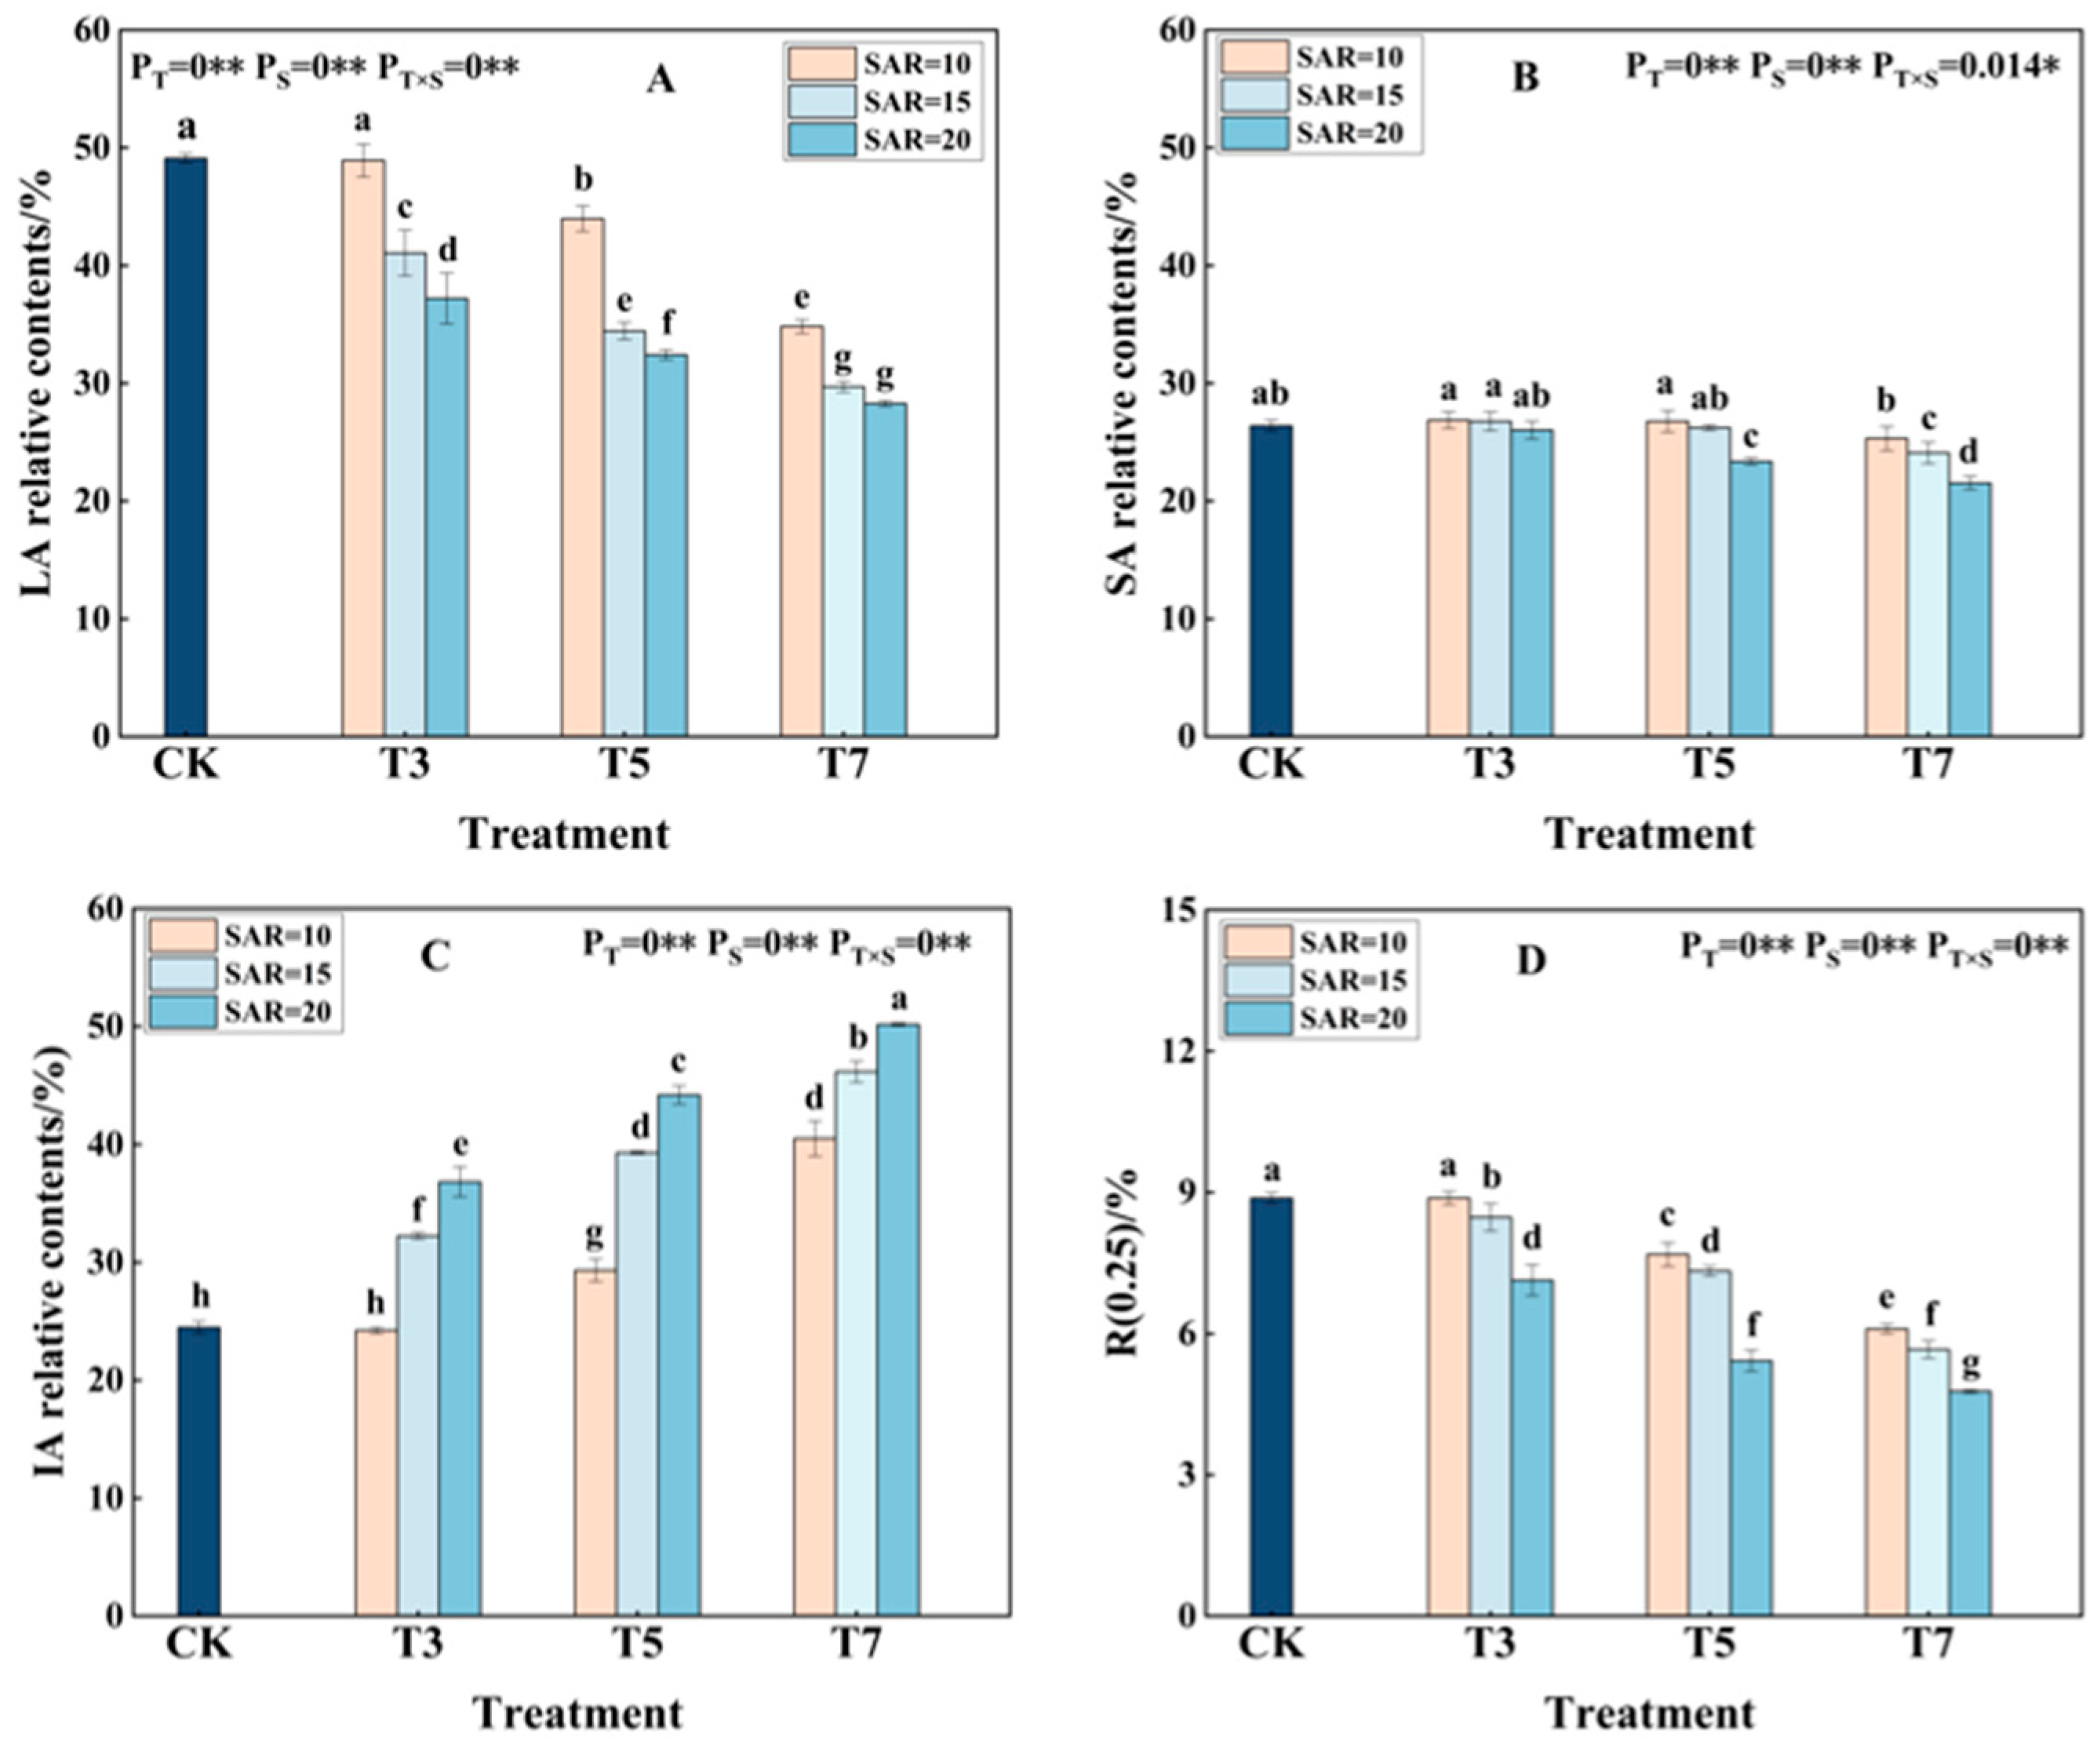
3.2.2. The Impact of Saline Water Irrigation on Soil Water-Stable Aggregates

The relative content of water-stable aggregates (R0.25mm) in the 0~20 cm soil layer under different irrigation water salinity and SAR conditions is shown in Figure 5D. The irrigation water salinity, the SAR, and their interaction have extremely significant effects on the relative content of R0.25mm aggregates. Under the same irrigation water salinity conditions, the relative content of R0.25mm aggregates decreased with an increasing irrigation water SAR. Compared with the CK treatment, the relative content of R0.25mm aggregates decreased by 14.94%, 36.24%, and 46.23% in treatments S10, S15, and S20, respectively. Under the same SAR conditions of the irrigation water, the relative content of R0.25mm aggregates decreased with an increasing irrigation water salinity. Compared with the CK treatment, the relative content of R0.25mm aggregates decreased by 8.10%, 23.28%, and 37.92% in treatments T3, T5, and T7, respectively. Furthermore, it can be seen from Figure 5D that there were no significant differences in the relative content of R0.25mm aggregates between the CK treatment and the T3S10 treatment. The relative content of R0.25mm aggregates significantly increased by 7.66% in the T5S10 treatment compared to the T3S20 treatment. Furthermore, compared with the T5S20 treatment, the relative content of R0.25mm aggregates increased significantly by 12.43% in the T7S10 treatment.
The stability evaluation indices of water-stable aggregates in the 0~20 cm thick soil layer for cotton under different conditions of irrigation water salinity and SAR are shown in Table 4. Irrigation water salinities and the SAR significantly influence the fractal dimension (D), degree of destruction (PAD), mean weight diameter (MWD), and geometric mean diameter (GMD) of water-stable aggregates, and the interaction between the two significantly influences the D and GMD. As the irrigation water salinity and SAR increase, the D and PAD show an increasing trend, while the MWD and GMD show a decreasing trend. Under the same irrigation water salinity conditions, the D and PAD increase with an increasing irrigation water SAR, while the MWD and GMD decrease with an increasing irrigation water SAR. Under the same SAR conditions of the irrigation water, the D and PAD increase with increasing irrigation water salinity, while the MWD and GMD decrease with increasing irrigation water salinity. From Table 4, it can be seen that there were no significant differences in the D, PAD, MWD, and GMD between the T3S10 treatment and the CK treatment. Compared with the T3S20 treatment, the D and PAD of the T5S10 treatment decreased by 0.12 and 0.73%, respectively, while the MWD and GMD increased by 3.58 and 0.72%, respectively. Furthermore, compared to the T5S20 treatment, the D and PAD of the T7S10 treatment decreased by 0.14 and 1.52%, respectively, while the MWD and GMD increased by 3.98 and 1.53%, respectively.

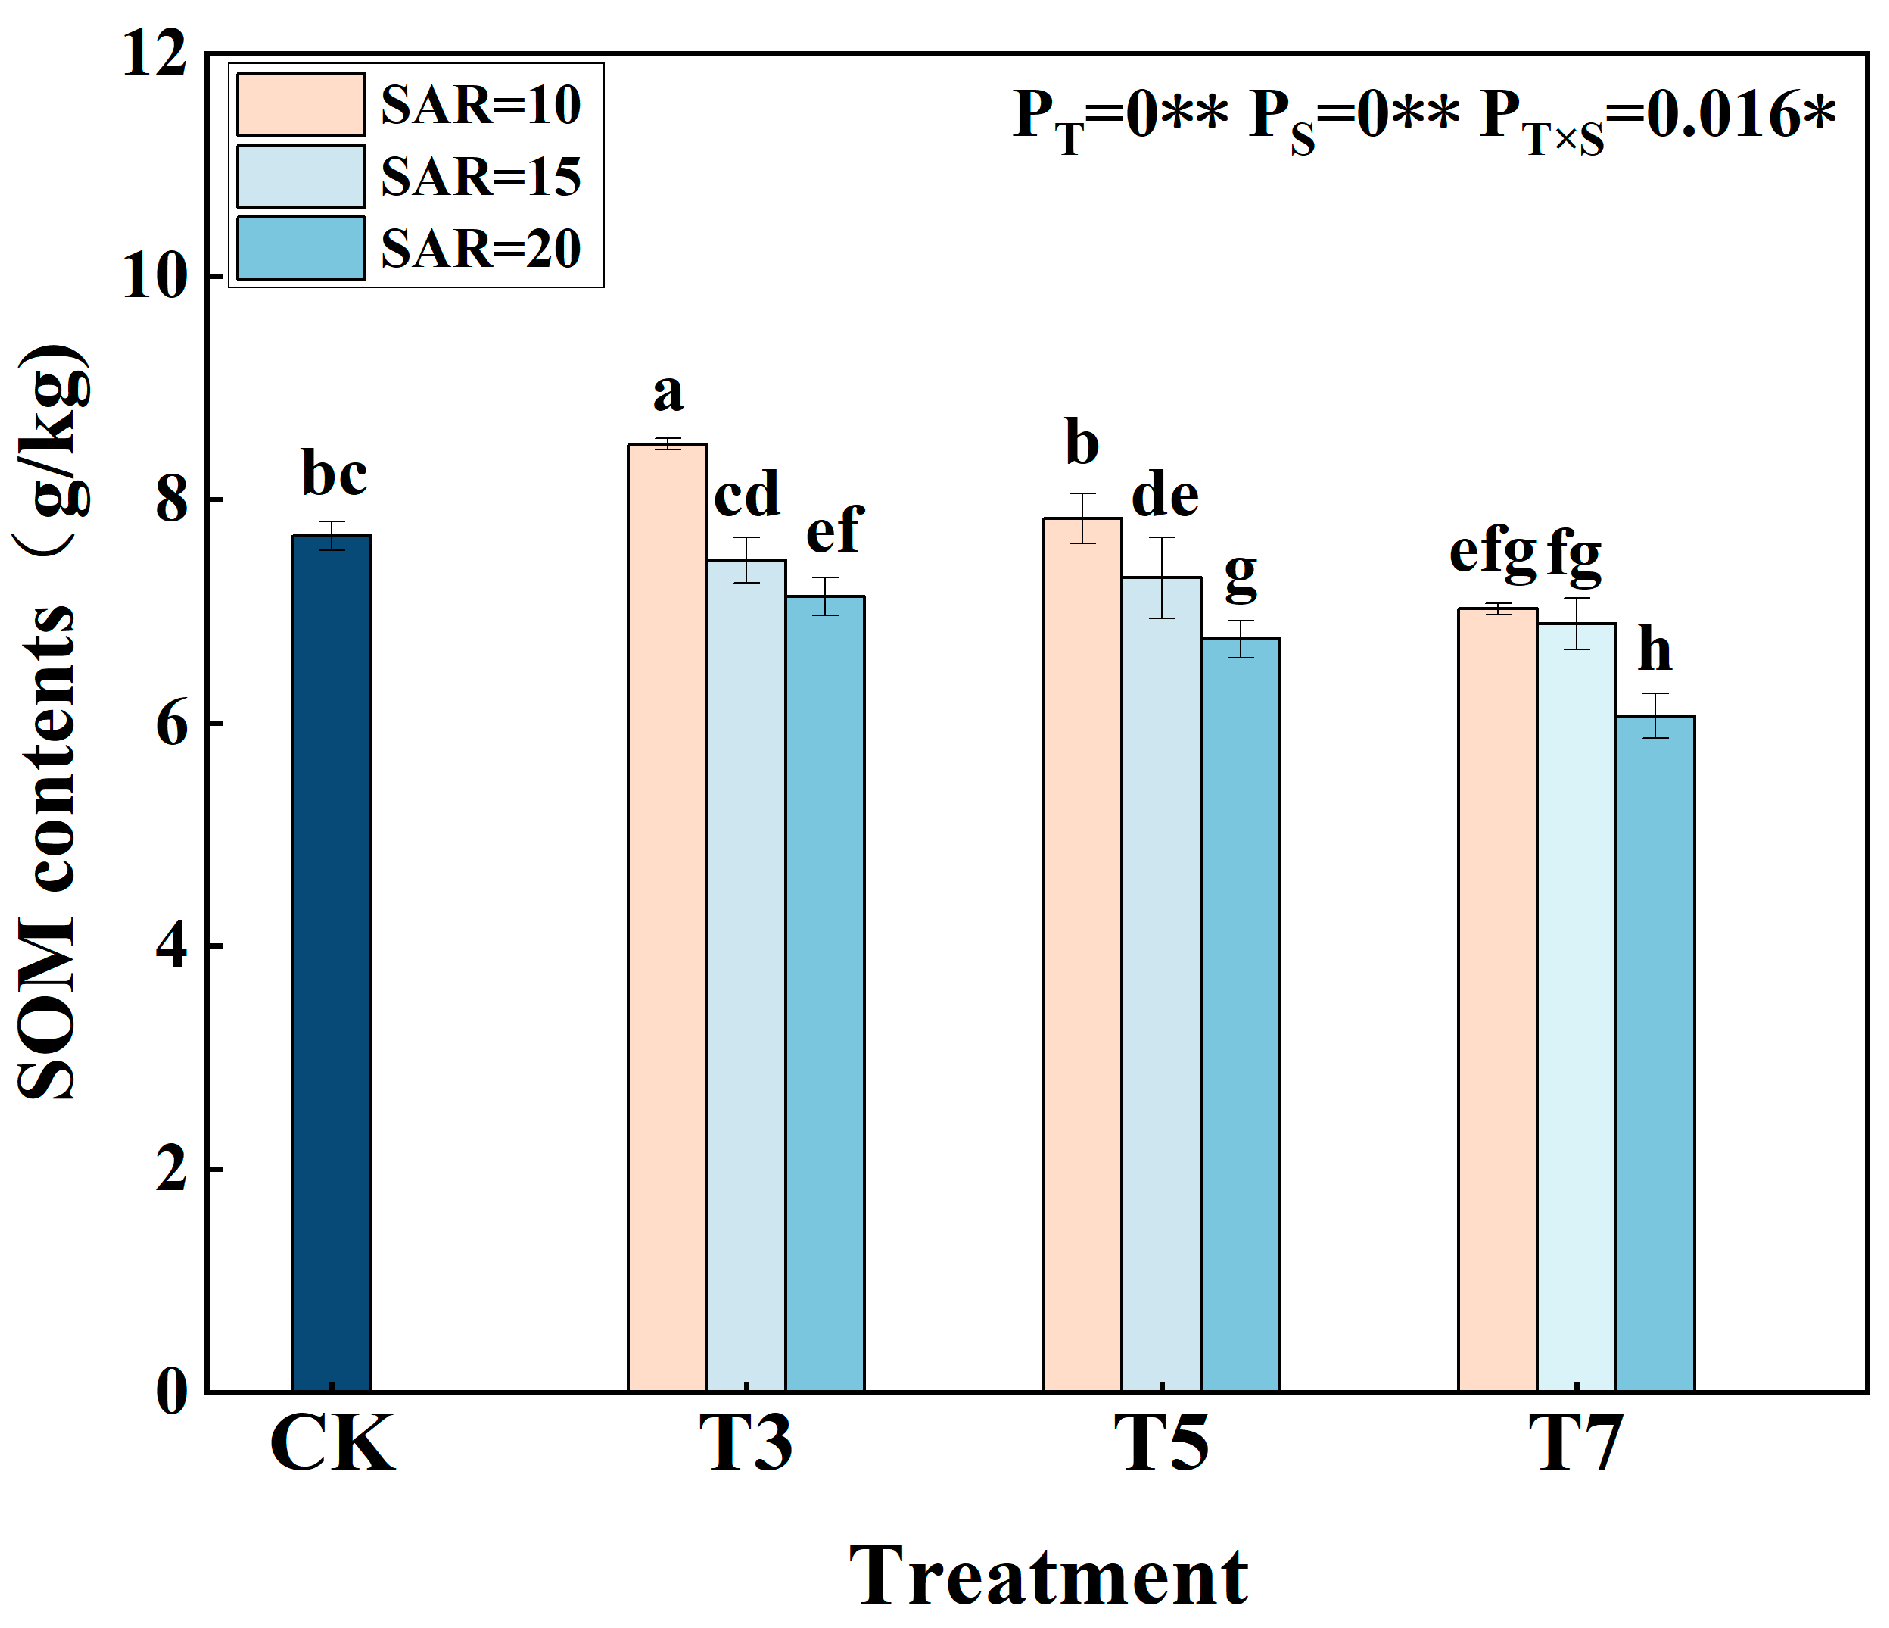
3.3. The Impact of Saline Water Irrigation on Soil Organic Matter

The soil organic matter (SOM) content in the 0~20 cm soil layer under different conditions of irrigation water salinity and SAR is shown in Figure 6. The irrigation water salinity, the SAR, and their interaction significantly affect the soil organic matter (SOM) content. Under the same irrigation water salinity conditions, the SOM content decreases with an increasing irrigation water SAR. Under the same SAR conditions of the irrigation water, the SOM content decreases with increasing salinity. Under low irrigation water salinity conditions (3 g/L), compared to the CK treatment, the SOM content significantly increased by 10.71% in the T3S10 treatment, while it increased by 2.84% and 7.11% in the T3S15 and T3S20 treatments, respectively. Under the conditions of moderate irrigation water salinity (5 g/L), the SOM content decreased by 5.39%, 6.92%, and 15.19% in treatments T5S10, T5S15, and T5S20, respectively, compared to the CK treatment. Under conditions of high irrigation water salinity (7 g/L), reducing the SAR of the irrigation water is not enough to protect the formation of the SOM. Furthermore, it can be seen from Figure 6 that the SOM significantly increased by 9.86% in the T5S10 treatment compared to the T3S20 treatment. This indicates that although the T5S10 treatment increased the salinity of the irrigation water, the SOM content could be maintained by reducing the SAR of the irrigation water.

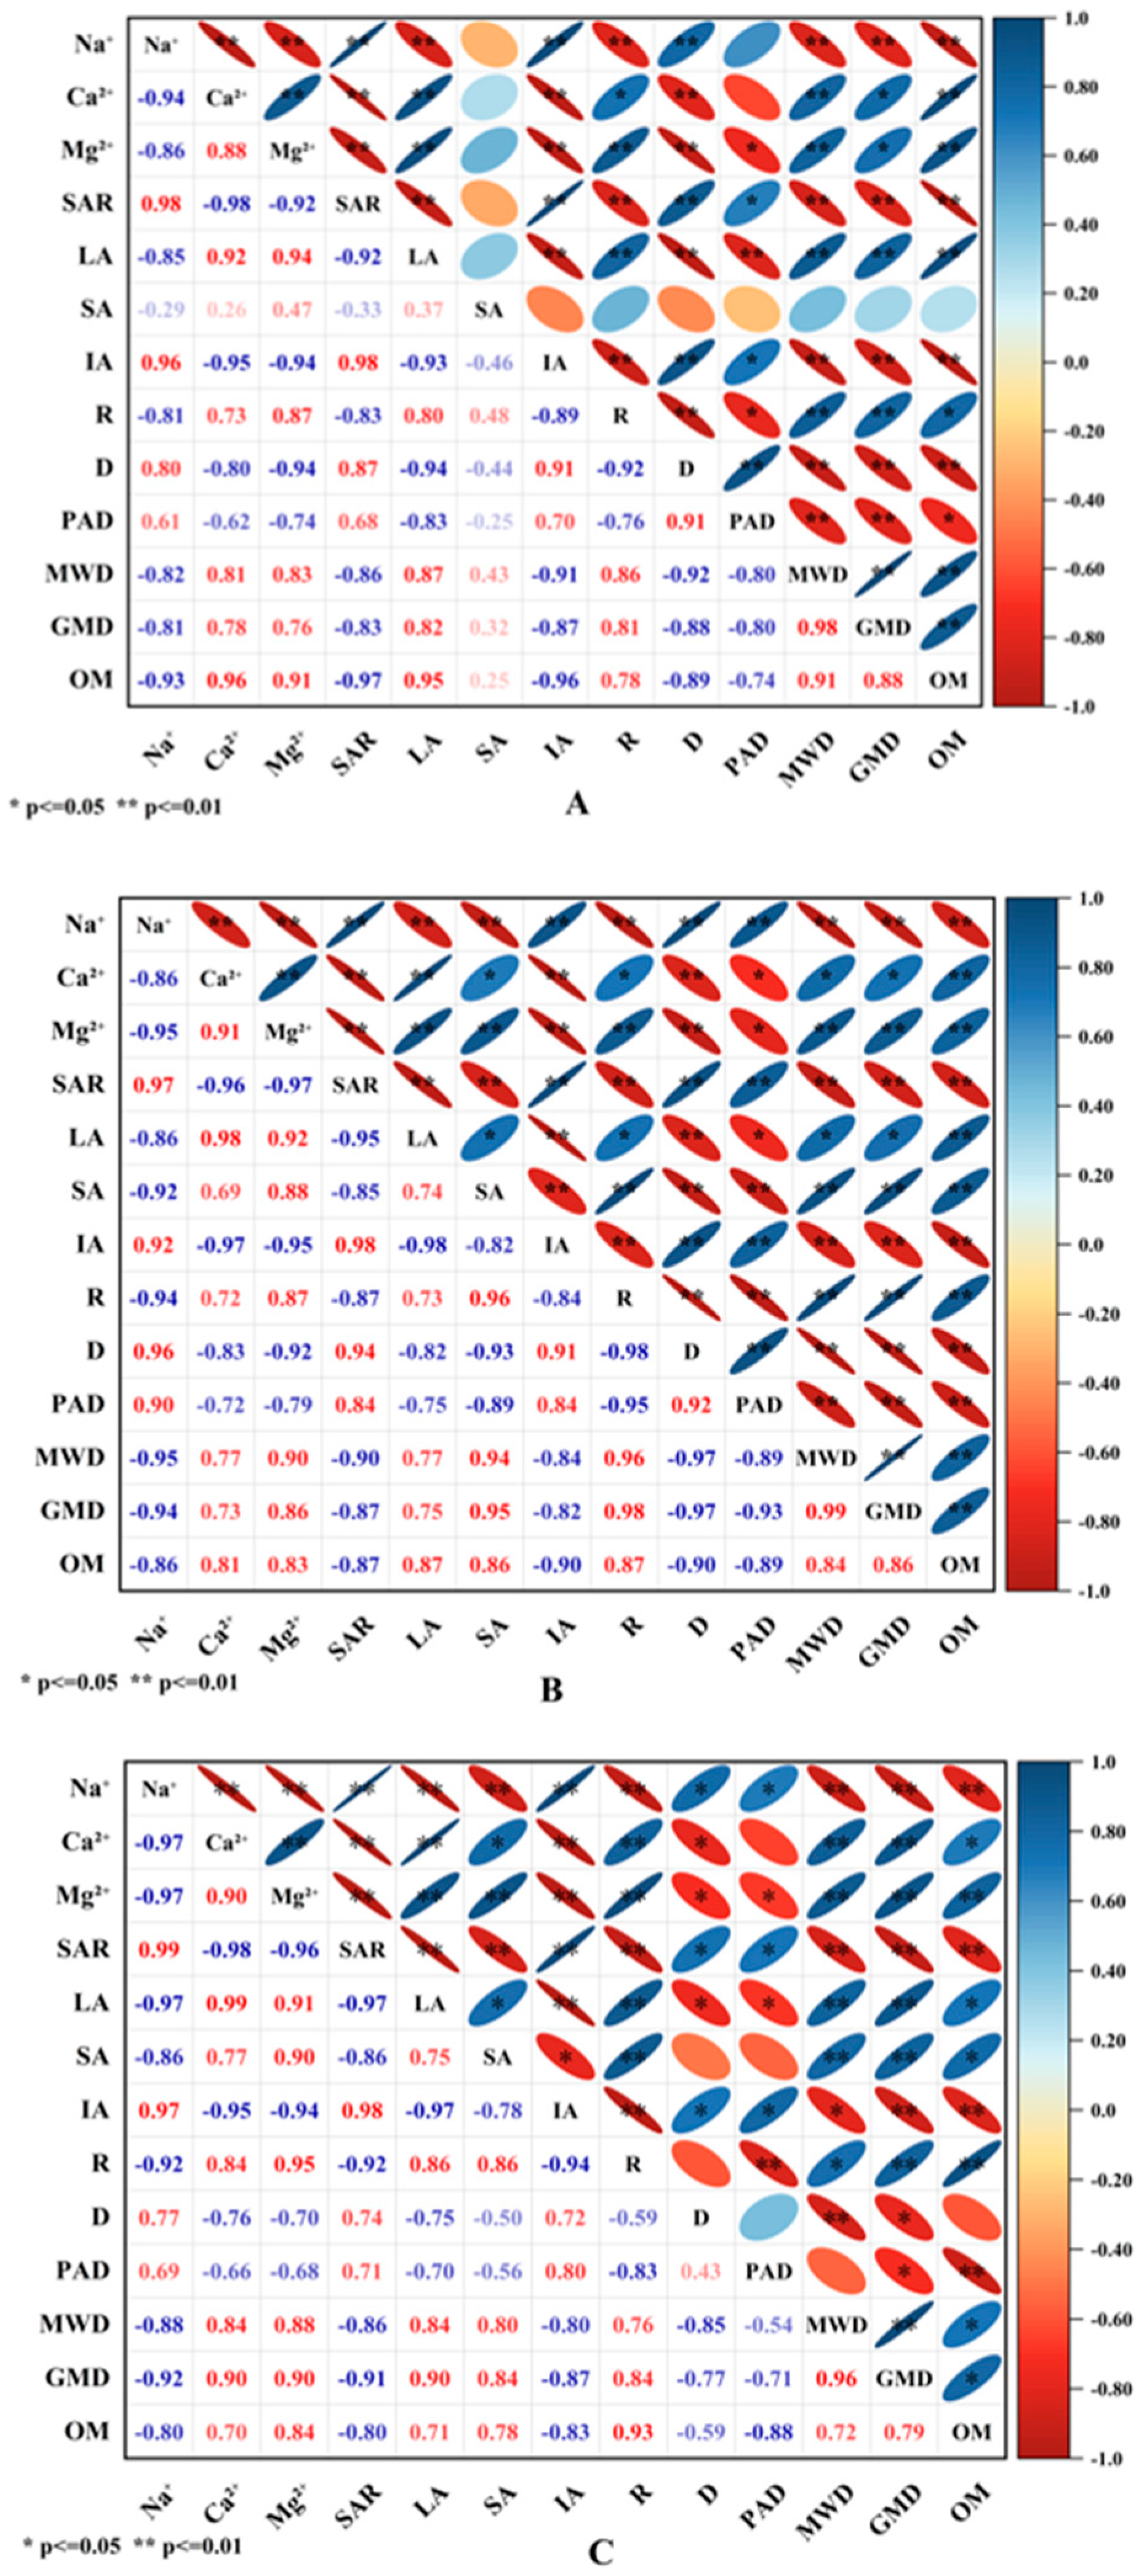
3.4. The Correlation Analysis of Indicators

Based on the observed results of various soil indicators, the correlation between soil Na+, Ca2+, Mg2+, SAR, LAs, SAs, IAs, R, D, PAD, MWD, GMD, OM, etc., was analyzed according to the classification of mineralization (Figure 7). The main results are as follows: (1) soil Na+ shows a significant negative correlation with the soil LAs, SAs, R, MWD, and GMD; (2) the soil Ca2+ has a positive correlation with the soil LAs; (3) the soil SAR is significantly negatively correlated with the soil LAs, SAs, MWD, and GMD and significantly positively correlated with the D and PAD; (4) the soil LAs are significantly positively correlated with the R, MWD, GMD, and OM; and (5) the soil R is significantly positively correlated with the OM. In summary, Na+ in the soil can disrupt the formation of macroaggregates, microaggregates, and water-stable aggregates in the soil, while Ca2+ in the soil can protect the formation of macroaggregates and water-stable aggregates in soil, thereby influencing the formation of soil organic matter.

4. Discussion

4.1. The Effect of Different Ion Composition in Saline Water on Partial Soil Ions and Sodium Adsorption Ratio (SAR)

Saline water contains various chemical elements that, when entering the soil, interact with the soil solution and solid particles, resulting in changes in soil structural properties, thereby affecting the physicochemical properties of the soil itself and the transport dynamics of water and salt in the soil [33]. The status of the soil SAR is a reference base for preventing or ameliorating sodium hazards (commonly known as alkali hazards), which is of great importance for improving the ecological environment of saline and alkaline soils [34]. This study found that although the content of Na+, Ca2+, and Mg2+ in the soil increases with an increasing irrigation water salinity, the increase in the Na+ content is larger, resulting in an increase in the SAR with increasing irrigation water salinity (Figure 4). This is contradictory to the results of Shehzad et al. [35], where the increase in the soil Na+ content with increasing salinity was accompanied by a decrease in the Ca2+ and Mg2+ content. This difference is attributed to the significant differences in soil properties between their experimental clay soil and the sandy loam soil in this experiment, as well as differences in the ionic composition of the irrigation water. The increase in the soil SAR with an increasing irrigation water salinity is consistent with the findings of Dastranj et al. [36], as the increase in the soil Na+ content with increasing salinity is higher than that of Ca2+ and Mg2+. However, the increase in the soil Na+ content with an increasing irrigation water SAR and the decrease in the soil Ca2+ and Mg2+ content with an increasing irrigation water SAR are due to the fact that Na+ in the soil can displace Ca2+ and Mg2+ on soil colloids, thereby increasing the relative Na+ content in surface soil and decreasing the Ca2+ and Mg2+ content [37]. Therefore, the soil SAR increases with the increase in the irrigation water SAR.

4.2. The Impact of Different Ion Compositions in Saline Water on Soil Aggregates

Soil aggregates are the basic units of soil structure and contribute to the stability of the soil structure, the protection of soil organic matter, and the preservation of soil nutrients [38,39]. Previous studies have shown that the greater the number of macroaggregates in the soil, the stronger the stability of the soil structure [21]. The number of water-stable aggregates with a diameter >0.25 mm is commonly used as an indicator to measure the stability of water-stable aggregates in soil [40]. Parameters such as aggregate disturbance (PAD), fractal dimension (D), mean weight diameter (MWD), and geometric mean diameter (GMD) are important indicators for characterizing the condition of soil aggregates. Smaller PAD and D values as well as larger MWD and GMD values indicate a greater stability of soil water-stable aggregates [41,42]. The results of the present study found that the content of the water-stable agglomerates with diameters greater than 0.25 mm (R0.25mm) and the MWD and the GMD decreased with increasing irrigation water mineralization, while both the D and PAD increased with increasing irrigation water mineralization, which is in accordance with the results (Figure 5 and Table 4) of Bi Yanpeng et al. [43]. On the one hand, Na+ in the soil with fewer charges and a relatively larger radius has a lower hydration energy, and its presence causes soil particles to expand and spread, thereby reducing the number of macroaggregates [44]. Soil organic matter, microbial secretions, and other factors have an important influence on aggregate formation and stability [45], while salt is introduced by saline water.
The research results of Wu et al. [8] suggest that the optimal salinity threshold for irrigation is 2 g/L, which is inconsistent with the results of this study, as they did not consider the effect of ionic composition on soil aggregates. In this study, there was no significant difference in the relative content of soil aggregates between the T3S10 treatment and the CK treatment, indicating that increasing the appropriate content of Na+ and Ca2+ in the soil would not damage the structure of the soil aggregates [33]. LAs and SAs increased in the T5S10 treatment compared to the T3S20 treatment and in the T7S10 treatment compared to the T5S20 treatment, while LAs decreased and R0.25mm increased. This indicates that there are limitations to relying solely on salinity as a basis for assessing soil structure and that the difference in the ionic composition of irrigation water represented by the SAR has a significant impact on experimental results. In the present study, mineralization was found to be less than 5 g/L; reducing the SAR of irrigation water can protect soil aggregates by increasing the soil Ca2+ levels. This is because the Ca2+ of the soil allows the cations adsorbed on the surface of the soil particles to bind more tightly and maintain the soil structure [46]. When the salinity exceeded 7 g/L, although the soil Ca2+ content increased by 122.85% under low SAR conditions, the macroaggregates only increased by 7.43%, indicating that high salinity made the maintenance of the macroaggregates more difficult by a significant increase in the Ca2+ content. This is because high levels of Na+ disintegrate, swell, and disperse soil particles [33]. However, since the experiment only observed soil aggregates at the end of a one-year growing season, further research is needed to reveal the interaction between the salinity and SAR of irrigation water at different growth stages from the perspective of soil aggregates and finally seek the optimal combination of salinity and the SAR.

4.3. The Impact of Different Ion Compositions in Saline Water on Soil Organic Matter

Soil organic matter (SOM) content is the result of the balance between the input of exogenous organic matter and the decomposition of soil organic matter and is one of the important indicators for measuring soil quality [47]. This study found that the SOM content decreased with an increasing irrigation water salinity, which is consistent with the findings of Wei Kai et al. [48]. The decrease in the SOM content with the increase in the irrigation water SAR is caused by the increase in the soil Na+ content, which damages the relative content of soil macroaggregates, thereby weakening the ability of the soil to fix and store organic matter. Furthermore, plant growth is suppressed, leading to a reduction in sources of organic matter such as above-ground litter [49]. This study also found that the T3S10 treatment significantly increased the SOM content compared to the CK treatment. This is because the T3S10 treatment increased the soil Na+ content without damaging soil aggregates (Figure 5), while the soil Ca2+ content increased. Ca2+ binds negatively charged soil colloids and soil organic matter, reducing the risk of soil organic matter mineralization and further protecting organic matter [46]. On the other hand, the natural death of microbial biomass during microbial turnover can increase the soil organic matter content [50]. Future research should focus on microbial diversity and soil enzyme activity to further elucidate the underlying mechanisms and provide a basis for the green and sustainable development of saline and alkaline soils. Compared with the T3S20 treatment, the SOM content increased significantly in the T5S10 treatment. This indicates that although the T5S10 treatment increased the salinity of irrigation water, the SOM can be maintained by reducing the SAR of irrigation water. This is because there was no significant difference in the soil Na+ content between the T3S20 and T5S10 treatments, while the soil Ca2+ content in the T5S10 treatment was 2.48 times higher than that in the T3S20 treatment. Soil Ca2+ can protect the formation of soil macroaggregates, which contain more SOM than microaggregates [51], and thus has a positive significance in alleviating the damage caused by Na+ in soil.

5. Conclusions

In this study, the effects of irrigation water mineralization and the SAR on soil aggregates and organic matter were investigated in detail. The results showed that soil Ca2+ and Mg2+ contents increased with the increasing mineralization of irrigation water and decreased with the increasing SAR of irrigation water. Under the same mineralization levels as brackish water irrigation, the Ca2+ content of soil could be increased by reducing the sodium adsorption ratio (SAR) of irrigation water, which could effectively reduce the destruction of soil aggregates and increase the organic matter content. When the mineralization of irrigation water was maintained at 3 g/L and the sodium adsorption ratio was controlled at 10 (mmol/L)1/2, it was more favorable for maintaining the stability of soil aggregates and organic matter. These findings not only provide an important theoretical basis and practical guidance for soil management in brackish water irrigation areas but also contribute to soil health and sustainable agricultural development. In the future, further studies should be conducted on the changes in soil microbial activity under different irrigation water conditions and the long-term effects of soil amendments and agronomic management measures on soil structure and function to promote the rational use and protection of soil resources in brackish water irrigation areas.

Author Contributions

H.L. and X.W. planned and designed the experiments; Y.X., W.Z., P.X., Y.S. and N.L. performed the experiments; Y.X. analyzed the data and wrote the draft manuscript; H.N. and X.Z. contributed reagents/materials and tools; H.L., X.W. and H.N. revised this manuscript. All authors have read and agreed to the published version of this manuscript.

Funding

This work was supported by the National Key R&D Program of China (no. 2022YFD1900502), the Central Public-interest Scientific Institution Basal Research Fund (Farmland Irrigation Research Institute, CAAS, FIRI2022-06), and the Earmarked Fund for China Agriculture Research System (CARS-15-13).

Data Availability Statement

The data presented in this study are available on request from the corresponding author; due to policy and legal reasons, data are classified and not disclosed.

Conflicts of Interest

The authors declare no conflicts of interest.

References

  1. Rizwan, M.; Zaheer, J.; Tahir, M.; Ansar, M.; Ali, M. Benefits of Research and Development on Cotton Crop: Lessons from China. Dinkum J. Nat. Sci. Innov. 2023, 2, 509–513. [Google Scholar]
  2. National Bureau of Statistics. Announcement on 2023 Cotton Production. China Information News, 26 December 2023. [Google Scholar] [CrossRef]
  3. Wang, H.; Feng, D.; Zhang, A.; Zheng, C.; Li, K.; Ning, S.; Zhang, J.; Sun, C. Effects of saline water mulched drip irrigation on cotton yield and soil quality in the North China Plain. Agric. Water Manag. 2022, 262, 107405. [Google Scholar] [CrossRef]
  4. Zhang, J.P.; Feng, D.; Cao, C.Y.; Sun, J.S.; Sun, C.T.; Zheng, C.L.; Liu, H. Effects of irrigation with saline water on growth and water use efficiency of film-mulched cotton plant. J. Drain. Irrig. Mach. Eng. 2014, 32, 448–455. [Google Scholar]
  5. Yang, G.; Li, F.; Tian, L.; He, X.; Gao, Y.; Wang, Z.; Ren, F. Soil physicochemical properties and cotton (Gossypium hirsutum L.) yield under brackish water mulched drip irrigation. Soil Tillage Res. 2020, 199, 104592. [Google Scholar] [CrossRef]
  6. Li, W.; Zhao, L.; Yang, G.; Yan, K.; He, X.; Gao, Y.; Xue, L.; Li, F.; Wu, Y. Water source and transmission in Haloxylon ammodendron in the desert margin of the Manas River Basin, China. Isr. J. Ecol. Evol. 2021, 67, 156–167. [Google Scholar] [CrossRef]
  7. Rodrigues, V.d.S.; Sousa, G.d.; Saraiva, S.E.L.; Cardoso, E.d.C.; Pereira Filho, J.V.; Viana, T.d.A. Atributos químicos do solo em área cultivada com milho sob irrigação com água salina. Rev. Bras. Agric. Irrig. 2018, 12, 3129–3138. [Google Scholar] [CrossRef]
  8. Wu, Y.; Zheng, C.; Li, K.; Dang, H.; Li, Q.; Li, S.; Zhang, J. Effect of Saline Water Irrigation on Soil Water-stable Aggregates in Wheat-maize Crop Double Cropping System. J. Soil Water Conserv. 2021, 35, 288–294+308. [Google Scholar]
  9. Zhu, C.; Yang, H.; Feng, G.; Han, L.; Wang, C.; Zhai, Y.; Feng, B.; Zhao, T. Effect of vertically rotary sub-soiling tillage and saline water irrigation on water and salt movement in soil. J. Irrig. Draijnage 2024, 43, 1–7. [Google Scholar] [CrossRef]
  10. Guo, X.; Yang, M.; Ye, Y.; Guo, H.; Min, W. Response of ammonia-oxidzing microbial community to irrigation water salinity and nitrogen application in grey desert soil of cotton field in Xinjiang. Agric. Res. Arid. Areas 2024, 42, 231–244. [Google Scholar] [CrossRef]
  11. Rajkumar, R.; Nemichandrappa, M.; Anilkumar, T.D.; Ayyanagowdar, M.; Polisgowdar, B.; Satyanarayana, R.; Vishwanatha, J. Effect of different irrigation methods and saline water on soil properties in tomato (Solanum lycopersicum) crop under vertisols of Tungabhadra project command. Int. J. Chem. Stud. 2019, 7, 2952–2957. [Google Scholar]
  12. Qiao, R.; Cheng, Y.; Yan, S.; Luo, M.; Wang, C.; Zhang, T.; Zhang, T. Effects of saline water with different cations on soil hydraulic properties and lettuce growth. J. Drain. Irrig. Mach. Eng. 2023, 41, 288–295. [Google Scholar] [CrossRef]
  13. Zhou, Y.; Chen, J.; Li, Y.; Hou, Z.; Min, W. Effects of Cotton Stalk Returning on Soil Enzyme Activity and Bacterial Community Structure Diversity in Cotton Field with Long-term Saline Water Ittigation. Environ. Sci. 2022, 43, 2192–2203. [Google Scholar] [CrossRef]
  14. Li, B.; Cao, Y.; Guan, X.; Li, Y.; Hao, Z.; Hu, W.; Chen, L. Microbial assessments of soil with a 40-year history of reclaimed wastewater irrigation. Sci. Total Environ. 2019, 651, 696–705. [Google Scholar] [CrossRef] [PubMed]
  15. Zhou, S.; Wang, G.; Zhang, J.; Dang, H.; Gao, Y.; Sun, J. Long-term saline water irrigation has the potential to balance greenhouse gas emissions and cotton yield in North China plain. J. Environ. Manag. 2024, 352, 120087. [Google Scholar] [CrossRef] [PubMed]
  16. Ahmad, S.; Hussain, I.; Ghaffar, A.; Rahman, M.H.U.; Saleem, M.Z.; Yonas, M.W.; Hussnain, H.; Ikram, R.M.; Arslan, M. Organic amendments and conservation tillage improve cotton productivity and soil health indices under arid climate. Sci. Rep. 2022, 12, 14072. [Google Scholar] [CrossRef] [PubMed]
  17. Tao, R.; Hu, B.; Chu, G. Impacts of organic fertilization with a drip irrigation system on bacterial and fungal communities in cotton field. Agric. Syst. 2020, 182, 102820. [Google Scholar] [CrossRef]
  18. Soares, L.A.d.A.; Fernandes, P.D.; Lima, G.S.d.; Silva, S.S.d.; Moreira, R.C.; Medeiros, T.L. Phytomass and production components of colored cotton under salt stress in different phenological stages. Rev. Bras. Eng. Agrícola E Ambient. 2021, 25, 132–138. [Google Scholar] [CrossRef]
  19. Chen, W.; Jin, M.; Ferre, T.P.A.; Liu, Y.; Xian, Y.; Shan, T.; Ping, X. Corrigendum to ‘Spatial distribution of soil moisture, soil salinity, and root density beneath a cotton field under mulched drip irrigation with brackish and fresh water’ [Field Crops Research 215 (2018) 207–221]. Field Crops Res. 2018, 226, 83. [Google Scholar] [CrossRef]
  20. Xiao, C.; Li, M.; Fan, J.; Zhang, F.; Li, Y.; Cheng, H.; Li, Y.; Hou, X.; Chen, J. Salt Leaching with Brackish Water during Growing Season Improves Cotton Growth and Productivity, Water Use Efficiency and Soil Sustainability in Southern Xinjiang. Water 2021, 13, 2602. [Google Scholar] [CrossRef]
  21. Saadat, S.; Esmaeelnejad, L.; Rezaei, H.; Mirkhani, R.; Seyedmohammadi, J. Comparing aggregate stability tests as one of the soil physical quality indicators. J. Water Soil 2019, 33, Pe289–Pe303. [Google Scholar]
  22. Wang, L.; Liu, H.; Gao, F.; Ning, H.; Han, Q.; Xu, X.; Wang, X.; Li, X. Effects of Different Planting Patterns and Irrigation Quota on Cotton Growth ang Yield. J. Irrig. Drain. 2023, 42, 16–23. [Google Scholar] [CrossRef]
  23. Wang, L. Effects of Irrigation Quota on Machine Harvested Cotton RootShoot Growth and Yield under Different Planting Patterns in Southern Xinjiang. Ph.D. Thesis, Tarim University, Xinjiang, China, 2023. [Google Scholar] [CrossRef]
  24. Gao, F. Effects of Drip Spring Irrigation on Water-Heat-Salt Distribution and Cotton Growth in Mulched Cotton Fields in Southern Xinjiang. Master’s Thesis, Chinese Academy of Agricultural Sciences, Beijing, China, 2023. [Google Scholar] [CrossRef]
  25. LY/T 1251-1999; Analysis Methods of Water Soluble Salts of Forest Soil. Department of Soil and Plant Nutrition, Beijing Agricultural University: Beijing, China, 1999.
  26. Shams, M.S.; Aboushal, A.A.; Saffan, M.M.; El-Kammah, M.A.; Rateb, K.; El-Ramady, H.R. Validity of light transmittance to predict soil hydraulic conductivity in salt-affected soils. Egypt. J. Soil Sci. 2016, 56, 723–738. [Google Scholar]
  27. Liu, Q.; Pang, X.-Y.; Xiang, S.; Pan, K.-W. Restoration of degraded alpine and subalpine forest ecosystems in different stages of succession in southwestern China. Chin. J. Appl. Environ. Biol. 2021, 27, 513–518. [Google Scholar] [CrossRef]
  28. Saeed, Q.; Zhang, A.; Mustafa, A.; Sun, B.; Zhang, S.; Yang, X. Effect of long-term fertilization on greenhouse gas emissions and carbon footprints in northwest China: A field scale investigation using wheat-maize-fallow rotation cycles. J. Clean. Prod. 2022, 332, 130075. [Google Scholar] [CrossRef]
  29. Abubakar, S.A.; Hamani, A.K.M.; Chen, J.; Sun, W.; Wang, G.; Gao, Y.; Duan, A. Optimizing N-fertigation scheduling maintains yield and mitigates global warming potential of winter wheat field in North China Plain. J. Clean. Prod. 2022, 357, 131906. [Google Scholar] [CrossRef]
  30. Negis, H. Impacts of Maize and Sunflower Straw Implementations on Selected Physical and Mechanical Properties of Clay Soil. Commun. Soil Sci. Plant Anal. 2024, 55, 441–455. [Google Scholar] [CrossRef]
  31. Pallant, J. SPSS Survival Manual: A Step by Step Guide to Data Analysis Using IBM SPSS; Routledge: London, UK, 2020. [Google Scholar]
  32. Xiao, S.; Zhang, W.; Ye, Y.; Zhao, J.; Wang, K. Soil aggregate mediates the impacts of land uses on organic carbon, total nitrogen, and microbial activity in a Karst ecosystem. Sci. Rep. 2017, 7, 41402. [Google Scholar] [CrossRef]
  33. Ju, Z.; Du, Z.; Guo, K.; Liu, X. Irrigation with freezing saline water for 6years alters salt ion distribution within soil aggregates. J. Soils Sediments 2019, 19, 97–105. [Google Scholar] [CrossRef]
  34. Liu, X.; Yan, F.; Wu, L.; Zhang, F.; Yin, F.; Abdelghany, A.E.; Fan, J.; Xiao, C.; Li, J.; Li, Z. Leaching amount and timing modified the ionic composition of saline-alkaline soil and increased seed cotton yield under mulched drip irrigation. Field Crops Res. 2023, 299, 108988. [Google Scholar] [CrossRef]
  35. Shehzad, I.; Sarwar, G.; Manzoor, M.Z.; Zafar, A.; Muhammad, S.; Murtaza, G. Effect of saline water irrigation on chemical properties and fertility status of soil. Pak. J. Agric. Res. 2020, 33, 527–534. [Google Scholar] [CrossRef]
  36. Dastranj, M.; Sepaskhah, A.R. Effect of Irrigation Water Salinity and Deficit Irrigation on Soil Ions Variation and Uptake by Saffron (Crocus sativus L.) Under Two Planting Methods. J. Plant Growth Regul. 2022, 41, 282–299. [Google Scholar] [CrossRef]
  37. Huang, C.H.; Xue, X.; Wang, T.; De Mascellis, R.; Mele, G.; You, Q.G.; Peng, F.; Tedeschi, A. Effects of saline water irrigation on soil properties in northwest China. Environ. Earth Sci. 2011, 63, 701–708. [Google Scholar] [CrossRef]
  38. Li, J. Increasing crop productivity in an eco-friendly manner by improving sprinkler and micro-irrigation design and management: A review of 20 years’ research at the iwhr, China. Irrig. Drain. 2018, 67, 97–112. [Google Scholar] [CrossRef]
  39. Lu, X.; Hou, E.; Guo, J.; Gilliam, F.S.; Li, J.; Tang, S.; Kuang, Y. Nitrogen addition stimulates soil aggregation and enhances carbon storage in terrestrial ecosystems of China: A meta-analysis. Glob. Change Biol. 2021, 27, 2780–2792. [Google Scholar] [CrossRef]
  40. Dai, W.; Feng, G.; Huang, Y.; Adeli, A.; Jenkins, J.N. Influence of cover crops on soil aggregate stability, size distribution and related factors in a no-till field. Soil Tillage Res. 2024, 244, 106197. [Google Scholar] [CrossRef]
  41. Kantrikrom, R.; Anusontpornperm, S.; Thanachit, S.; Wiriyakitnateekul, W. Water stable aggregate distribution of lowland, humid, tropical, salt-affected soils. Agric. Nat. Resour. 2020, 54, 255–264. [Google Scholar] [CrossRef]
  42. Ding, W.-F.; Zhang, X.-C. An evaluation on using soil aggregate stability as the indicator of interrill erodibility. J. Mt. Sci. 2016, 13, 831–843. [Google Scholar] [CrossRef]
  43. Bi, Y.-P.; Zheng, C.-L.; Dang, H.-K.; Cao, C.-Y.; Li, K.-J.; Ma, J.-Y.; Wang, H.; Zhang, J.-P. Effects of saline-water furrow irrigation on the stability of soil water-stable aggregates in cotton field. Ying Yong Sheng Tai Xue Bao J. Appl. Ecol. 2022, 33, 1055–1062. [Google Scholar] [CrossRef]
  44. Li, S.; Wang, B.; Zhang, X.; Wang, H.; Yi, Y.; Huang, X.; Gao, X.; Zhu, P.; Han, W. Soil particle aggregation and aggregate stability associated with ion specificity and organic matter content. Geoderma 2023, 429, 116285. [Google Scholar] [CrossRef]
  45. Bray, N.; Thompson, G.L.; Fahey, T.; Kao-Kniffin, J.; Wickings, K. Soil macroinvertebrates alter the fate of root and rhizosphere carbon and nitrogen in a turfgrass lawn. Soil Biol. Biochem. 2020, 148, 107903. [Google Scholar] [CrossRef]
  46. Setia, R.; Rengasamy, P.; Marschner, P. Effect of exchangeable cation concentration on sorption and desorption of dissolved organic carbon in saline soils. Sci. Total Environ. 2013, 465, 226–232. [Google Scholar] [CrossRef] [PubMed]
  47. Paul, E.A. The nature and dynamics of soil organic matter: Plant inputs, microbial transformations, and organic matter stabilization. Soil Biol. Biochem. 2016, 98, 109–126. [Google Scholar] [CrossRef]
  48. Wei, K.; Zhang, J.; Wang, Q.; Guo, Y.; Mu, W. Irrigation with ionized brackish water affects cotton yield and water use efficiency. Ind. Crops Prod. 2022, 175, 114244. [Google Scholar] [CrossRef]
  49. Zhang, Y.; Miao, S.H.; Song, Y.; Wang, X.D.; Jin, F. Biochar Application Reduces Saline-Alkali Stress by Improving Soil Functions and Regulating the Diversity and Abundance of Soil Bacterial Community in Highly Saline-Alkali Paddy Field. Sustainability 2024, 16, 1001. [Google Scholar] [CrossRef]
  50. Liang, C.; Amelung, W.; Lehmann, J.; Kaestner, M. Quantitative assessment of microbial necromass contribution to soil organic matter. Glob. Change Biol. 2019, 25, 3578–3590. [Google Scholar] [CrossRef]
  51. Liu, C.; Shang, H.Z.; Han, L.H.; Sun, X.R. Effect of alkali residue and humic acid on aggregate structure of saline-alkali soil. Soil Sci. Soc. Am. J. 2024, 88, 291–303. [Google Scholar] [CrossRef]
Figure 1. Cotton field profile map.
Agronomy 14 02169 g001
Figure 2. Meteorological data maps.
Agronomy 14 02169 g002
Figure 3. Irrigation system.
Agronomy 14 02169 g003
Figure 4. Soil partial ion content and SAR under different brackish water irrigation conditions ((A): Soil Na+ contents; (B): Soil Ca2+ contents; (C): Soil Mg2+ contents; (D): Soil SAR). Different lowercase letters indicate significant differences among treatments at p < 0.05. T, S, and T × S denote irrigation water salinity, SAR, and their interaction, respectively. * denotes significant difference (p < 0.05); ** denotes highly significant difference (p < 0.01); ns denotes non-significant difference (p > 0.05).
Agronomy 14 02169 g004
Figure 5. Illustration of the interactive effects of irrigation water salinity and SAR on soil aggregates ((A): large aggregates (LAs); (B): small aggregates (SAs); (C): microaggregates (IAs); (D): water-stable aggregates). Different lowercase letters indicate significant differences among treatments at p < 0.05. T, S, and T × S denote irrigation water salinity, SAR, and their interaction, respectively. * denotes significant difference (p < 0.05); ** denotes highly significant difference (p < 0.01).
Agronomy 14 02169 g005
Figure 6. Soil organic matter (SOM) content under different brackish water irrigation conditions. Different lowercase letters indicate significant differences among treatments at p < 0.05. T, S, and T × S denote irrigation water salinity, SAR, and their interaction, respectively. * denotes significant difference (p < 0.05); ** denotes highly significant difference (p < 0.01).
Agronomy 14 02169 g006
Figure 7. Correlation of indicators under different brackish water irrigation mineralization conditions ((A): irrigation water salinity 3 g/L; (B): irrigation water salinity 5 g/L; (C): irrigation water salinity 7 g/L).
Agronomy 14 02169 g007
Table 1. Soil physical and chemical properties of experimental fields.
Soil Depth (cm)Na+
(g/kg)
Ca2+
(g/kg)
Mg2+
(g/kg)
SARDry Bulk Density (g/cm3)Field Capacity (cm3/cm−3)Organic Matter (g/kg)Soil Type
0–200.090.110.030.871.60.265.66Sandy loam
Table 2. Salinity, sodium adsorption ratio (SAR), and major ion content of irrigation water in each treatment.
Treatments SAR
(mmol/L)1/2
Salinity
(g/L)
Major Ion Content (mg/L)
Ca2+Mg2+Na+K+ClSO42−
CK8.741.44103.6042.07419.096.45648.1087.54
T3S1010.103.00356.6942.07759.086.451616.0287.54
T3S1515.103.00209.4042.07918.276.451604.1087.54
T3S2020.113.00121.7842.071013.006.451597.0187.54
T5S1010.115.00789.4242.071077.466.452864.9187.54
T5S1515.085.00536.0042.071350.006.452844.4787.54
T5S2020.115.00368.6942.071532.236.452830.8787.54
T7S1010.107.001269.4242.071344.746.454117.6387.54
T7S1515.147.00914.8742.071727.976.454088.9587.54
T7S2020.117.00671.2442.071991.326.454069.2487.54
Table 3. Fertilization schedule.
Irrigation and fertilizer rates6.156.226.297.67.137.207.278.38.108.178.24Sum
Days to sow435057647178859299106113120
Irrigation quota/mm37.536.4834.8938.4941.2243.9538.2742.4543.1437.3726.36420.12
N/kg·hm−220.713.820.734.527.627.620.713.813.813.80207.00
P2O5/kg·hm−20913.522.51813.599990112.50
K2O/kg·hm−204.89.69.69.6242419.214.44.80120.00
Table 4. The D, PAD, MWD, and GMD of soil water-stable aggregates in the 0~20 cm soil layer.
TreatmentsDPADMWDGMD
CK2.969 d0.882 c0.370 a0.287 a
T3S102.969 d0.881 c0.362 a0.285 a
T3S152.972 c0.884 bc0.343 b0.281 b
T3S202.976 b0.890 b0.329 d0.278 b
T5S102.972 c0.884 bc0.341 bc0.280 b
T5S152.975 b0.886 bc0.333 cd0.278 b
T5S202.981 a0.901 a0.304 f0.268 d
T7S102.977 b0.887 bc0.316 e0.272 c
T7S152.982 a0.891 b0.301 f0.267 de
T7S202.982 a0.903 a0.296 f0.265 e
T********
S********
T × S*nsns*
Note: D is the fractal dimension of the water-stable aggregates; PAD is the degree of disruption; MWD is the mean weight diameter; and GMD is the geometric mean diameter. Different lowercase letters indicate significant differences among treatments at p < 0.05. T, S, and T × S denote irrigation water salinity, SAR, and their interaction, respectively. * denotes significant difference (p < 0.05); ** denotes highly significant difference (p < 0.01); ns denotes non-significant difference (p > 0.05).
Disclaimer/Publisher’s Note: The statements, opinions and data contained in all publications are solely those of the individual author(s) and contributor(s) and not of MDPI and/or the editor(s). MDPI and/or the editor(s) disclaim responsibility for any injury to people or property resulting from any ideas, methods, instructions or products referred to in the content.

