Article

Unveiling Microbial Dynamics and Gene Expression in Legume–Buffel Grass Coculture Systems for Sustainable Agriculture

Institute for Future Farming Systems, Central Queensland University, Rockhampton 4701, Australia
*
Author to whom correspondence should be addressed.
Agronomy 2024, 14(9), 2172; https://doi.org/10.3390/agronomy14092172
Submission received: 28 August 2024 / Revised: 16 September 2024 / Accepted: 19 September 2024 / Published: 23 September 2024

Abstract

:
Legumes enhance pasture health and soil productivity by fixing atmospheric nitrogen and boosting soil microbiota. We investigated the effects of tropical pasture legumes, including butterfly pea (Clitoria ternatea), seca stylo (Stylosanthes scabra), desmanthus (Desmanthus virgatus), lablab (Lablab purpureus), and Wynn cassia (Chamaecrista rotundifolia), on the soil microbial community and buffel grass (Cenchrus ciliaris) gene expression. Additionally, we explored the impact of a phytogenic bioactive product (PHY) in the coculture system. A pot trial using soil enriched with cow paunch compost included four treatments: monoculture of buffel grass and five legume species with and without PHY supplementation and coculture of buffel grass with each legume species with and without PHY supplementation. Actinobacteriota and Firmicutes were the dominant bacterial phyla. Regardless of PHY application, the coculture of buffel grass with legumes positively influenced microbial composition and diversity. Transcriptomic analysis revealed significant gene expression changes in buffel grass shoots and roots, with each legume uniquely affecting nitrogen metabolism. Lablab and Wynn cassia exhibited similarities in modulating metabolic processes, butterfly pea contributed to mycotoxin detoxification, and desmanthus balanced cell death and growth. Seca stylo enhanced root cell growth and regeneration. These findings offer insights for optimizing legume–grass coculture systems, enhancing soil activity and promoting sustainable agriculture.

1. Introduction

Legumes, a group of plants belonging to the family Fabaceae, are well known for their agricultural value as they have nutritional significance for humans and livestock and provide benefits for other plants and soil in a coculture environment [1]. Coculture, as opposed to monoculture, is a term that refers to the cultivation of two or more plant species together [2]. It is widely used in agriculture to improve productivity. As a common practice, coculture of legumes and grass is a sustainable method of pasture management. The benefits of coculture involve soil microorganisms that form symbiotic relationships with legumes. These rhizobia microorganisms help legumes convert atmospheric nitrogen into a form that can be available to plants, which promotes nitrogen enrichment in the soil [3]. This relationship also improves soil organic matter, promoting soil biodiversity, which is beneficial for neighboring plants [4,5,6]. Coculturing legumes with other non-legumes has been shown to affect soil microbial communities and host gene expression significantly. Studies on soybean–wheat indicated that coculture increased the relative abundance of Firmicutes and Bacteroidetes and reduced Actinobacteria, Verrucomicrobia, and Chloroflexi compared to maize–wheat. Genes involved in the uptake of nitrogen and phosphorus were enriched [7]. Therefore, the coculture environment has become an advantageous ecosystem where the interaction among the legumes, rhizobia, and other plants contributes to soil productivity and pasture yield [8].
Buffel grass (Cenchrus ciliaris L. Poaceae) was introduced into Australia for grazing decades ago due to its robust adaptability to local climate and soil [9]. Previous studies have revealed that some legumes, such as Stylosanthes scabra Vogel Fabaceae and Clitoria ternatea L. Fabaceae, were frequently present in the pasture composition exposed to poor soil conditions on some Queensland farms [9]. It would be informative to understand how these legumes interact with soil microbes when they grow with grass. Here, we present three additional legumes, Desmanthus virgatus (L.) Wild. Fabaceae, Chamaecrista rotundifolia (Pers.) Greene, and Lablab purpureus (L.) Sweet. Fabaceae, which were introduced to Queensland decades ago and occur widely in improved pasture systems. In the natural environment, buffel grass often grows with multiple legume species, where the complexity of the pasture mixture precludes discovering the influence of individual species on it. In this study, buffel grass was cocultured with a single legume species or assessed as a monoculture. We also applied the Activo SOL, which is a phytogen-based liquid, to the soil of half the treatments before sowing to investigate interactions between legumes and grass in the presence and absence of the PHY, demonstrating a range of soil benefits as reported in a previous study [10].
Among all the legumes found on the pasture, Stylosanthes scabra Vogel Fabaceae, known as seca stylo, is the most widely spread species introduced from South America [11]. Seca stylo is a vital drought-tolerant forage legume suitable for seasonally dry environments. It is adapted to perform on low-quality soil with little rainfall [12]. This species possesses a shrubby and upright structure and an extensive tap root system, enabling it to withstand drought and generate a considerable amount of high-quality forage in severe environments. It grows in tropical and subtropical regions with variable soil fertility and acidity [13]. Farmers use seca stylo as an alternative forage source for ruminants [11] in tropical and subtropical climatic conditions where the pasture biomass is prone to drought damage.
Butterfly pea (Clitoria ternatea L. Fabaceae) is a perennial, summer-growing legume that grows on clay soils. Butterfly pea has been commercially sown in Central Queensland for over six years. It can regenerate degraded grass pasture [14]. Butterfly pea has a significantly shorter time to the first grazing opportunity as it rapidly produces biomass compared to other pasture legumes. Research efforts have focused on tropical legumes for use on clay soils, and butterfly pea is now known to be well adapted to lower rainfall (700 to 800 mm mean annual rainfall) areas in Central and Southern Queensland [15,16].
Desmanthus (Desmanthus virgatus (L.) Wild. Fabaceae), a highly persistent legume originally from America, was introduced to Queensland 40 years ago [17]. Its strong drought tolerance makes it well-established in subtropical and tropical regions. Desmanthus also performs well under heavy grazing. So far, a few studies have evaluated the animal response to the inclusion of desmanthus in the diet or pasture. Gardiner and Parker (2012) found that steers grazing on pasture comprising a mix of buffel grass (Cenchrus ciliaris L. Poaceae) and desmanthus during the dry season in Central Queensland gained an extra 40 kg of weight in 90 days compared to those fed on the monoculture of buffel grass [18]. Another study conducted in Central Queensland [19] also revealed that cattle grazing on pastures containing buffel grass and desmanthus could consistently obtain an additional 40 kg per head over several seasons.
Chamaecrista rotundifolia (Pers.) Greene, also known as Wynn cassia, is a short-lived perennial or self-generating annual legume. Its native habitat is widely distributed in South America and was introduced in Australia 25 years ago as a pasture legume. It grows in dry soils, areas of low rainfall, and in low fertility [20]. It can also reduce erosion and runoff over time. These factors make it a potential asset to farmers in the subtropics and elsewhere, where soil quality is an obstacle to farming. This nitrogen-fixing legume also serves as a source of feed for livestock and acts as a green fertilizer, raising soil quality and nutrient content, which has the potential to improve pasture yields [21]. Excellent protein quality and digestibility have been recorded under grazing conditions. Using Wynn cassia in a mixed pasture resulted in an increase in live weight gains in beef cattle of 40% compared to a non-mixed pasture.
Lablab purpureus (L.) Sweet. Fabaceae, also named lablab, is a fast-growing tropical legume. It is a high-yielding legume with high-quality forage, which can be sown with summer grasses to provide a mixed-pasture system for livestock [22]. It is drought tolerant once established, making it suitable for dry areas with low rainfall.
Our previous research demonstrated that a commercial phytogenic product (PHY), comprising citric acid, carvacrol, and cinnamaldehyde, has the potential to restore soil microbiome by selectively inhibiting microbes associated with poor soil health and simultaneously promoting the proliferation of beneficial rhizobia, thereby enhancing plant growth [10,23]. Building on these insights, in this study, we designed a controlled pot trial to examine systematically the general effects of coculture of each legume and buffel grass on the soil microbial community and grass gene expression from the perspective of microbiota and transcriptomics. Additionally, we combined the influence of the PHY with the coculture system, aiming to see its role in augmenting soil microbial diversity.

2. Materials and Methods

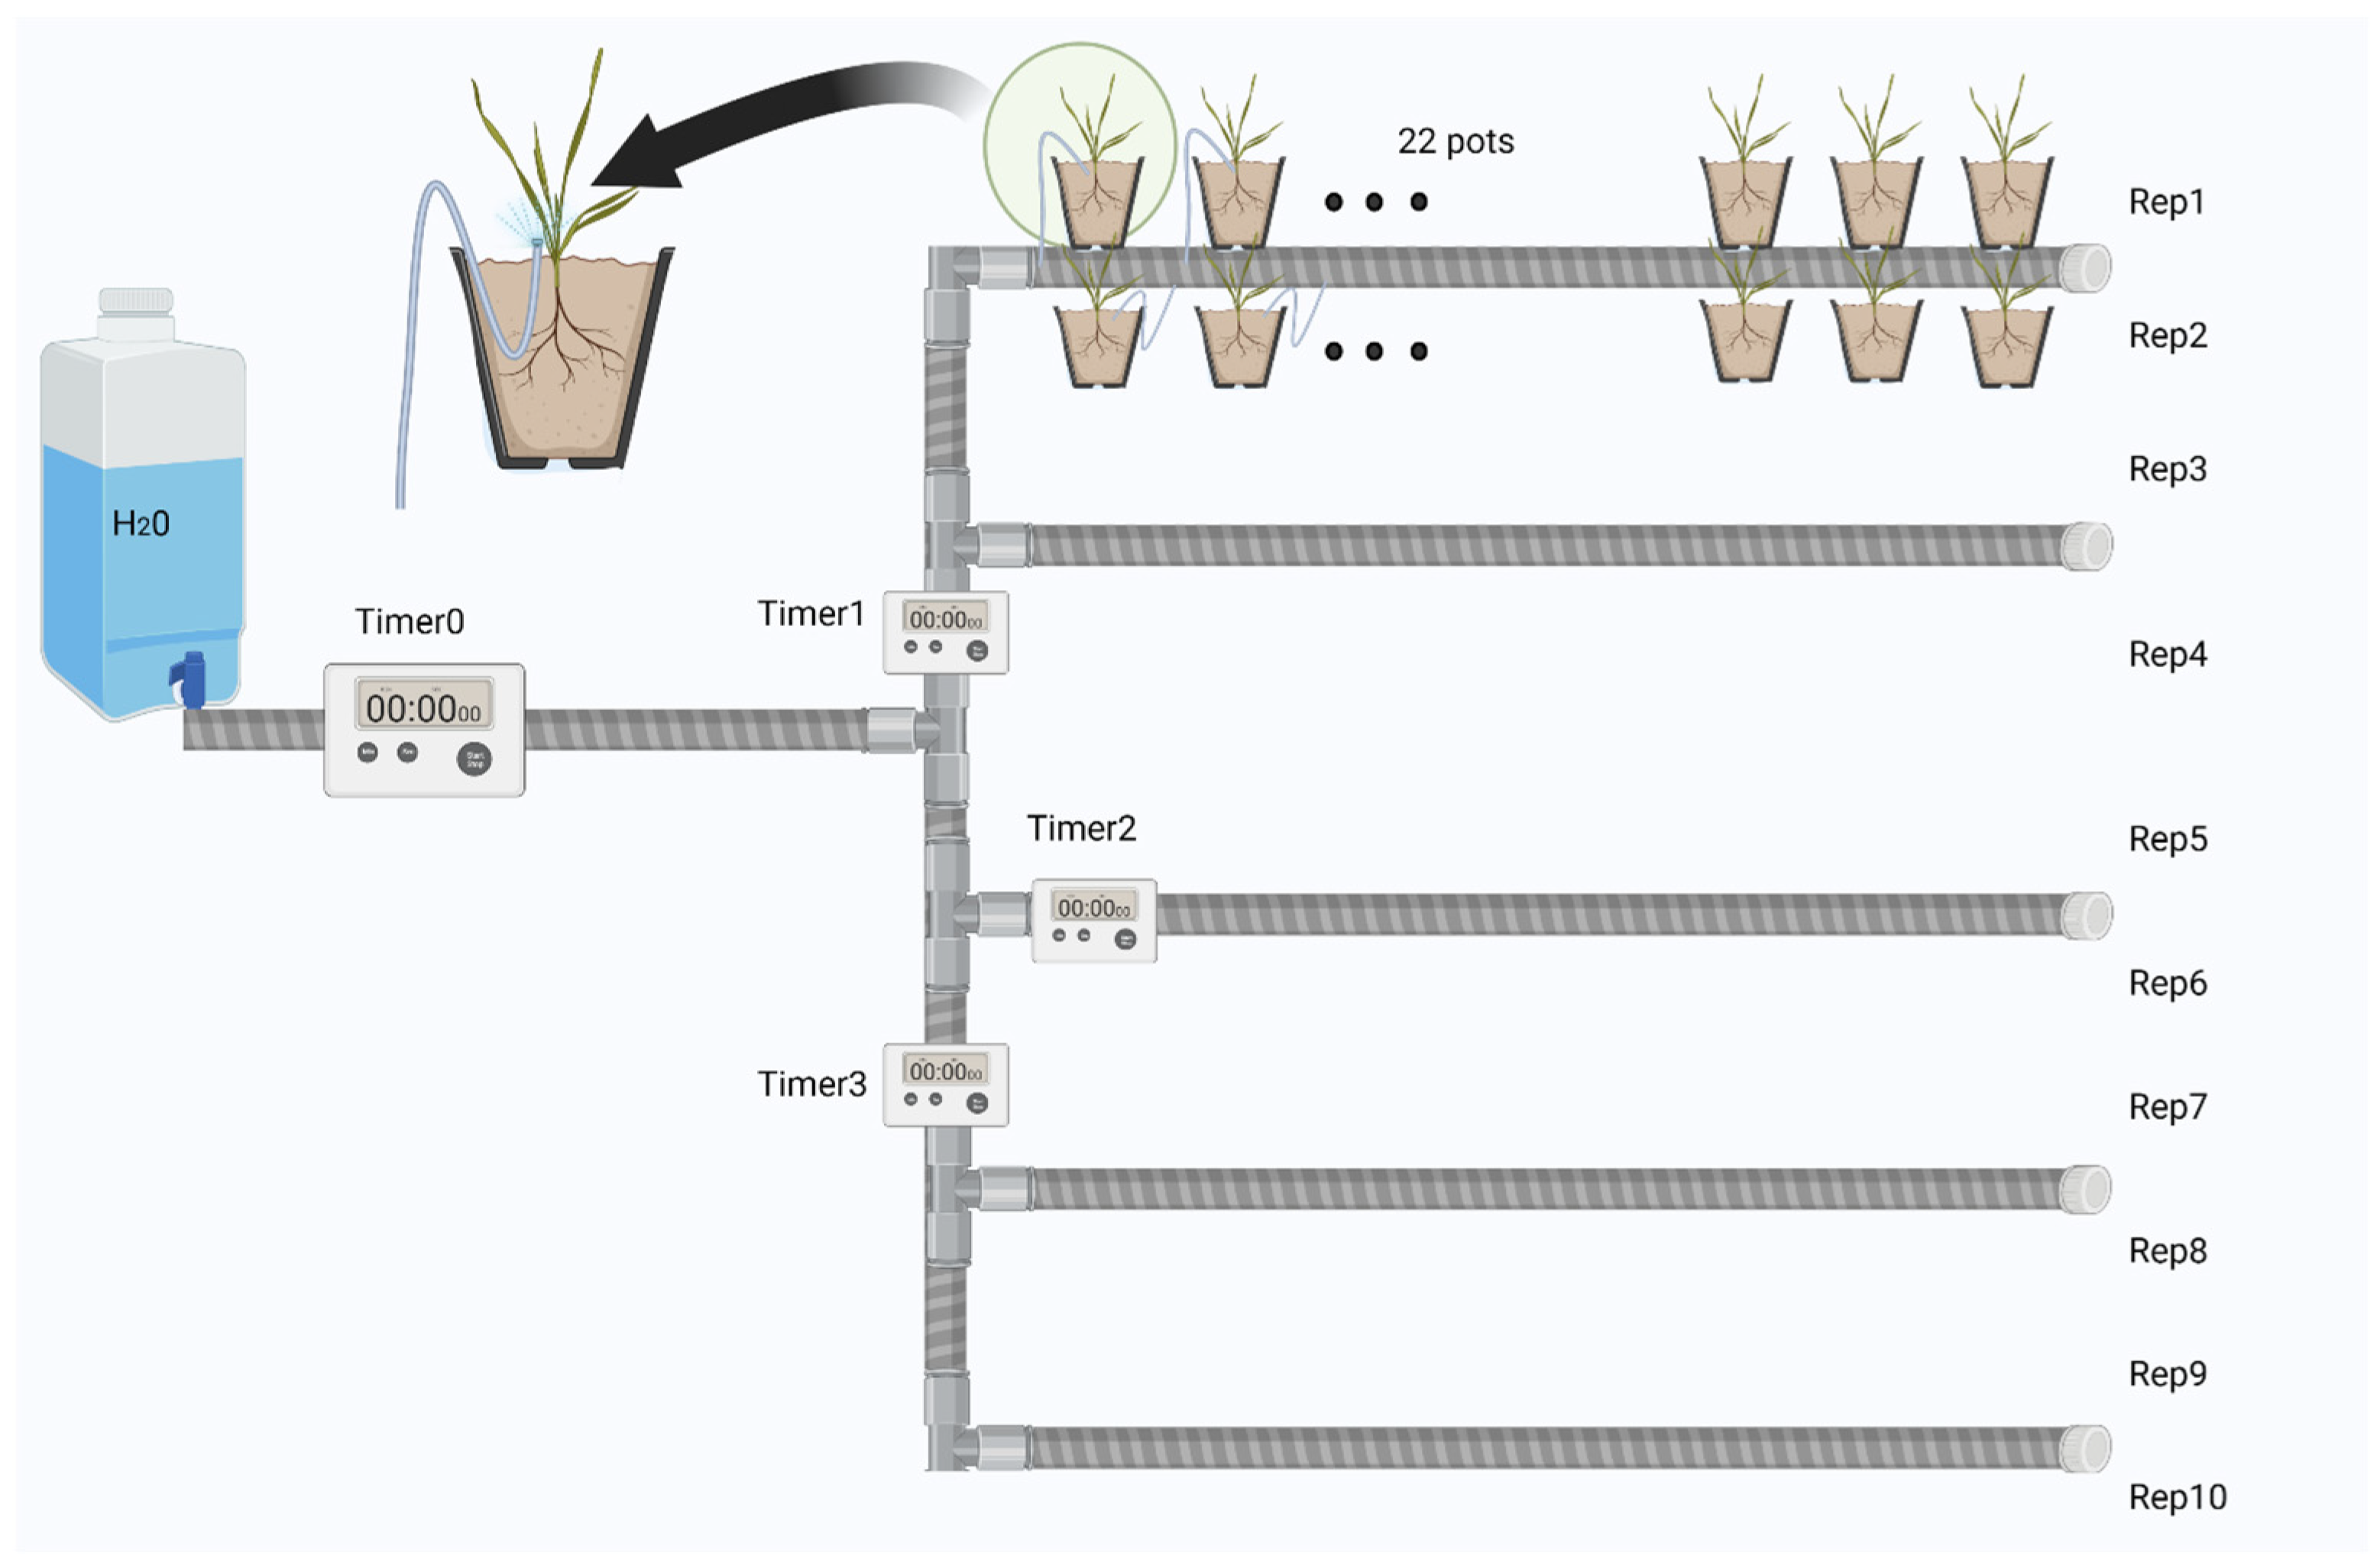
2.1. Experiment Set-Up

This study was performed in spring in the central Queensland area. It comprised four treatments with twenty-two treatment groups as follows:
(1)
Buffel grass (G) and five legumes, including butterfly pea (B), desmanthus (D), lablab (L), Wynn cassia (W), and seca stylo (S) grown without PHY.
(2)
Buffel grass and each legume grown in soil treated with PHY (GP, BP, DP, LP, SP, WP).
(3)
Buffel grass and each legume grown together (coculture) without PHY (GB, GD, GL, GS, GW).
(4)
Coculture of buffel grass and each legume with application of PHY (GBP, GDP, GLP, GSP, GWP). Each treatment had ten replicates, resulting in 220 pots planted in the trial. This design allows for the independent isolation and analysis of both the effects of PHY and coculture, each with its own control group.
Legume and buffel grass seeds were procured and stored at room temperature (24 °C). Prior to sowing, the germination rate was determined through literature research, supplier information, and germination experiments in the presence and absence of PHY. These data guided seed quantity calculation for each pot (30 cm in diameter), with a slight surplus to account for error. Excess germinated seedlings, if any, were carefully removed, ensuring two plants per pot in monoculture species (either buffel grass or legumes), and two of each buffel grass and legume seedlings remained in the coculture pots.
Soil enriched with cow paunch compost with a comparable nutritional profile to local farm soil (ammonium nitrogen 11 mg/kg, nitrate nitrogen 154 mg/kg, phosphorus 59 mg/kg, potassium 78 mg/kg, sulfur 41.7 mg/kg, organic carbon 0.69%) was locally sourced. The soil was then sieved and mixed for consistency.
Fifty milliliters of PHY, Activo SOL® Liquid (EW Nutrition GmbH, Visbek, Germany), was diluted in 450 mL water to obtain 500 mL of solution. Half of the prepared soil was mixed with PHY (500 mL/pot) before filling the pots, and the other half was mixed with 500 mL of water before filling the pots. All the pots were well-watered under a pre-organized irrigation system (Figure 1), receiving an equal volume of water. Nutrient supplementation started in the second month, with the plants growing (Table S1) at a rate of once every two weeks.

2.2. Data Collection and Sampling Procedure

The emergence of plants in each pot was noted, and any extra seedlings were carefully removed. Thirteen weeks after sowing, both soil and plant samples were collected. Soil samples for microbial analysis were stored at −80 °C. For transcriptomic analysis, buffel grass shoot and root samples were snap-frozen in liquid N2 and then stored at −80 °C.

2.3. 16S rRNA Gene Library Preparation and Sequencing

The DNA of soil microorganisms was obtained utilizing the DNeasy PowerSoil Pro Kit (Qiagen, Hilden, Germany). The quality of the obtained DNA was evaluated using the NanoDropTMOneC spectrophotometer (Thermo Fisher, Waltham, MA, USA). For the construction of the 16S rRNA gene library, the V3-V4 hypervariable region of the 16S rRNA gene was selectively amplified using a dual index primer pair consisting of the forward primer Pro341F (50-CCTACGGGNBGCASCAG-30) and the reverse primer Pro805R (5′-GACTACNVGGGTATCTAATCC-3′), with an Illumina linker sequence, index, and heterogeneity spacer. Visualization of the PCR product was performed through agarose gel electrophoresis. The 16S amplicon library was then pooled and cleaned using the AMPure XP PCR purification kit (Beckman Coulter, Sydney, NSW, Australia). The library was sequenced as 2 × 250 bp paired-end reads using the Illumina MiSeq system with Illumina-recommended kits and protocols.

2.4. RNA Extraction and Sequencing Procedure

Fifty milligrams of six buffel grass shoot and root samples from control (G), and each legume–grass coculture treatment (GB, GD, GL, GW, GS) was used to extract RNA using HiPure Plant RNA Mini Kit (Magen, in Guangzhou, China). Assessment of RNA quality was evaluated using the NanoDropTMOneC spectrophotometer (Thermo Fisher, Waltham, MA, USA) and the 2100 Bioanalyzer (Agilent, Santa Clara, CA, USA). The non-strand-specific sequencing library was prepared with poly A enrichment and sequenced with a 2 × 150 bp paired-end (PE) configuration using the Illumina Novaseq 6000 platform (Illumina, San Diego, CA, USA). For data transparency, all sequence data are available on the NCBI Sequenced Read Archive (SRA) database with the accession number PRJNA1090219.

2.5. Data Analysis and Statistics

For the soil microbial analysis, the relative abundance that illustrates the soil microbial structure was generated using QIIME2 [24] with Dada2 [25] as a filtering and denoising plugin and the Microeco R package [26] and further analyzed using Primer-e v7.0.23 [27]. The alpha diversity indicators were initially calculated using the Microeco R package and then plotted using GraphPad Prizm 10.2.0 [28]. The Pairwise comparison of diversity was performed via a non-parametric Kruskal–Wallis test. Ecological data interactions with the microbial community were explored using Primer-e v7.0.23. A square root transformed (SQRT) relative abundance matrix was generated, and sample-to-sample distances were calculated using Bray–Curtis similarity. Pairwise PERMANOVA test, based on Bray–Curtis similarity, was then performed at the phylum level to compare sample differences among groups. The group differences were plotted using distance-based redundancy analysis (dbRDA), with vectors representing the correlation between selected microbiota and the ordination axes. The linear discriminant analysis effect size (LEfSe) [29] analysis was employed to detect taxa characterizing the treatment groups.
RNA-seq data analysis was completed using CLC Genomics Workbench 23.0.4 [30]. The annotated Oryza sativa genome was downloaded from public repositories in Workbench and served as a reference genome for the subsequent analysis. The target reads were mapped against all the transcripts and the entire genome. From this mapping, the expectation-maximization (EM) algorithm was used to estimate transcript abundance, and gene expression values were derived as the sum of transcript counts for each gene. Transcripts per million (TPM) normalization method was applied to the total counts. The differential expression analysis was performed using the gene-level expression data generated from the RNA-seq workflow. The heatmap with metadata shows the top 1000 differential expressed (DE) genes passing the threshold of p-value (p < 0.01), and an absolute fold change of 2. A PCA plot was generated to visualize the distribution of samples based on their gene expression profile.
The functional implications of differentially expressed (DE) genes were analyzed using the Protein ANalysis THrough Evolutionary Relationships (PANTHER) classification system [31] with Oryza sativa as a reference organism. The upregulated and downregulated genes have functional differences in terms of biological processes, molecular function, and cellular components.

3. Results

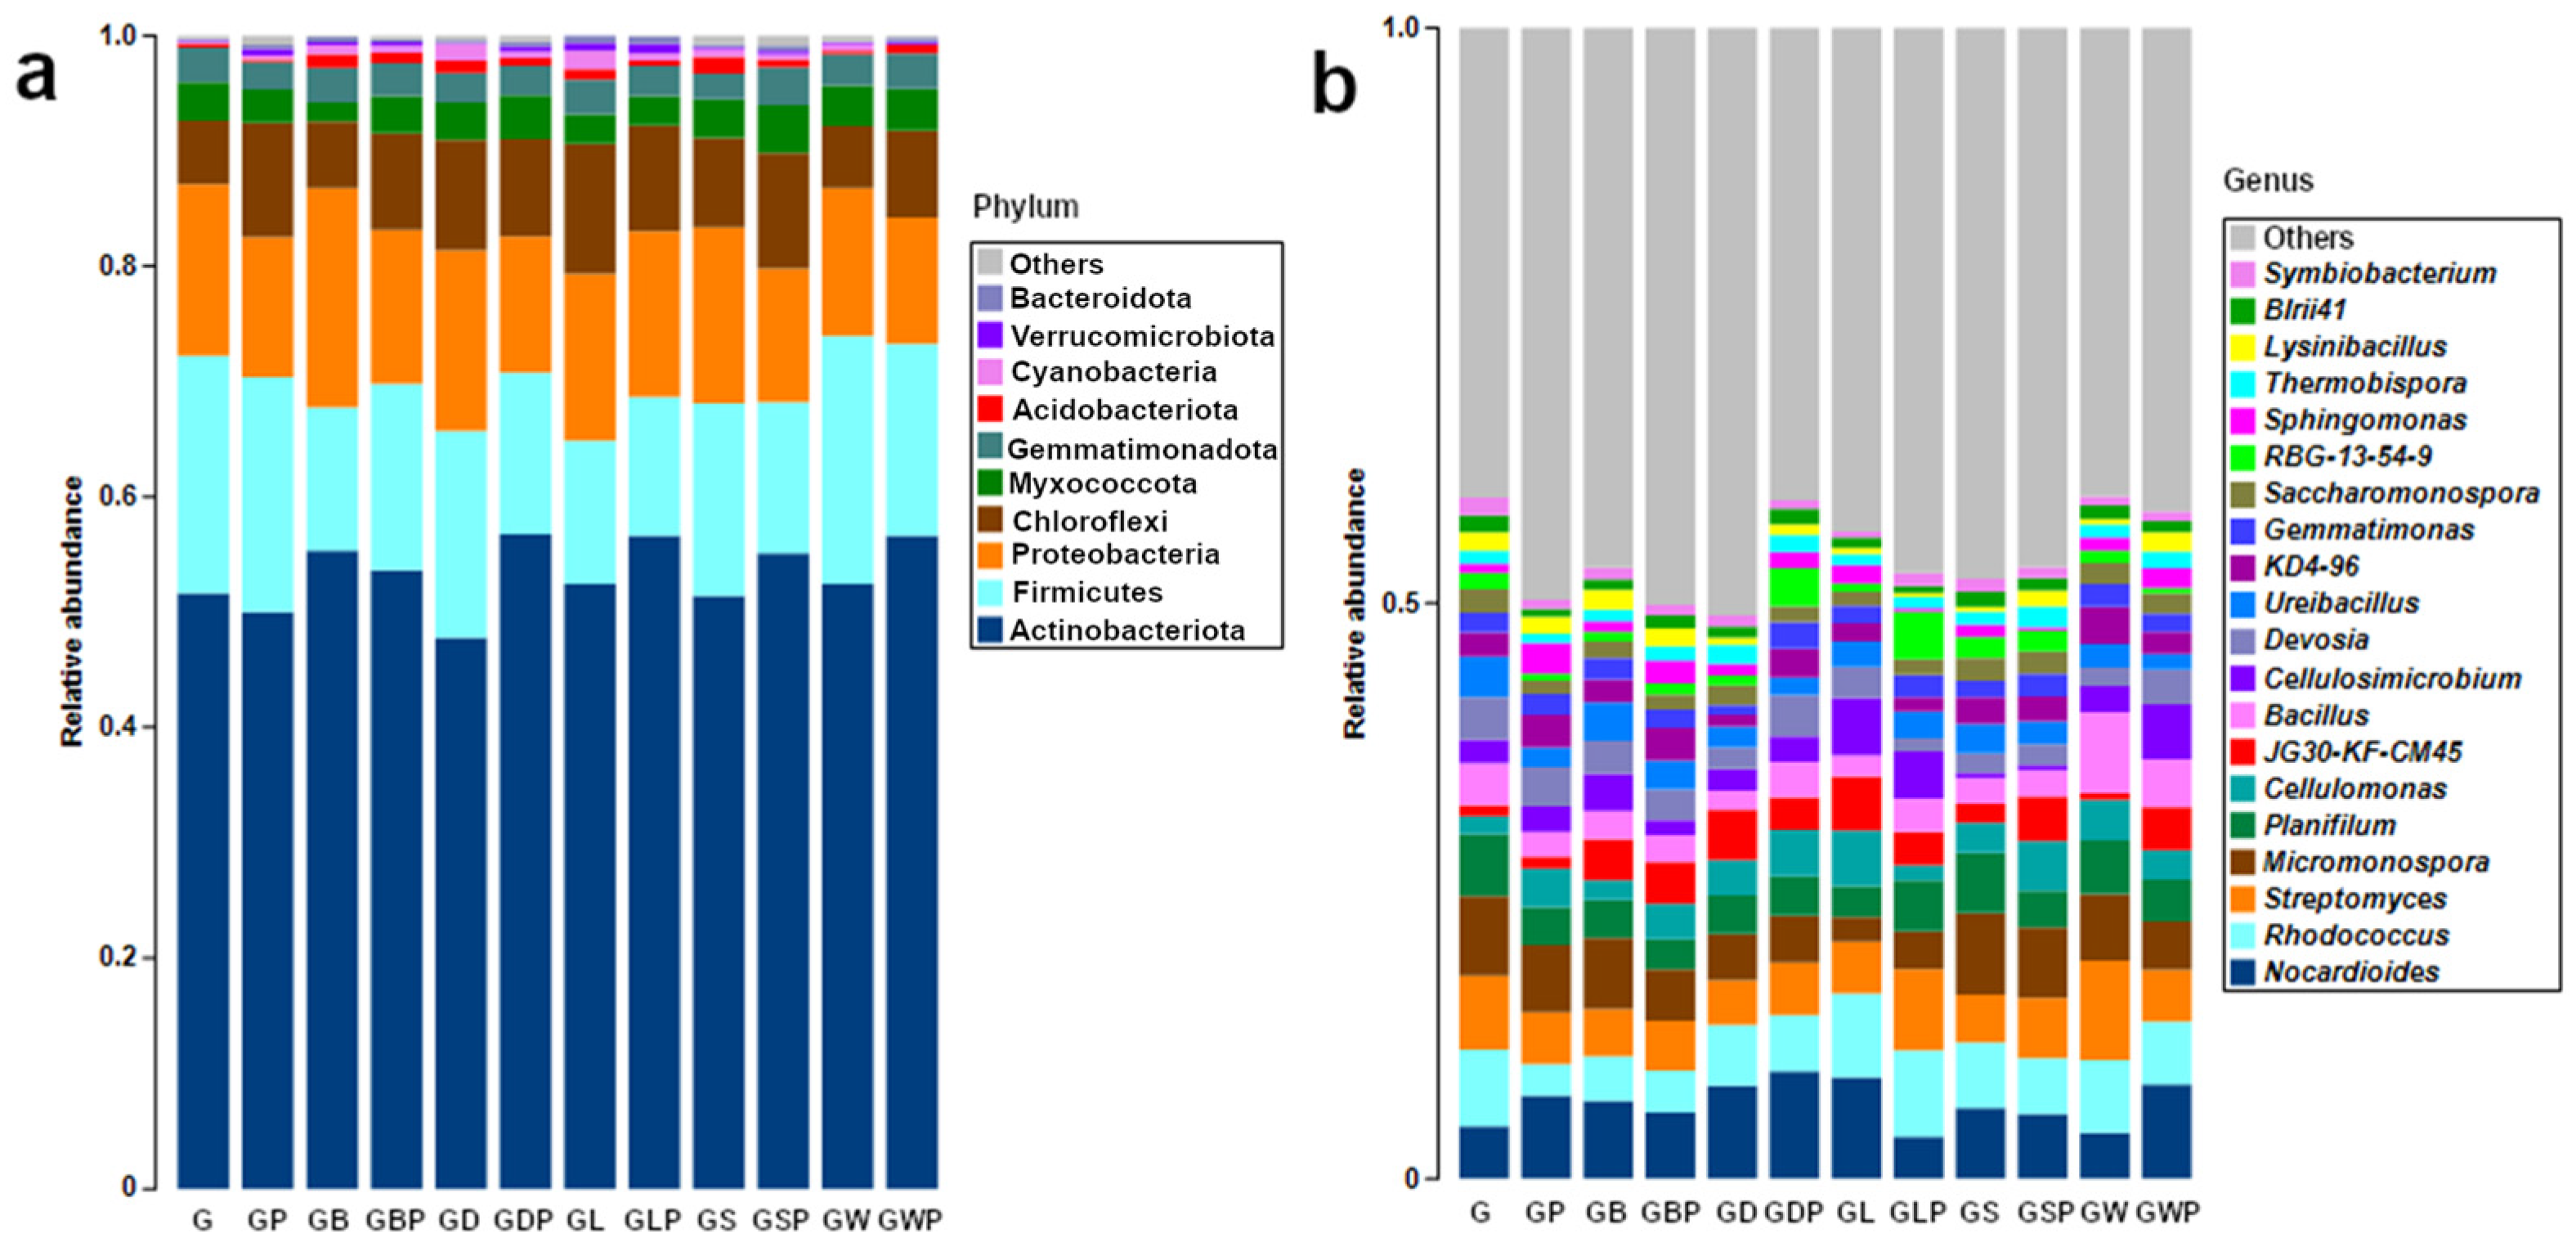
3.1. Overview of Microbial Structure

The top 10 bacterial phyla in the soil microbiota were Actinobacteriota, Firmicutes, Proteobacteria, Chloroflexi, Myxococcota, Gemmatimonadota, Acidobacteriota, Cyanobacteria, Verrucomicrobiota, and Bacteroidota (Figure 2a and Figure S1). Nocardioides, Rhodococcus, Streptomyces, Micromonospora, Planifilum, Cellulomonas, JG30-KF-CM45, Bacillus, Cellulosimicrobium, Devosia, Ureibacillus, KD4-96, Gemmatimonas, Saccharomonospora, RBG-13-54-9, Sphingomonas, Thermobispora, Lysinibacillus, Blrii41, and Symbiobacterium were the top 20 most abundant genera (Figure 2b and Figure S2).
More than 90% of the microbiota in each group belonged to the five most abundant phyla. Actinobacteriota (Figure S3b,c), Firmicutes, and Proteobacteria were represented in similar proportions in all treatments (Figure S3b,c). The GL had the highest proportion of Chloroflexi followed by the GP and GSP, while the GB had the lowest representation of Myxococcota.
The relative abundance of microbial phyla suggests that the soil microbiome had a relatively similar microbiota profile across the different treatments of buffel grass with or without legumes and PHY. The most abundant phyla, Actinobacteriota and Firmicutes, maintained a strong presence in all treatment groups, indicating their dominance in the soil ecosystem under these experimental conditions. The composition of the soil microbial community at the genus level is presented in Figure 2b and Figure S2. Nocardioides Prauser Nocardioidaceae was the most represented genus in most treatments except G, GLP, and GW, where it was less abundant than Rhodococcus Mycobacteriaceae. Notably, the 20 most abundant genera accounted for 50% of relative abundance in all treatments, indicating the diversity of soil microbial community at the genus level.

3.2. Taxa Responding to Treatment

Although there were significant overlaps in both phylum- and genus-level microbiota structure between different treatments, the linear discriminant analysis (LDA) effect size (LEfSe) biomarker discovery tool revealed that some of the phyla and genera were differentially abundant and are indicators of the differences in microbiota between the various soil samples under different treatments. At the phylum level, Firmicutes was the defining phyla for the GW, and Chloroflexi was the most enriched in GL. Acidobacteriota and Desulfobacterota were identified as indicators in GS, while the GSP and GP were defined by RCP2-54 and Patescibacteria, respectively (Figure 3a).
Soil samples displayed some differentially abundant genera under various treatments (Figure 3b). Ramlibacter Burkholderiaceae and Polyangium Polyangiaceae were the characteristics of the control (G), while Hamadaea Micromonosporaceae and Saccharimonadales TM7 characterized GP. Both Streptococcus Streptococcaceae and Methylobacterium Beijerinckiaceae were the defining genera for GD, while only Georgenia Actinomycetaceae was the GDP indicator. GB had the most significant genus-level biomarkers, including Sphingomonas Sphingomonadaceae, Terrabacter Dermatophilaceae, and Bradyrhizobium Xanthobacteraceae, but no genera corresponding to GBP were identified. GS had one characterizing genus, RBG-13-54-9, while two genera were identified as characterizing taxa in GSP, Sporocytophaga Cytophagaceae, and Sorangium Polyangiaceae. Both Nocardioides Nocardioidaceae and Akkermansia Akkermansiaceae were enriched in GL, but only JG30-KF-CM45 was associated with GLP. Rhodococcus Mycobacteriaceae and Lactobacillus Lactobacillaceae were associated with GW, and Cellulosimicrobium was associated with GWP.

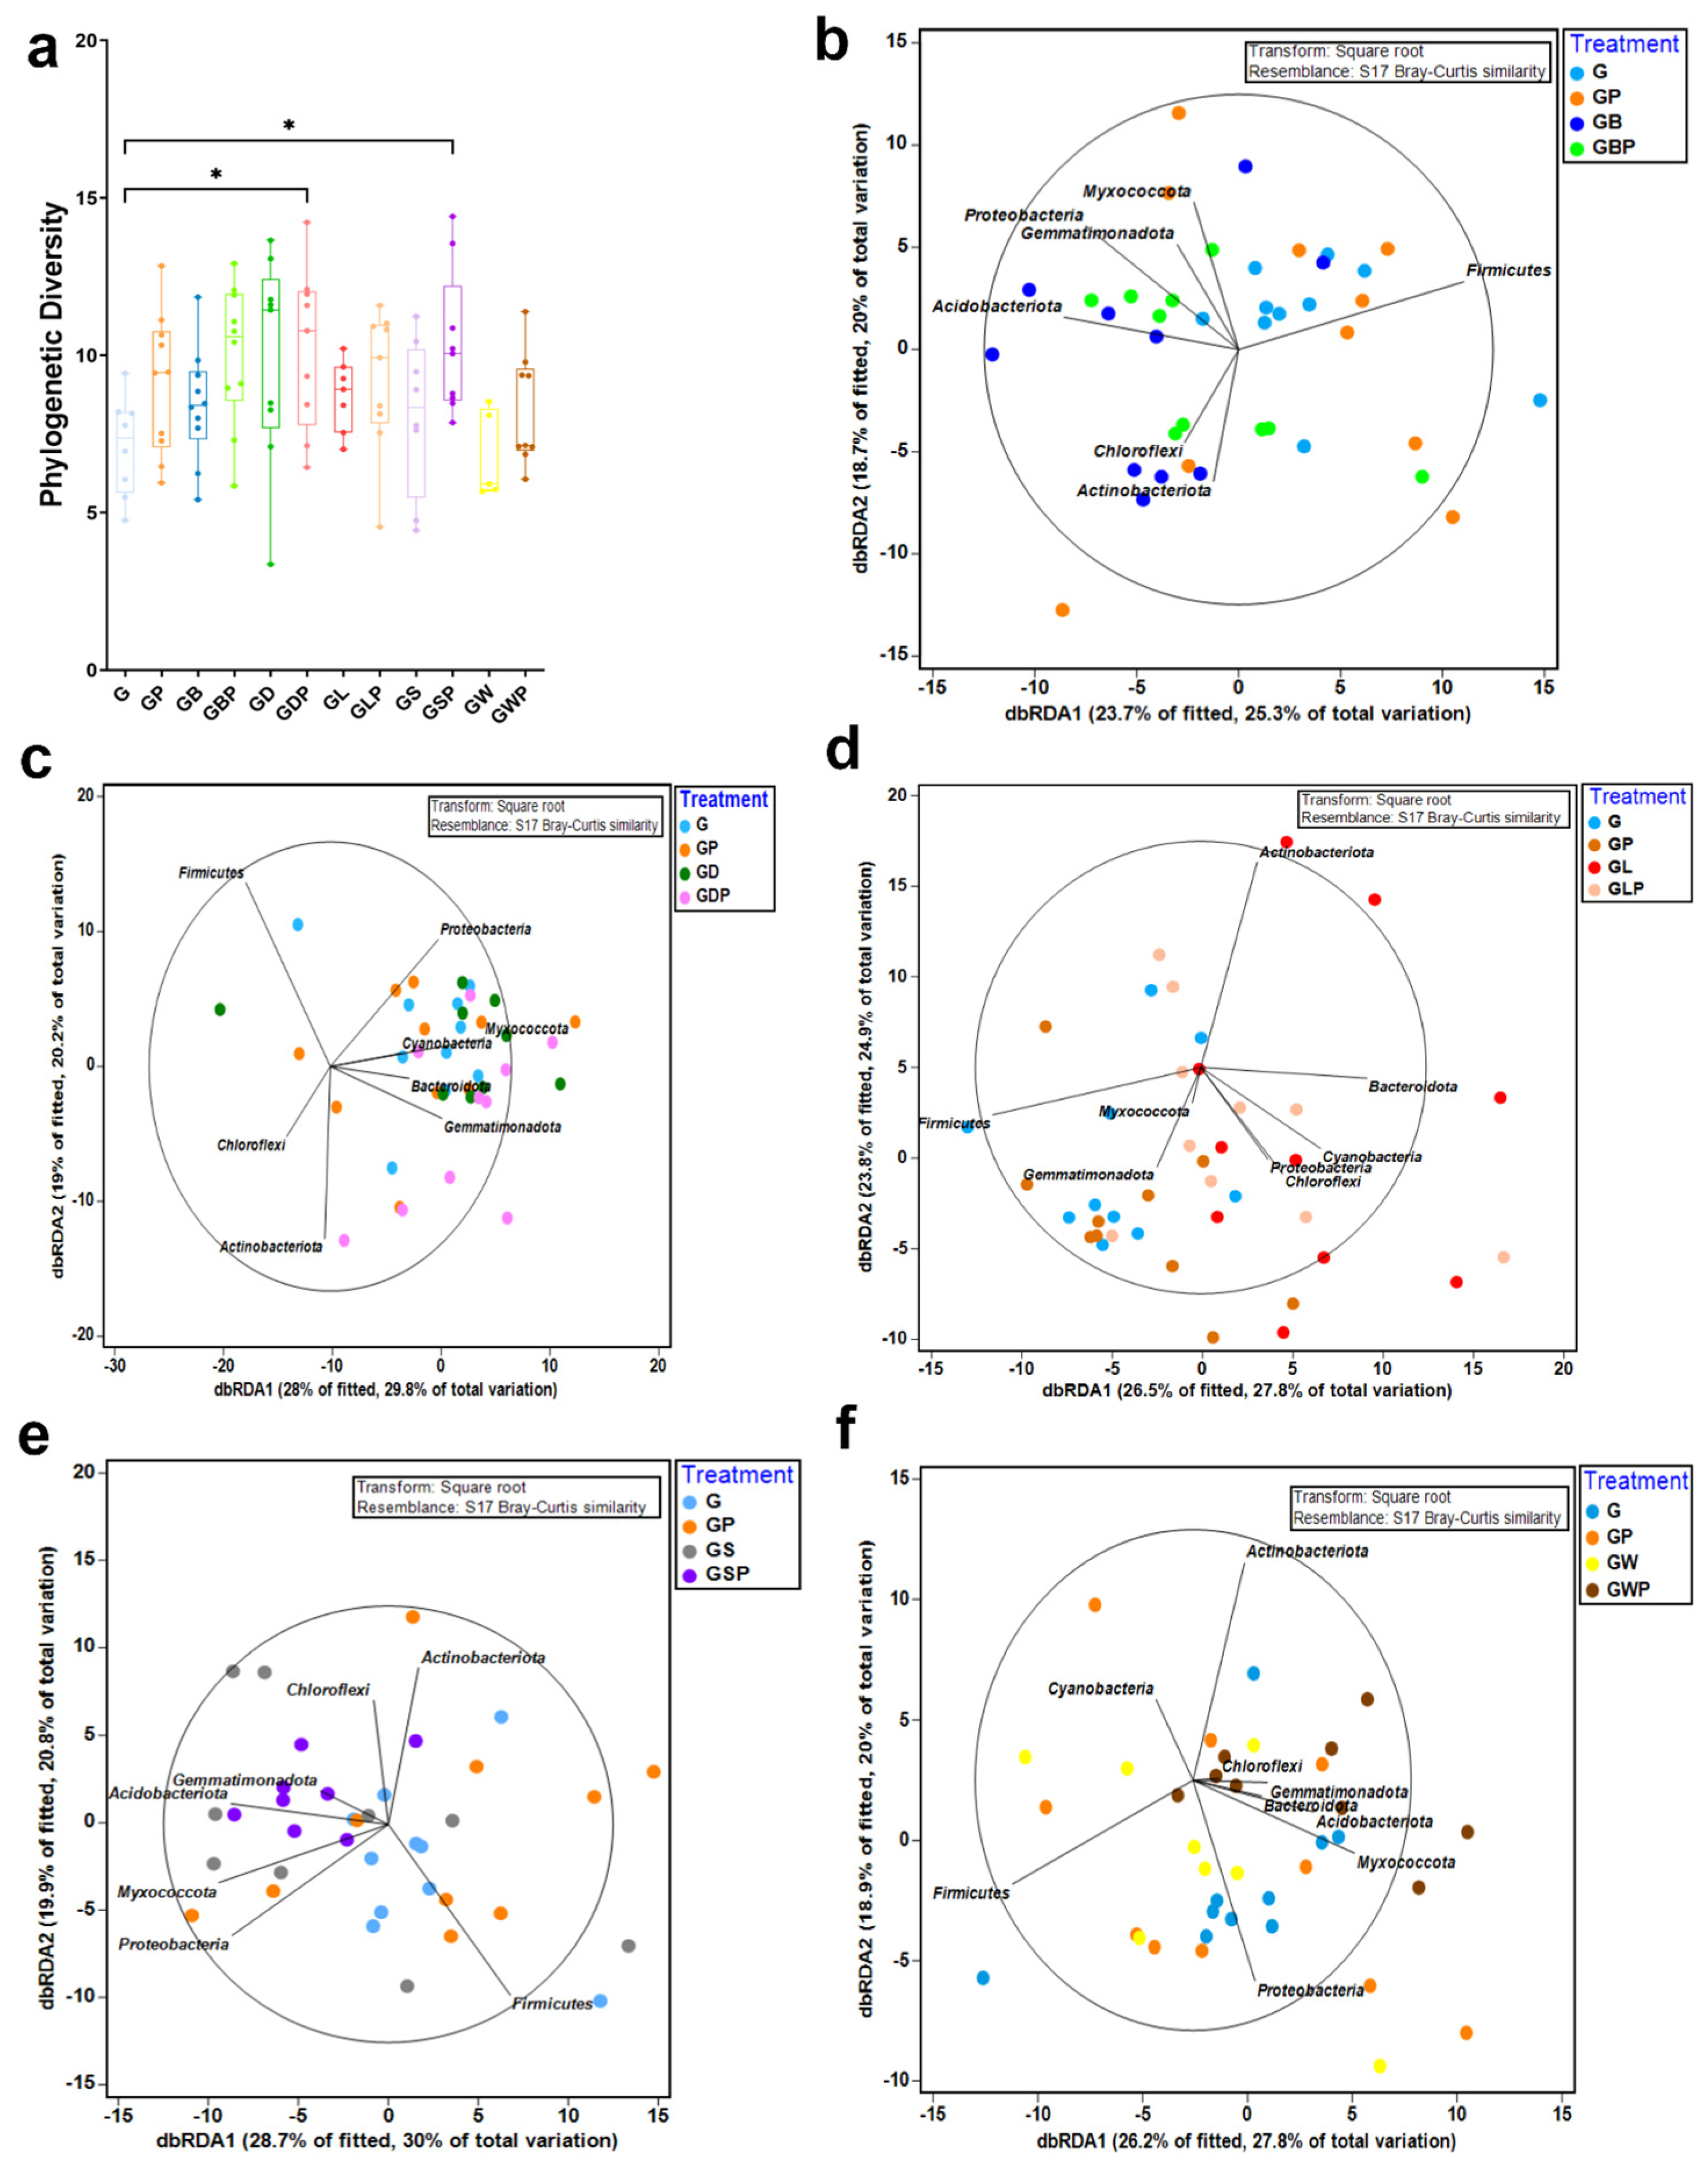
3.3. Spatial Differences in Microbial Diversity

We used phylogenetic diversity to investigate microbial variety within and between groups [32] (Figure 4a). Phylogenetic diversity shows that each coculture treatment with or without PHY, except for Wynn cassia (GW, GWP), resulted in an increase in microbial diversity compared to the control (G). The coculture of desmanthus with buffel grass with PHY supplementation to the soil (GDP) had higher microbiota diversity (p = 0.0453) compared to the control group. Remarkably, increased microbial diversity was also observed in seca stylo coculture treatment with PHY (GSP) (p = 0.0380). Other coculture treatments, with or without PHY, also promoted soil microbial diversity compared to G, including butterfly pea (GB, GBP) and lablab (GL, GLP). Additionally, the grass grown in PHY-treated soil (GP) also had increased diversity compared to the control. However, all those alterations were not statistically significant. In contrast, Wynn cassia coculture treatment, whether supplemented with PHY or not, reduced the diversity of soil microbiota.
The principal coordinate analysis (PCoA) based on weighted UniFrac distance depicts differences in the within-group sample-to-sample distance in all treatments (Figure S4), showing considerable overlap among treatments and indicating that while there are some differences in microbiota composition, the overall structure of the communities is relatively similar among treatments.
Based on the relative abundance at the phylum level, we compared microbial diversity between each legume with or without PHY and buffel grass using the Bray–Curtis similarity matrix. The distance-based redundancy analysis (dbRDA) plots show the visual representation of differences across the RDA coordinates that contribute most to the observed differences. Vectors overlaying the dbRDA plots point towards phyla that significantly contribute to the differences between groups. The lengths of the lines indicate the strength of the effect of vectors on the RDA coordinates. It is observed that butterfly pea coculture treatment (GB) (Figure 4b), lablab coculture treatment (GL) (Figure 4d), seca stylo coculture treatment with PHY (GSP) (Figure 4e), and Wynn cassia coculture treatment with PHY (GWP) (Figure 4f) had clustered away from the control (G), implying that these treatments had effects on the group microbial diversity.
Statistically, the pairwise PERMANOVA test at the phylum level confirmed the differences observed above (Table 1). Legumes and PHY had individual and combined effects on the soil microbial diversity. Each legume had distinct effects, which were likely influenced by the presence of PHY. Table 1 gives the individual and combined effects of each legume and PHY on microbial diversity in the coculture system.
The coculture of butterfly pea with grass (GB) significantly increased microbial diversity (p = 0.01), while the addition of PHY (GBP) decreased the diversity (p = 0.054). PHY had a significant effect on the butterfly pea coculture system (GB vs. GBP, p = 0.031), and the microbial community in the two individual factor groups responded differently (GB vs. GP, p = 0.002).
Desmanthus and grass coculture (GD) did not produce a significant change compared to the control (G), but the supplementation of PHY on coculture (GDP) had a significant impact on soil microbiota (G vs. GDP, p = 0.017). Lablab and buffel coculture (GL) or lablab with PHY (GLP) introduced significant differences in microbial diversity compared to the control (G vs. GL (p = 0.003) and G vs. GLP (p = 0.007), respectively). Soil microbiota exhibited distinct responses to the presence of lablab (GL) and PHY (GP) (GL vs. GP, p = 0.006), and the addition of PHY into the coculture system (GLP) still showed a significant change of diversity compared to PHY supplement (GP) (GP vs. GLP, p = 0.029). Similarly to desmanthus, seca stylo did not produce a significant change of microbial diversity (GS) compared to the control but combined with PHY (GSP) to substantially alter the diversity (G vs. GSP, p = 0.001). This trend was maintained even compared to PHY treatment (GP) (GP vs. GSP, p = 0.036). Wynn cassia also showed a significant change in microbiota with the help of PHY (GWP) (G vs. GWP, p = 0.034) compared to the control. Moreover, the presence of two factors (GWP) was more significant than that of either of them alone (GW, GP) (GW vs. GWP (p = 0.036) and GP vs. GWP (p = 0.006), respectively).
Some legumes in coculture treatment had a distinct impact on microbial diversity compared to others (Table S2). The pairwise PERMANOVA test shows that the soil microbial community showed significantly different responses to the butterfly pea (GB) and desmanthus coculture system (GD) (GB vs. GD, p = 0.02), suggesting these two legumes played a distinct role in soil microbiota. In addition, butterfly pea treatment (GB) also played a different role compared to Wynn cassia treatment (GW), exhibiting a significant difference (GB vs. GW, p = 0.005). Wynn cassia coculture treatment (GW) and lablab coculture treatment (GL) also had distinct effects on soil microbiota (GL vs. GW, p = 0.007).
The addition of PHY to seca stylo treatment (GSP) made it significantly different from butterfly pea treatment (GB) (GB vs. GSP, p = 0.002), although seca stylo-grass coculture (GS) did not produce a significant impact compared to butterfly pea treatment (GB vs. GS, p = 0.114, Table S2). In addition, PHY also kept the trend of significant difference in the Wynn cassia coculture group (GWP vs. GB, p = 0.004). The application of PHY also made lablab treatment (GLP) produce a significant difference from desmanthus treatment (GD) (GD vs. GLP, p = 0.031), while microbiota did not respond differently to the presence of lablab coculture (GL) and desmanthus coculture treatment (GD) (GD vs. GL, p = 0.256, Table S2). Similarly, microbial diversity exhibited differentially to the presence of adding PHY to seca stylo (GSP) or Wynn cassia coculture treatment (GWP) compared to desmanthus treatment (GD) (GD vs. GSP, p = 0.043, and GD vs. GWP, p = 0.02, respectively). Compared to lablab treatment (GL), the rest of the legumes except for Wynn cassia did not show significant changes, even adding PHY.
As mentioned above (Table S2), Wynn cassia coculture treatment (GW) and lablab coculture treatment (GL) exhibited distinct effects on soil microbiota (GL vs. GW, p = 0.007). With PHY addition to either of them (GWP or GLP), significant differences between the two coculture treatments still existed (GL vs. GWP, p = 0.027, and GW vs. GLP, p = 0.012, respectively) (Table S3). Additionally, adding PHY to seca stylo treatment (GSP) made a significant difference compared to Wynn cassia treatment (GW) (GW vs. GSP, p = 0.016). In contrast, seca stylo with grass (GS) did not have a significant impact on diversity compared to Wynn cassia treatment (GW) (GS vs. GW, p = 0.199, Table S2). Interestingly, compared to seca stylo treatment (GS), no other legume coculture system showed significant differences with or without PHY, implying that seca stylo had a similar effect on soil microbial diversity as other legumes (Tables S2 and S3).
Overall, regardless of PHY application, each legume had a distinct effect on microbial diversity in coculture with buffel grass. Microbiota responded differently to some legume–grass coculture groups, including GB and GD, GB and GW, GL and GW. Additionally, PHY altered the effects of coculture on microbial diversity.

3.4. Transcriptomic Sequencing

To investigate how legumes affect buffel grass in coculture treatment, we took buffel grass shoot and root samples from control (G) and each legume treatment (GB, GD, GL, GS, GW) to perform RNA-seq analysis. Due to the observation from the sampling day that buffel grass roots from seca stylo coculture (GS) were markedly larger than that from the control (Figure S5), we used grass root samples from the control and seca stylo coculture treatment to compare the difference of root gene expression in two groups. For the rest of the grass–legume coculture treatments, we collected grass shoot samples to evaluate how each legume affected gene expression in the shoot.
We assessed six replicates from all groups for sequence analysis. Overall, the sequence alignment rate was 55–60% in all samples, providing us with information on buffel grass transcripts used in the present analysis. All processed sequences maintained a length of 150 nucleotides (nt). For the root samples, the total number of quality-filtered sequences was 326.38 million bp, with 30,779,882 ± 3,510,963 (mean ± SD) in the control group (G) and 28,746,862 ± 6,500,749 in the seca stylo treatment group (GS) (Table S4). For the shoot samples, after filtering, 843.19 million bp sequences were yielded from all treatments, with 35,287,315 ± 8,155,241 in the control group (G), 28,049,377 ± 1,080,364 in butterfly pea group (GB), 25,165,596 ± 5,106,006 in desmanthus group (GD), 26,728,839 ± 3,207,522 in the lablab group (GL), and 25,300,352 ± 3,084,542 in Wynn cassia group (GW) (Table S5). Oryza sativa was used as a reference genome (35,806 genes).
The PCA plot reveals the shoot sample distribution across the first two PC components (Figure 5). All the legume treatment samples were noticeably separated from the control, implying the distinct effects of legumes on the buffel grass gene expression. The overlaps between grass shoot expression profiles, when grown with butterfly pea (GB) and lablab treatment (GL) (Figure 5), were evident from the PCA plot, while GD and GW might have less-similar effects on grass when grown in coculture (Figure 5).
The heatmap further demonstrates the contrasts between the grass monoculture (G) and grass grown in coculture with legume (GB, GD, GL, GW) (Figure S6). It shows the expression profile of the top 1000 most significantly altered genes (p < 0.01, |fold change| > 2) across all sequenced samples. The gene expression profiles comparing grass roots grown in monoculture (G) and coculture with seca stylo (GS) are presented in a heatmap in Figure S7.

3.5. Differentially Expressed Genes and Functional Analysis

We continued to explore how the treatment altered gene expression. Out of the 35,806 genes from mapped sequences, in butterfly pea treatment (GB), 4575 differentially expressed (DE) genes passed the filtering criteria (p < 0.01, absolute of fold change > 2) (Table S6). There were 2293 upregulated, and 2282 downregulated genes compared to the control (G). In the desmanthus group (GD), 1913 genes were upregulated, and 2328 genes were downregulated, making a total of 4241 significantly expressed genes. Both lablab and Wynn cassia treatments had more significantly differentially expressed genes than butterfly pea and desmanthus, reaching 5687 (GL) and 7530 (GW), respectively. Additionally, 4354 grass root genes differentially responded with and without the presence of seca stylo (G vs. GS), with 2274 upregulated and 2080 downregulated genes.

3.5.1. GO Enrichment Analysis—Butterfly Pea

DE genes were imported to the PANTHER classification system. Statistical overrepresentation test (Figure S8) shows significant enrichments in molecular function in control (G) and butterfly pea treatment (GB) (p < 0.01, |FC| > 2). In the control group, the most significantly expressed molecular function was catalytic activity associated with 422 DE genes, accounting for 19.1% of total genes, followed by binding (117 genes). Similarly, catalytic activity (400 DE genes) also dominated in butterfly pea-cocultured grass. However, more genes were involved in the binding activity (355 DE genes), compared to the control.
Another gene ontology (GO) domain, biological process, shows the differences between upregulated and downregulated genes in butterfly pea coculture comparison (Figure 6). There were 2212 downregulated and 2235 upregulated annotated genes. Major arms of biological processes, such as the cellular and metabolic processes, had increased and decreased genes, revealing notable butterfly pea effect on gene expression in coculture treatment. However, we also observed some essential activities, including detoxification, growth, and reproduction processes; these functions were enriched only in upregulated genes.
The affected GO categories in the metabolic process are shown in Figure S9. A high number of 139 downregulated genes, highlighted in the pie chart, was related to nitrogen compound metabolism, while 387 upregulated genes were associated with nitrogen compound metabolism.

3.5.2. GO Enrichment Analysis—Desmanthus

In desmanthus treatment (GD), the most altered biological process was a cellular process, with 359 downregulated and 325 upregulated genes in coculture (Figure S10). Similar to the butterfly pea, most of the biological processes altered in the desmanthus group had both increased genes and decreased genes; however, coculture with desmanthus significantly promoted genes contributing to cell death and cell growth. The second most altered biological process, the metabolic process, consists of categories involving either upregulated or downregulated genes (Figure S11). Different from butterfly pea, desmanthus treatment promoted the same number of genes related to the nitrogen compound metabolic process to be upregulated and downregulated, suggesting its balanced role in the modulation of nitrogen metabolism. Additionally, it also altered the hormone metabolic process category.

3.5.3. GO Enrichment Analysis—Wynn Cassia and Lablab

Wynn cassia treatment (GW) altered gene expression in categories involved in nitrogen metabolism, including 240 downregulated and 652 upregulated genes (Figure S12). It also participates in the cellular metabolic process, organic substance metabolic process, and primary metabolic process. The secondary metabolic process was enriched in inhibited genes in Wynn cassia treatment.
Here, we observed that lablab treatment (GL) modulated a few metabolic processes which were also altered by other treatments, including cellular metabolic process, organic substance metabolic process, and primary metabolic process, the top three most expressed processes in lablab coculture treatment (Figure 7). In addition, it also played a crucial role in the nitrogen compound metabolic process, including 198 decreased and 394 increased genes. Similar to butterfly pea and desmanthus, lablab also negatively affected buffel grass’s secondary metabolic process. The GO categories altered in legume treatments reflected the overlap shown in the heatmap (Figure 5).

3.5.4. GO Enrichment Analysis—Seca Stylo

As we have observed root morphometric differences between the control (G) and seca stylo treatment (GS), the alterations in root gene expression are more attractive to explore. The difference in categories enriched with upregulated and downregulated genes in the coculture group is presented below (Figure 8). Compared with the shoot samples, there were more categories in cell components in root samples that were unilaterally regulated by either upregulated or downregulated genes. Categories including chromosomal region, endoplasmic reticulum exit site, the extrinsic component of membrane, microtube plus-end, perinuclear region of cytoplasm, replication fork, side of the membrane, site of DNA damage, spindle midzone, and spindle pole were enriched with downregulated genes in treatment. In contrast, cell leading-edge, leading-edge membrane, and phagophore assembly sites were enriched with upregulated genes. In addition, the biological process also exhibited a distinct point that both upregulated and downregulated genes were involved in the secondary metabolic process in seca stylo treatment and, notably, the pigment metabolism was enriched in upregulated genes (Figure S13).

4. Discussion

4.1. Impact of Legumes on Soil Microbial Diversity and Functional Activity

Legumes can improve soil microbiota diversity and functional activity, especially in functions involved in nitrogen cycling and decomposition [33], contributing to increased organic matter, recycling nutrients, and soil structure. Moreover, legumes and rhizobia can suppress soil-borne pathogens or stimulate beneficial microbes that antagonize them [34]. According to previous studies, some legumes, such as seca stylo and butterfly pea, were growing well with buffel grass under poor soil conditions.
The microbiota analysis revealed that the microbial community membership was relatively similar under different conditions (Figure 2). The dominant phyla identified in this study included Actinobacteriota, Firmicutes, Proteobacteria, Chloroflexi, and Myxococcota. Actinobacteriota took up more than 50% of the relative abundance in all the groups (Figure 2 and Figure S3), in agreement with their established crucial role in the soil system. They contribute to the decomposition of organic matter from dead organisms, allowing plant roots to take up essential molecules. Some soil Actinobacteriota, such as Frankia Frankiaceae, form symbiotic relationships with plant roots, fixing nitrogen for the plants in exchange for access to plant saccharides [35]. As a major plant growth-promoting rhizobacterial phylum, Firmicutes can increase nutrient absorption and stimulate secondary metabolite synthesis [36,37], promoting root growth.
LEfSe analysis demonstrated that some phyla and genera were differentially abundant under different treatments (Figure 3). At the phylum level, as the main phylum in the soil environment, Firmicutes was also the defining phylum for Wynn cassia treatment (GW) (Figure 3a). Combined with its biological benefits, the soil rich in Firmicutes can enhance nutrient cycling and contribute to overall ecosystem balance. Chloroflexi was the most enriched in the lablab group (GL). In soil ecosystems, Chloroflexi feed on debris from lysed bacterial cells, ferment carbohydrates, and degrade complex organic compounds to support their growth and other bacterial populations [38]. Notably, they are involved in hydrogen cycling and interact with fermenting microorganisms [39]. As the seca stylo treatment (GS) biomarker, Desulfobacterota is involved in sulfate reduction. They also play a critical role in molecular hydrogen cycling by closely interacting with fermenting microorganisms [40]. Another seca stylo phylum biomarker, Acidobacteriota, participates in the soil–plant environment by contributing to the regulation of biogeochemical cycles, decomposition of biopolymers, exopolysaccharide secretion, and plant growth promotion [41]. Interestingly, when PHY was added to the seca stylo group soil (GSP), neither of the two phyla was related to the seca stylo treatment anymore. Instead, RCP2-54, a less-known bacterial phylum found in soil ecosystems, which usually tends to be low compared to other dominant phyla, became the biomarker after phytogen inclusion, implying the ability of the PHY to alter phylum-level interactions.
In PHY treatment (GP), members of the genus Hamadaea Micromonosporaceae could produce antimicrobial compounds that protect plants from harmful pathogens. This is consistent with our previous research [10], which states that PHY can promote the development of soil-beneficial species and improve the severely damaged soil. In butterfly pea treatment (GB), Bradyrhizobium Xanthobacteraceae, as a LEfSe bioindicator, plays a role in nitrogen fixation and detoxification [42]. Terrabacter Dermatophilaceae and Sphingomonas Sphingomonadaceae are two examples of plant growth-promoting rhizobacteria (PGPR) that have been shown to promote plant growth by synthesizing compounds for the plants, facilitating the uptake of certain nutrients from the soil and lessening or preventing the plants from diseases. They also help solubilize mineral phosphates and other nutrients, enhance stress resistance, stabilize soil aggregates, and improve soil structure and organic matter content [43].
Wynn cassia treatment (GW) had two defining genera, Rhodococcus Mycobacteriaceae and Lactobacillus Lactobacillaceae. Rhodococcus is another basic rhizobium, responsible for bioremediation [44]. Lactobacillus metabolites promote plant growth and stimulate shoot and root growth. Lactobacillus show an antagonistic effect against phytopathogens, inhibiting fungal and bacterial populations in the rhizosphere [45]. In the group where the PHY was supplemented to the soil (GWP), Cellulosimicrobium Cellulomonadaceae was identified as the indicator for the treatment. They are known to produce cellulase enzymes, participating in the process of breaking down cell walls into simpler sugars that can be used by other microorganisms in the soil [44]. In lablab with the PHY group (GLP), JG30-KF-CM45 exhibited the most abundance compared to other treatments, and it is related to the degradation of organic matter [46]. Sorangium Polyangiaceae was more enriched in seca stylo with the PHY group (GSP), and they are known for producing secondary metabolites with antimicrobial properties [47]. Enzymes nitrogenase and dehydrogenase had a maximum correlation with Sorangium [48].
Figure 4 demonstrates the microbial spatial differences in different legume–grass coculture treatments. Within each treatment, legume–grass coculture showed increased soil microbial diversity, but when they were grown with PHY supplementation, soil had an even higher microbial diversity compared to that from monoculture (G), especially for desmanthus (GDP) and seca stylo (GSP), which significantly boosted soil microbial diversity compared to the control (Figure 4a). These results corresponded to the LEfSe analysis that legume treatments enriched soil microbiota.
Pairwise PERMANOVA validated the group differences between the control and each legume treatment. Each legume had distinct effects on soil microbial diversity, and their effects were likely to be altered by PHY. Different from others, butterfly pea had a significant effect on microbial diversity, while the PHY effects were not significant, which could be visualized from the dbRDA plot (Figure 4b) as samples from butterfly pea treatment (GB) were further from the control compared to the PHY added. This could be due to the fact that PHY inhibited the growth of butterfly pea, so the microbial diversity was not significant when adding PHY to butterfly pea treatment. PHY did not increase microbial diversity, but it made the community more balanced, which was the reason that the microbial community responded differently in the two groups (GB, GP). The rest of the legumes could interact with PHY to increase microbial diversity (Table 1).
Comparisons between the legumes also revealed different influences on microbial communities (Table S2), which PHY could modify (Table S3) by improving microbial diversity in the legume–grass coculture system.

4.2. Impact of Legumes on Buffel Grass Gene Expression

The benefits of increasing soil microbial diversity would eventually be transformed into favorable factors to promote buffel grass growth and development. As buffel grass was affected by various legumes, the transcriptomic sequencing further revealed the alteration of gene expression from different coculture treatments. Figure 5 depicts the distribution of shoot samples based on the gene expression, giving the striking separation of samples between untreated and coculture treatments. This remarkable isolation underlined that these legumes significantly affected buffel grass gene expression.
From gene functional analysis, we observed that all the legume treatments influenced nitrogen metabolism, which was enriched in upregulated and downregulated genes. This suggests that the nitrogen metabolism pathway was highly active in the coculture condition. Nitrogen is an essential macronutrient for plant growth and development, and it plays a crucial role in various physiological processes, such as photosynthesis, respiration, and DNA replication [49,50]. Nitrogen compounds are involved in synthesizing amino acids, nucleotides, and chlorophyll, which are essential for plant growth and development. Nitrogen compounds also regulate plant responses to biotic and abiotic stresses, such as drought, salinity, and pathogen infection [49]. As well as the dynamic interplay, legumes have also affected gene expression of some GO categories in cocultures grass. All the legumes, except for seca stylo, have only downregulated genes enriched in the secondary metabolic process. Moreover, in detoxification, butterfly pea treatment (GB) has only one upregulated gene Os04g0206600 overexpressed, which is a UDP-glucosyltransferase involved in the detoxification of deoxynivalenol, a mycotoxin produced by Fusarium fungi that can cause serious plant health problems [51].
Desmanthus coculture treatment (GD) had two categories that were enriched only in upregulated genes, including cell death and cell growth, which are two fundamental processes that occur in living organisms. Cell death, also known as apoptosis [52], is a process where cells in an organism die in a controlled manner. This process is essential for maintaining the health of an organism as it allows for the removal of damaged or unwanted cells [53]. Cell growth, on the other hand, is the process whereby cells in an organism increase in size or number [54]. This process is important for developing and maintaining tissues and organs in an organism. These two processes are enriched with upregulated genes in desmanthus coculture treatment, suggesting that desmanthus could cause a shift in the balance of relevant genes in these two processes.
For the root samples, seca stylo treatment (GS) has more cell component categories enriched in either upregulated or downregulated genes. Cell leading-edge, leading-edge membrane, and phagophore assembly site were enriched categories in upregulated genes only (Figure 8). Phagophore assembly site is important for autophagy, which is a cellular process in which cytoplasmic materials are delivered and degraded in the lysosome. It is a dynamic recycling system, producing new building blocks and energy for cellular renovation and homeostasis [55]. The leading-edge membrane and phagophore assembly sites contribute to the expansion and completion of autophagosomes. These structures supply the necessary membranes for autophagosome formation [56]. Upregulation of these sites enhances the cell’s ability to maintain intracellular quality control by selectively degrading unwanted or dysfunctional components. Upregulation also enhances the cell’s metabolic flexibility, allowing it to adapt to changing environmental conditions [57]. The upregulation of these cellular components in grass root cells can effectively enhance root cell growth and renovation, contributing to overall cellular health, which has been validated from morphometric visualization (Figure S5).

4.3. Limitations and Future Direction

This pot trial was conducted on a small scale in which buffel grass was cocultured with single legume species. This condition ensures that there is no interference among different legume species. However, buffel grass grows in a more complicated condition in the field where multiple species grow together. Therefore, the effect of a single species on buffel grass will be influenced by other species. Future research would focus on the comprehensive influence of legumes on grass and provide a mixture of seeds for practical use.

5. Conclusions

This study illustrates the intricate relationships within legume–buffel grass coculture systems, revealing their profound impacts on soil microbiota and buffel grass gene expression. Adapted legumes significantly enhance soil microbial diversity, influencing nitrogen cycling and decomposition of organic matter. Adding PHY further amplifies these effects, opening tailored microbial modulation opportunities. Microbial analyses indicate the stability of the community under various conditions, emphasizing the crucial role of dominant species. Differential influences of legumes on soil microbial diversity and buffel grass gene expression are underscored, particularly in categories related to nitrogen metabolism, cell growth, and detoxification. Unique contributions of specific legumes, such as butterfly pea, desmanthus, and seca stylo, offer insights into their different roles within the coculture system. This research provides crucial knowledge for optimizing legume–grass coculture systems in sustainable agriculture. Insights from this study can guide agricultural practices to manage diverse plant combinations for long-term soil fertility, nutrient cycling, and crop productivity.

Supplementary Materials

The following supporting information can be downloaded at: https://www.mdpi.com/article/10.3390/agronomy14092172/s1, Figure S1: Phylum level microbiota compositions in different treatment of legumes and phytogens; Figure S2: Genus level microbiota compositions in different treatment of legumes and phytogens; Figure S3: Microbiota composition at the phylum level; Figure S4: Ordination of individual samples with principal coordinate analysis (PCoA) of weighted-UniFrac distance depicting spatial differences in microbiota among all treatments; Figure S5: Buffel grass root collected from the control (G) and seca stylo coculture treatment (GS); Figure S6: Differential gene expression and clustering; Figure S7: Differential gene expression and clustering; Figure S8: Statistic overrepresentation in molecular function; Figure S9: Biological process at metabolic process level in butterfly pea treatment (GB); Figure S10: Biological process at cellular process level in desmanthus treatment; Figure S11: Biological process at metabolic process level in desmanthus treatment (GD); Figure S12: Biological process at metabolic process level in wynn cassia treatment (GW); Figure S13: Biological process at metabolic process level in seca stylo treatment (GS); Table S1: Hydroponic nutrient supply; Table S2: Pairwise PERMANOVA test at the phylum level; Table S3: Pairwise PERMANOVA test at the phylum level; Table S4: Transcriptomic sequencing for root samples; Table S5: Transcriptomic sequencing for shoot samples; Table S6: Number of differentially expressed genes.

Author Contributions

Conceptualization, X.R. and D.S.; methodology, X.R., N.A., S.J.Y., and Y.S.B.; formal analysis, X.R. and Y.S.B.; investigation, X.R.; writing—original draft preparation, X.R.; writing—review and editing, S.J.Y., D.S., P.B.B., T.T., N.A., and Y.S.B.; supervision, T.T., N.A., Y.S.B., D.S., and P.B.B.; project administration, Y.S.B.; funding acquisition, D.S. All authors have read and agreed to the published version of the manuscript.

Funding

The PhD scholarship for XR is funded by Fitzroy Basin Association (FBA), Rockhampton, Australia, and EW Nutrition, Visbek, Germany.

Data Availability Statement

Raw sequencing data supporting the results and conclusion made in this study are available in public repositories in the National Center for Biotechnology Information (NCBI) SRA database with accession number: PRJNA1090219.

Acknowledgments

The data were analyzed using the Marie Curie High Performance Computing Systems at Central Queensland University. We wish to acknowledge, and we appreciate, the help Jason Bell provided in all aspects of high-performance computing.

Conflicts of Interest

The authors declare no conflicts of interest. The funders had no role in the design of the study; in the collection, analyses, or interpretation of data; in the writing of the manuscript; or in the decision to publish the results.

References

  1. Shtark, O.Y.; Borisov, A.Y.; Zhukov, V.A.; Tikhonovich, I.A. Mutually beneficial legume symbioses with soil microbes and their potential for plant production. Symbiosis 2012, 58, 51–62. [Google Scholar] [CrossRef]
  2. Wei, Z.; Maxwell, T.M.R.; Robinson, B.; Dickinson, N. Legume nutrition is improved by neighbouring grasses. Plant Soil 2022, 475, 443–455. [Google Scholar] [CrossRef]
  3. Kebede, E. Contribution, utilization, and improvement of legumes-driven biological nitrogen fixation in agricultural systems. Front. Sustain. Food Syst. 2021, 5, 767998. [Google Scholar] [CrossRef]
  4. Signorelli, S.; Sainz, M.; Tabares-da Rosa, S.; Monza, J. The role of nitric oxide in nitrogen fixation by legumes. Front. Plant Sci. 2020, 11, 521. [Google Scholar] [CrossRef] [PubMed]
  5. Franche, C.; Lindström, K.; Elmerich, C. Nitrogen-fixing bacteria associated with leguminous and non-leguminous plants. Plant Soil 2009, 321, 35–59. [Google Scholar] [CrossRef]
  6. Schulte, C.C.M.; Borah, K.; Wheatley, R.M.; Terpolilli, J.J.; Saalbach, G.; Crang, N.; de Groot, D.H.; Ratcliffe, R.G.; Kruger, N.J.; Papachristodoulou, A.; et al. Metabolic control of nitrogen fixation in rhizobium-legume symbioses. Sci. Adv. 2021, 7, eabh2433. [Google Scholar] [CrossRef]
  7. Yu, H.; Wang, F.; Shao, M.; Huang, L.; Xie, Y.; Xu, Y.; Kong, L. Effects of rotations with legume on soil functional microbial communities involved in phosphorus transformation. Front. Microbiol. 2021, 12, 661100. [Google Scholar] [CrossRef]
  8. Muthuraman, Y.; Muthaiyan, P.; Pandurangan, G. Role of Legumes in Improving Soil Fertility Status. In Legume Crops; Mirza, H., Ed.; IntechOpen: Rijeka, Croatia, 2020; Chapter 2; Available online: https://www.intechopen.com/chapters/72818 (accessed on 1 December 2023).
  9. Makiela, S.; Harrower, K.M. Overview of the current status of buffel grass dieback. Australas. Plant Dis. Notes 2008, 3, 12. [Google Scholar] [CrossRef]
  10. Ren, X.; Whitton, M.M.; Yu, S.J.; Trotter, T.; Bajagai, Y.S.; Stanley, D. Application of phytogenic liquid supplementation in soil microbiome restoration in queensland pasture dieback. Microorganisms 2023, 11, 561. [Google Scholar] [CrossRef]
  11. Mpanza, T.D.E.; Hassen, A.; Akanmu, A.M. Evaluation of stylosanthes scabra accessions as forage source for ruminants: Growth performance, nutritive value and in vitro ruminal fermentation. Animals 2020, 10, 1939. [Google Scholar] [CrossRef]
  12. Seeds, S. Tropical and Subtropical Legumes. Available online: https://www.selectedseeds.com.au/pasture-legumes (accessed on 28 November 2023).
  13. Pathak, P.; Ramesh, C.; Bhatt, R. Stylosanthes in the reclamation and development of degraded soils in india. In High-Yielding Anthracnose Resistant Stylosanthes for Agricultural Systems; Union Offset: San Carlos, Philippines, 2004; pp. 39–51. Available online: https://www.aciar.gov.au/sites/default/files/legacy/node/568/mn111-chapters1-9.pdf (accessed on 1 December 2023).
  14. Hall, T.J.; Milson, J.; Hall, C. Pasture Recovery, Land Condition and Some Other Observations after the Monsoon Flooding, Chill Event in North-West Queensland in Jan-Mar 2019; Technical Report; State of Queensland: Brisbane, QLD, Australia, 2020. Available online: https://era.daf.qld.gov.au/id/eprint/7443/ (accessed on 28 November 2023).
  15. Jones, R.M.; Rees, M.C. Evaluation of tropical legumes on clay soils at four sites in southern inland queensland. Trop. Grassl. 1997, 31, 95–106. [Google Scholar]
  16. Pengelly, B.C.; Conway, M.J. Pastures on cropping soils: Which tropical pasture legume to use? Trop. Grassl. 2000, 34, 162–168. Available online: https://www.researchgate.net/publication/280020846_Pastures_on_cropping_soils_Which_tropical_pasture_legume_to_use (accessed on 29 November 2023).
  17. Beef, F. Legumes for Long-Term Pastures on High Fertility Soils in Queensland. Available online: https://futurebeef.com.au/resources/legumes-for-long-term-pastures-on-high-fertility-soils/ (accessed on 29 November 2023).
  18. Gardiner, C.; Parker, A. Steer liveweight gains on progardes desmanthus/buffelpastures in queensland. In Proceedings of the 2nd Australian and New Zealand Societies of Animal Production Joint Conference, Lincoln University, Christchurch, New Zealand, 2–5 July 2012. [Google Scholar]
  19. Collins, J.; Gardiner, C.; Kempe, N.; Hannah, I. Successful Pasture Development at Cungelella: A grazier, a Researcher and a Seed Company’s Perspective. Available online: https://researchonline.jcu.edu.au/45276/1/45276%20Collins%20et%20al%202016.pdf (accessed on 1 December 2023).
  20. Department of Primary Industries, NSW Government. Round-Leafed Cassia. Available online: https://www.dpi.nsw.gov.au/agriculture/pastures-and-rangelands/species-varieties/pf/factsheets/round-leafed-cassia (accessed on 1 December 2023).
  21. Clements, R.; Jones, R.; Valdes, L.; Bunch, G. Selection of chamaecrista rotundifolia by cattle. Trop. Grassl. 1996, 30, 389–394. [Google Scholar]
  22. Progressive Seeds. Available online: https://progressiveseeds.com.au/lablab/ (accessed on 28 November 2023).
  23. Ren, X.; Whitton, M.M.; Trotter, T.; Ashwath, N.; Stanley, D.; Bajagai, Y.S. Enhancing soil health and carbon sequestration through phytogenic treatment: Insights into microbial functional pathways in pasture dieback affected soil. Plant Soil 2024, 496, 1–17. [Google Scholar] [CrossRef]
  24. Bolyen, E.; Rideout, J.R.; Dillon, M.R.; Bokulich, N.A.; Abnet, C.C.; Al-Ghalith, G.A.; Alexander, H.; Alm, E.J.; Arumugam, M.; Asnicar, F.; et al. Reproducible, interactive, scalable and extensible microbiome data science using qiime 2. Nat. Biotechnol. 2019, 37, 852–857. [Google Scholar] [CrossRef]
  25. Callahan, B.J.; McMurdie, P.J.; Rosen, M.J.; Han, A.W.; Johnson, A.J.A.; Holmes, S.P. Dada2: High-resolution sample inference from illumina amplicon data. Nat. Methods 2016, 13, 581–583. [Google Scholar] [CrossRef]
  26. Liu, C.; Cui, Y.; Li, X.; Yao, M. Microeco: An r package for data mining in microbial community ecology. FEMS Microbiol. Ecol. 2020, 97, fiaa255. [Google Scholar] [CrossRef]
  27. Anderson, M.; Gorley, R.N.; Clarke, K. Permanova+ for Primer: Guide to Software and Statistical Methods; PRIMER-E: Plymouth, UK, 2008. [Google Scholar]
  28. GraphPad. Analysis Checklist: Kruskal-Wallis Test. Available online: https://www.graphpad.com/guides/prism/latest/statistics/stat_checklist_kw.htm (accessed on 28 November 2023).
  29. Dethlefsen, L.; Relman, D.A. Incomplete recovery and individualized responses of the human distal gut microbiota to repeated antibiotic perturbation. Proc. Natl. Acad. Sci. USA 2011, 108, 4554–4561. [Google Scholar] [CrossRef]
  30. QIAGEN. Qiagen clc Genomics Workbench. Available online: https://digitalinsights.qiagen.com/ (accessed on 29 November 2023).
  31. Mi, H.; Thomas, P. Panther Pathway: An Ontology-Based Pathway Database Coupled with Data Analysis Tools; Humana Press: Totowa, NJ, USA, 2009; pp. 123–140. [Google Scholar] [CrossRef]
  32. Holyoake, P.; Kirkland, P.; Davis, R.; Arzey, K.; Watson, J.; Lunt, R.; Wang, J.; Wong, F.; Moloney, B.; Dunn, S. The first identified case of pandemic h1n1 influenza in pigs in australia. Aust. Vet. J. 2011, 89, 427–431. [Google Scholar] [CrossRef]
  33. Duchene, O.; Vian, J.-F.; Celette, F. Intercropping with legume for agroecological cropping systems: Complementarity and facilitation processes and the importance of soil microorganisms. A review. Agric. Ecosyst. Environ. 2017, 240, 148–161. [Google Scholar] [CrossRef]
  34. Dakora, F.D. Defining new roles for plant and rhizobial molecules in sole and mixed plant cultures involving symbiotic legumes. New Phytol. 2003, 158, 39–49. [Google Scholar] [CrossRef]
  35. Nalini, M.S.; Prakash, H.S. Actinobacteria: Diversity, plant interactions and biotechnology applications. In Plant Microbiomes for Sustainable Agriculture; Yadav, A.N., Singh, J., Rastegari, A.A., Yadav, N., Eds.; Springer International Publishing: Cham, Switzerland, 2020; pp. 199–244. [Google Scholar] [CrossRef]
  36. Xiao, X.; Fan, M.; Wang, E.; Chen, W.; Wei, G. Interactions of plant growth-promoting rhizobacteria and soil factors in two leguminous plants. Appl. Microbiol. Biotechnol. 2017, 101, 8485–8497. [Google Scholar] [CrossRef] [PubMed]
  37. Gamalero, E.; Glick, B.R. Bacterial modulation of plant ethylene levels. Plant Physiol. 2015, 169, 13–22. [Google Scholar] [CrossRef] [PubMed]
  38. Speirs, L.B.M.; Rice, D.T.F.; Petrovski, S.; Seviour, R.J. The phylogeny, biodiversity, and ecology of the chloroflexi in activated sludge. Front. Microbiol. 2019, 10, 2015. [Google Scholar] [CrossRef]
  39. Bovio-Winkler, P.; Guerrero, L.D.; Erijman, L.; Oyarzúa, P.; Suárez-Ojeda, M.E.; Cabezas, A.; Etchebehere, C. Genome-centric metagenomic insights into the role of chloroflexi in anammox, activated sludge and methanogenic reactors. BMC Microbiol. 2023, 23, 45. [Google Scholar] [CrossRef]
  40. Pessi, I.S.; Viitamäki, S.; Virkkala, A.-M.; Eronen-Rasimus, E.; Delmont, T.O.; Marushchak, M.E.; Luoto, M.; Hultman, J. In-depth characterization of denitrifier communities across different soil ecosystems in the tundra. Environ. Microbiome 2022, 17, 30. [Google Scholar] [CrossRef]
  41. Kalam, S.; Basu, A.; Ahmad, I.; Sayyed, R.Z.; El-Enshasy, H.A.; Dailin, D.J.; Suriani, N.L. Recent understanding of soil acidobacteria and their ecological significance: A critical review. Front. Microbiol. 2020, 11, 580024. [Google Scholar] [CrossRef]
  42. Masson-Boivin, C.; Giraud, E.; Perret, X.; Batut, J. Establishing nitrogen-fixing symbiosis with legumes: How many rhizobium recipes? Trends Microbiol. 2009, 17, 458–466. [Google Scholar] [CrossRef]
  43. Hayat, R.; Ali, S.; Amara, U.; Khalid, R.; Ahmed, I. Soil beneficial bacteria and their role in plant growth promotion: A review. Ann. Microbiol. 2010, 60, 579–598. [Google Scholar] [CrossRef]
  44. Gu, Y.; Dong, K.; Geisen, S.; Yang, W.; Yan, Y.; Gu, D.; Liu, N.; Borisjuk, N.; Luo, Y.; Friman, V.-P. The effect of microbial inoculant origin on the rhizosphere bacterial community composition and plant growth-promotion. Plant Soil 2020, 452, 105–117. [Google Scholar] [CrossRef]
  45. Raman, J.; Kim, J.-S.; Choi, K.R.; Eun, H.; Yang, D.; Ko, Y.-J.; Kim, S.-J. Application of lactic acid bacteria (lab) in sustainable agriculture: Advantages and limitations. Int. J. Mol. Sci. 2022, 23, 7784. [Google Scholar] [CrossRef] [PubMed]
  46. Wongkiew, S.; Koottatep, T.; Polprasert, C.; Prombutara, P.; Jinsart, W.; Khanal, S.K. Bioponic system for nitrogen and phosphorus recovery from chicken manure: Evaluation of manure loading and microbial communities. Waste Manag. 2021, 125, 67–76. [Google Scholar] [CrossRef] [PubMed]
  47. Schneiker, S.; Perlova, O.; Kaiser, O.; Gerth, K.; Alici, A.; Altmeyer, M.O.; Bartels, D.; Bekel, T.; Beyer, S.; Bode, E.; et al. Complete genome sequence of the myxobacterium sorangium cellulosum. Nat. Biotechnol. 2007, 25, 1281–1289. [Google Scholar] [CrossRef] [PubMed]
  48. Malviya, M.K.; Solanki, M.K.; Li, C.-N.; Wang, Z.; Zeng, Y.; Verma, K.K.; Singh, R.K.; Singh, P.; Huang, H.-R.; Yang, L.-T.; et al. Sugarcane-legume intercropping can enrich the soil microbiome and plant growth. Front. Sustain. Food Syst. 2021, 5, 606595. [Google Scholar] [CrossRef]
  49. Ye, J.Y.; Tian, W.H.; Jin, C.W. Nitrogen in plants: From nutrition to the modulation of abiotic stress adaptation. Stress Biol. 2022, 2, 4. [Google Scholar] [CrossRef]
  50. Zayed, O.; Hewedy, O.A.; Abdelmoteleb, A.; Ali, M.; Youssef, M.S.; Roumia, A.F.; Seymour, D.; Yuan, Z.-C. Nitrogen journey in plants: From uptake to metabolism, stress response, and microbe interaction. Biomolecules 2023, 13, 1443. [Google Scholar] [CrossRef]
  51. Wetterhorn, K.M.; Newmister, S.A.; Caniza, R.K.; Busman, M.; McCormick, S.P.; Berthiller, F.; Adam, G.; Rayment, I. Crystal structure of os79 (os04g0206600) from Oryza sativa: A udp-glucosyltransferase involved in the detoxification of deoxynivalenol. Biochemistry 2016, 55, 6175–6186. [Google Scholar] [CrossRef]
  52. Roos, W.P.; Kaina, B. DNA damage-induced cell death by apoptosis. Trends Mol. Med. 2006, 12, 440–450. [Google Scholar] [CrossRef]
  53. Elmore, S. Apoptosis: A review of programmed cell death. Toxicol. Pathol. 2007, 35, 495–516. [Google Scholar] [CrossRef]
  54. Zhu, J.; Thompson, C.B. Metabolic regulation of cell growth and proliferation. Nat. Rev. Mol. Cell Biol. 2019, 20, 436–450. [Google Scholar] [CrossRef]
  55. Mizushima, N.; Komatsu, M. Autophagy: Renovation of cells and tissues. Cell 2011, 147, 728–741. [Google Scholar] [CrossRef] [PubMed]
  56. Levine, B.; Kroemer, G. Biological functions of autophagy genes: A disease perspective. Cell 2019, 176, 11–42. [Google Scholar] [CrossRef] [PubMed]
  57. Dobrota, C. Energy Dependant Plant Stress Acclimation. In Life in Extreme Environments; Amils, R., Ellis-Evans, C., Hinghofer-Szalkay, H., Eds.; Springer: Dordrecht, The Netherlands, 2007; pp. 277–285. [Google Scholar] [CrossRef]
Figure 1. Irrigation system. The number of replicates was recorded from Rep1 to 10. In each replicate, there were twenty-two pots randomly placed, containing one of the four treatments, including six single species without PHY, six single species with PHY, five legume–grass coculture treatments without PHY, and five legume–grass coculture treatments with PHY.
Agronomy 14 02172 g001
Figure 2. Microbial composition at the phylum (a) and genus (b) level in different groups. The phylum-level plot shows the 10 most abundant phyla, and the genus-level plot shows 20 most abundant genera. Abbreviations: buffel grass (G); PHY (P); butterfly pea (B); desmanthus (D); lablab (L); Wynn cassia (W); and seca stylo (S).
Agronomy 14 02172 g002
Figure 3. Characteristic phyla (a) and genera (b) of different treatments. Phyla and genera were identified with linear discriminant analysis (LDA) effect size (LEfSe). Phyla and genera with LDA scores of greater than 3.3 are presented.
Agronomy 14 02172 g003
Figure 4. Diversity of soil microbiota in different treatments: (a) microbiota diversity in different treatments measured with the indicator phylogenetic diversity; (bf) ordination of individual samples with distance-based redundancy analysis (dbRDA) of Bray–Curtis distance depicting spatial differences in microbiota among all treatments. Abbreviations: buffel grass (G); PHY (P); butterfly pea (B), desmanthus (D), lablab (L), Wynn cassia (W); and seca stylo (S). The asterisk indicates a significant change * = p < 0.05.
Agronomy 14 02172 g004
Figure 5. Differential gene expression and clustering between control and legume treatments. PCA plot shows the distribution of the control (G) and each of the legume treatment (GB, GD, GL, GW) shoot samples across the first two principal components.
Agronomy 14 02172 g005
Figure 6. Differentially expressed genes in biological processes in butterfly pea treatment: panel (a) represents categories associated with 2212 downregulated genes; panel (b) represents categories related to 2235 upregulated genes.
Agronomy 14 02172 g006
Figure 7. Differentially expressed genes at metabolic process GO categories altered by lablab coculture: panel (a) represents categories associated with 367 downregulated genes; panel (b) represents categories related to 503 upregulated genes.
Agronomy 14 02172 g007
Figure 8. Differentially expressed genes at the cellular anatomical entity level in seca stylo treatment (GS): panel (a) represents categories associated with 663 downregulated genes; panel (b) represents categories related to 499 upregulated genes.
Agronomy 14 02172 g008
Table 1. Statistical comparison of effects of one and two factors on microbial diversity. Pairwise PERMANOVA test at the phylum level.
Pairwise Tests
Groupstp (Perm)Unique Perms
G, GP1.17310.218991
G, GB1.86610.01 *987
G, GBP1.44410.054987
GB, GBP1.5790.031 *993
GB, GP2.15240.002 **994
GBP, GP1.45590.058992
G, GD1.28490.116977
G, GDP1.79310.017 *993
GD, GDP1.38430.083995
GD, GP1.21720.188992
GDP, GP1.21450.175994
G, GL2.05610.003 **921
G, GLP1.75790.007 **982
GL, GLP0.900130.569970
GL, GP1.840.006 **967
GLP, GP1.57380.029 *996
G, GS1.24490.146911
G, GSP1.94620.001 **985
GS, GSP1.20610.176976
GS, GP1.29940.146994
GSP, GP1.59650.036 *992
G, GW0.670270.83694
G, GWP1.46180.034 *971
GW, GWP1.49020.036 *790
GW, GP1.00340.383840
GWP, GP1.73540.006 **990
The asterisk indicates significant change * = p < 0.05, ** = p < 0.01.
Disclaimer/Publisher’s Note: The statements, opinions and data contained in all publications are solely those of the individual author(s) and contributor(s) and not of MDPI and/or the editor(s). MDPI and/or the editor(s) disclaim responsibility for any injury to people or property resulting from any ideas, methods, instructions or products referred to in the content.

