Article

Study on the Synergistic Regulation Model for Lycium barbarum Berries Under Integrated Irrigation and Fertigation in Northwest Arid Regions

College of Water Conservancy and Hydropower Engineering, Gansu Agricultural University, Lanzhou 730070, China
*
Author to whom correspondence should be addressed.
Agronomy 2025, 15(1), 73; https://doi.org/10.3390/agronomy15010073
Submission received: 3 December 2024 / Revised: 22 December 2024 / Accepted: 28 December 2024 / Published: 30 December 2024

Abstract

:
Water resources are fundamental to economic and social development. Improving agricultural water-use efficiency is essential for alleviating water scarcity, ensuring food security, and fostering sustainable growth. This study examines the effects of irrigation levels (severe water deficit, W0: 45–55% θFC; moderate water deficit, W1: 55–65% θFC; mild water deficit, W2: 65–75% θFC; full irrigation, W3: 75–85% θFC) and nitrogen application rates (N0: 0 kg·hm−2, N1: 150 kg·hm−2, N2: 300 kg·hm−2, N3: 450 kg·hm−2) on soil environment, crop yield, and water–nitrogen use efficiencies in Lycium barbarum under integrated water–fertilizer drip irrigation. The coordinated application of water and nitrogen significantly influenced yield and efficiencies (p < 0.05) by modifying rhizosphere conditions such as soil moisture, temperature, salinity, and enzyme activities. Soil temperature increased with nitrogen application (N1 > N2 > N0 > N3), with N1 raising soil temperature by 4.98–8.02% compared to N0, N2, and N3. Electrical conductivity was lowest under N0, showing a 7.53–18.74% reduction compared to N1, N2, and N3. Urease activity peaked under N3 (31.84–96.78% higher than other treatments), while alkaline phosphatase and catalase activities varied across treatments. The yield was highest under N2, at 6.79–41.31% higher than other nitrogen treatments. Water use efficiency (WUE), growth use efficiency (GUE), and nitrogen agronomic efficiency (NAE) peaked under N2, while nitrogen use efficiency (NUE) decreased with higher nitrogen rates. Among irrigation levels, W0 showed the highest soil temperature, while W3 exhibited the lowest conductivity in the 0–40 cm layer. W2 had the highest soil enzyme activities, yielding 4.41–42.86% more than other levels, with maximum efficiencies for WUE, GUE, NUE, and NAE. The combination of mild water deficit (65–75% θFC) and 300 kg·hm−2 nitrogen application (W2N2) resulted in the highest yield (2701.78 kg·hm−2). This study provides key insights for implementing integrated drip irrigation in northwest China’s arid regions.

1. Introduction

Water scarcity represents a significant bottleneck that hampers sustainable economic and social development [1]. Although global water resources total 1.4 billion cubic kilometers, the majority is unsuitable for agricultural irrigation [2]. Consequently, the scientific and rational utilization of water resources, along with improving their efficiency, has become an essential strategy for mitigating the gap between water supply and demand and ensuring long-term water security [3]. According to the 2023 China Water Resources Bulletin, the total water consumption in the country was 590.65 billion m3, of which 367.24 billion m3 was used for agriculture, accounting for 62.2% of the total water consumption [4]. Therefore, improving agricultural water-use efficiency has become a key solution to mitigate water shortages. Developing water-saving agriculture is a crucial approach to enhancing water-use efficiency, advancing agricultural modernization, and ensuring national food security [5]. Water-fertilizer integration technology combines irrigation and fertilization, delivering water and nutrients to the crop root zone through a pressure pipe system at regular intervals, in small flow rates and at precise proportions, based on the crop’s water and nutrient needs [6]. This technology is vital for promoting high-quality and sustainable agricultural development [7].
Water-fertilizer integrated drip irrigation technology not only allows for precise control over water and fertilizer supply [8] but also significantly reduces the waste of water and fertilizer resources, thereby enhancing their efficiency [9]. Despite its great potential to improve agricultural water use efficiency, this technology still faces numerous challenges. Many farmers lack sufficient scientific support, leading to improper water and fertilizer management practices, such as over-irrigation or insufficient fertilization. These issues can result in problems such as disease outbreaks, quality degradation, and resource wastage [10]. Such practices not only squander water and fertilizer resources but can also negatively impact the soil environment, restricting crop growth and hindering the sustainable development of agricultural production. Consequently, research on water–fertilizer integration technology—especially the application of water–nitrogen synergistic regulation models in different crops—becomes particularly important. In this context, Lycium barbarum, a perennial shrub known for its salt- and drought-resistant properties, offers significant potential for optimizing water and fertilizer management. Lycium barbarum not only improves soil structure and fertility but also provides numerous health benefits, such as boosting immunity, delaying aging, and enhancing eyesight. As an ideal species for desertification control in arid and semi-arid regions [11], planting Lycium barbarum in water-scarce areas not only aids in ecological restoration but also provides substantial economic value. Additionally, it serves as an important source of traditional Chinese medicine and health products [12]. Therefore, integrating water–fertilizer management techniques with Lycium barbarum cultivation can optimize growth while promoting sustainable agricultural development. Moisture is a critical factor in the growth of Lycium barbarum [13]. Proper water management optimizes the root-zone environment, enhancing plant growth and nutrient uptake [14]. Nitrogen is a key nutrient for Lycium barbarum, and the amount and method of nitrogen application significantly influence its distribution and effectiveness in the root-zone soil [15]. Research on water and fertilizer management for Lycium barbarum is evolving, with a focus on promoting high-quality production and improving water and fertilizer use efficiency [16,17,18]. An optimal water and nitrogen supply maximizes the soil’s water and nitrogen regulation, facilitating better crop production. Water can carry fertilizers to the roots of Lycium barbarum via diffusion or mass flow [19], while nitrogen fertilizers help activate deep soil moisture, increasing their effectiveness [20]. Practical studies have shown that proper water and nitrogen management improves Lycium barbarum yield and maximizes water use efficiency. This approach not only improves soil’s physical and chemical properties, but also enhances plant growth and yield. Thus, studying and implementing the appropriate water and nitrogen synergistic regulation model is essential for optimizing Lycium barbarum cultivation and improving water and fertilizer use efficiency.
Based on this, studying the effects of different water and nitrogen co-regulation on the root zone soil environment and production of Lycium barbarum is particularly necessary. This study aims to (1) Clarify the effects of different water and nitrogen regulations on the root zone soil environment and production of drip-irrigated Lycium barbarum; (2) Propose suitable water and fertilizer regulation schemes for water–fertilizer integrated drip irrigation of Lycium barbarum with a focus on high yield, economic efficiency, and high quality, providing theoretical support for the promotion and application of water–fertilizer integrated drip irrigation in the dry zones of Northwest China.

2. Materials and Methods

2.1. Experimental Area Overview

The experiment was conducted from April to October 2023 at the Irrigation Experiment Station of Jingtai Chuan Power Lift Irrigation Water Resources Utilization Center in Gansu Province (37°12′ N, 104°5′ E). The average elevation of the test area was 1562 m. The climate of the region is temperate, arid continental, characterized by 2652 h of annual sunshine, an average annual temperature of 8.6 °C, and an average annual precipitation of 191.6 mm. The frost-free period lasts for 191 days. During the experiment, the average daily temperature was 20.61 °C, and the total effective precipitation was 75.10 mm (Figure 1). The soil at the experimental site is predominantly sandy loam, with a dry bulk density of 1.63 g/cm3 in the 0–120 cm layer and a maximum water-holding capacity of 24.10%. The nutrient contents of the soil were as follows: 13.20 g/kg of organic matter, 1.62 g/kg of total nitrogen, 1.32 g/kg of total phosphorus, 34.03 g/kg of total potassium, 74.51 mg/kg of quick-acting nitrogen, 26.31 mg/kg of quick-acting phosphorus, 173.02 mg/kg of quick-acting potassium, and a pH of 8.11.

2.2. Experimental Design

The experiment employed a fully randomized design with two factors: irrigation and nitrogen application. The irrigation level was determined by controlling the soil volumetric water content as a percentage of farmland capacity (θFC), with the depth of the wet layer planned to be set at 60 cm, as the main root system of Lycium barbarum is concentrated at depths between 40 and 60 cm. The water gradient and nitrogen application levels were also determined based on previous studies and local practice patterns [17,18]. Irrigation levels are as follows: W3 (fully irrigated): 75~85% θFC, W2 (mild water deficit): 65~75% θFC, W1 (moderate water deficit): 55~65% θFC, W0 (severe water deficit): 45~55% θFC. Nitrogen application levels were as follows: N0: 0 kg/hm2 (no nitrogen application), N1: 150 kg/hm2 (low nitrogen application), N2: 300 kg/hm2 (medium nitrogen application), N3: 450 kg/hm2 (high nitrogen application). This resulted in 16 treatment combinations (Table 1), with three replications per treatment, for a total of 48 plots. Each plot had an area of 76.5 m2 (10.2 m × 7.5 m). Lycium barbarum (“Ningqi No. 5”) seedlings were transplanted on April 12, 2021, with a plant spacing of 1.5 m and row spacing of 3 m. The four main reproductive periods of Lycium barbarum were defined as follows: Nutritive growth period (late April to mid-June), Blooming period (late June to early July), Fruiting period (mid-July to mid-August), Autumn fruiting period (late August to mid-September). A drip irrigation system with water–fertilizer integration was used for water and fertilizer application. Water was sourced from a storage reservoir and passed through a low-pressure filtration system before entering the test plots. Irrigation water volume was strictly controlled by valves and water meters, and a drip irrigation belt system with a 2.0 L/h flow rate was employed. Phosphorus (P₂O₅, 12%) and potash (K₂O, 60%) fertilizers were applied on 21 May, while nitrogen fertilizer (pure nitrogen) was applied in four separate applications (6 May, 22 May, 12 June, and 3 July) with a 4:2:2:2 ratio.

2.3. Indicator Measurement

2.3.1. Meteorological Data

Meteorological data, including rainfall and air temperature, were collected using the WSTQ Tianqi small-scale agro-meteorological station in the field.

2.3.2. Inter-Root Soil Volumetric Water Content of Lycium barbarum

The time-domain reflectometer (TDR) probe tubes were installed at a depth of 30 cm, oriented in the north–south direction, between the second and third rows of Lycium barbarum trees in each plot. This positioning was within the primary root distribution zone, ensuring that the measurement area was not influenced by the tree canopy shade or root activity from neighboring trees. The PICO-BTTDR instrument (Manufacturer: IMKO Micromodultechnik GmbH, Location: Karlsruhe, Germany) was used to monitor the volumetric water content in the soil across the 0–120 cm layer, offering a more precise representation of how root activities influence soil moisture levels. Although the main root system of Lycium barbarum primarily extends to depths of 40–60 cm, roots can reach depths exceeding 100 cm. Soil moisture measurements were taken every 3–5 days throughout the lifespan of the Lycium barbarum trees, with periodic calibration of the data conducted using the drying method.

2.3.3. Inter-Root Soil Temperature of Lycium barbarum

Temperature probes, each 20 cm in length, were inserted into the soil 10 cm from the trunks of Lycium barbarum trees, oriented in the east–west direction at the center of each experimental plot. This location was selected to target areas with denser root systems, allowing for a more accurate reflection of root activity’s influence on soil temperature. Soil temperature fluctuations are closely linked to soil water content, which in turn was used to calculate irrigation requirements. Irrigation was applied when the calculated values approached the lower limit of the field capacity (θFC). According to a previous study [21], meaningful soil temperature changes could be detected by measurements taken every 3–5 days during the entire reproductive period of Lycium barbarum. Observations were conducted from 8:00 AM to 6:00 PM, with measurements taken every two hours.

2.3.4. Inter-Root Soil Conductivity, Soil Enzyme Activity and Yield of Lycium barbarum

Soil conductivity was measured at depths of 0–20 cm, 20–40 cm, 40–60 cm, 60–80 cm, and 80–100 cm at a distance of 20–30 cm from the trunk of each tree. Soil samples were extracted with an auger, and the conductivity of the supernatant was measured using a DDSJ-308A conductivity meter (Shanghai Jinko Technology Co., Location: Shanghai, China).
Soil samples for enzyme activity analysis were collected from the 0–20 cm, 20–40 cm, and 40–60 cm layers at a distance of 10–15 cm from the trunk of the trees during the four reproductive periods. Soil alkaline phosphatase, catalase, and urease activities were determined using kits (Manufacturer: Suzhou Gressay Biotechnology Co., Ltd., Location: Suzhou, China).
The yield was calculated through cumulative multi-crop harvesting. Each plot was harvested by picking, dewaxing, and drying Lycium barbarum fruit. The yield per treatment was determined by weighing the harvested fruit (kg/hm2).

2.4. Water Utilization Efficiency and Irrigation Volume Calculation

(1)
The irrigation volume was calculated using the formula:
I = 10 λ h ( θ ω θ )
where I—irrigation water quantity, mm; λ—soil bulk weight, 1.35 g-cm−3; h—planned wet layer depth, and 60 cm; θω—soil planned water content upper limit (the product of field water holding capacity and the upper limit of the designed planned water content), %.
(2)
Water Consumption
Water consumption was calculated using the following formula for water flow balance:
E T = W 0 W t + I + M + K D R
M = j = 1 n a j P j
where ET—water consumption, mm;
  • W0—initial time plot water content, mm;
  • Wtt time plot water content, mm;
  • I—irrigation water, mm;
  • M—effective rainfall;
  • K—groundwater recharge, mm, the groundwater depth in the test area is under 25 m soil layer, so the recharge is 0;
  • D—deep seepage, mm, the soil moisture content of 50–60 cm soil layer depth in the test area did not reach the level of field water holding capacity, so the seepage is 0;
  • R—surface runoff volume, mm, the terrain of the test area is flat, so the runoff volume is 0;
  • Pj—the jth rainfall, mm; j—the number of times of rainfall, j = 1~n; aj—the effective utilization coefficient of the jth rainfall, when the second rainfall Pj < 5 mm, aj = 0; when the Pj = 5~50 mm, aj = 1.0; when Pj > 50 mm, aj = 0.8~0.7.
(3)
Water Utilization Efficiency (WUE)
Water utilization efficiency was calculated as:
W U E = Y / E T
where Y is the Lycium barbarum yield (kg/hm2)
(4)
Irrigation Water Utilization Efficiency (GUE)
Irrigation water utilization efficiency was calculated as:
G U E = Y / I
where Y is the Lycium barbarum yield (kg/hm2)
(5)
Nitrogen Fertilizer Bias Productivity (PFPn)
The nitrogen fertilizer bias productivity was calculated as:
P F P n = Y / N a
where Na is the amount of nitrogen applied (kg/hm2)
(6)
Agronomic Efficiency of Nitrogen Fertilizer (NAE)
The agronomic efficiency of nitrogen fertilizer was calculated as:
N A E = ( Y N -   Y n ) / N a
where YN is the Yield with nitrogen application (kg/hm2); Yield without nitrogen application (kg/hm2).

2.5. Data Analysis

Data were processed using Microsoft Excel 2019, and significance analyses of soil hydrothermal conditions, root vigor, and enzyme activities were performed using one-way analysis of variance (ANOVA) with multiple comparisons, specifically the Least Significant Difference (LSD) test, at a significance level of p < 0.05. Statistical analysis was conducted using SPSS software (version 20.0, IBM, Analytics, USA). Graphs were created using Origin 2021 software.

3. Results

3.1. Effect of Water and Nitrogen Regulation on Inter-Root Soil Hydrothermal Salts in Lycium barbarum

3.1.1. Soil Water Content

Water and nitrogen regulation significantly influenced the spatial and temporal distribution of soil water content in the root zone of Lycium barbarum (Figure 2). Generally, soil water content increased initially and then decreased during the fertility period and with increasing soil depth. In the 0–60 cm soil layer, water content fluctuated most significantly during the fertility period, initially decreasing and then increasing. Under the same irrigation levels, the average soil water content followed the order: N0 (12.92–23.17%) > N1 (12.65–21.85%) > N2 (11.41–20.72%) > N3 (10.92–20.02%). Similarly, at the same nitrogen application levels, the trend was W3 (14.41–25.93%) > W2 (12.43–25.15%) > W1 (12.41–20.13%) > W0 (11.82–19.24%). For the 60–100 cm soil layer, the average water content was higher than in the 100–120 cm layer. The soil water content of W3 increased by 4.37–13.5% compared to W0, and W2 increased by 4.37–13.92%. Similarly, N0 exhibited 7.26–19.31% higher average soil water content compared to N1, N2, and N3. For the 100–120 cm soil layer, variations in soil water content among treatments were minimal. Across all treatments, the soil water content in this layer slowly decreased with depth but slightly increased as the fertility period progressed.

3.1.2. Soil Temperature

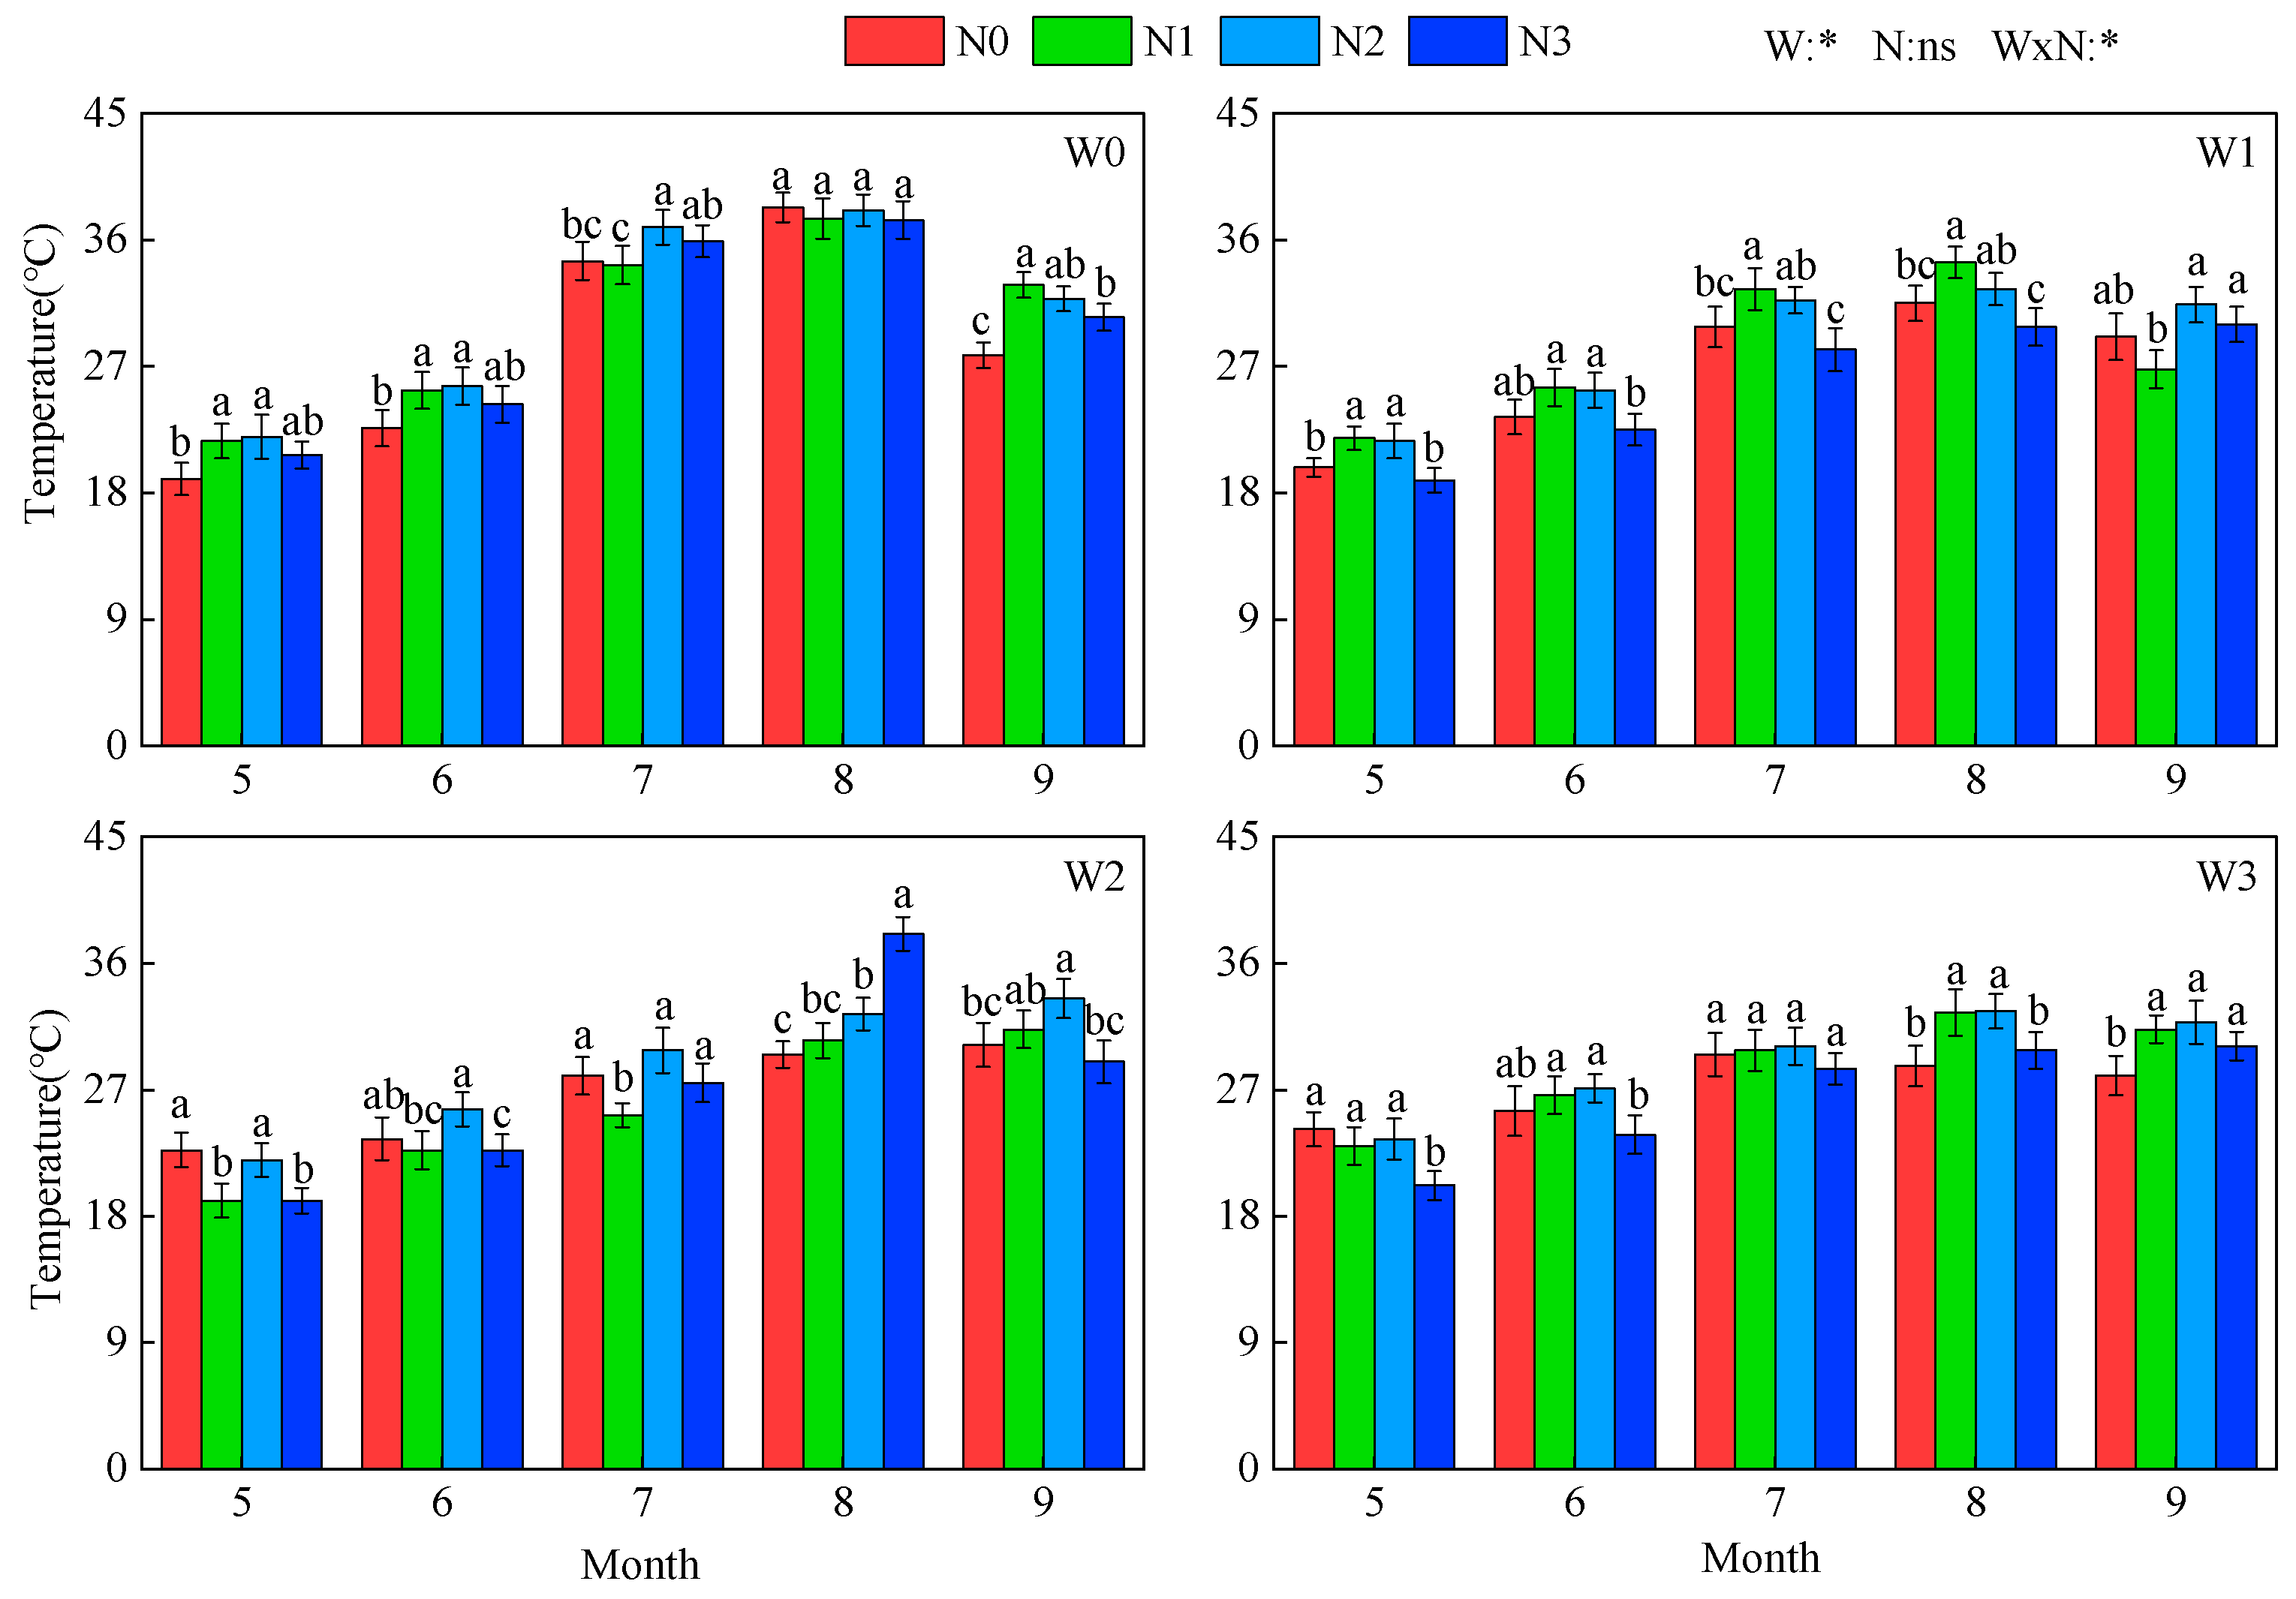
The inter-root soil temperature of Lycium barbarum was significantly affected by water and nitrogen regulation (p < 0.05, Figure 3). Soil temperature increased initially and then decreased throughout the fertility period, peaking in June to August during the flowering and fruiting stages. Under the same nitrogen application rates, higher water deficits correlated with increased soil temperatures, with W0 having the highest average temperature (29.9 °C), which was 7.55%, 8.73%, and 14.92% higher than W1, W2, and W3, respectively. For nitrogen treatments, soil temperatures followed the trend N1 > N2 > N0 > N3, with N1 being 8.02%, 6.53%, and 4.98% higher than N0, N2, and N3, respectively. Temperature variations were minimal during the nutrient growth to flowering stage (May–June), and the full fruiting to defoliation stage (August–September) for nitrogen application treatments, but significant differences were observed compared to non-nitrogen application treatments. Mild water deficit conditions (W2) resulted in the most stable soil temperature fluctuations throughout the reproductive period.

3.1.3. Soil Salinity

Water and nitrogen regulation also had a pronounced effect on the temporal and spatial distribution of soil salinity in the root zone (Figure 4). Soil salinity peaked from June to August (flowering-fruiting period) and was relatively lower during May–June (nutrient growth-flowering stage) and August–September (fruiting-defoliation stage). Salinity content generally decreased with increasing soil depth. At the same nitrogen application levels, the lowest average soil conductivity in the 0–40 cm layer was observed under W3 (386.93 μS/cm), which was 9.25%, 14.31%, and 18.26% lower than W2, W1, and W0, respectively. In the 40–80 cm layer, the lowest conductivity occurred under W0 (393.43 μS/cm). For the 80–100 cm layer, W0 again exhibited the lowest conductivity (375.8 μS/cm), which was 10.97%, 20.34%, and 26.87% lower than W1, W2, and W3, respectively. At the same irrigation levels, the lowest soil conductivity across all layers was found under N0, which was 7.53%, 15.28%, and 18.74% lower than N1, N2, and N3, respectively. The W3N0 treatment achieved the lowest average soil salinity content (189.93 μS/cm) across the 0–100 cm depth during the entire reproductive period.

3.2. Effect of Water and Nitrogen Synergistic Regulation on Inter-Root Soil Enzyme Activities in Lycium barbarum

3.2.1. Soil Urease Activity

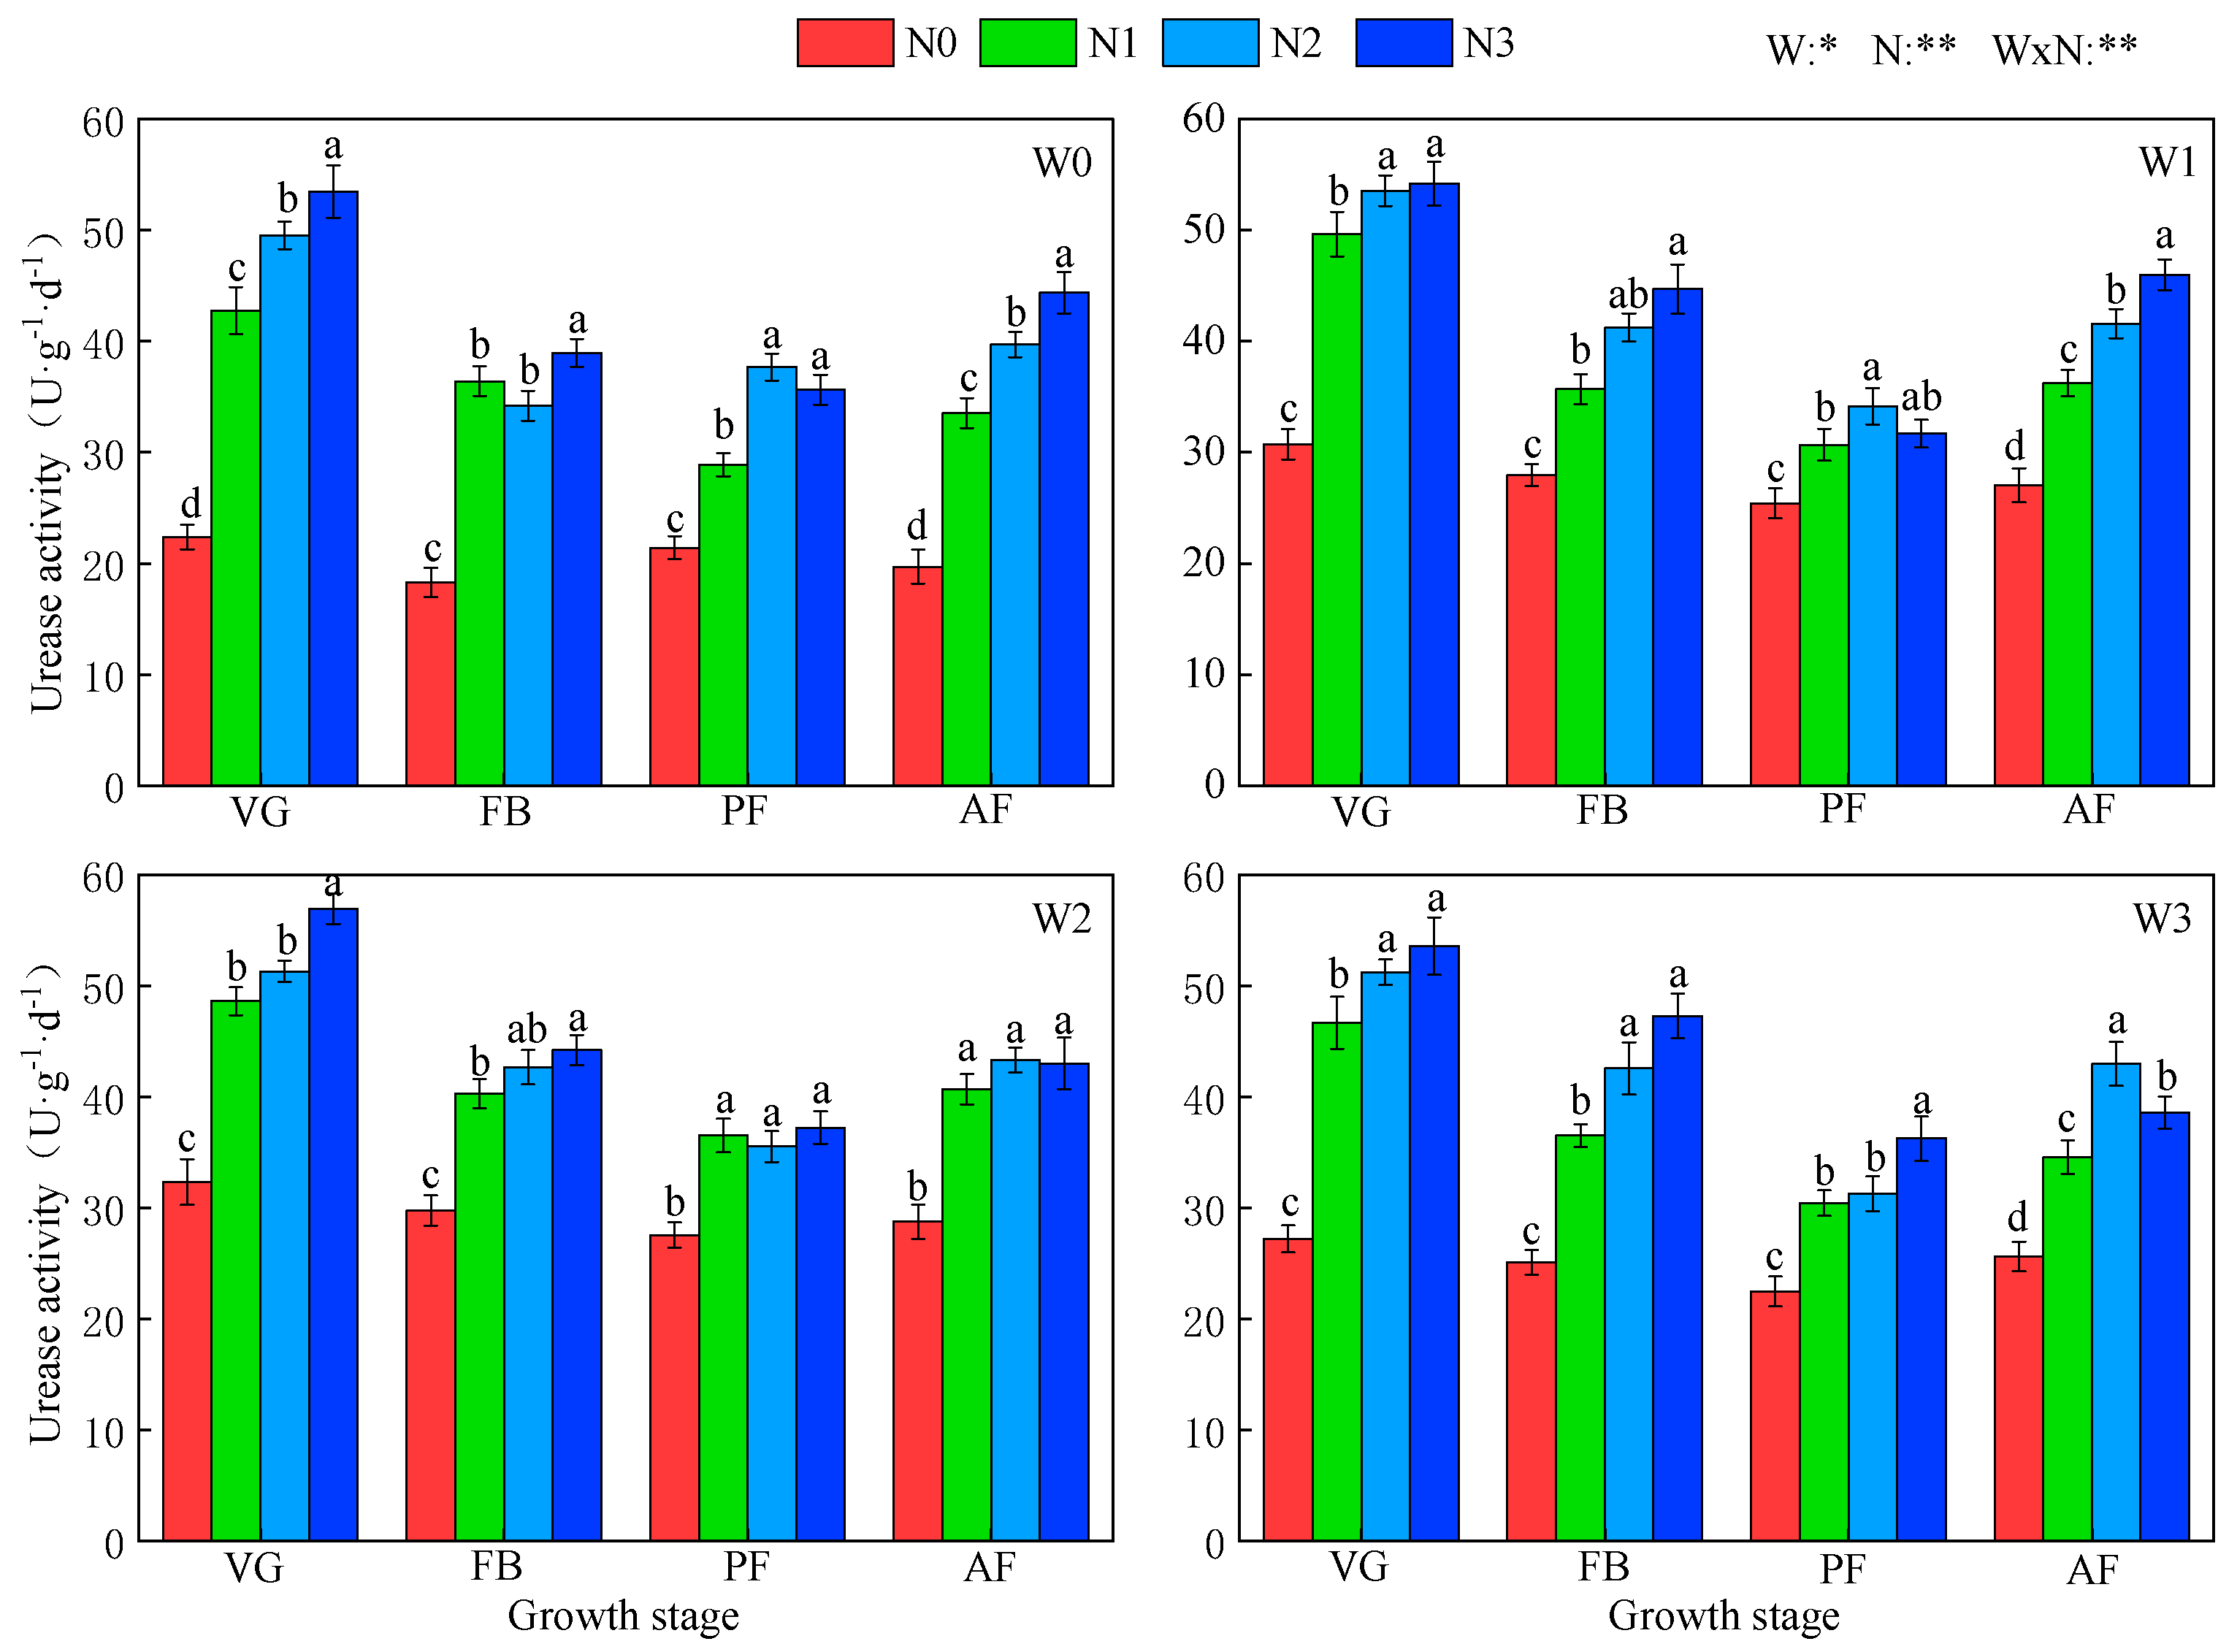
Water and nitrogen levels, along with their interaction, significantly influenced soil urease activity in the root zone of Lycium barbarum (p < 0.01, Figure 5). Urease activity followed a distinct temporal pattern: it peaked during the spring growth period, decreased gradually, and reached its lowest during the fruit ripening stage before increasing again. Under the same irrigation levels, urease activity increased with higher nitrogen application rates. N3 exhibited the highest average urease activity, increasing by 73.55–96.78%, 52.71–61.93%, and 31.84–43.54% compared to N0, N1, and N2, respectively. At the same nitrogen levels, urease activity showed an initial increase followed by a decline with increasing irrigation amounts, following the pattern W2 > W1 > W3 > W0. The W2N3 treatment had the highest average urease activity (179 U g−1 d−1), surpassing all other treatments by 3–120%.

3.2.2. Soil Alkaline Phosphatase Activity

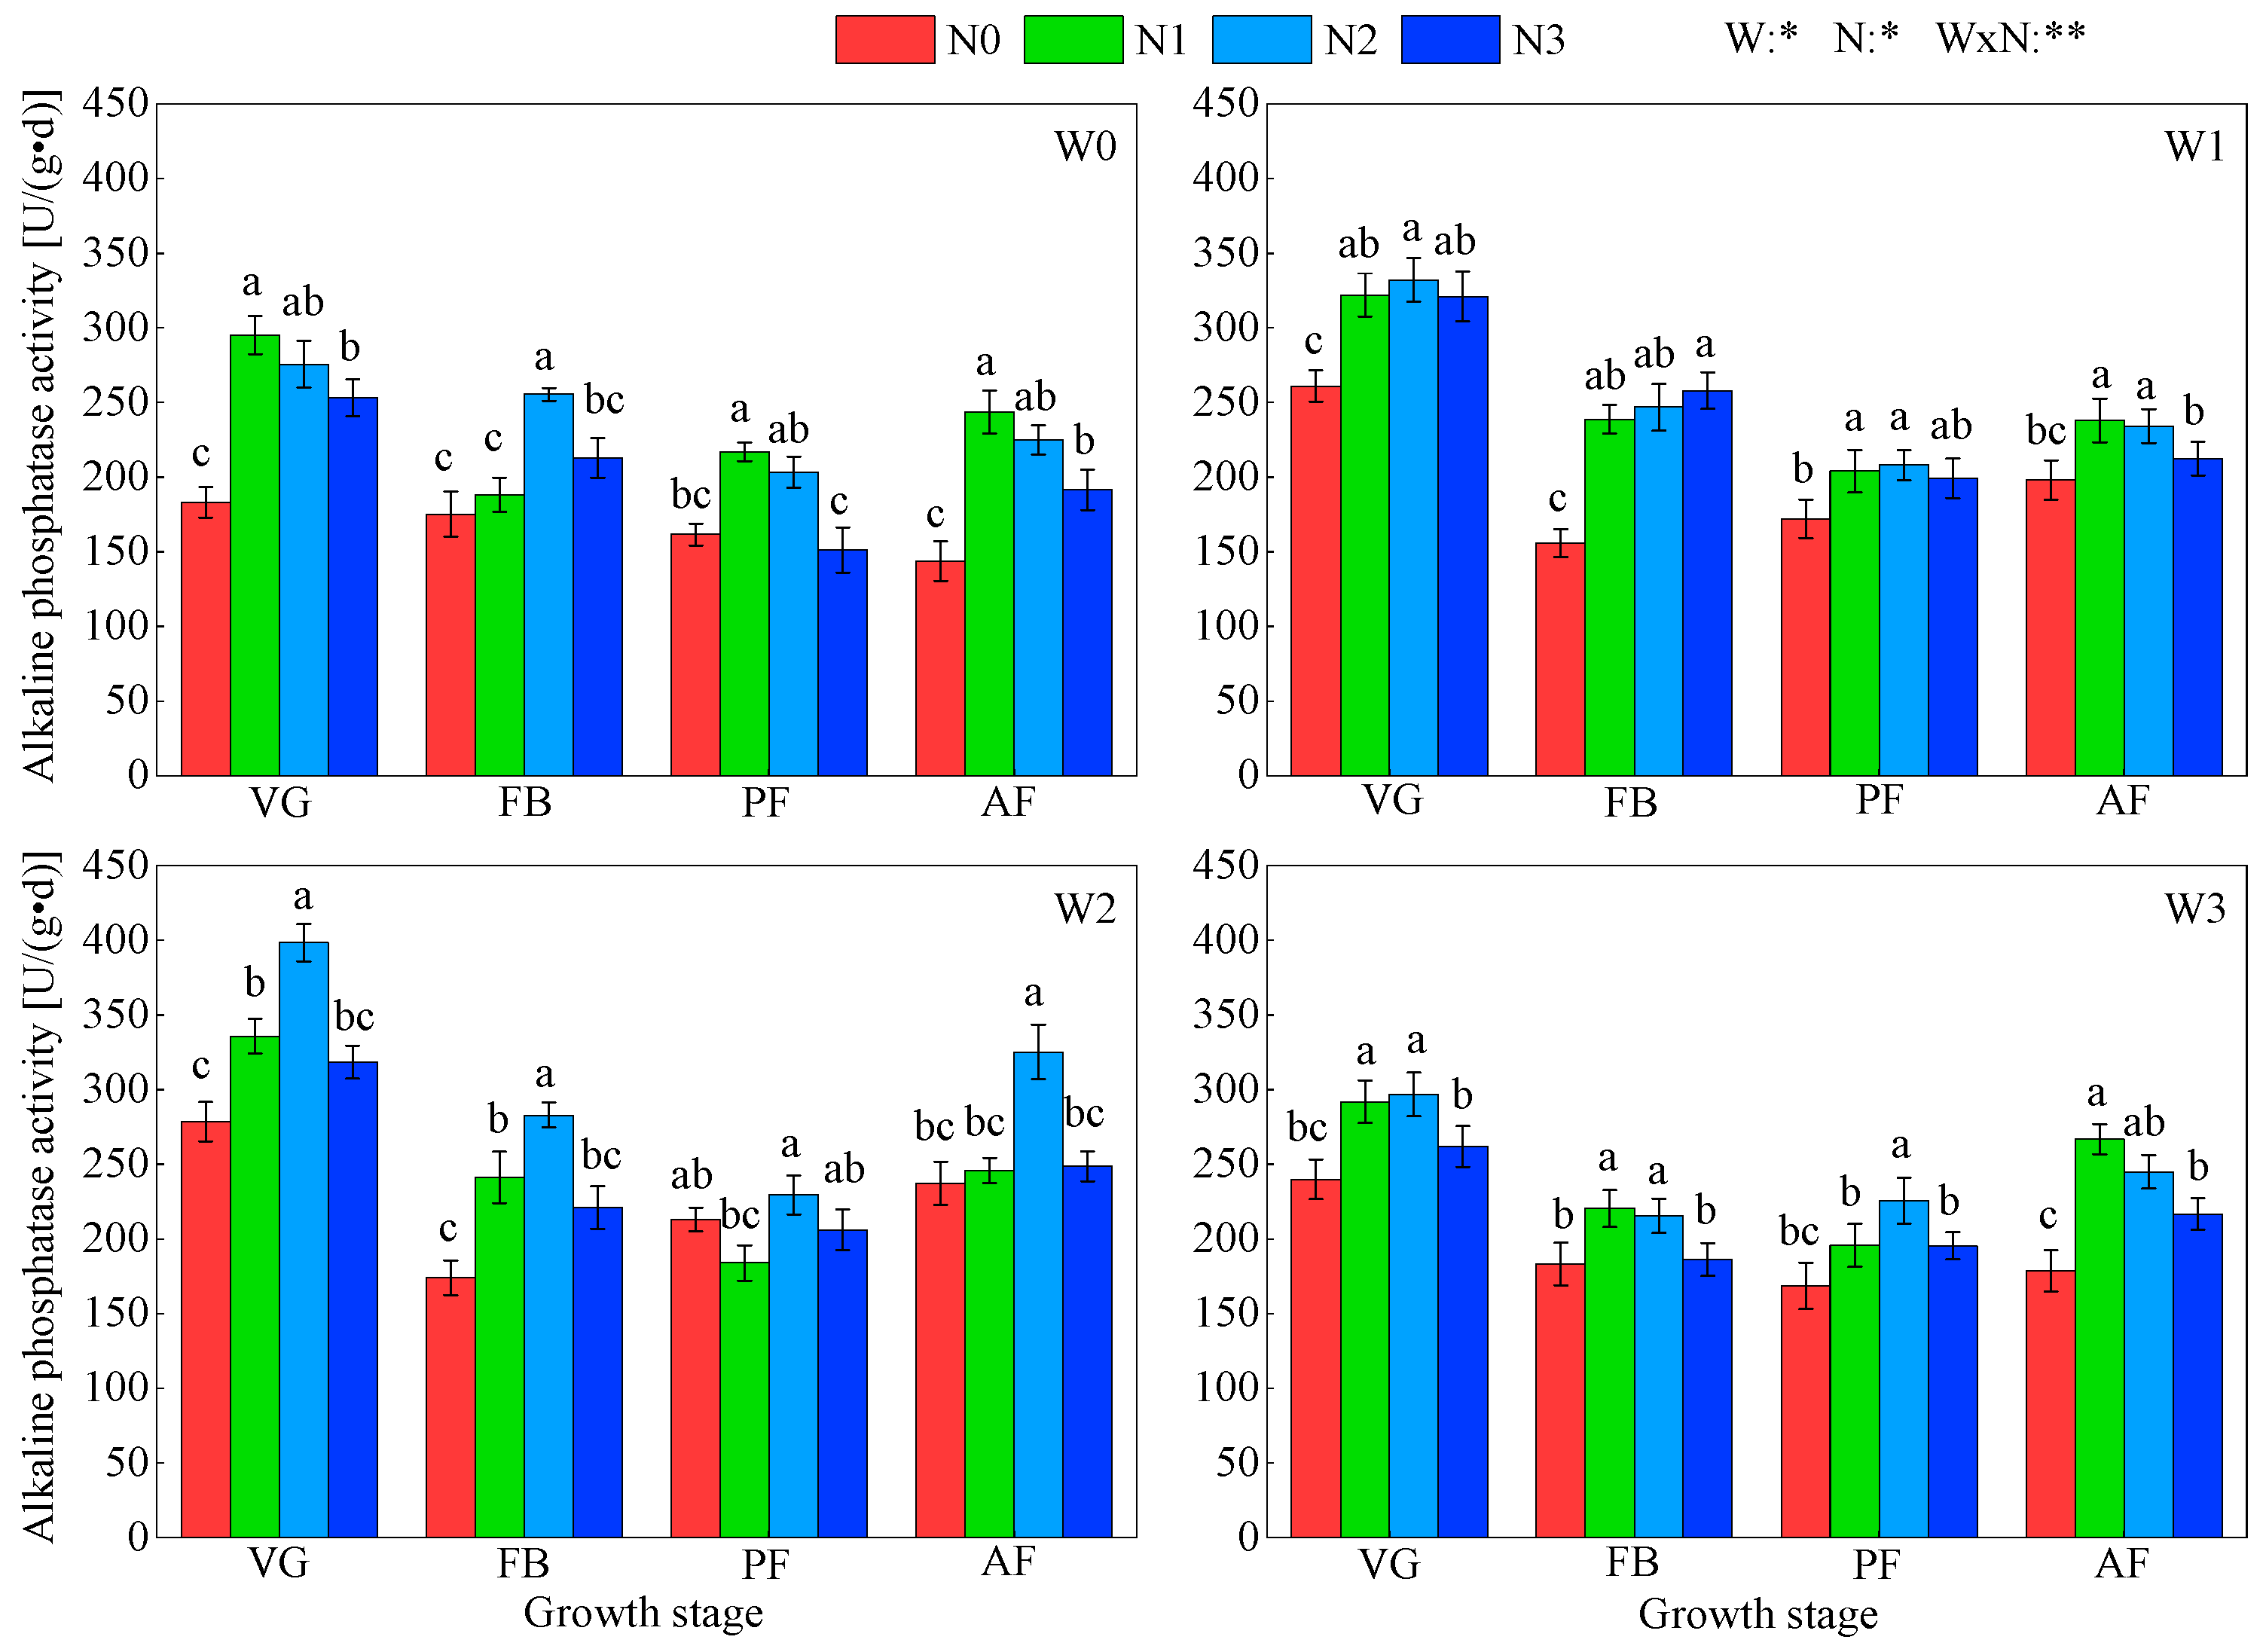
Soil alkaline phosphatase activity was also significantly affected by water and nitrogen levels and their interaction (p < 0.05, Figure 6). Over the fertility period, alkaline phosphatase activity initially decreased and then increased. At the same irrigation levels, enzyme activity increased with nitrogen application before declining at higher nitrogen levels. While differences among nitrogen application treatments were modest, all nitrogen treatments (N1, N2, and N3) had significantly higher activity than the no-nitrogen control (N0). The activity levels were 32%, 53%, and 38% higher for N1, N2, and N3 compared to N0, respectively. For the same nitrogen levels, enzyme activity followed a similar trend with irrigation, increasing first and then declining, in the order W2 > W1 > W3 > W0. The W2N2 treatment achieved the highest average alkaline phosphatase activity, which was 20–86% greater than other treatments throughout the reproductive period.

3.2.3. Soil Catalase Activity

Catalase activity in the inter-root soil of Lycium barbarum was significantly affected by water, nitrogen, and their interaction (p < 0.05, Figure 7). Similar to other enzyme activities, catalase activity decreased initially during the fertility period, reaching its lowest at the mid-stage, before rising again during the fruiting stage. Catalase activity increased first and then decreased with higher irrigation levels and nitrogen application rates. At the same nitrogen levels, W2 enhanced catalase activity by 60–107%, 43–57%, and 32–49% compared to W0, W1, and W3, respectively. At the same irrigation levels, N2 increased catalase activity by 21.04–32.12%, 11.31–24.86%, and 12.01–19.63% compared to N0, N1, and N3, respectively. The W2N2 treatment produced the highest catalase activity, which was 21–218% greater than other treatments.

3.3. Effects of Water and Nitrogen Co-Regulation on Lycium barbarum Yield and Water and Nitrogen Utilization Efficiency

3.3.1. Lycium barbarum Yield

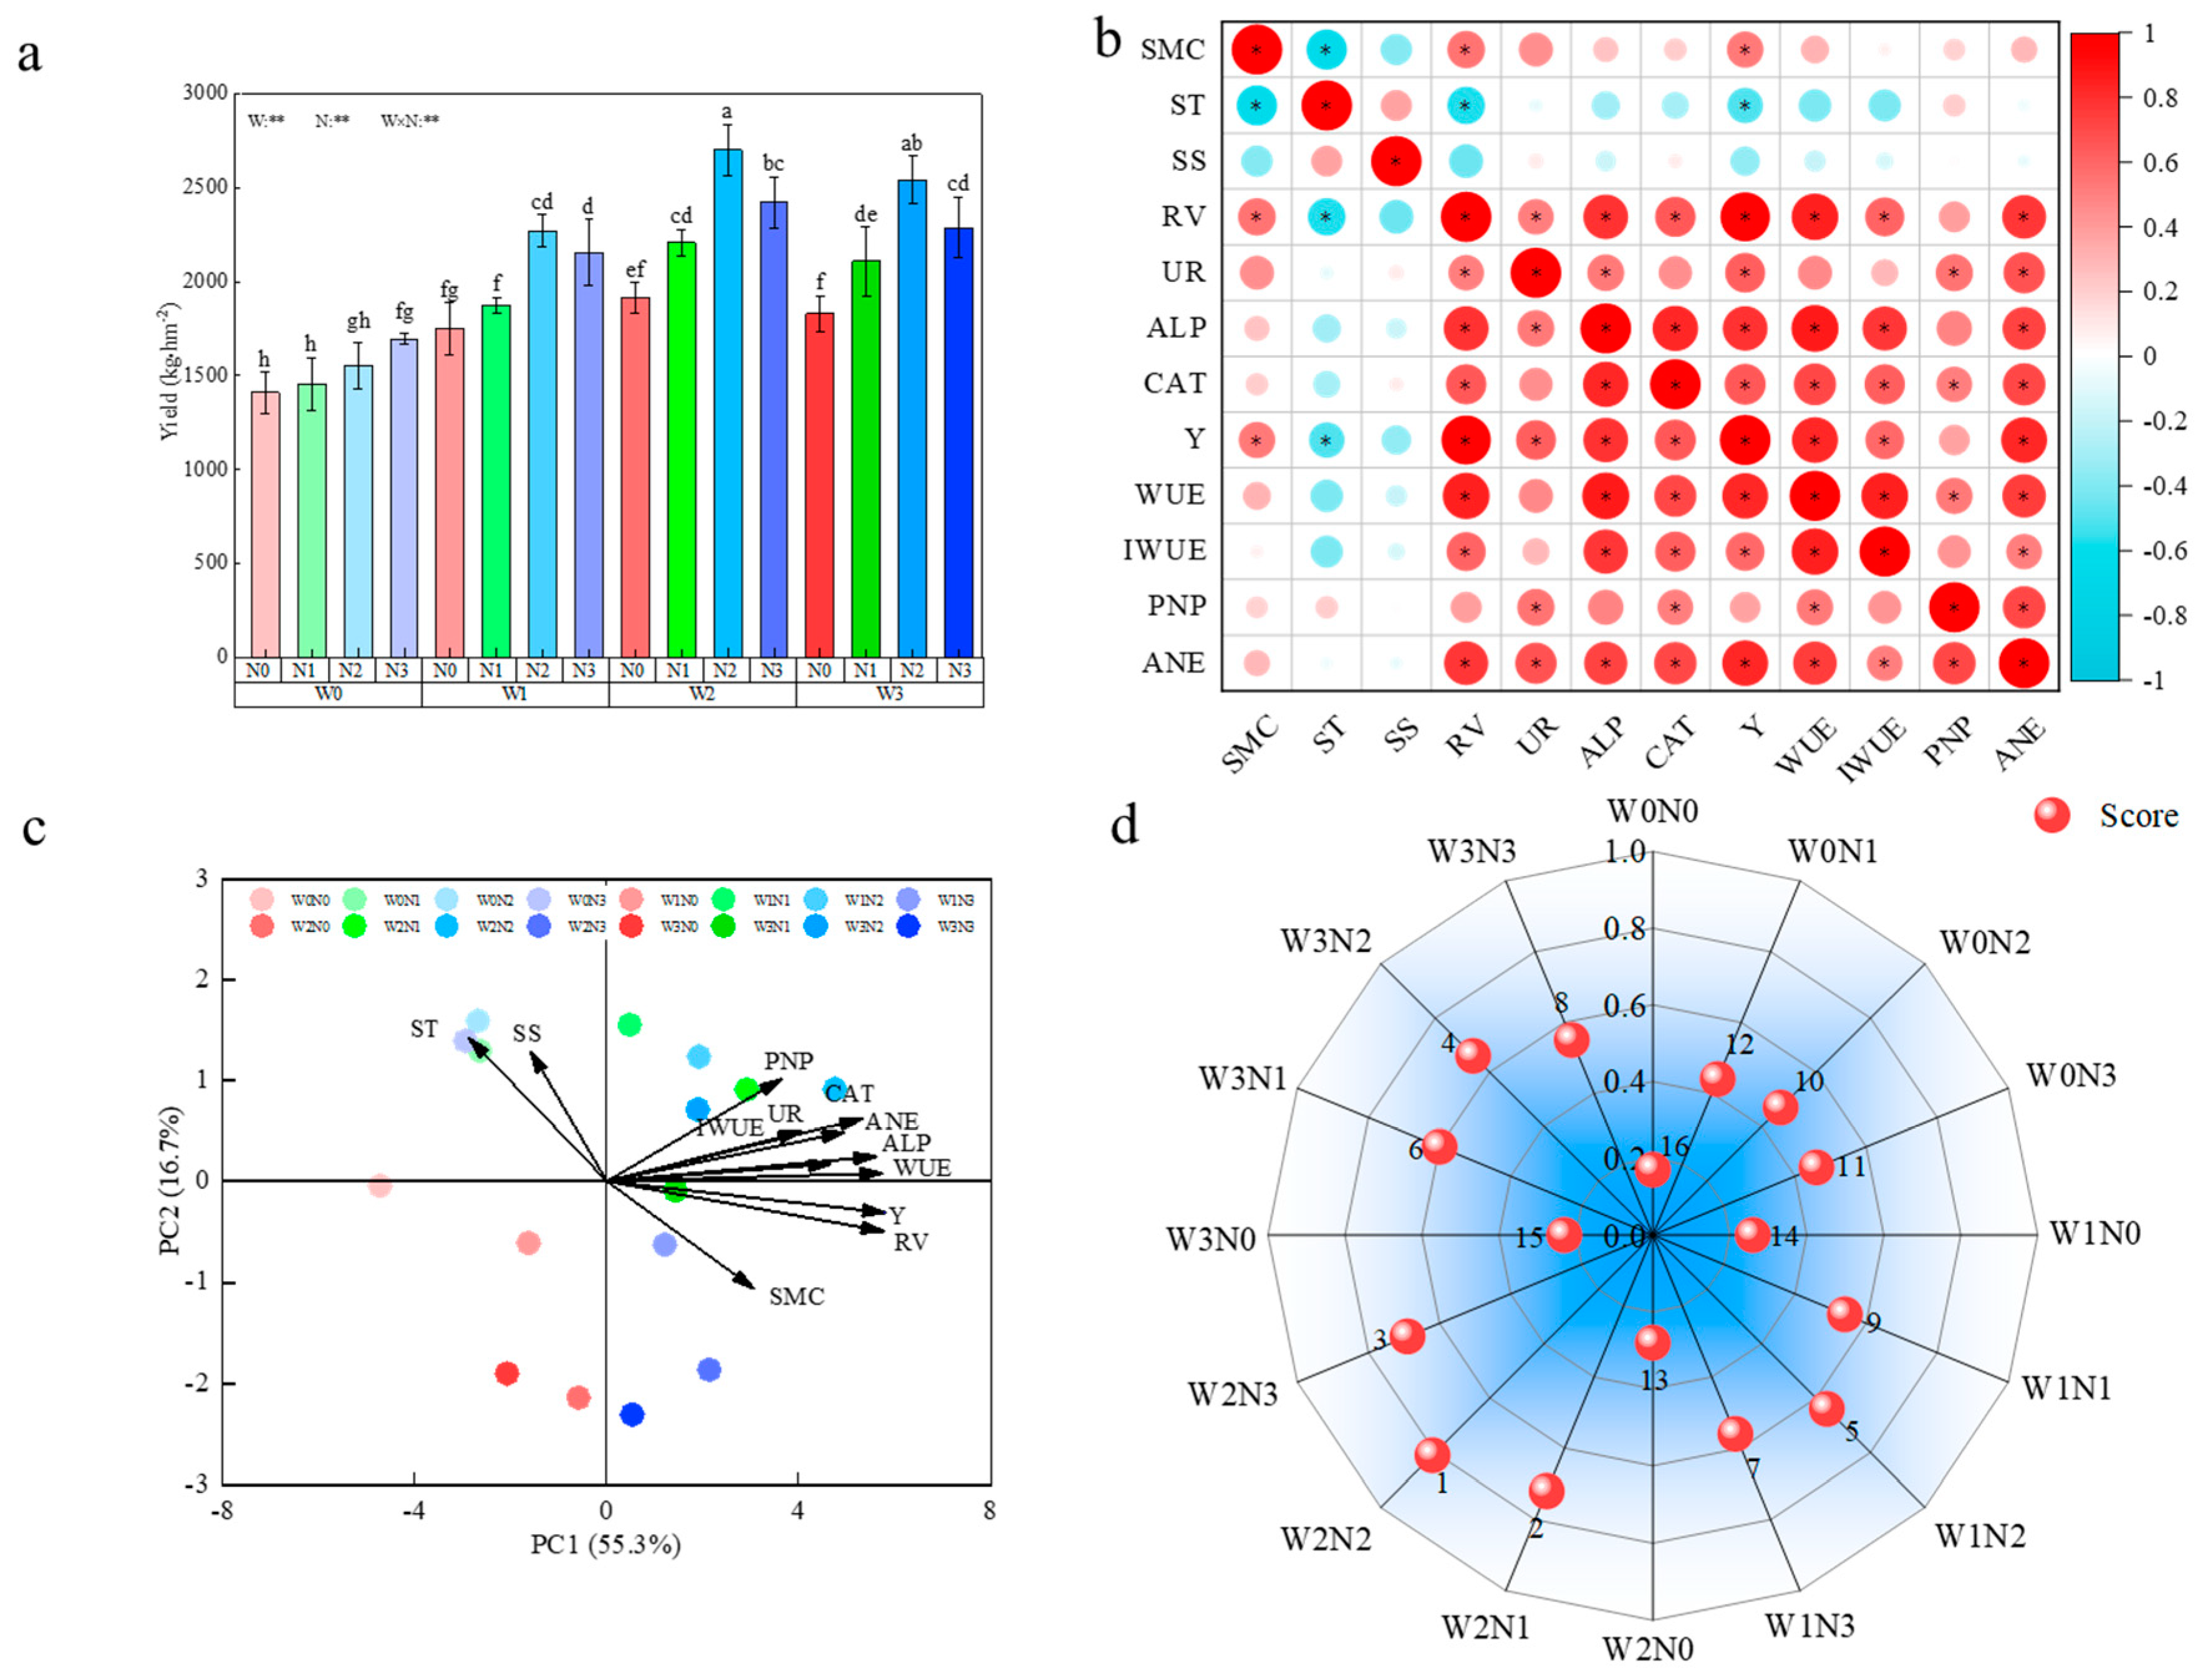
Both irrigation, nitrogen application, and their interaction significantly influenced Lycium barbarum yield (p < 0.05, Figure 8a). Under constant nitrogen application levels, Lycium barbarum yield exhibited a trend of increasing and then decreasing with the rise in irrigation water, peaking under the W2 condition. The yield in the W2 treatment increased by 35.67–42.86%, 9.23–12.50%, and 4.41–5.88% compared to W0, W1, and W3, respectively. Similarly, under the same irrigation level, yield first increased and then decreased with the increase in nitrogen application, reaching a peak under N2. The yield in the N2 treatment increased by 10.19–41.31%, 9.81–22.36%, and 6.79–11.48% compared to N0, N1, and N3, respectively. The highest yield of Lycium barbarum (2701.78 kg/hm2) was observed in the W2N2 treatment.

3.3.2. Water and Nitrogen Utilization Efficiency

Water and nitrogen, along with their interaction, had significant effects on Lycium barbarum water use efficiency (WUE), irrigation water use efficiency (GUE), nitrogen fertilizer bias productivity (NUE), and nitrogen agronomic efficiency (NAE) (p < 0.01, Table 2). At a constant irrigation level, with increasing nitrogen application, WUE initially increased and then decreased, with N2 treatment showing increases of 31.32–64.64%, 9.37–25.67%, and 8.67–21.23% compared to N0, N1, and N3, respectively. GUE followed a similar trend, increasing and then decreasing, with N2 showing increases of 33.37–43.82%, 5.45–18.79%, and 12.71–18.72%. NUE gradually decreased, being 31.26–60.20% and 58.63–119.47% higher in N1 compared to N2 and N3. NAE initially increased and then decreased, with increases of 19.91–57.21% and 9.22–33.74% under N2 treatment compared to N0, N1, and N3. Under the same nitrogen application levels, WUE, GUE, NUE, and NAE all showed a tendency to increase and then decrease with increasing irrigation, with the following order: W2 > W3 > W1 > W0.

3.4. Correlation Analysis and Comprehensive Evaluation

3.4.1. Correlation

The correlation analysis between Lycium barbarum yield, root vigor, and inter-root soil enzyme activity is indicated in Figure 8b. Except for soil temperature, Lycium barbarum yield was significantly correlated with all indicators (p < 0.05), showing an extremely significant correlation with root vigor and urease (p < 0.01). Root vigor exhibited strong correlations with all indicators, with the correlation coefficient with yield reaching as high as 0.9. Soil moisture content showed a high correlation with most indicators, except for soil temperature and salinity. Specifically, soil water content was positively correlated with all indicators, excluding soil temperature and salinity, and it was highly negatively correlated with soil temperature. Soil water content, temperature, and salinity were significantly interrelated. Inter-root soil urease activity was positively correlated with alkaline phosphatase and catalase, and these two enzymes also showed a positive correlation with each other. Water and nitrogen utilization efficiency was significantly and positively correlated with yield, root vigor, soil water content, urease, alkaline phosphatase, and catalase activities, and it was negatively correlated with soil temperature and salinity.

3.4.2. Comprehensive Evaluation

Fuzzy mathematical affiliation function values were used to assess the downscaling of soil water content, temperature, salinity, enzyme activity, root vigor, yield, and water and nitrogen use efficiency under different water and nitrogen regulation treatments (Figure 8c). The cumulative variance contribution of the first four principal components was 91.08%, indicating that these components effectively captured 91.08% of the original variables’ information, which could be used for further comprehensive evaluation (Figure 8d). The treatment with the highest comprehensive evaluation score is considered the most suitable for water–nitrogen regulation. The treatments ranked from highest to lowest based on the evaluation scores were: W2N2 > W2N1 > W2N3 > W3N2 > W1N2 > W3N1 > W1N3 > W3N3 > W1N1 > W0N2 > W0N3 > W0N1 > W2N0 > W1N0 > W3N0 > W0N0. The maximum affiliation function value of 0.81 was observed under the W2N2 treatment.

4. Discussion

4.1. Effect of Water and Nitrogen Synergistic Regulation on the Inter-Root Soil Hydrothermal Environment in Lycium barbarum

Soil hydrothermal environment is crucial to the growth and development of Lycium barbarum, and the adequacy of water and heat supply directly affects its growth process [22]. Water and nitrogen regulation are important factors affecting the inter-root hydrothermal environment of Lycium barbarum, and the appropriate irrigation volume and nitrogen application are the basis for realizing the optimal inter-root hydrothermal environment [23]. Soil temperature not only affects the growth and development of Lycium barbarum, but also influences the activities of microorganisms and related biochemical processes in the soil [24]. Zhang et al. [6] found that soil temperature at different depths was negatively correlated with soil water content. In this study, soil temperature exhibited clear seasonal variations, closely mirroring atmospheric temperature changes. Soil temperature was found to decrease with increasing irrigation volume, particularly in the 0–20 cm surface layer, where a significant negative correlation with irrigation volume was observed. These findings are consistent with those of Xia et al. [25]. Zhang et al. [26] also reported that larger irrigation volumes led to higher soil relative humidity. Additionally, the experiment showed that increased irrigation reduced soil temperature, with shallow soil temperatures being more sensitive to moisture and exhibiting greater fluctuations, while deep soil temperatures showed smaller changes. Nitrogen application had minimal effect on soil temperature, and the differences were not statistically significant (p > 0.05). This could be attributed to urea being a physiologically neutral fertilizer, where its dissolution in the soil is a physical process, and although the exothermic process of dissolution increases entropy, the influence is far smaller compared to atmospheric temperature changes [27].
Soil moisture is another critical factor affecting Lycium barbarum growth, as water balance influences physiological processes such as photosynthesis, respiration, and nutrient uptake. This study found that soil moisture content fluctuated under different water and nitrogen treatments, with similar patterns observed across all treatments. Soil moisture content in different soil depths followed a pattern of increasing, then decreasing, and eventually stabilizing, which was more pronounced with higher irrigation volumes. This trend is attributed to the significant positive correlation between soil water content and irrigation volume, as reported by He et al. [28]. Li et al. [29] further suggested that within a certain range, soil water content increases with the application of nitrogen, though the fluctuations are relatively minor. There is a clear interaction between soil temperature and soil water content. Gao et al. [30] found that changes in soil temperature affected the kinetic and potential energy of soil moisture, which in turn altered soil pore structure and surface tension, influencing soil water content. Under the combined influence of water and nitrogen regulation, the soil hydrothermal environment is predominantly affected by the amount of irrigation water. Nitrogen application has a comparatively smaller impact, with soil temperature and water content interacting and constraining each other.

4.2. Effect of Water and Nitrogen Synergistic Regulation on Soil Enzyme Activity in the Inter-Root Area of Lycium barbarum

The inter-root area of Lycium barbarum is the most influential zone of the root system’s impact on the soil environment, directly reflecting the root system’s biological activity and metabolic effects. Root secretions from Lycium barbarum can attract soil microorganisms such as bacteria and fungi, which then adsorb onto the inter-root soil, thereby making this environmental system more complex [31]. Soil enzymes, an essential component of soil biological activity, play a crucial role in nutrient cycling. They are involved in transforming substances within the soil, as well as in the release and fixation of nutrients, making soil enzyme activity a key indicator of microbial activity and soil fertility [32]. Urease, a specific enzyme responsible for hydrolyzing urea, produces ammonia, which serves as a direct source of nitrogen nutrition for plants. Urease activity thus reflects the nitrogen status of the soil and microbial activity [33]. In this study, urease activity exhibited a pattern of decreasing and then increasing over the reproductive period, with the highest activity observed during the spring growth period [34]. This is likely because Lycium barbarum has a high demand for soil nutrients during early growth, which promotes root secretion and microbial activity. Moreover, urease activity in the inter-root soil was found to be highly significantly correlated with nitrogen fertilizer application within a certain range, with urease activity increasing as nitrogen application rose [35]. This correlation can be attributed to urease’s direct involvement in nitrogen metabolism in the soil [36]. Previous studies have also demonstrated that urease activity is closely tied to microbial activity in the inter-root zone, with nitrogen application enhancing microbial populations in the soil, which in turn improves root development and secretion [37,38]. In this experiment, deficit-regulated irrigation under controlled nitrogen fertilization significantly improved the inter-root soil environment compared to conventional irrigation, promoting the growth of soil microorganisms and subsequently increasing urease activity.
Soil phosphatases, a class of hydrolytic enzymes, catalyze the mineralization of organic phosphorus compounds in the soil. Since plants primarily require inorganic phosphorus, phosphatases are essential for hydrolyzing organic phosphorus into forms that plants can use [32]. In this study, alkaline phosphatase activity followed a trend of decreasing and then increasing over the reproductive period, peaking during the spring growth phase. This pattern is likely due to the increase in phosphorus uptake by Lycium barbarum during early growth, which reduces the effective phosphorus content in the soil, leading to feedback regulation that stimulates phosphatase activity. Under varying nitrogen application treatments at the same moisture level, there was no significant difference in alkaline phosphatase activity, except when no nitrogen was applied. In the absence of nitrogen, phosphatase activity was significantly lower compared to nitrogen treatments, suggesting that nitrogen application does not strongly influence alkaline phosphatase activity. However, within a certain irrigation range, enzyme activity increased with higher irrigation volumes due to improvements in the soil’s hydrothermal environment, which facilitated the mineralization of organic phosphorus [39]. Soil peroxidase, another key enzyme, is important for predicting soil organic matter dynamics. It catalyzes the decomposition of hydrogen peroxide into water and oxygen, thereby mitigating the toxic effects of hydrogen peroxide in the soil [40]. In this study, catalase activity exhibited a pattern of increasing and then decreasing with either nitrogen application or varying irrigation volumes. This suggests that within certain limits, appropriate water and nitrogen regulation can enhance the soil environment. Nitrogen application may regulate soil pH, accelerating microbial reproduction, while increased irrigation can provide more hydrogen peroxide for redox reactions. However, excessive irrigation can reduce soil aeration and decrease reactive oxygen species, which negatively affects catalase activity [41].
Reasonable irrigation creates an optimal environment for the growth of Lycium barbarum, while excessive nitrogen application leads to a decline in soil pH and inhibits enzyme activities, ultimately reducing soil enzyme function. This finding is consistent with the research by Ma et al. [42]. Under the same nitrogen application rate, soil enzyme activity showed an initial increase followed by a decrease with the rise in irrigation volume. This trend can be explained by the fact that moderate irrigation helps maintain favorable soil moisture conditions, promoting root growth. Water serves as a crucial medium for enzyme-catalyzed reactions in the soil, and a balanced level of irrigation facilitates the interaction between enzymes and substrates. However, excessive water can compromise soil aeration, inhibiting microbial respiration and enzyme secretion. Additionally, too much water may dilute enzyme concentrations in the soil, further reducing enzyme activity, in line with the results of Jin et al. [43]. Therefore, enzyme activities in the soil around the root zone of Lycium barbarum are significantly influenced by appropriate irrigation and fertilization management practices.

4.3. Water-Fertilizer Integration Drip Irrigation for Lycium barbarum and Water-Nitrogen Synergistic Regulation Mode

Reasonable water and nitrogen regulation is essential for achieving high yields of Lycium barbarum. In the context of different growth stages, optimizing water and nitrogen fertilizer management not only improves the absorption of nutrients and water by the plant [44] but also enhances the yield and reduces environmental pollution [45]. Therefore, selecting an appropriate water and nitrogen regulation model is crucial for ensuring the sustainable development of Lycium barbarum cultivation, lowering production costs, improving economic returns, and minimizing environmental impact. This study demonstrated that a combination of W2 irrigation level (65–75% θFC) and N2 nitrogen fertilizer application rate (300 kg·hm−2) significantly promoted the growth of Lycium barbarum, improved its yield, and enhanced its quality. This result is particularly valuable for increasing yields in water-limited regions while also reducing production costs and environmental pollution.
Regarding irrigation management, the W2 irrigation level ensured that Lycium barbarum received sufficient water at various growth stages, especially during critical periods such as flowering and fruit expansion. This finding aligns with the study by Ma et al. [46], which concluded that adjusting irrigation frequency and amount according to the plant’s water demand can significantly enhance growth and yield. Furthermore, the W2 irrigation pattern effectively avoided water wastage and soil saturation associated with over-irrigation, supporting the recommendation by Singh and Lal [47] that rational irrigation practices improve water use efficiency and reduce environmental burdens. In terms of nitrogen fertilizer management, the appropriate application of N2 nitrogen fertilizer is crucial for optimizing Lycium barbarum growth. Excessive nitrogen application can lead to soil and water pollution [48], while insufficient nitrogen reduces the plant’s resistance and impairs its nutrient uptake [23]. The findings of this study indicate that proper nitrogen application not only enhances growth and yield but also improves nitrogen use efficiency, thereby mitigating environmental pollution. This supports the conclusion by Wang et al. [49], which highlighted that proper nitrogen management improves crop yields while minimizing environmental impact.
The interaction between water and nitrogen was also found to be crucial in regulating root vitality, yield, and water–nitrogen use efficiency. Similar to the findings of Zhou et al. [50], this study emphasized the importance of water–nitrogen coupling in optimizing resource use efficiency. Proper water–nitrogen coupling not only enhances the soil environment around the roots but also promotes the growth of soil microorganisms, thereby improving soil enzyme activity and overall soil health. This highlights the synergistic benefits of managing both water and nitrogen to enhance crop productivity and sustainability. While the results are generally consistent with existing literature, some discrepancies were noted. For instance, Hao et al. [51] reported soil acidification at high nitrogen fertilizer application rates, a finding that contrasts with our results.
In our study, appropriate water and nitrogen management effectively improved the root-zone soil environment of wolfberry, enhanced soil microbial activity, and increased soil enzyme activities. Liu et al. [45] showed that reducing nitrogen levels under optimal irrigation conditions can significantly improve the yield and economic returns of structural Lycium barbarum. Song et al. [52] found that in the Qaidam Basin, wolfberry yield was notably higher, with an irrigation volume of 158 m3·hm−2 and a nitrogen application rate of 276 kg·hm−2. He et al. [53] investigated the combined effects of water and fertilizer on grapes in arid regions and found that water and fertilizer promote mutual absorption, positively influencing both yield and quality. They also concluded that irrigation volume mainly affects yield, while fertilizer application has a greater impact on product quality. Our results indicate that the optimal water–nitrogen management model for Lycium barbarum cultivation involves an irrigation rate of 65–75% of field capacity (W2) combined with a nitrogen application rate of 300 kg·hm−2 (N2). This synergistic approach significantly enhanced both the yield and quality of wolfberry and improved the soil environment around the root zone, particularly boosting soil enzyme activities. We recommend adopting this integrated water–nitrogen management strategy in Lycium barbarum cultivation to improve the efficiency and sustainability of agricultural production.
This study highlights the positive effects of optimized water and nitrogen management on drip irrigation Lycium barbarum cultivation, but it also has some limitations. (1) The research was based on a single crop season without considering long-term effects or seasonal variations. Future studies should expand to multiple seasons and diverse environmental conditions to assess the broader applicability of the results. (2) The study lacks an economic analysis, and future research should include evaluations of economic benefits to provide a more comprehensive foundation for practical applications. (3) Studies have been conducted that indicate that how irrigation is applied is also important for sustainable agriculture, depending on the depth and location of the irrigation system. Lycium barbarum is a shallow-rooted crop and is set to irrigate at a shallow depth, and it is recommended that for crops with deeper roots, consideration be given to placing the irrigation system deeper to minimize evaporation.

5. Conclusions

(1) Optimized water and nitrogen management significantly improved the rhizosphere environment and productivity of drip-irrigated Lycium barbarum. Soil water content and temperature initially increased, then decreased with the growing season and soil depth, with minimal temperature fluctuation observed under W2. Soil salinity decreased with depth, reaching the lowest level under W3N0 (189.9 μS/cm).
(2) Water-nitrogen interactions had a significant impact on soil enzyme activities. Urease activity decreased initially, then increased, peaking during the spring shoot growth period. Alkaline phosphatase and catalase activities followed a similar trend, with the highest increases (20–86% and 21–218%, respectively) observed under the W2N2 treatment.
(3) Soil hydrothermal-salinity conditions, influenced by water–nitrogen management, significantly impacted Lycium barbarum yield. Based on these findings, a combination of W2 irrigation (65–75% θFC) and N2 nitrogen application (300 kg·hm−2) is recommended to optimize both yield and quality.

Author Contributions

Conceptualization, Y.W. (Yanbiao Wang) and Y.W. (Yayu Wang); methodology, Y.M.; software, H.L.; validation, Y.M., Y.W. (Yanbiao Wang) and H.L.; formal analysis, G.Q.; investigation, J.W.; resources, J.C.; data curation, R.Z.; writing—original draft preparation, Y.M.; writing—review and editing, Y.W. (Yayu Wang); visualization, M.Y.; supervision, Y.K.; project administration, Y.M.; funding acquisition, G.Q. All authors have read and agreed to the published version of the manuscript.

Funding

The study was funded by the Key Research and Development Project of Gansu Province, China (22YF7NA110); National Natural Science Regional Foundation Project, China (51969003, 52069001 and 52269009); Funds for Youth Mentor of Gansu Agricultural University (GAU-QDFC-2023-12); Fuxi Youth Talent Training Program of Gansu Agricultural University (Gaufx-05Y11); the Discipline Team Construction Project of Gansu Agricultural University (GAU-XKTD-2022-09).

Data Availability Statement

Data are contained within the article.

Acknowledgments

Thanks to the Agricultural Smart Water Saving Technology Innovation Center of Gansu Province; the Jingtai Wolfberry Science and Technology Academy of Gansu Province; and the Harmless Wolfberry Cultivation Engineering Research Center of Gansu Province for their selfless help in this study. Thanks to the editors and reviewers for your valuable and constructive comments.

Conflicts of Interest

The authors declare no conflicts of interest.

References

  1. Shun, B.L. Issues and countermeasures regarding water resources. Hydro-Electr. Technol. 2023, 6, 66–68. [Google Scholar]
  2. Iordan, N.; Boian, I.; Bulmez, A.; Căldare, I. Potable water: A potential national security issue in the near future. J. Environ. Res. 2024, 42, 250–265. [Google Scholar]
  3. Chen, C.H.; Wang, Y.; Zhang, H.; Bai, X.G. Evaluation of agricultural water use efficiency, economic development, and ecological environment coupling in the Yellow River Basin. China Rural. Water Hydropower 2024, 6, 114–123. Available online: https://link.cnki.net/urlid/42.1419.TV.20240315.1847.042 (accessed on 27 December 2024).
  4. 2023 China Water Resources Bulletin released. Water Resour. Dev. Manag. 2024, 10, 2. Available online: https://www.chinawater.com.cn/yw/202406/t20240614_1052624.html (accessed on 27 December 2024).
  5. Kang, S.Z. Implementing the national water-saving action plan and promoting the water-efficient and green high-efficiency water-saving development of agriculture. China Water Conserv. 2019, 13, 1–6. [Google Scholar]
  6. Zhang, J.B.; Xiong, H.G.; Li, B.F.; Long, T. Variation law of soil moisture and temperature in arid regions and their inter-relationship. Agric. Res. Arid Areas 2013, 31, 127–133. [Google Scholar]
  7. Yuan, M. Study on Soil Temperature and Moisture Characteristics in Karst Areas. Master’s Thesis, Yunnan Normal University, Kunming, China, 2015, unpublished. [Google Scholar]
  8. Ma, F.Y.; Liu, Y.; Cui, J.; Fan, H.; Lu, Y.; Li, M.R. Advances in research on water and fertilizer integration. Xinjiang Agric. Sci. 2019, 56, 183. [Google Scholar]
  9. Wu, Y.; Yan, S.; Fan, J.; Zhang, F.; Zhao, W.; Zheng, J.; Guo, J.; Xiang, Y.; Wu, L. Combined effects of irrigation level and fertilization practice on yield, economic benefit, and water-nitrogen use efficiency of drip-irrigated greenhouse tomato. Agric. Water Manag. 2022, 262, 107401. [Google Scholar] [CrossRef]
  10. Liu, H. Research on water and fertilizer management technology during the garlic growing period. Seed Sci. Technol. 2024, 42, 91–93. [Google Scholar]
  11. Xu, S.R.; Zhang, E.H.; Ma, R.L.; Wang, Q.; Liu, Q.L.; Wu, R. Effects of drought stress and rehydration on the hy-drological characteristics of drought-resistant goji berries. Chin. J. Eco-Agric. 2017, 25, 1190–1197. [Google Scholar]
  12. Zhang, K. The Longevity Formulas not Passed Down in Traditional Chinese Medicine Families: 300 Health-Maintenance Tips for the Elderly; Gold Wall Press: Beijing, China, 2014. [Google Scholar]
  13. Jiang, Z.W.; Yue, H.W.; Chen, J.; Liu, H. Effects of different water control treatments on the growth and water-use efficiency of goji berries. J. Anhui Agric. Sci. 2023, 51, 213. [Google Scholar]
  14. Yin, J.; Ma, Z.; Yang, Y.; Du, B.; Sun, F.; Yang, Z. Water and nitrogen coupling regulation on the balance of soil nutrients–microbial biomass and its effect on the yield of wolfberry (Lycium barbarum L.). Plants 2023, 12, 2768. [Google Scholar] [CrossRef]
  15. Li, H.Q.; Yao, R.J.; Yang, J.S.; Wang, X.P.; Zheng, F.L.; Chen, Q.; Zhang, X. Mechanisms of salinization effects on nitrogen transformation in farmland soils and methods for efficiency enhancement. Yingyong Shengtai Xuebao 2020, 31, 3915–3924. [Google Scholar]
  16. Tian, R.; Qi, G.; Kang, Y.; Jia, Q.; Wang, J.; Xiao, F.; Gao, Y.; Wang, C.; Lu, Q.; Chen, Q. Effects of irrigation and nitrogen application on soil water and nitrogen distribution and water-nitrogen utilization in wolfberry in the Yellow River Irrigation Region of Gansu Province, China. Front. Plant Sci. 2023, 14, 1309219. [Google Scholar] [CrossRef] [PubMed]
  17. Gao, Y.; Qi, G.; Ma, Y.; Yin, M.; Wang, J.; Wang, C.; Tian, R.; Xiao, F.; Lu, Q.; Wang, J. Regulation effects of water and nitrogen on yield, water, and nitrogen use efficiency of wolfberry. J. Arid Land 2024, 16, 29–45. [Google Scholar] [CrossRef]
  18. Gao, Y.; Wang, J.; Ma, Y.; Yin, M.; Jia, Q.; Tian, R.; Kang, Y.; Qi, G.; Wang, C.; Jiang, Y. Appropriate water and nitrogen regulation improves the production of wolfberry (Lycium barbar L.). Agronomy 2024, 14, 607. [Google Scholar] [CrossRef]
  19. Saltveit, M.E. Effect of ethylene on the quality of fresh fruits and vegetables. Postharvest Biol. Technol. 1999, 15, 279–292. [Google Scholar] [CrossRef]
  20. Tang, Z.X. Effects of irrigation and nitrogen regulation on nutrient enrichment of Bromus inermis in Hexi Corridor. Master’s Thesis, Gansu Agricultural University, Lanzhou, China, 2022. [Google Scholar] [CrossRef]
  21. Li, X.M.; Qi, G.P.; Kang, Y.X.; Wang, J.H.; Cai, L.H.; Zhao, M. Lycium barbarum intercropping with Onobrychis viciaefolia on soil water, soil salt transport, and yield of L. barbarum in different salinized soils. Bull. Soil Water Conserv. 2020, 40, 51–57. [Google Scholar]
  22. Gao, Z.D. Effects of different irrigation quotas on soil thermal-hydrological environment and crop growth characteristics. Rural. Pract. Technol. 2023, 8, 79–80. [Google Scholar]
  23. Gao, J.H.; Li, C.; Zhao, M.S.; Feng, X.P.; Kong, J.L.; Xue, H.L.; Meng, X.K.; Kang, H.M. Effects of water-nitrogen interaction on the growth, photosynthetic characteristics, and yield of industrial hemp. Trop. Crops 2021, 42, 2324–2333. [Google Scholar]
  24. Lü, M.F.; Ma, X.C.; Cai, T.; Jia, Z.K. Effects of biochar application on soil thermal-hydrological environment and soil res-piration in winter wheat fields. J. Arid Land Agric. Res. 2022, 40, 197–206. [Google Scholar]
  25. Xia, Z.Q.; Lu, H.D. Research progress on the regulation of soil temperature on root-zone environment and maize root-shoot growth. Corn Sci. 2020, 28, 99–104. [Google Scholar]
  26. Zhang, J.; Liu, H.G.; He, X.L.; Liu, B.; Ye, J.W.; Gong, P. Effects of drip irrigation on field relative humidity, soil temperature, and yield in dwarf jujube orchards under high-density planting. Irrig. Drain. J. 2016, 35, 78–84. [Google Scholar]
  27. Geng, J.B.; Yang, X.Y.; Nie, S.J.; Zhang, J.Y.; He, Y.; Yang, H.C.; Gao, X. Research progress on the application of controlled-release nitrogen fertilizers in wheat-maize rotation systems in China. Soil Bull. 2021, 52, 722–727. [Google Scholar]
  28. He, R.; Tong, C.F.; Wang, J.; Qin, Z.Y.; Zhen, Z.X.; Guo, S.H.; Wang, H.; Li, X.L. Effects of water-nitrogen regulation on sunflower growth, water-fertilizer use efficiency, and soil water-salt distribution. Irrig. Drain. J. 2023, 42, 73–81. [Google Scholar]
  29. Li, J.R.; Xie, J.H.; Li, L.L.; Wang, L.L.; Zhou, Y.J.; Wang, J.B.; Chen, Q. Effects of tillage measures and nitrogen application levels on dryland maize yield and soil water-nitrogen utilization efficiency. Northwest Agric. J. 2021, 30, 1000–1009. [Google Scholar]
  30. Gao, H.B.; Shao, M.A. Effects of temperature on basic parameters of soil water movement. Adv. Water Sci. 2011, 22, 484–494. [Google Scholar]
  31. Li, Y.H.; Zhang, X.Q.; Lu, Z.Y.; Cheng, Y.C.; Zhang, D.J.; Liu, Z.Y.; Li, F. Effects of different tillage practices on soil enzyme activity in oilseed rape fields in the northern agro-pastoral zone. North. Agric. J. 2019, 47, 33–39. [Google Scholar]
  32. Dick, W.A.; Cheng, L.; Wang, P. Soil acid and alkaline phosphatase activity as pH adjustment indicators. Soil Biol. Biochem. 2000, 32, 1915–1919. [Google Scholar] [CrossRef]
  33. Guo, T.C.; Song, X.; Ma, D.Y.; Zha, F.N.; Yue, Y.J.; Zhang, Y.; Li, Y.Z. Effects of nitrogen nutrition levels on root-zone microorganisms and soil enzyme activity in wheat. Soil Water Conserv. J. 2006, 3, 129–131. [Google Scholar]
  34. Zhang, H.J. Effects of Water-Nitrogen Regulation on the Growth and Soil Microenvironment of Wolfberry Under Trellis Drip Irrigation. Doctoral Dissertation, Ningxia University, Yinchuan, China, 2021, unpublished. [Google Scholar]
  35. Li, S.Y.; Sun, Y.L.; Zhao, J.W.; Zhao, J.W.; Liu, X.S.; Zhao, J.T.; Ma, C.H.; Zhang, Q.B. Effects of nitrogen application on microbial population, enzyme activity, and hay yield in the rhizosphere soil of alfalfa. Chin. Grassl. J. 2022, 44, 113–120. [Google Scholar]
  36. Elsoury, H.A.; Shouman, A.E.; Abdelrazek, S.; Elkony, H.M. Soil enzymes and microbial activity as influenced by tillage and fertilization in wheat production. Egypt. J. Soil Sci. 2015, 55, 53–65. [Google Scholar] [CrossRef]
  37. Mooshammer, M.; Wanek, W.; Hämmerle, I.; Fuchslueger, L.; Hofhansl, F.; Knoltsch, A.; Schnecker, J.; Takriti, M.; Watzka, M.; Wild, B.; et al. Adjustment of microbial nitrogen use efficiency to carbon:nitrogen imbalances regulates soil nitrogen cycling. Nat. Commun. 2014, 5, 3694. [Google Scholar] [CrossRef] [PubMed]
  38. Zhang, J.; Ai, Z.; Liang, C.; Wang, G.; Xue, S. Response of soil microbial communities and nitrogen thresholds of Bothriochloa is-chaemum to short-term nitrogen addition on the Loess Plateau. Geoderma 2017, 308, 112–119. [Google Scholar] [CrossRef]
  39. Ma, X.X.; Wang, L.L.; Li, Q.H.; Li, H.; Zhang, S.L.; Sun, B.H.; Yang, X.Y. Effects of long-term fertilization on soil microbial biomass carbon and nitrogen and enzyme activities during the maize growth period. Acta Ecol. Sin. 2012, 32, 5502–5511. [Google Scholar]
  40. Guo, T.C.; Song, X.; Ma, D.Y.; Wang, Y.H.; Xie, Y.X.; Yue, Y.J.; Zha, F.N. Effects of nitrogen application rates on enzyme activity in the rhizosphere soil of winter wheat. Appl. Ecol. J. 2008, 1, 110–114. [Google Scholar]
  41. Tian, L.; Shi, W. Soil peroxidase regulates organic matter decomposition through improving the accessibility of reducing sugars and amino acids. Biol. Fertil. Soils 2014, 50, 785–794. [Google Scholar] [CrossRef]
  42. Ma, S.; Huo, K.; Zhang, D.; Zhang, J.; Zhang, J.H.; Chai, X.R.; Wang, H.Z. Effects of maize straw return combined with nitrogen on soil enzyme activity and nitrogen fertilizer use efficiency in western dryland wheat fields of Henan Province. Acta Prataculturae Sin. 2023, 32, 120–133. [Google Scholar]
  43. Jin, C.; Li, H.; Qu, G.; Wu, F.H.; Liu, X.X.; Liu, Y.; Kunag, L.R.; Cheng, Y.H.; Chen, X.P.; Li, J.Y.; et al. Developments in the research of soil microbial metabolic patterns and their environmental impacts. Environ. Chem. 2023, 42, 3188–3198. [Google Scholar]
  44. Zhang, J.; Li, G.; Yuan, J.Y.; Yan, L.J.; Wei, X.X.; Liu, S.N. Effects of water-nitrogen regulation on soil and leaf nutrient content in rainfed spring wheat. Arid Zone Res. 2021, 38, 89–98. [Google Scholar]
  45. Liu, P.Z.; Li, M.H.; Song, Y.C.; Yang, D.; Gao, X.D.; Ren, X.L.; Chen, X.L. Effects of drip irrigation and water-fertilizer integration on goji berry yield, water-nitrogen utilization, and economic benefits. J. Plant Nutr. Fertil. 2021, 27, 1820–1828. [Google Scholar]
  46. Ma, Z.; Yin, J.; Yang, Y.; Sun, F.; Yang, Z. Effect of water and nitrogen coupling regulation on the growth, physiology, yield, and quality attributes and comprehensive evaluation of wolfberry (Lycium barbarum L.). Front. Plant Sci. 2023, 14, 1130109. [Google Scholar] [CrossRef]
  47. Singh, G.; Lal, K. Bio-drainage for management of waterlogging and soil salinity. Agric. Water Manag. 2014, 145, 23–32. [Google Scholar] [CrossRef]
  48. Liang, X.; An, W.; Li, Y.; Wang, Y.; Su, S. Effects of different nitrogen application rates on root growth and distribution of fine root length across diameter classes of wolfberry (Lycium barbarum L.). Forests 2023, 14, 2317. [Google Scholar] [CrossRef]
  49. Wang, C.; Qi, G.; Ma, Y.; Yin, M.; Wang, J.; Kang, Y.; Jia, Q.; Gao, Y.; Tian, R.; Zhang, R. Effects of water and nitrogen control on the growth physiology, yields, and economic benefits of Lycium barbarum plants in a Lycium barbarum + alfalfa system. Plants 2024, 13, 1095. [Google Scholar] [CrossRef] [PubMed]
  50. Zhou, Y.; Gao, X.; Wang, J.; Robinson, B.H.; Zhao, X. Water-use patterns of Chinese wolfberry (Lycium barbar L. ) Tibet. Plateau. Agric. Water Manag. 2021, 255, 107010. [Google Scholar] [CrossRef]
  51. Hao, T.; Zhu, Q.; Zeng, M.; Shen, J.; Shi, X.; Liu, X.; Zhang, F.; de Vries, W. Impacts of nitrogen fertilizer type and application rate on soil acidification rate under a wheat-maize double cropping system. J. Environ. Manag. 2020, 270, 110888. [Google Scholar] [CrossRef]
  52. Song, Y.; Chen, X.; Ren, X.; Gao, X. Effects of deficit irrigation and reduced nitrogen fertilization on the growth and yield of wolfberry. Northwest Agric. J. 2019, 28, 1666–1673. [Google Scholar]
  53. He, J. Study on the Coupled Effects of Drip Irrigation and Fertilization on Grape Production in Extremely Arid Regions. Master’s Thesis, Shihezi University, Shihezi, China, 2013. [Google Scholar]
Figure 1. Experiment area location and precipitation and temperature distribution.
Agronomy 15 00073 g001
Figure 2. Variation of inter-root soil water content in Lycium barbarum under different water and nitrogen treatments.
Agronomy 15 00073 g002
Figure 3. Variation of inter-root soil temperature in Lycium barbarum under different water and nitrogen treatments. Note: Different lowercase letters indicate that there is a significant difference between different nitrogen application rates under the same irrigation amount (p < 0.05). W—water treatment; N—nitrogen application treatment; W × N—interaction. In the analysis of variance, * indicated that the correlation reached a significant level (p < 0.05), and ns indicated that the correlation was not significant (p > 0.05).
Agronomy 15 00073 g003
Figure 4. Variation of inter-root soil salinity in Lycium barbarum under different water and nitrogen treatments.
Agronomy 15 00073 g004
Figure 5. Variation of inter-root soil urease activity in Lycium barbarum under different water and nitrogen treatments. Note: Different lowercase letters indicate that there is a significant difference between different nitrogen application rates under the same irrigation amount (p < 0.05). W—water treatment; N—nitrogen application treatment; W × N—interaction. In the analysis of variance, * and ** indicated that the correlation reached a significant level (p < 0.05) and a very significant level (p < 0.01), respectively.
Agronomy 15 00073 g005
Figure 6. Variation of inter-root soil alkaline phosphatase activity in Lycium barbarum under different water and nitrogen treatments. Note: Different lowercase letters indicate that there is a significant difference between different nitrogen application rates under the same irrigation amount (p < 0.05). W—water treatment; N—nitrogen application treatment; W × N—interaction. In the analysis of variance, * and ** indicated that the correlation reached a significant level (p < 0.05) and a very significant level (p < 0.01), respectively.
Agronomy 15 00073 g006
Figure 7. Variation of inter-root soil catalase activity in Lycium barbarum under different water and nitrogen treatments. Note: Different lowercase letters indicate that there is a significant difference between different nitrogen application rates under the same irrigation amount (p < 0.05). W—water treatment; N—nitrogen application treatment; W × N—interaction. In the analysis of variance, * and ** indicated that the correlation reached a significant level (p < 0.05) and a very significant level (p < 0.01), respectively.
Agronomy 15 00073 g007
Figure 8. Variation of yield and economic efficiency in Lycium barbarum under different water nitrogen treatments. Note: (a) shows the variation of Lycium barbarum yield between different water and nitrogen treatments; (b) shows the correlation analysis between indicators under different water and nitrogen regulation; (c) shows the eigenvalue and variance contribution ratio of principal component analysis between different treatments; (d) shows the comprehensive scores of different water and nitrogen treatments. Where different lowercase letters indicate that there is a significant difference between different nitrogen application rates under the same irrigation amount (p < 0.05). W—water treatment; N—nitrogen application treatment; W × N—interaction. In the analysis of variance, * and ** indicated that the correlation reached a significant level (p < 0.05) and a very significant level (p < 0.01), respectively.
Agronomy 15 00073 g008
Table 1. Experimental design.
TreatmentWater Regulation
(%)
Nitrogen Application Level
(kg·hm−2)
W0N0Severe water deficit (45~55% θFC)(W0)No Nitrogen (0)N0
W0N1Low Nitrogen (150)N1
W0N2Medium Nitrogen (300)N2
W0N3High Nitrogen (450)N3
W1N0Moderate water deficit
(55~65% θFC)
(W1)No Nitrogen (0)N0
W1N1Low Nitrogen (150)N1
W1N2Medium Nitrogen (300)N2
W1N3High Nitrogen (450)N3
W2N0Mild water deficit
(65~75% θFC)
(W2)No Nitrogen (0)N0
W2N1Low Nitrogen (150)N1
W2N2Medium Nitrogen (300)N2
W2N3High Nitrogen (450)N3
W3N0Fully irrigated (75~85% θFC)(W3)No Nitrogen (0)N0
W3N1Low Nitrogen (150)N1
W3N2Medium Nitrogen (300)N2
W3N3High Nitrogen (450)N3
Table 2. Variation of water nitrogen utilization efficiency in Lycium barbarum under different water nitrogen treatments.
TreatmentWater Use Efficiency
(kg·m−3)
Irrigation Water Utilization Efficiency (kg·m−3)Nitrogen Fertilizer Biased Productivity
(kg·kg−1)
Nitrogen Fertilizer Agronomic Efficiency (kg·kg−1)
W0N04.58600
W0N14.996.839.690.3
W0N24.796.145.180.48
W0N34.656.093.770.64
W1N05.638.1900
W1N16.699.112.510.84
W1N27.459.227.571.74
W1N36.588.844.790.9
W2N06.188.2100
W2N16.869.0214.721.97
W2N27.428.949.012.63
W2N36.77.065.391.14
W3N05.51700
W3N16.627.5814.061.86
W3N26.87.858.472.36
W3N35.417.265.091.02
Disclaimer/Publisher’s Note: The statements, opinions and data contained in all publications are solely those of the individual author(s) and contributor(s) and not of MDPI and/or the editor(s). MDPI and/or the editor(s) disclaim responsibility for any injury to people or property resulting from any ideas, methods, instructions or products referred to in the content.