
Design and Experiment of Orchard Air-Assisted Sprayer with Airflow Graded Control

 , ,
, ,  ,
,
Abstract
1. Introduction
2. Materials and Methods
2.1. Structure and Principle
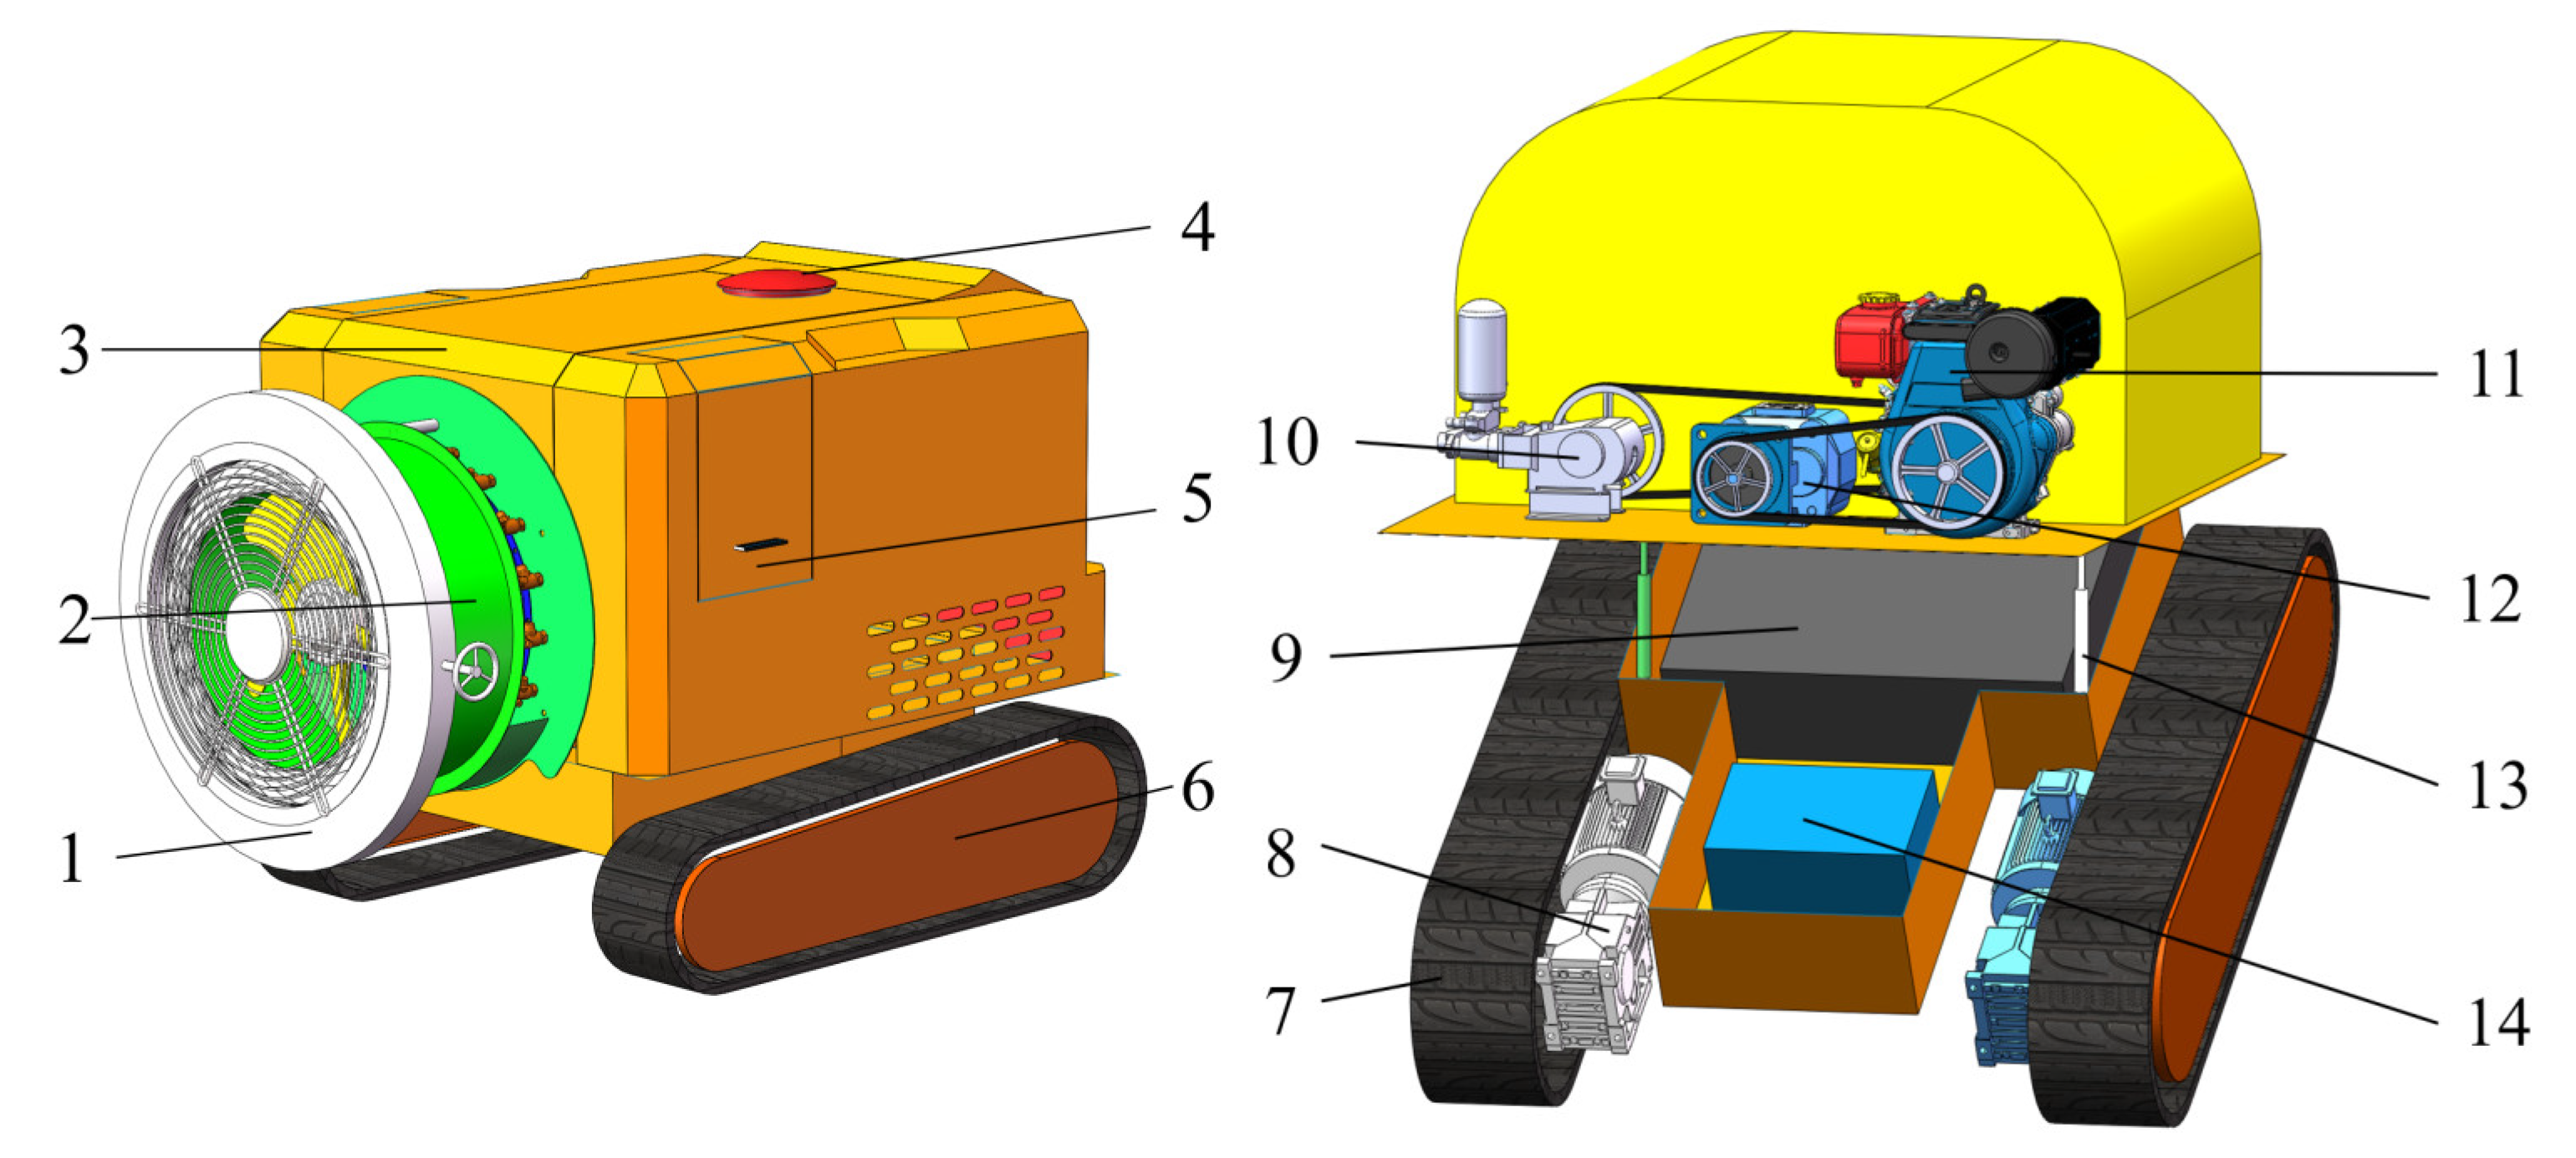
2.1.1. Machine Structure and Principle
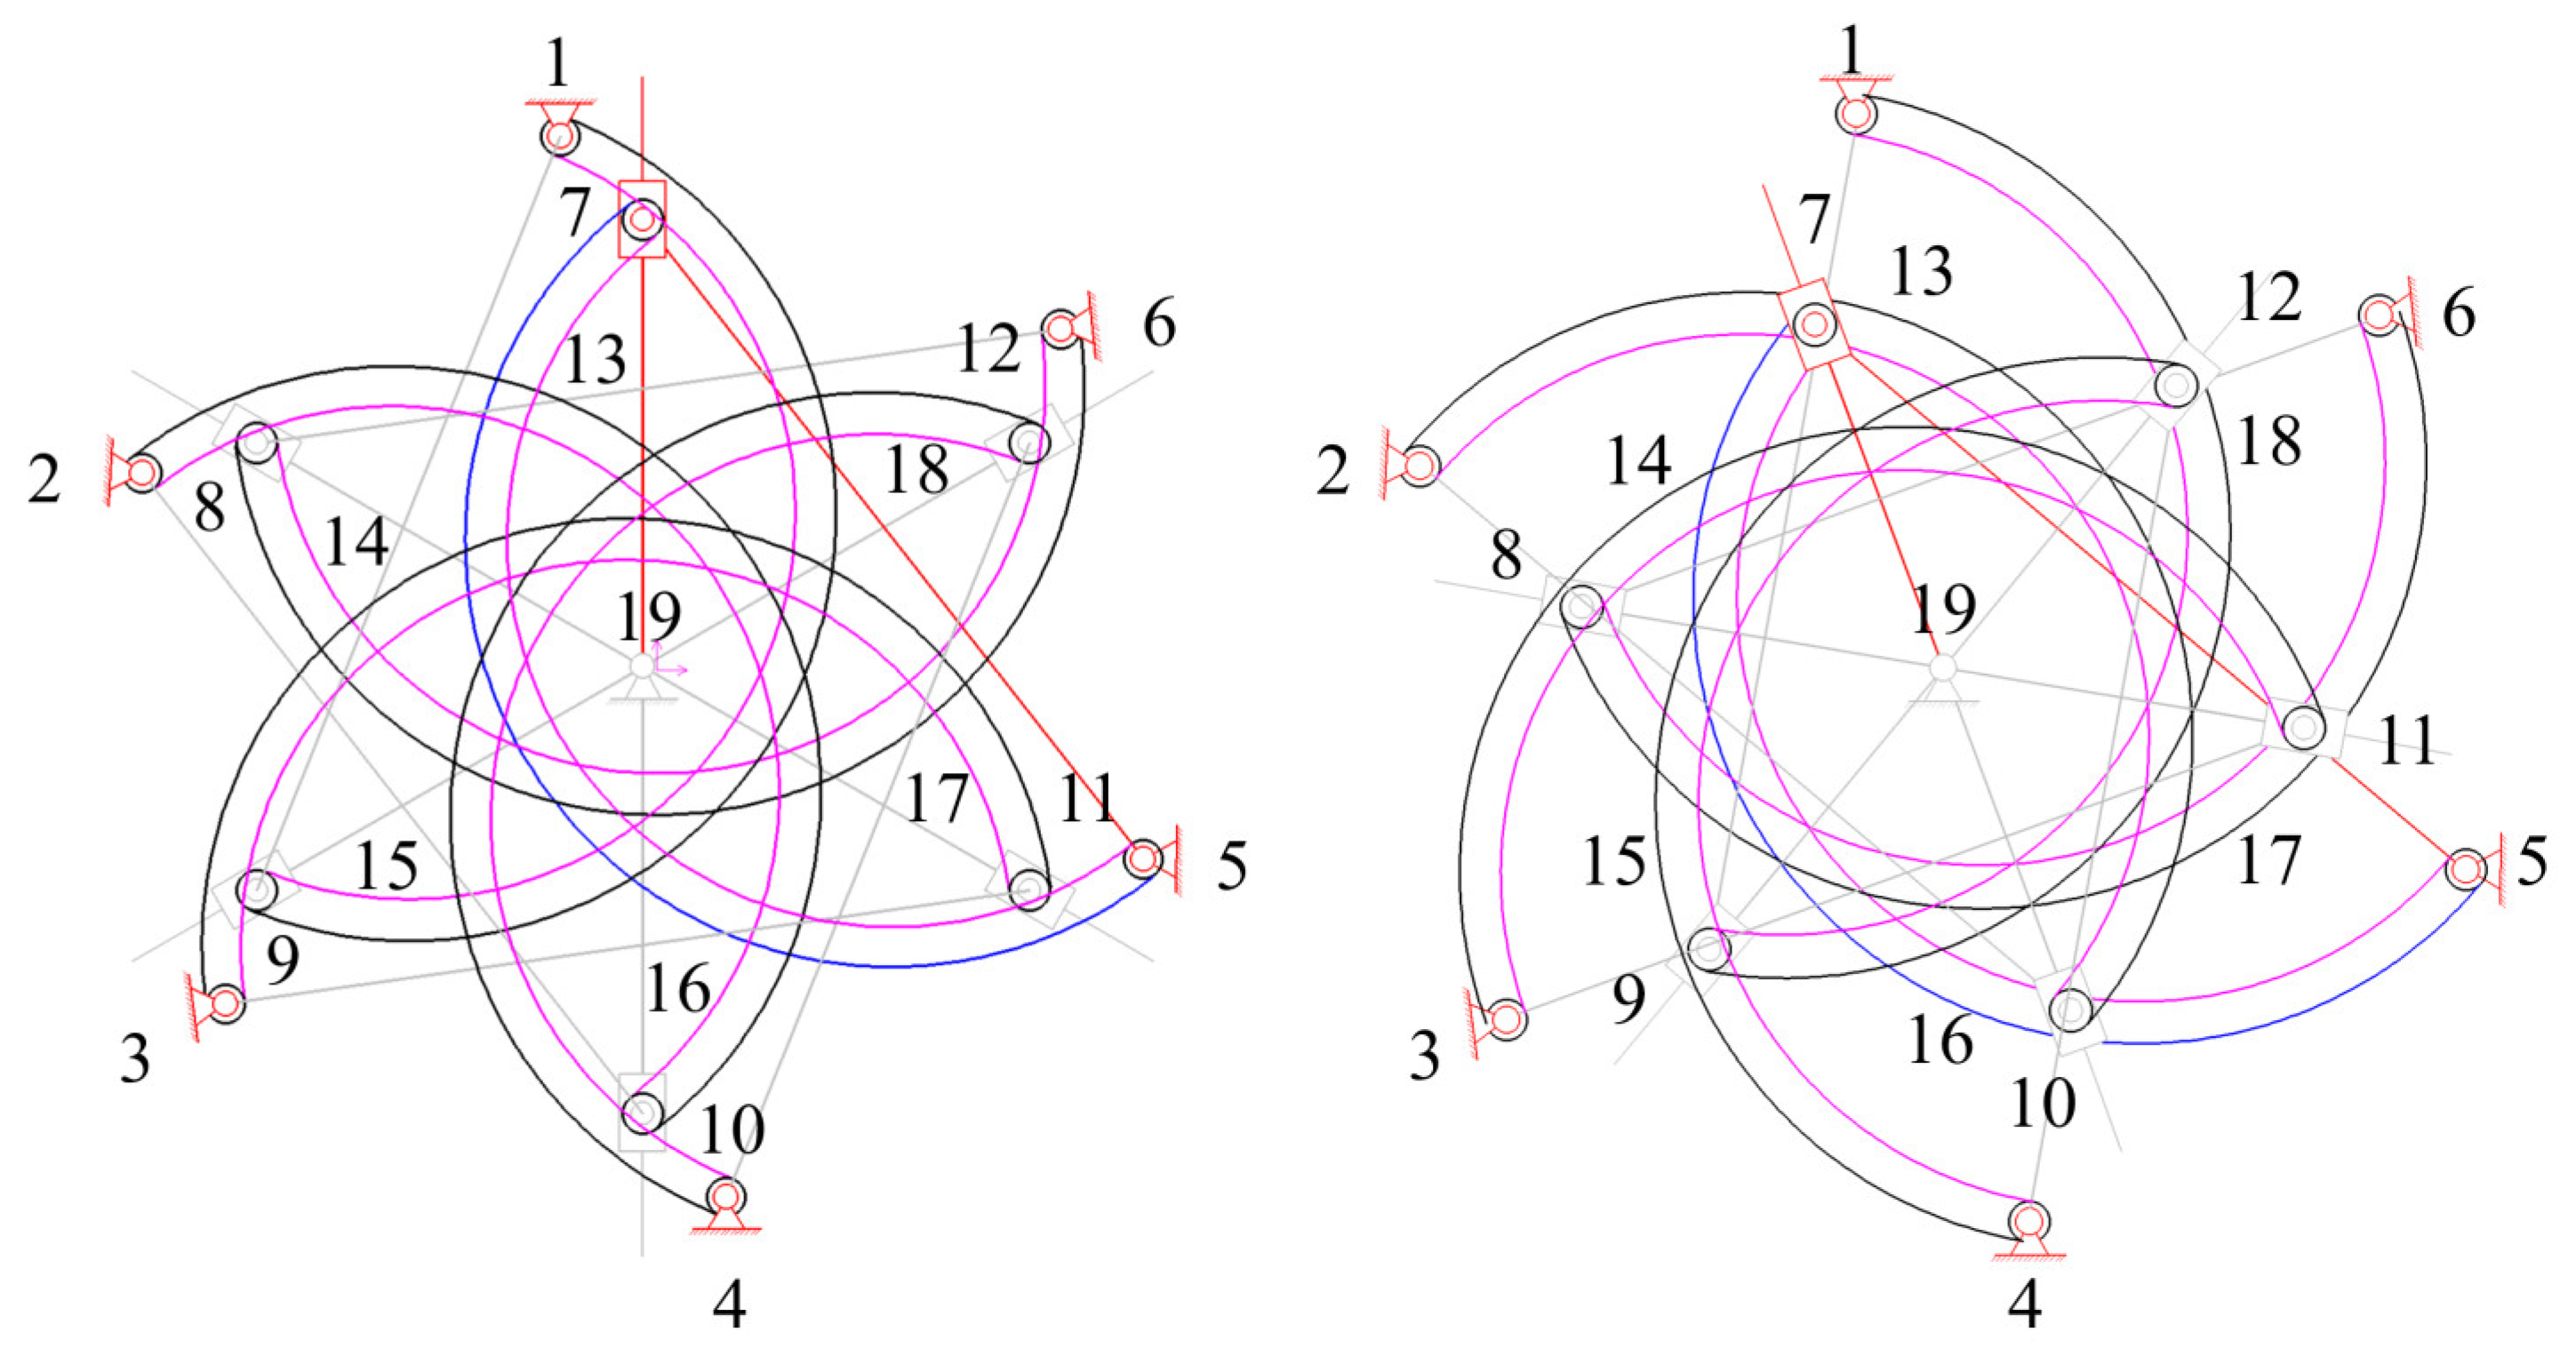
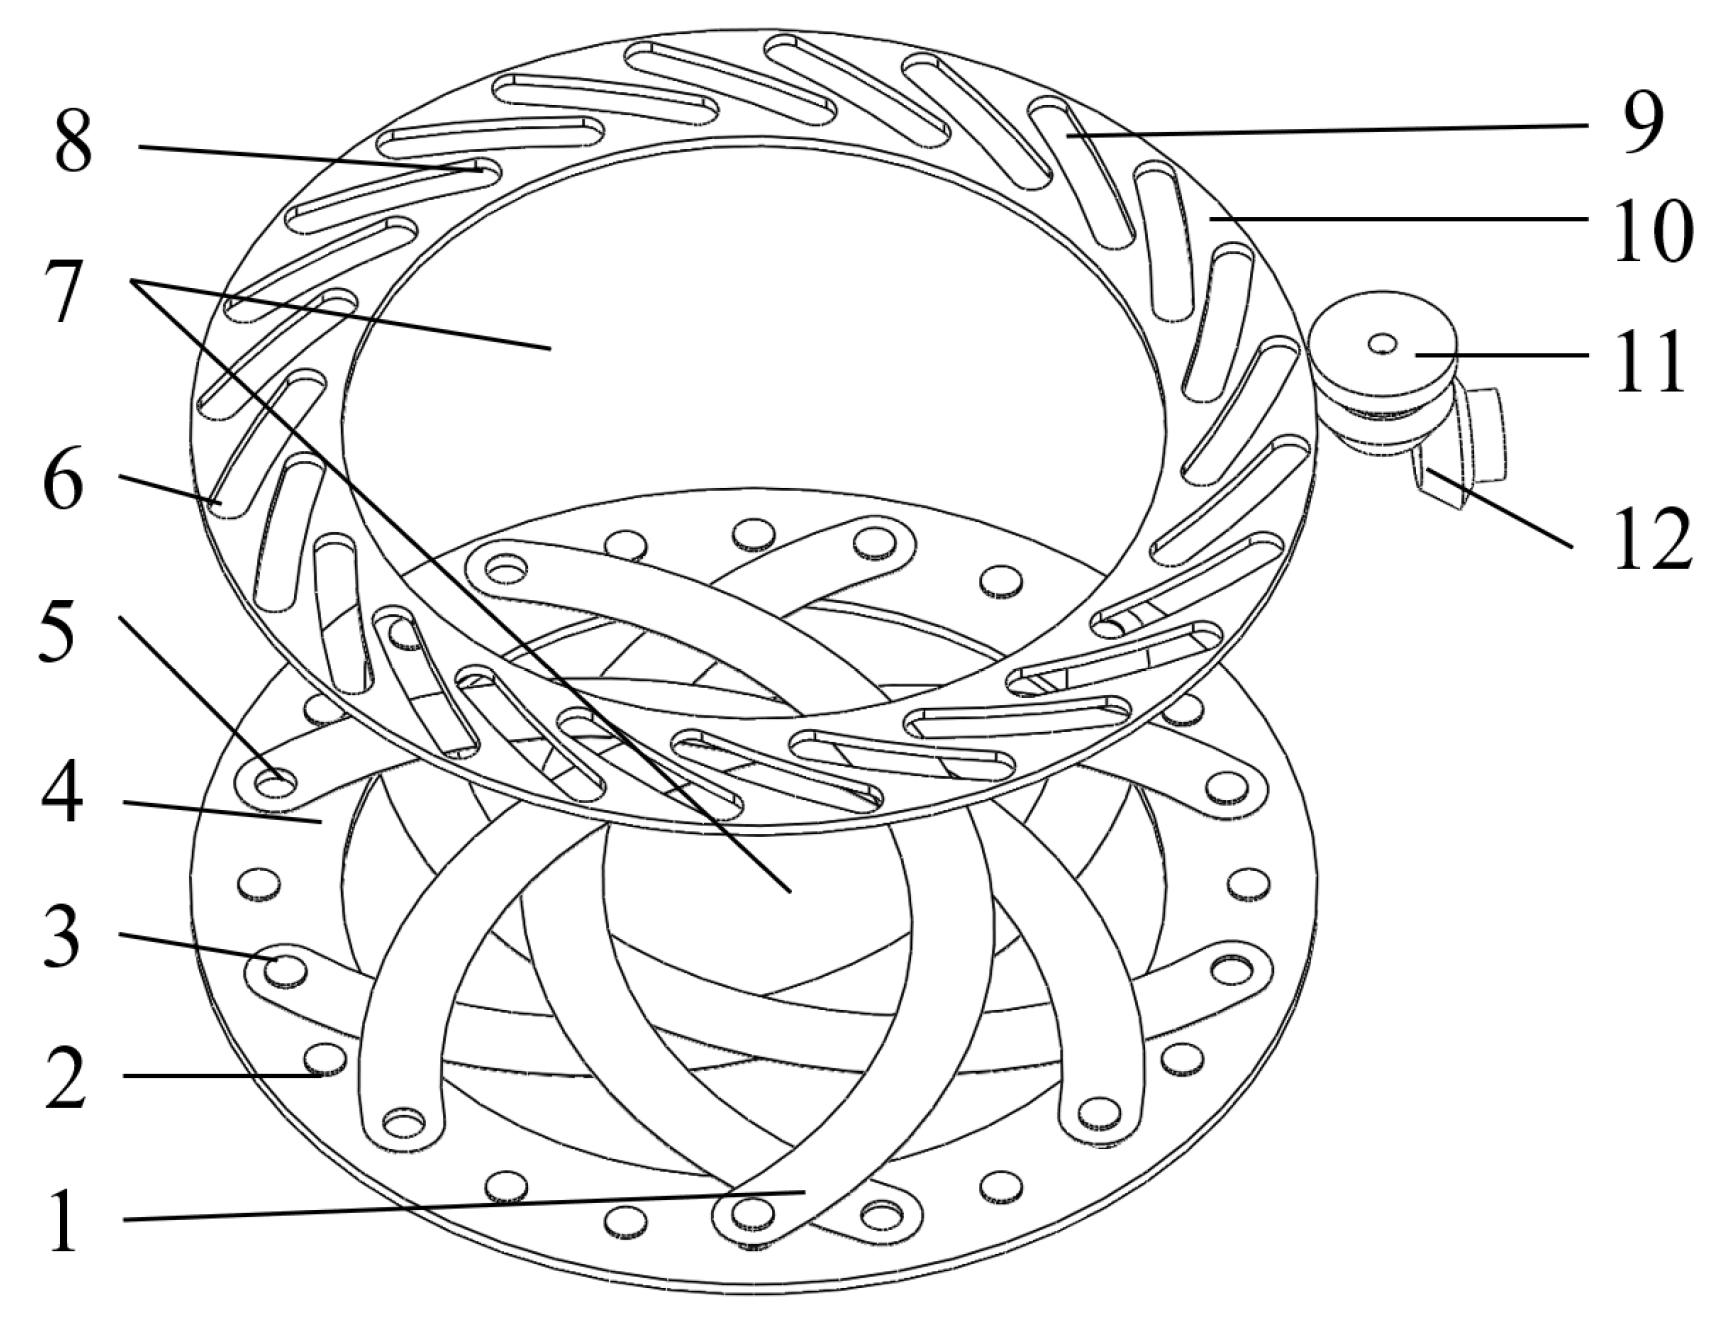
2.1.2. Airflow Inlet Adjustment Method and Airflow Graded Control Mechanism Design
- —Initial angle, °;
- k—Rotational speed coefficient;
- t—Rotation time, s.
- —Arc plate radian, rad;
- Dmax—Maximum diameter, mm.
- —Initial diameter, mm;
- —Rotational angle at the maximum diameter, °.
- —Central opening area, mm2.
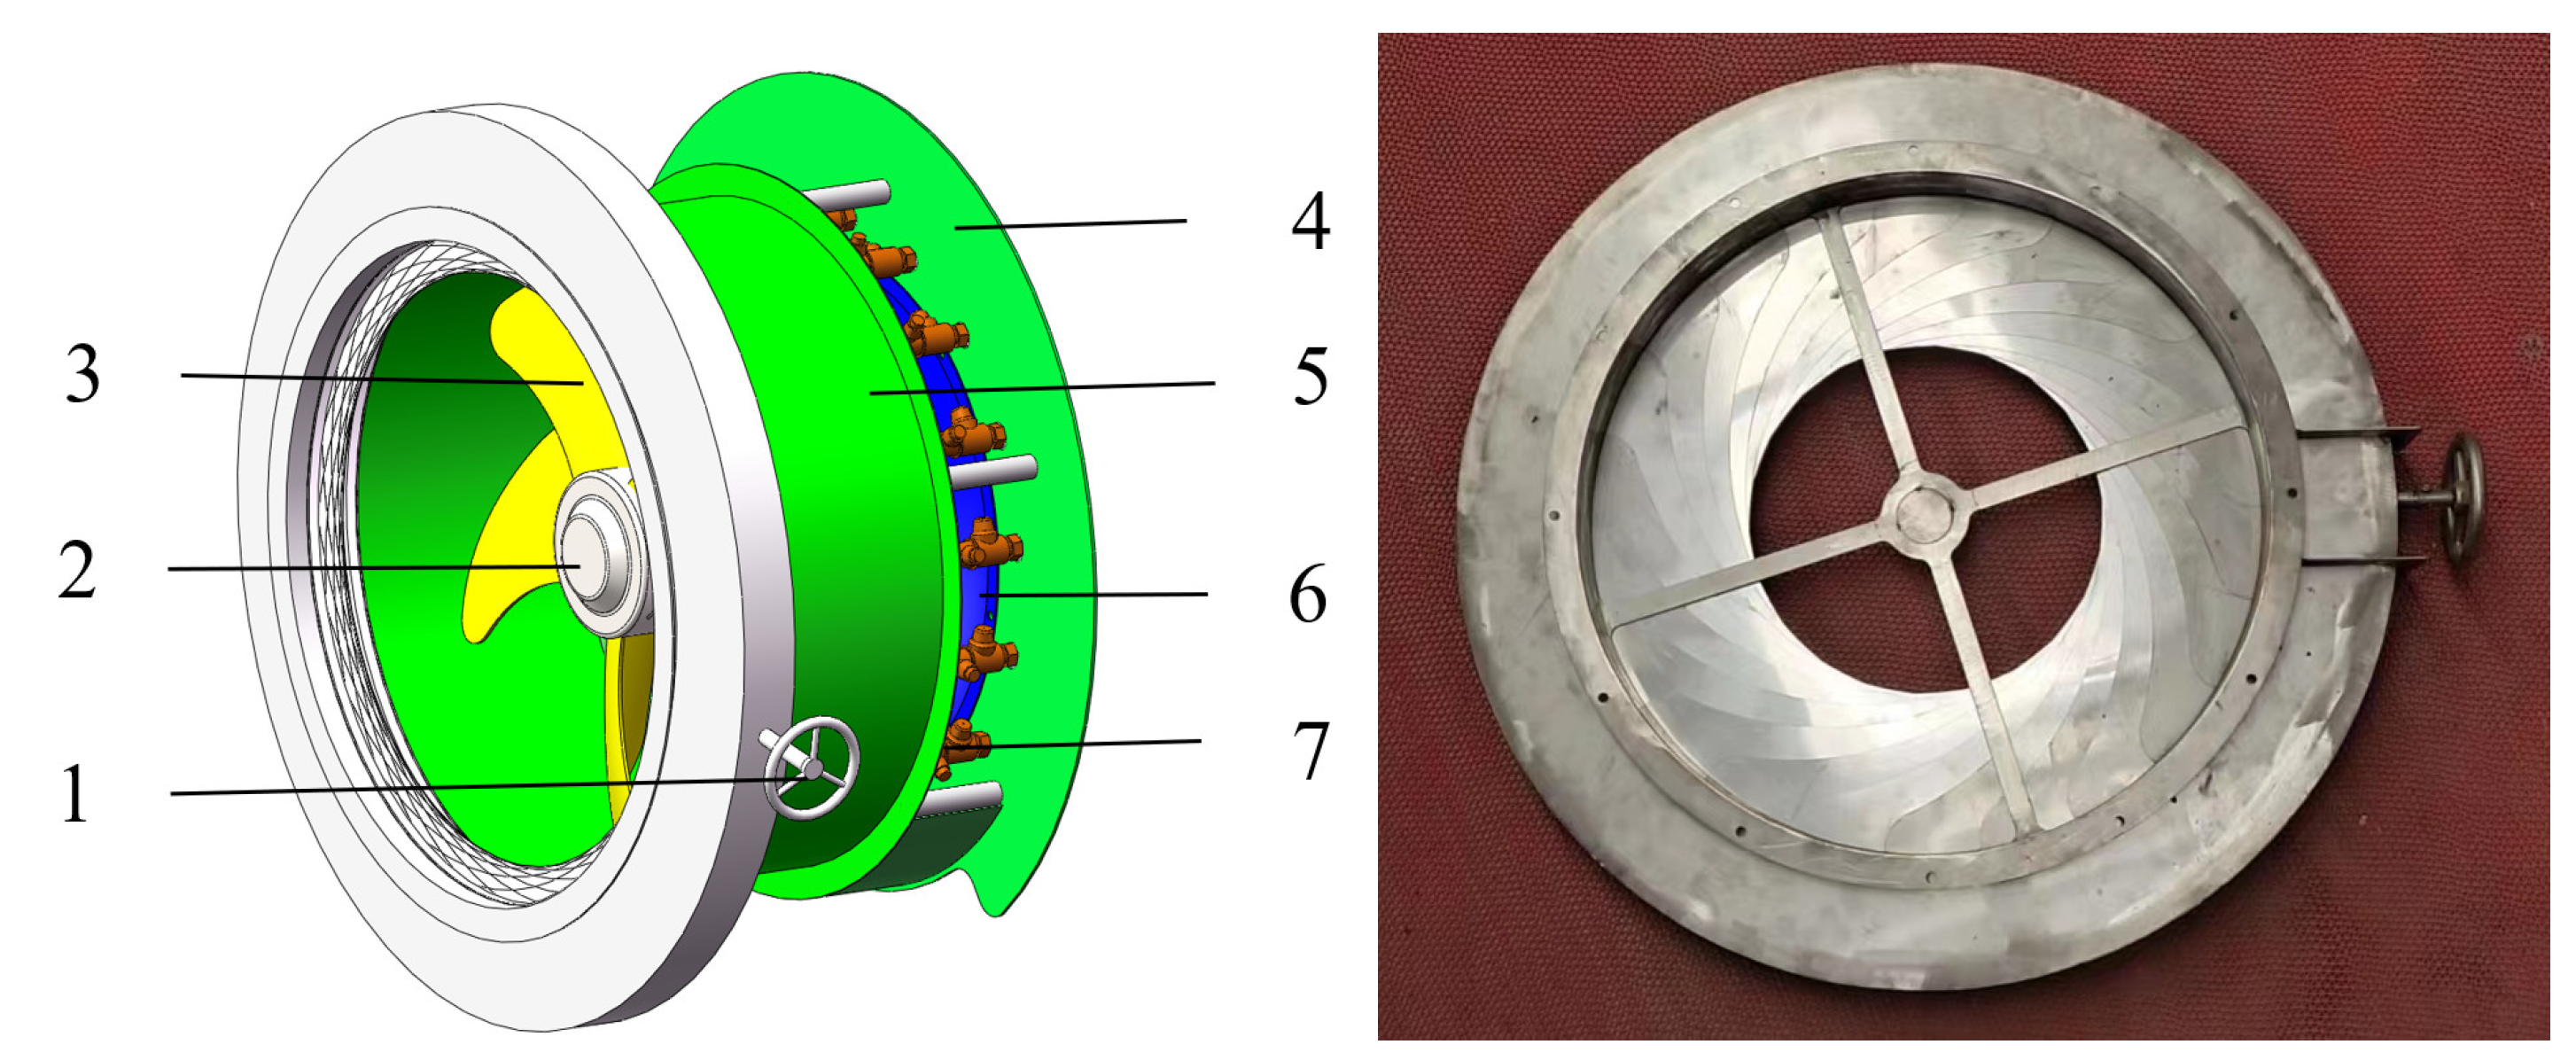
2.1.3. Design of Annular Recirculating Pressure-Stabilized Spraying System
- Q—Nozzle flow rate, L/min;
- M—Application rate per unit area, L/ha;
- Ve—Sprayer travelling speed, km/h;
- B—Sprayer operating width, m;
- N—Number of nozzles, N.
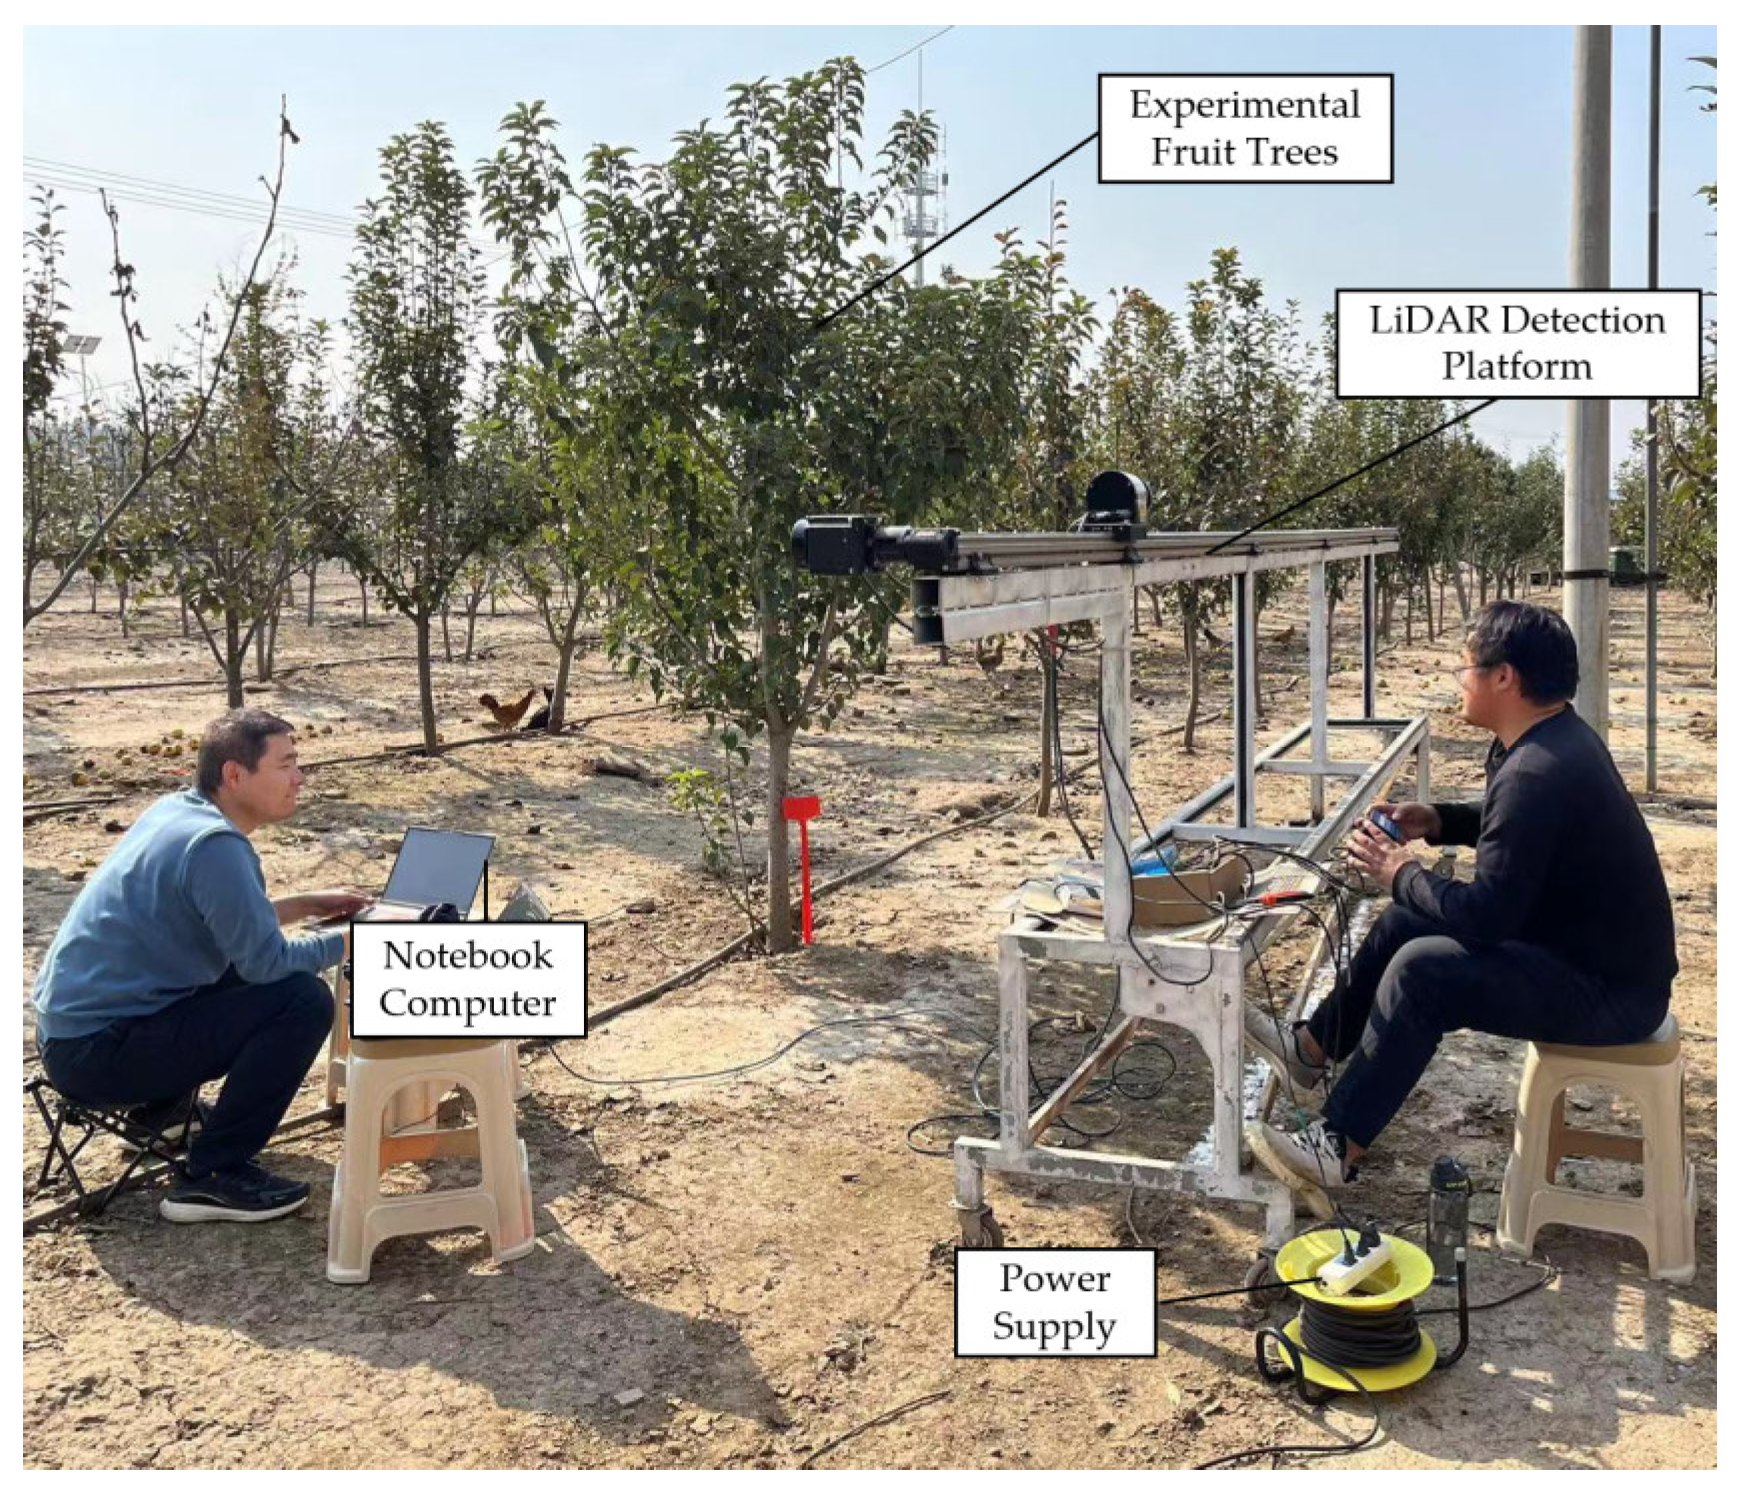
2.2. Tree Canopy Leaf Area Detection Experiment
- y—Canopy leaf area, cm2;
- x—number of LiDAR point clouds, points.
2.3. Single-Nozzle Flow Rate Measurement Experiment
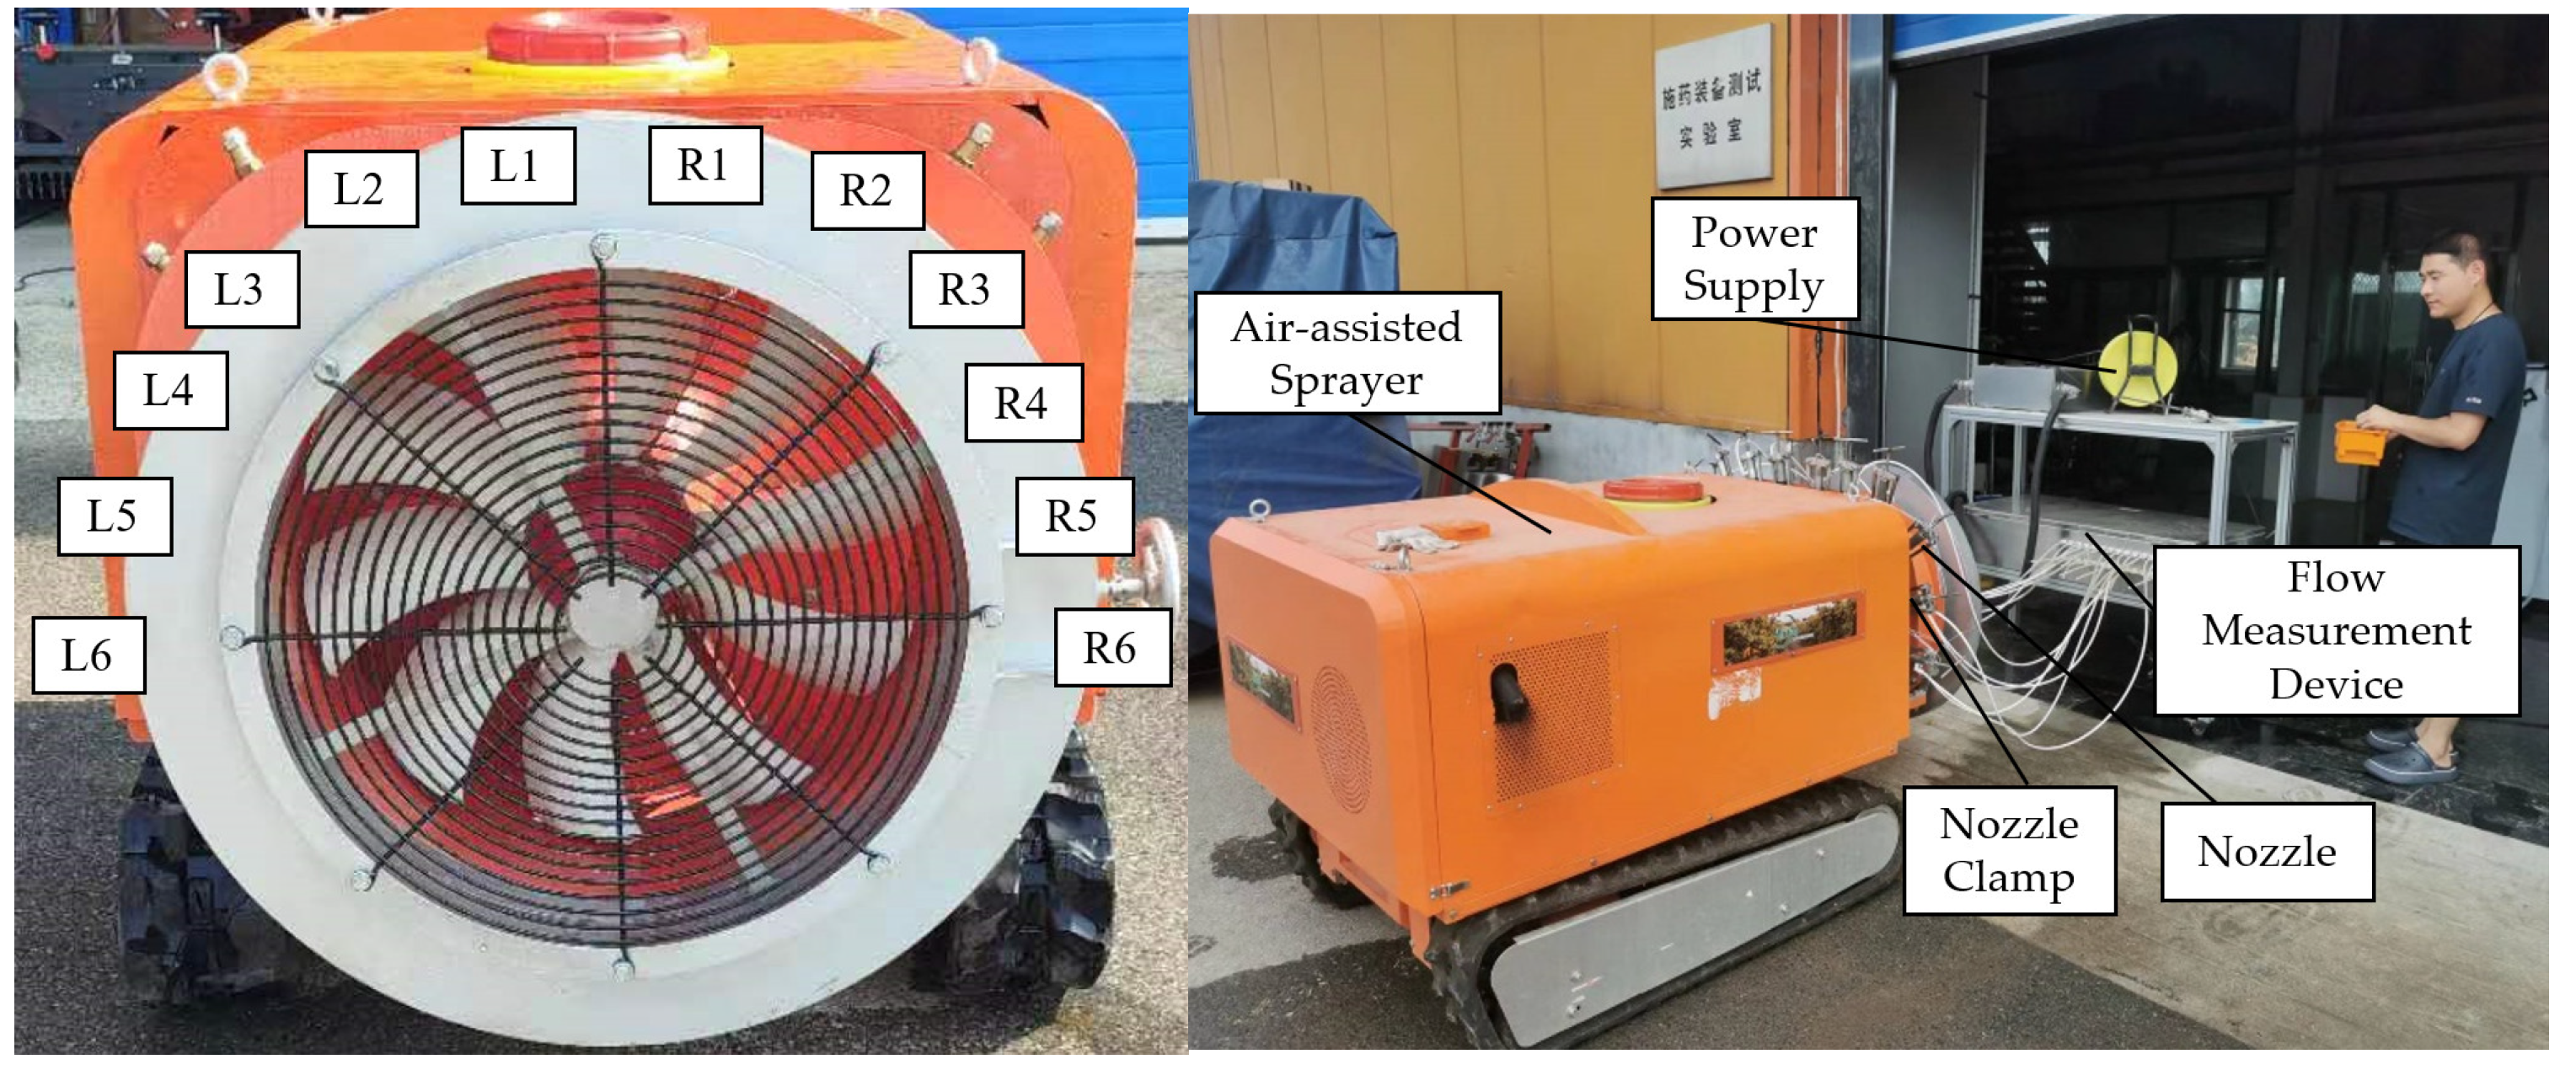
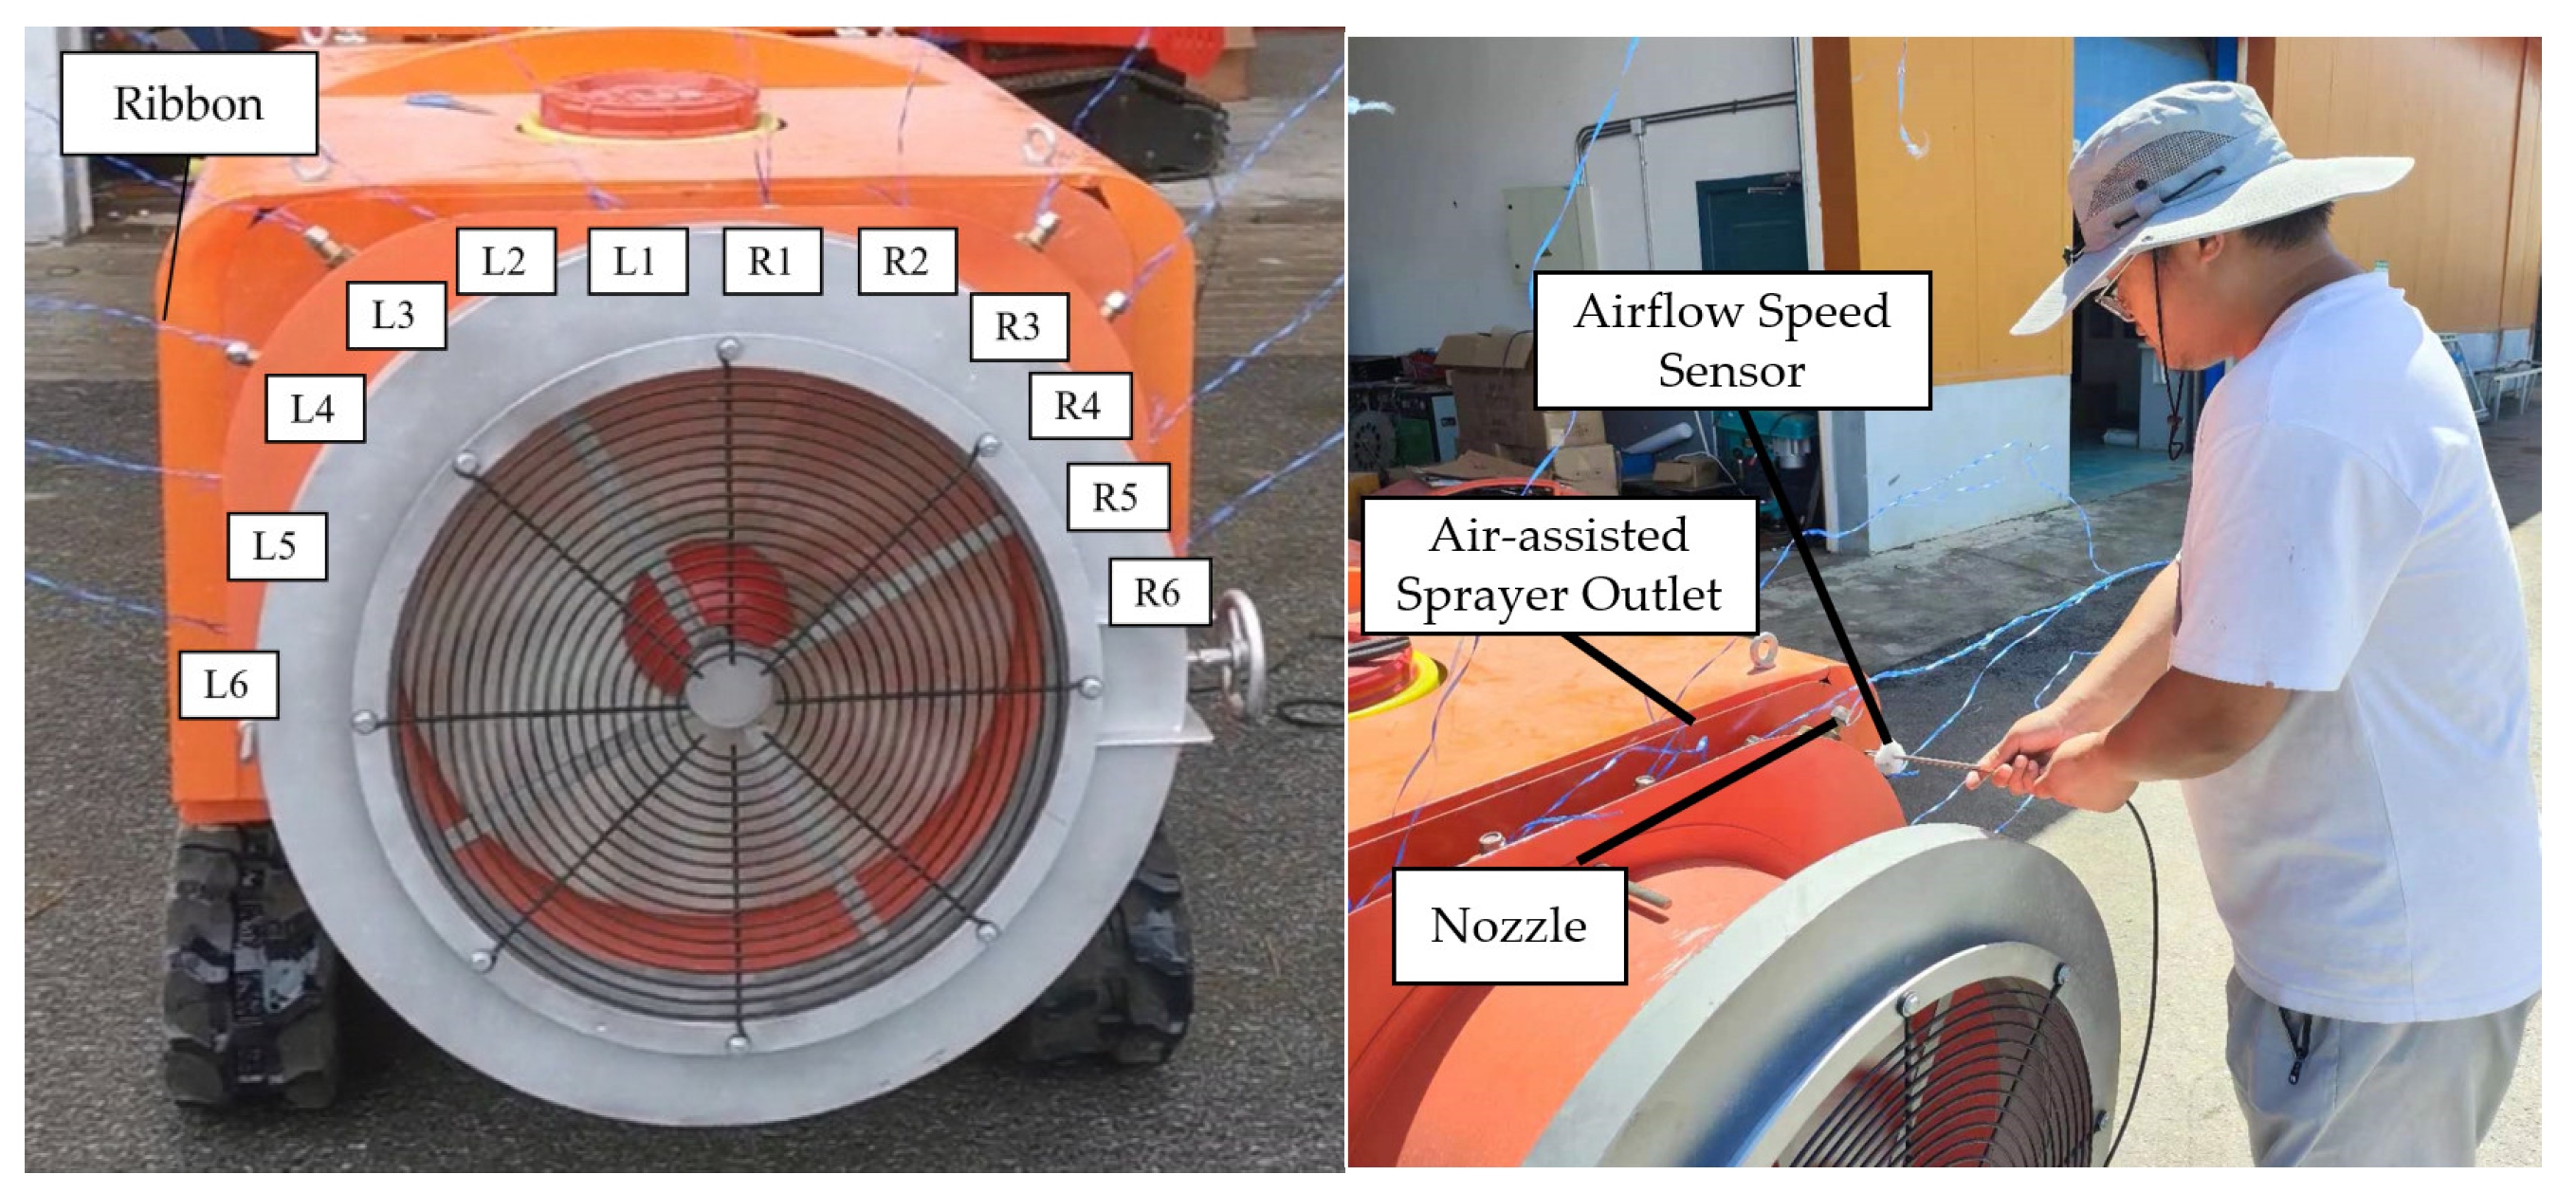
2.4. Outlet Airflow Speed Measurement Test
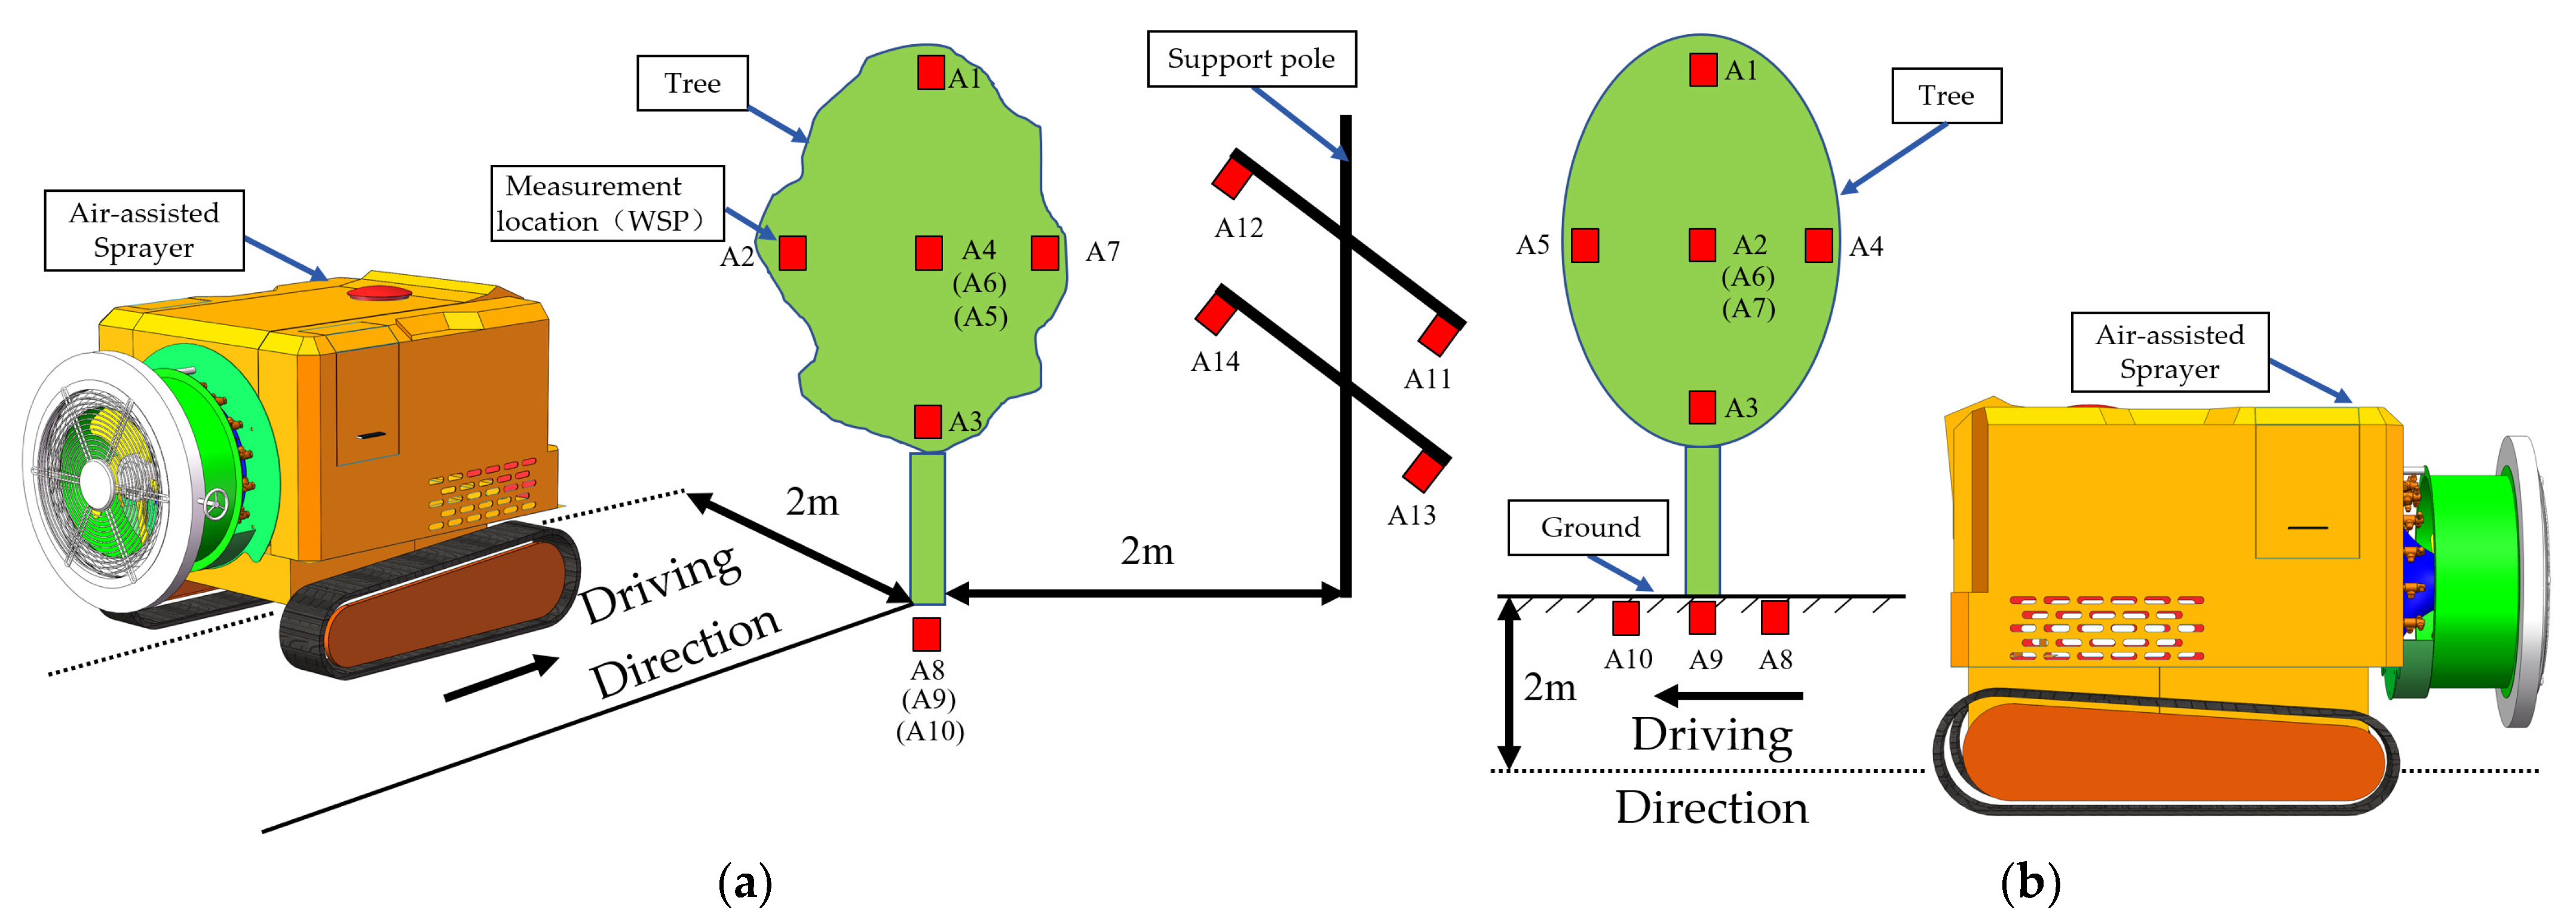
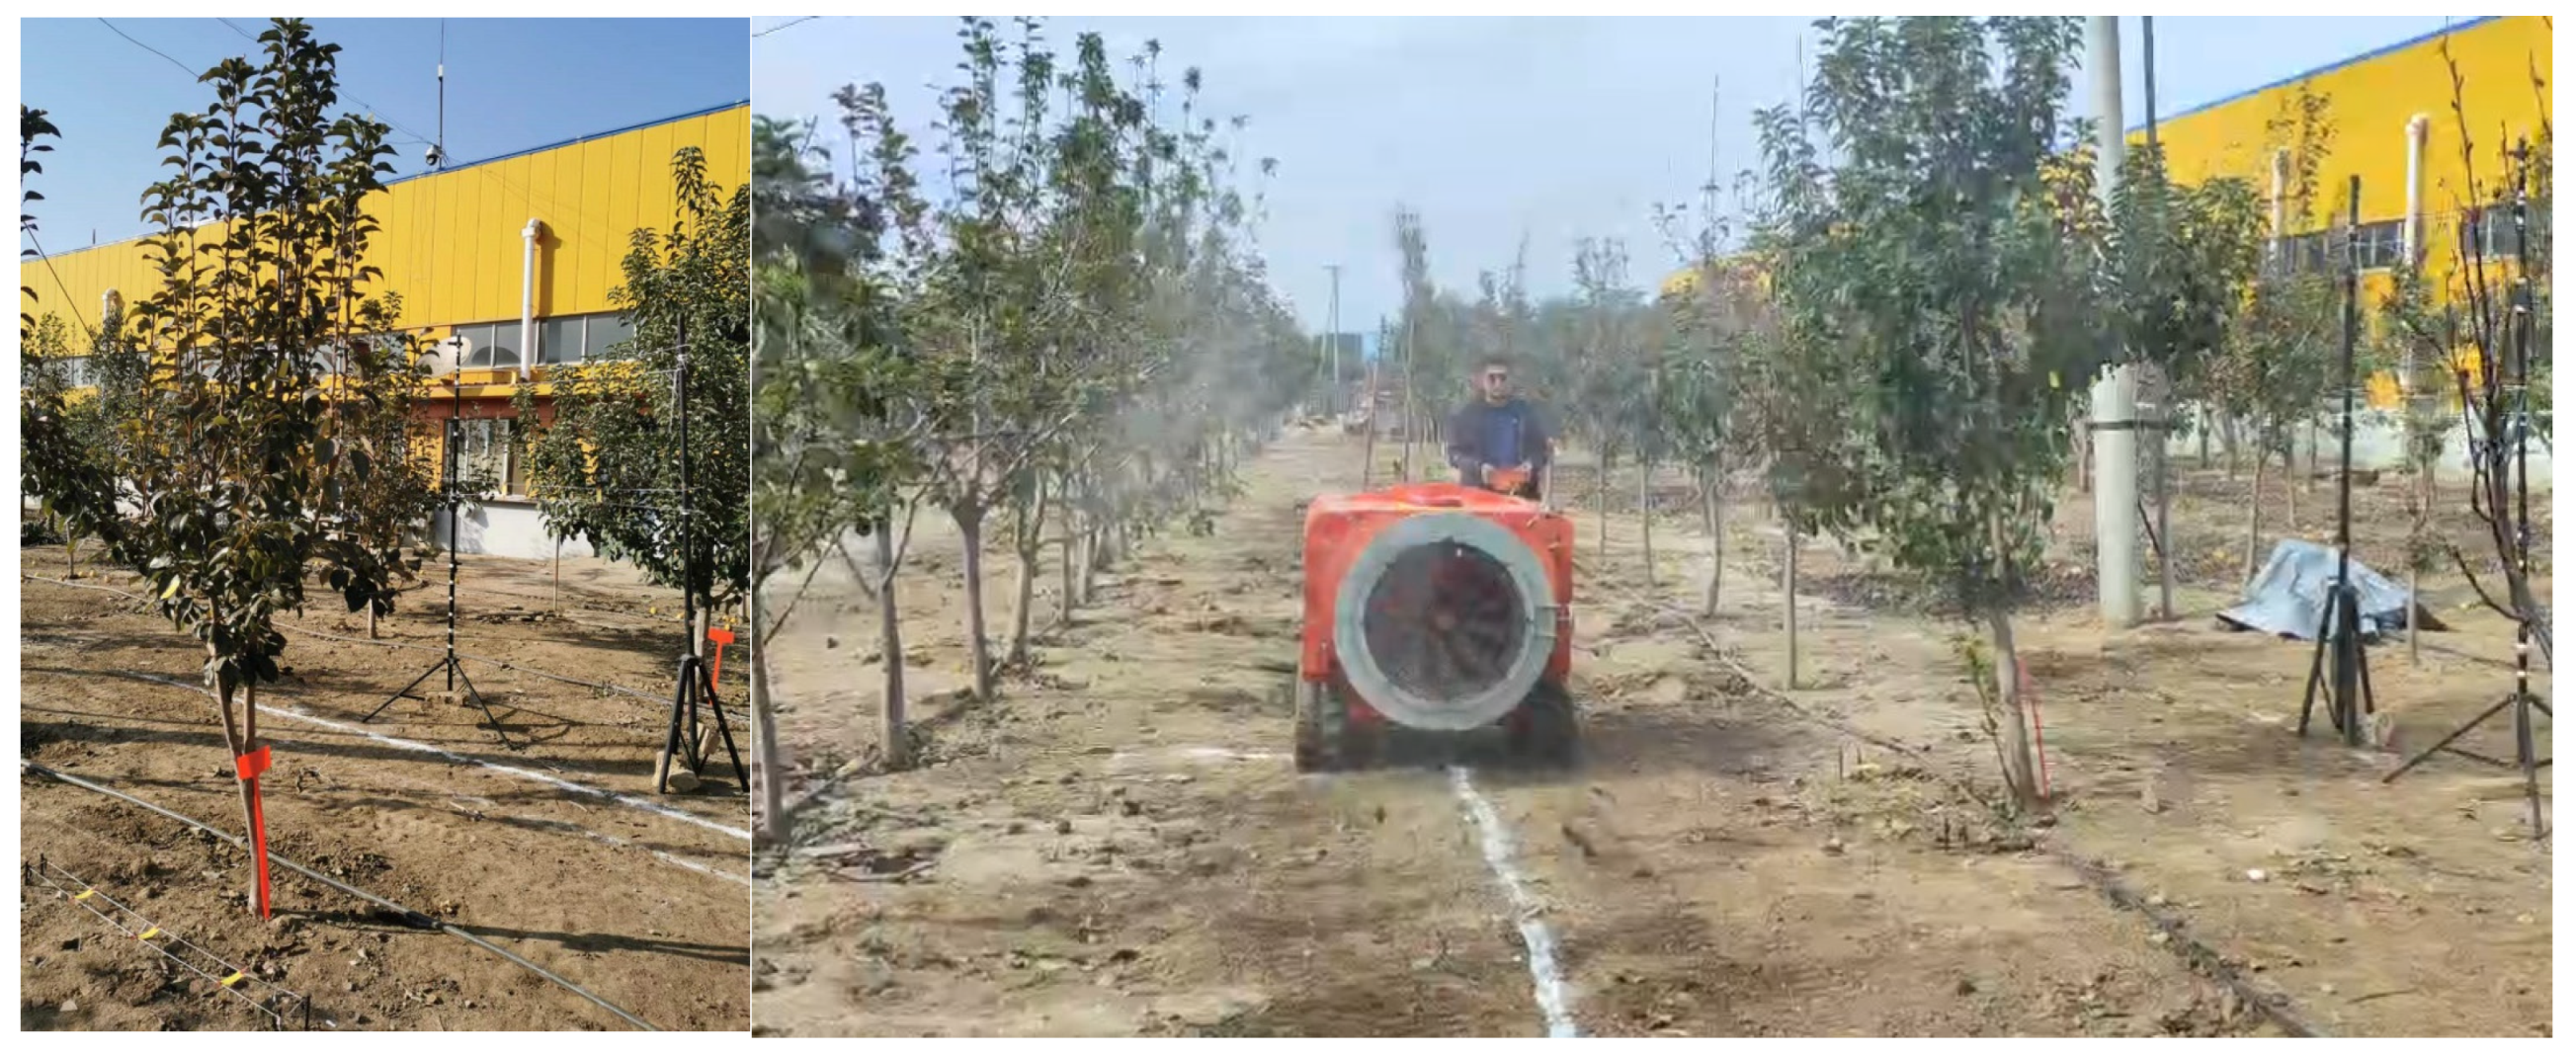
2.5. Fruit Tree Canopy Airflow Speed Measurement Experiment
2.6. Measurement Experiment of Droplet Deposition and Drift in Fruit Tree Canopy
2.7. Data Analysis and Visualization
3. Results and Discussion
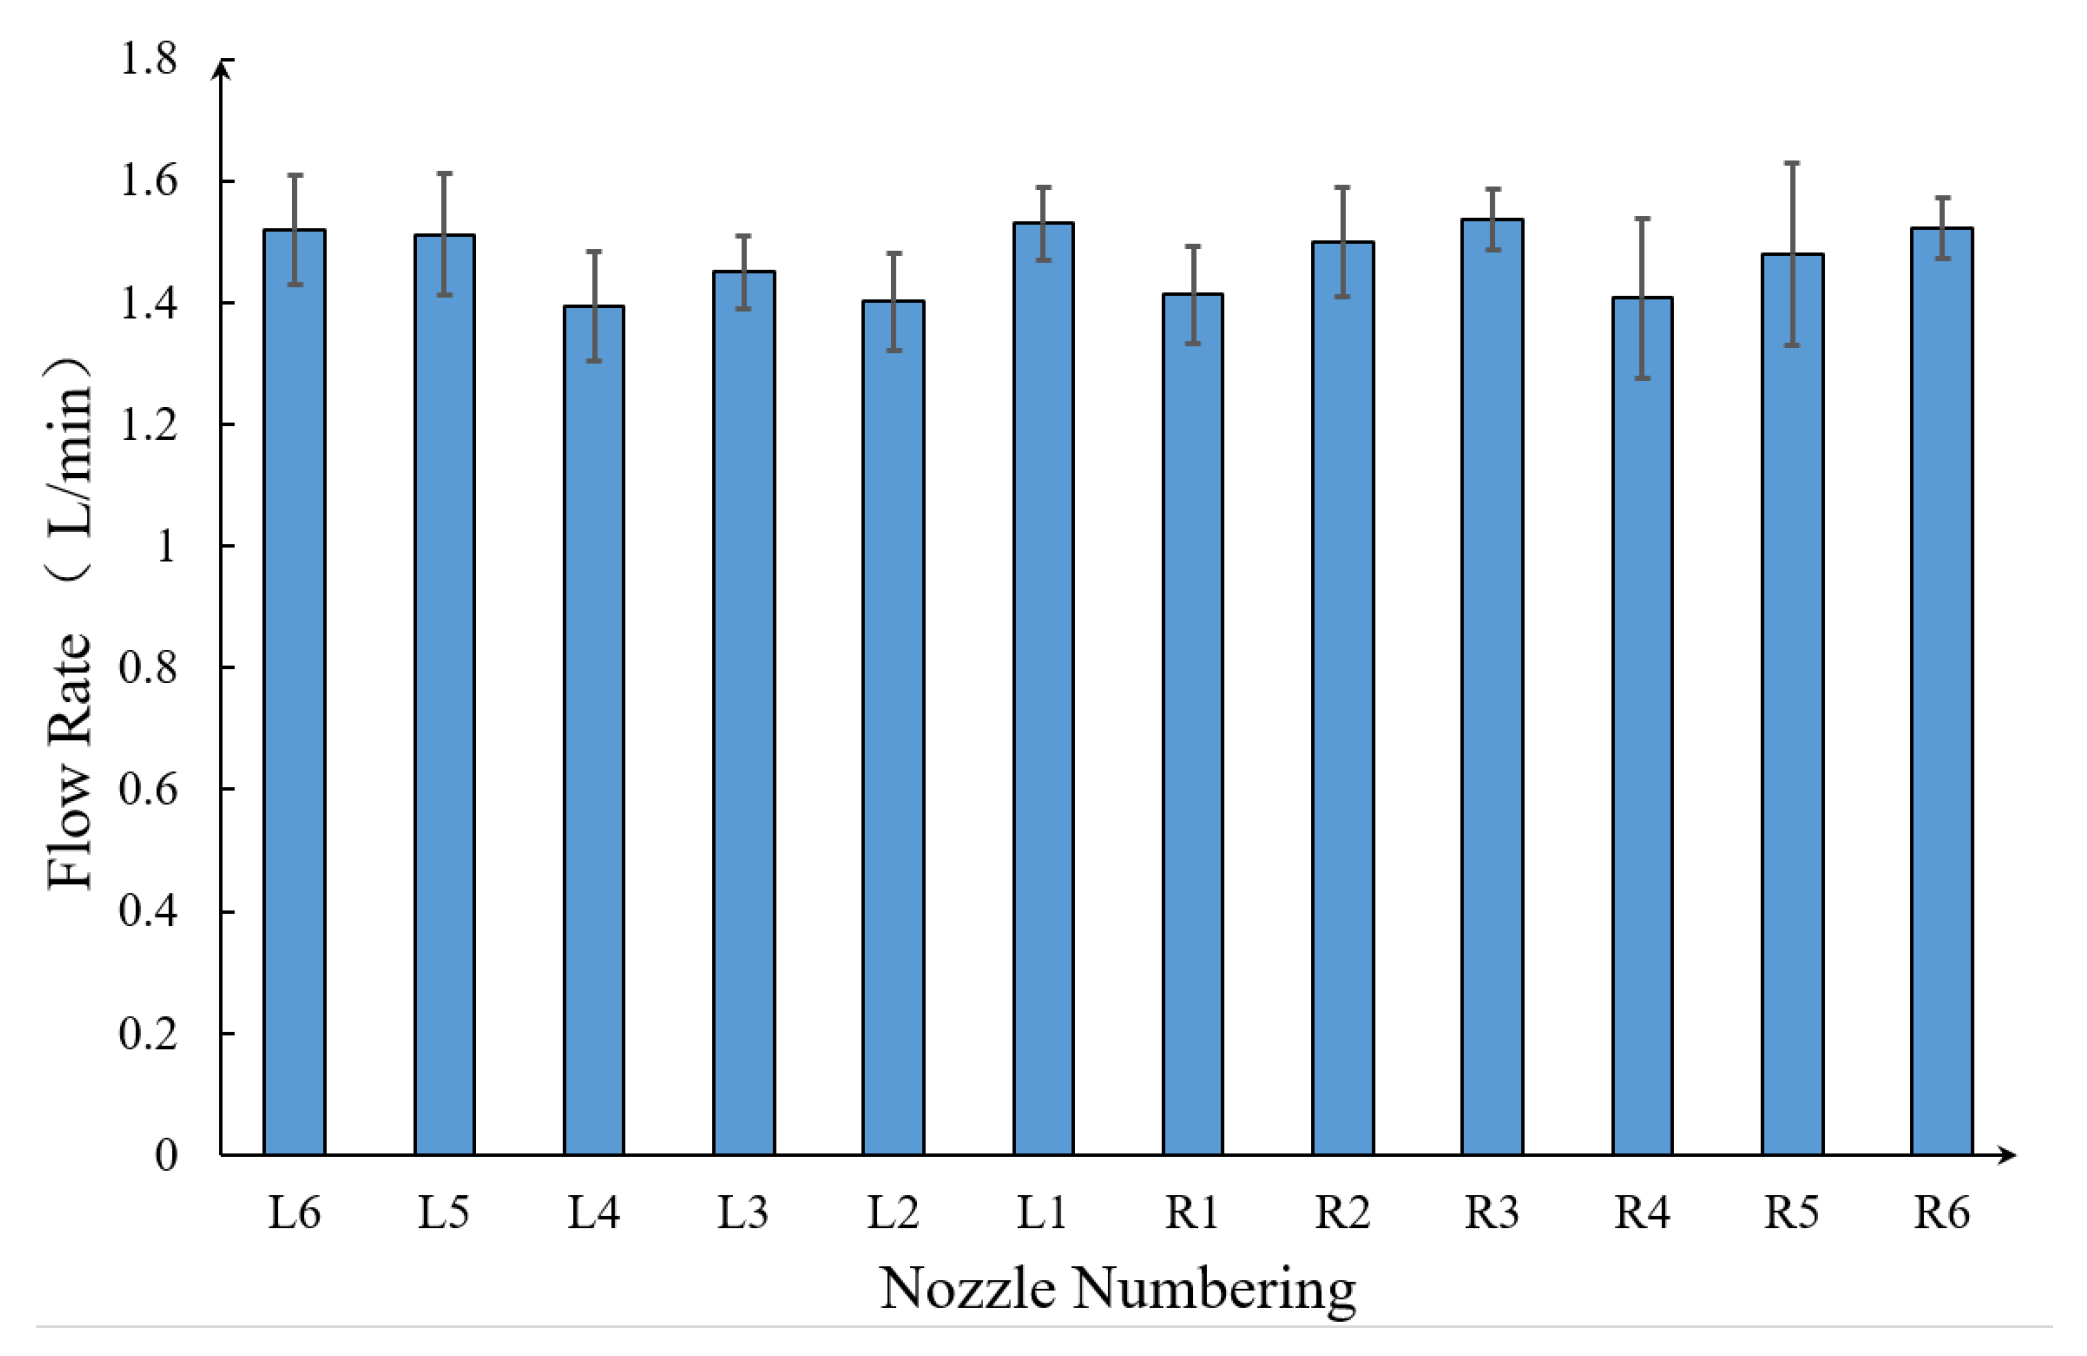
3.1. Results of Single-Nozzle Flow Rate Measurement Experiment
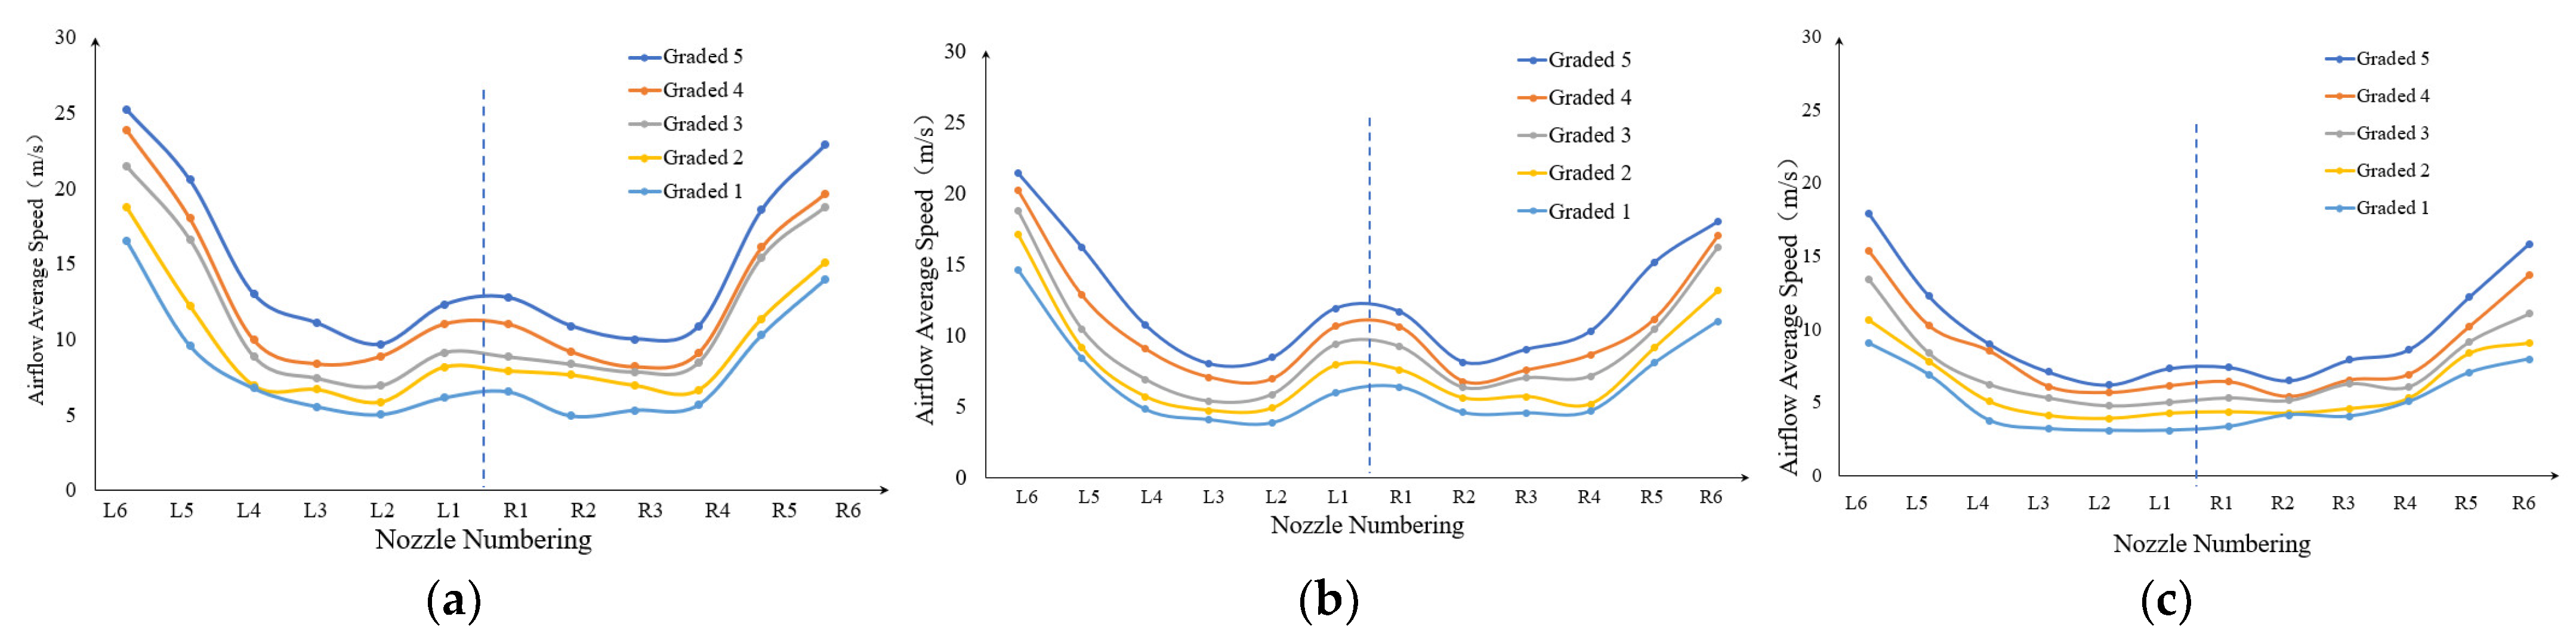
3.2. Measurement Results of Airflow Speed at the Sprayer Outlet
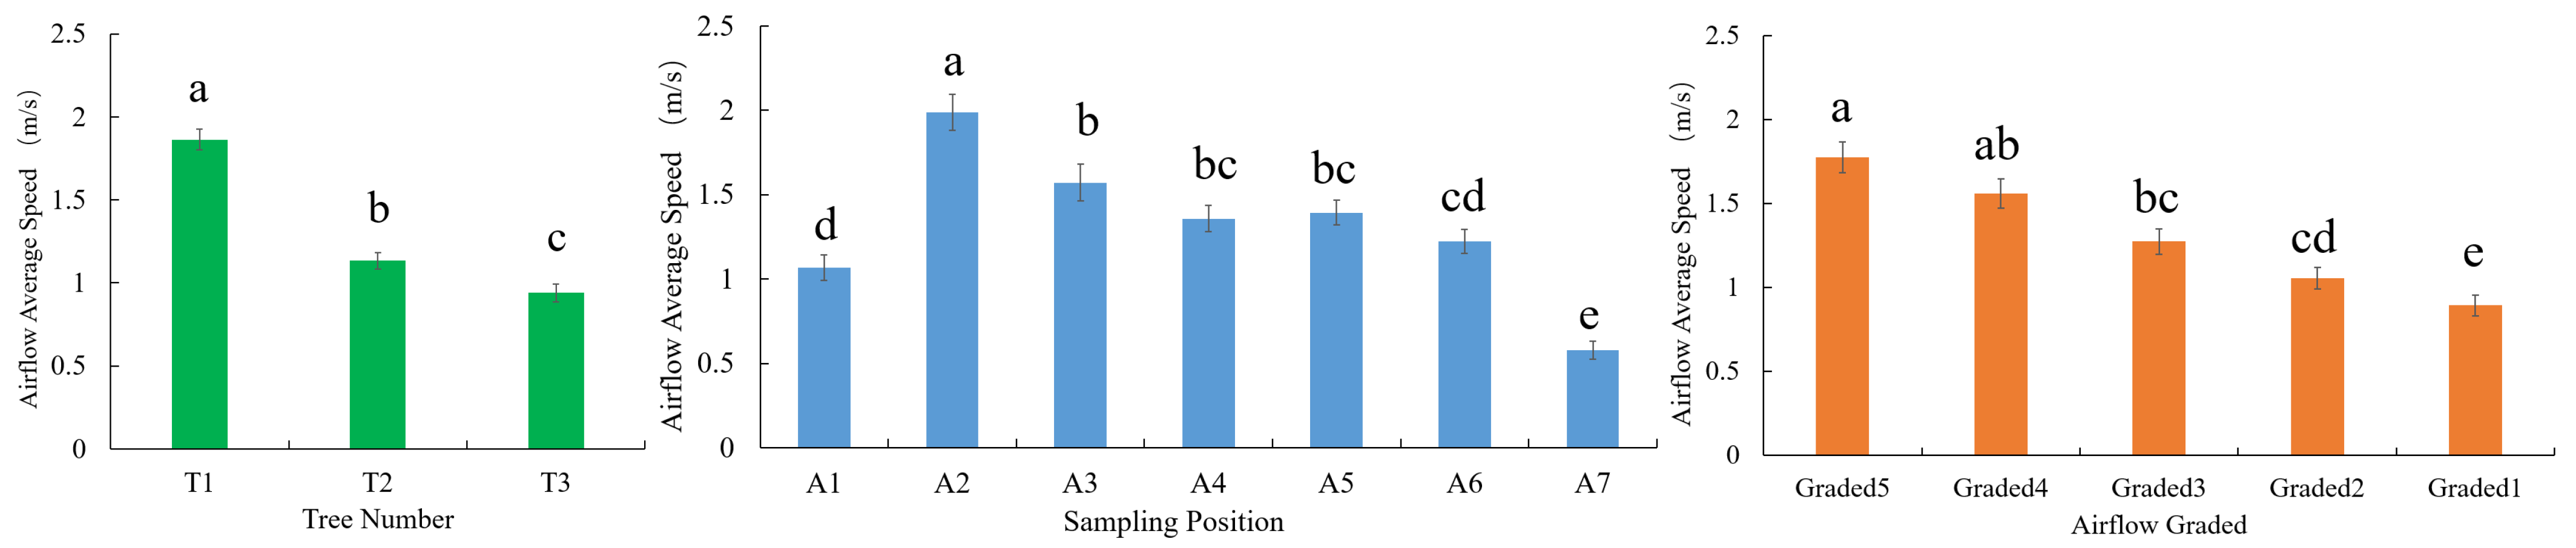
3.3. Measurement Results of Airflow Speed in the Fruit Tree Canopy
3.4. Measurement Results of Droplet Deposition and Drift in the Fruit Tree Canopy
4. Conclusions
- (1)
- A continuous air inlet area adjustment method based on an iris structure was proposed, and an airflow graded control mechanism, along with an annular recirculating pressure-stabilized spraying system, was designed. An airflow graded control orchard sprayer was developed, which allowed for the continuous adjustment of the air inlet area. The air inlet diameter adjustment range was 0–600 mm, and the air inlet area adjustment range was 0–282,600 mm2. Additionally, the system was modified to be motor-driven in subsequent research, enabling future automatic control.
- (2)
- Experiments were conducted to measure the air outlet airflow speed distribution of the sprayer at different fan speeds and control grades. The results showed that the airflow speed trends on both the left and right sides of the sprayer outlet were consistent and generally mirror-symmetrical. The airflow speed at various nozzle positions followed a “W”-shaped distribution, first decreasing and then increasing. The graded airflow control mechanism was found to achieve effective variable control of the air outlet airflow speed.
- (3)
- Three fruit trees with canopy leaf areas and thicknesses of 826.5 cm2, 1409.8 cm2, and 1931.1 cm2 and canopy heights of 1.5 m, 2.0 m, and 2.5 m, respectively, were selected for the canopy airspeed measurement experiment under different control grades. The results indicated that under the same airflow supply, differences in canopy leaf area affected airflow speed loss within the tree canopy. The average airflow speed attenuation rates for the three trees were 63.0%, 71.8%, and 82.5%, respectively. When applying air-assisted spraying, differentiated airflow supply was required based on the canopy leaf area to ensure uniform leaf movement and droplet deposition on both sides of the leaves.
- (4)
- Droplet deposition and drift experiments were conducted under different control grades, and the optimal grade for the three test trees was determined. Graded airflow control based on canopy leaf area during air-assisted spraying was shown to improve droplet deposition uniformity within the canopy and reduce droplet drift in non-target areas. When the airflow speed in the middle of the canopy exceeded 1.50 m/s, the droplet deposition ratio on both sides of the leaves in the canopy increased to 83.55%, and the coefficient of variation for droplet deposition fell below 33.24%.
Author Contributions
Funding
Data Availability Statement
Conflicts of Interest
References
- FAO. Minimum Requirements for Agricultural Pesticide Application Equipment; Food and Agriculture Organization of the United Nations: Rome, Italy, 2001. [Google Scholar]
- Zheng, Y.J.; Chen, B.T.; Lü, H.T.; Kang, F.; Jing, S.J.; Zhao, Y. Research progress on mechanization technology and equipment for orchard plant protection in China. J. Agric. Mach. 2020, 36, 110–124. [Google Scholar] [CrossRef]
- Wang, Z.T.; Niu, H.; Tang, Y.R.; Liu, Y.; Lan, H.P.; Zhang, H. Research Status of Orchard Spraying Machinery and Technology. J. Tarim Univ. 2019, 31, 83–91. [Google Scholar] [CrossRef]
- Zhai, C.Y.; Zhao, C.J.; Wang, N.; Long, J.; Wang, X.; Weckler, P.; Zhang, H. Research progress on precision control method of wind-fed spray in orchards. Trans. Chin. Soc. Agric. Mach. 2018, 34, 1–15. [Google Scholar] [CrossRef]
- Xu, T.; Lü, X.L.; Qi, Y.N.; Li, J.; Zeng, J.; Lei, X.H.; Yuan, Q.C. Research progress on air-assisted spraying equipment and technology for orchards in China. Chin. J. Agric. Mech. 2023, 44, 69–77. [Google Scholar] [CrossRef]
- Liu, X.M.; Liu, X.H.; Cui, H.Y.; Yuan, J. Research progress and prospects on droplet deposition in crop canopies. J. Agric. Mach. 2021, 52, 1–20. [Google Scholar] [CrossRef]
- Colaço, A.F.; Molin, J.P.; Rosell-Polo, J.R.; Pereira, D.; Garcia, M.; Santos, R. Application of light detection and ranging and ultrasonic sensors to high-throughput phenotyping and precision horticulture: Current status and challenges. Hortic. Res. 2018, 5, 35. [Google Scholar] [CrossRef]
- Privitera, S.; Manetto, G.; Pascuzzi, S.; Pessina, D.; Cerruto, E. Drop size measurement techniques for agricultural sprays: A state-of-the-art review. Agronomy 2023, 13, 678. [Google Scholar] [CrossRef]
- Owen-Smith, P.; Perry, R.; Wise, J.; Thompson, G.; Clark, H.; Johnson, A. Spray coverage and pest management efficacy of a solid set canopy delivery system in high-density apples. Pest Manag. Sci. 2019, 75, 3050–3059. [Google Scholar] [CrossRef]
- Hong, S.; Park, J.; Jeong, H.; Lee, S.; Choi, L.; Zhao, L.; Zhu, H. Fluid dynamic approaches for prediction of spray drift from ground pesticide applications: A review. Agronomy 2021, 11, 1182. [Google Scholar] [CrossRef]
- He, X.K. Research progress on plant protection machinery and pesticide application technology in China. J. Pestic. Sci. 2019, 21, 921–930. [Google Scholar] [CrossRef]
- Li, S.; Li, J.; Yu, S.; Wang, P.; Liu, H.; Yang, X. Anti-Drift Technology Progress of Plant Protection Applied to Orchards: A Review. Agronomy. 2023, 13, 2679. [Google Scholar] [CrossRef]
- Cai, J.C. Research on Orchard Online Detection Methods and Target-Variable Spraying Technology Based on 2D LiDAR. Ph.D. Thesis, China Agricultural University, Beijing, China, 2018. [Google Scholar]
- Van Zyl, J.G.; Grout, T.G.; Schutte, G.C.; Smith, D.; Johnson, K.; Brown, M. Reduced volume spray application in South African citrus orchards: Effects on deposition quantity, quality, and uniformity. Julius-Kühn-Arch. 2015, 448, 51. [Google Scholar]
- Khot, L.R.; Ehsani, R.; Albrigo, G.; Larbi, P.A.; Landers, A.; Campoy, J.; Wellington, C. Air-assisted sprayer adapted for precision horticulture: Spray patterns and deposition assessments in small-sized citrus canopies. Biosyst. Eng. 2012, 113, 76–85. [Google Scholar] [CrossRef]
- Khot, L.R.; Ehsani, R.; Albrigo, G.; Schueller, J.K.; Sweeb, R.D. Spray pattern investigation of an axial-fan airblast precision sprayer using a modified vertical patternator. Appl. Eng. Agric. 2012, 28, 647–654. [Google Scholar] [CrossRef]
- Landers, A.J. Developments towards an automatic precision sprayer for fruit crop canopies. In Proceedings of the 2010 ASABE Annual International Meeting, Pittsburgh, PA, USA, 20–23 June 2010; American Society of Agricultural and Biological Engineers: St. Joseph, MI, USA, 2010; p. 1. [Google Scholar] [CrossRef]
- Landers, A.J.; Gil, E. Development and validation of a new deflector system to improve pesticide application in New York and Pennsylvania grape production areas. In Proceedings of the 2006 ASAE Annual Meeting, Portland, OR, USA, 9–12 July 2006; American Society of Agricultural and Biological Engineers: St. Joseph, MI, USA, 2006; p. 1. [Google Scholar] [CrossRef]
- Cross, J.V.; Walklate, P.J.; Murray, R.A.; Richardson, G.M. Spray deposits and losses in different sized apple trees from an axial fan orchard sprayer: 3. Effects of air volumetric flow rate. Crop Prot. 2003, 22, 381–394. [Google Scholar] [CrossRef]
- Qiu, W.; Zhao, S.Q.; Ding, W.M.; Liu, H.; Wang, Y.; Chen, J. Effects of fan speed on spray deposition and drift for targeting air-assisted sprayer in pear orchard. Int. J. Agric. Biol. Eng. 2016, 9, 53–62. [Google Scholar] [CrossRef]
- Pai, N.; Salyani, M.; Sweeb, R.D. Regulating airflow of orchard airblast sprayer based on tree foliage density. Trans. ASABE 2009, 52, 1423–1428. [Google Scholar] [CrossRef]
- Yan, C.; Xu, L.; Ma, S.; Wang, Z.; Chen, H.; Li, Y. Enhancing spray deposition in grape canopies through the development of new prototype air-disturbance sprayers. Biosyst. Eng. 2024, 244, 1–15. [Google Scholar] [CrossRef]
- Dou, H.; Zhai, C.; Zou, W.; Li, X.; Chen, L.; Zhang, Q. Design and test of the airflow adjustment test bench for orchard air-assisted spraying. In Proceedings of the 2021 ASABE Annual International Virtual Meeting, Online, 12–16 July 2021; American Society of Agricultural and Biological Engineers: St. Joseph, MI, USA, 2021; p. 1. [Google Scholar] [CrossRef]
- Gu, J.; Zhu, H.; Ding, W.; Wang, L.; Li, S.; Zhao, Q. Characterization of air profiles impeded by plant canopies for a variable-rate air-assisted sprayer. Trans. ASABE 2014, 57, 1307–1315. [Google Scholar] [CrossRef]
- Mahmud, M.S.; Zahid, A.; He, L.; Zhang, Y.; Li, X.; Chen, D. Development of an automatic airflow control system for precision sprayers based on tree canopy density. J. ASABE 2022, 65, 1225–1240. [Google Scholar] [CrossRef]
- Vigo-Morancho, A.; Videgain, M.; Bone, A.; Smith, J.; Rodriguez, P.; Garcia, L. Static and dynamic study of the airflow behavior generated by two air-assisted sprayers commonly used in 3D crops. Comput. Electron. Agric. 2024, 216, 108535. [Google Scholar] [CrossRef]
- Jiang, H.H.; Niu, C.Q.; Liu, L.M.; Wang, D.W.; Wang, J.S.; Mao, W.H. Design and experiment of a multi-duct air-assisted sprayer airflow control system for orchards. J. Agric. Mach. 2020, 51, 298–307. [Google Scholar]
- Doruchowski, G.; Swiechowski, W.; Godyn, A.; Jaeken, P. Automatically controlled sprayer to implement spray drift reducing application strategies in orchards. J. Fruit Ornam. Plant Res. 2011, 19, 175–182. [Google Scholar]
- Jiang, Z.Y. Development and Experiment of Orchard Directional Profiling Mist Sprayer. Master’s Thesis, Shandong Agricultural University, Tai’an, China, 2014. [Google Scholar]
- Hoheisel, G.A.; Khot, L.R.; Moyer, M.M.; Castagnoli, S. Six Steps to Calibrate and Optimize Airblast Sprayers for Orchards and Vineyards; Washington State University: Pullman, WA, USA, 2021. [Google Scholar]
- Gu, C.; Zhao, C.; Zou, W.; Li, J.; Feng, X.; Wu, Y. Innovative leaf area detection models for orchard tree thick canopy based on LiDAR point cloud data. Agriculture 2022, 12, 1241. [Google Scholar] [CrossRef]
- Dou, H.J.; Zhai, C.Y.; Wang, X.; Yuan, J.; Zou, W.; Li, Q.; Chen, L.P. Design and experiment of the orchard target variable spraying control system based on LiDAR. J. Agric. Eng. 2022, 38, 11–21. [Google Scholar] [CrossRef]
- Wang, S.; Zhen, M.; Wu, Z.; Liu, M. Numerical Simulation of the Effect of Pressure on Nozzle Atomization Characteristics. J. Mech. Des. Manuf. 2020, 3, 51–54. [Google Scholar]
- Foqué, D.; Pieters, J.G.; Nuyttens, D. Spray deposition and distribution in a bay laurel crop as affected by nozzle type, air assistance, and spray direction when using vertical spray booms. Crop Prot. 2012, 41, 77–87. [Google Scholar] [CrossRef]
- Salcedo, R.; Zhu, H.; Zhang, Z.; Smith, T.; Johnson, P.; Lee, K. Foliar deposition and coverage on young apple trees with PWM-controlled spray systems. Comput. Electron. Agric. 2020, 178, 105794. [Google Scholar] [CrossRef]
- Rathnayake, A.P.; Chandel, A.K.; Schrader, M.J.; Hoheisel, G.A.; Khot, L.R. Spray Patterns and Perceptive Canopy Interaction Assessment of Commercial Airblast Sprayers Used in Pacific Northwest Perennial Specialty Crop Production. Comput. Electron. Agric. 2021, 184, 106097. [Google Scholar] [CrossRef]
- Li, J.; Li, S.; Yu, S. Study on Deposition Characteristics of Umbrella-Shaped Wind Field Anti-Drift Spraying Device. Trans. Chin. Soc. Agric. Mach. 2023, 54, 80–91. [Google Scholar] [CrossRef]
- Li, S.; Li, J.; Zhang, R.; Wang, Q.; Zhao, T. Spraying Performance of Umbrella Wind-Field-Type Atomization and Its Application to Parameter Optimization. Pest Manag. Sci. 2024, 80, 473–497. [Google Scholar] [CrossRef] [PubMed]
- Li, W.; Jiang, S.; Xu, P.; Chen, L.; Zhao, M. Design and Experiment of a Self-Propelled Small Target-Following Sprayer for Hilly Orchards. Trans. Chin. Soc. Agric. Mach. 2023, 54, 188–197. [Google Scholar] [CrossRef]
- JB/T 9782-2014; Plant Protection Machinery—General Test Method. Standards Press of China: Beijing, China, 2014.


| Parameters | Value |
|---|---|
| Overall dimensions (L × W × H) | 1830 × 1060 × 1040 |
| Airflow inlet diameter adjustment range (mm) | 0–600 |
| Airflow inlet area adjustment range (mm2) | 0–282,600 |
| Airflow outlet area (mm2) | 709,890 |
| Traveling speed (m·s−1) | 0–1.2 |
| Rotate speed of Fan (r·min−1) | 0–1500 |
| Spray tank (L) | 300 |
| Number of nozzles (units) | 12 |
| Nozzle spray rate (L·min−1) | 0–1.5 |
| Tree Number | T1 | T2 | T3 |
|---|---|---|---|
| Tree | 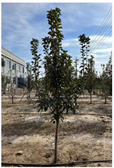 | 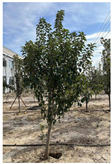 | 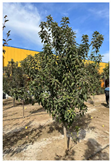 |
| Point cloud image |  |  |  |
| Canopy Dimensions (W × D × H)/m × m × m | 1.5 × 1.5 × 2.0 | 2.0 × 2.0 × 2.5 | 2.2 × 2.5 × 3.0 |
| Number of point clouds (units) | 3958 | 6889 | 9509 |
| Canopy leaf area (cm2) | 826.5 | 1409.8 | 1931.1 |
| Control Parameter | Graded 5 | Graded 4 | Graded 3 | Graded 2 | Graded 1 |
|---|---|---|---|---|---|
| Air inlet opening |  |  |  |  |  |
| Opening diameter | 600 mm | 500 mm | 400 mm | 300 mm | 200 mm |
| Opening area | 282,600 mm2 | 196,250 mm2 | 125,600 mm2 | 70,650 mm2 | 31,400 mm2 |
| number of rotations | 0 | 1.5 | 3 | 4.5 | 6 |
| Variation Source | Sum of Square | DF | F Value | p Value 1 |
|---|---|---|---|---|
| Model | 145.040 | 104 | 115.303 | 1.066 × 10⁻¹⁵ *** |
| Tree number (TN) | 49.895 | 2 | 2062.578 | 8.862 × 10⁻¹³ *** |
| Sampling position (SP) | 51.265 | 6 | 706.402 | 3.045 × 10⁻¹³ *** |
| Airflow grade (AG) | 32.660 | 4 | 675.051 | 1.301 × 10⁻¹¹ *** |
| TN × SP | 4.091 | 12 | 28.188 | 1.957 × 10⁻⁷ *** |
| TN × AG | 0.408 | 8 | 4.221 | 1.030 × 10⁻⁵ *** |
| SP × AG | 4.955 | 24 | 17.068 | 3.988 × 10⁻⁷ *** |
| TN × SP × AG | 1.766 | 48 | 3.042 | 2.101 × 10⁻⁸ *** |
| Variation Source | DF | Deposition | Coverage | ||||||
|---|---|---|---|---|---|---|---|---|---|
| Upper Leaf Side | Lower Leaf Side | Upper Leaf Side | Lower Leaf Side | ||||||
| F Value | p Value 1 | F Value | p Value 1 | F Value | p Value 1 | F Value | p Value 1 | ||
| Model | 104 | 404.098 | 1.025 × 10⁻¹² *** | 155.716 | 4.248 × 10⁻¹⁵ *** | 16.113 | 9.287 × 10⁻¹² *** | 17.496 | 6.451 × 10⁻¹⁵ *** |
| Tree number (TN) | 2 | 859.201 | 8.826 × 10⁻¹⁴ *** | 161.251 | 3.710 × 10⁻¹³ *** | 87.449 | 2.353 × 10⁻⁸ *** | 11,588.800 | 1.080 × 10⁻¹¹ *** |
| Sampling position (SP) | 6 | 47.244 | 2.748 × 10⁻⁸ *** | 1108.920 | 5.279 × 10⁻¹⁵ *** | 45.744 | 1.402 × 10⁻⁵ *** | 75.508 | 1.962 × 10⁻⁹ *** |
| Airflow grade (AG) | 4 | 28.747 | 5.664 × 10⁻⁸ *** | 55.925 | 4.672 × 10⁻¹² *** | 4.684 | 1.217 × 10⁻³ ** | 77.977 | 9.964 × 10⁻⁶ *** |
| TN × SP | 12 | 14.451 | 9.636 × 10⁻¹⁰ *** | 20.488 | 2.632 × 10⁻¹² *** | 3.025 | 6.115 × 10⁻⁴ *** | 3.172 | 1.475 × 10⁻¹¹ *** |
| TN × AG | 8 | 268.771 | 1.284 × 10⁻¹⁰ *** | 11.084 | 4.950 × 10⁻¹³ *** | 3.993 | 1.984 × 10⁻⁴ *** | 10.145 | 1.246 × 10⁻¹⁵ *** |
| SP × AG | 24 | 34.612 | 1.657 × 10⁻⁷ *** | 276.671 | 6.808 × 10⁻¹⁴ *** | 31.769 | 7.126 × 10⁻⁵ *** | 7.554 | 7.369 × 10⁻⁹ *** |
| TN × SP × AG | 48 | 404.098 | 1.025 × 10⁻⁷ *** | 42.085 | 2.636 × 10⁻⁸ *** | 7.853 | 7.976 × 10⁻⁷ *** | 28.902 | 1.256 × 10⁻⁵ *** |
| T1 | |||||||||||
|---|---|---|---|---|---|---|---|---|---|---|---|
| Graded | Graded 5 | Graded 4 | Graded 3 | Graded 2 | Graded 1 | ||||||
| Sampling Location | Deposition (drop/cm2) | Coverage (%) | Deposition (drop/cm2) | Coverage (%) | Deposition (drop/cm2) | Coverage (%) | Deposition (drop/cm2) | Coverage (%) | Deposition (drop/cm2) | Coverage (%) | |
| Top | Upper | 103.11(5.38) D | 35.09(2.37) b | 110.73(8.72) C | 33.44(3.31) b | 138.82(4.25) C | 33.78(4.90) a | 91.12(4.55) B | 25.72(3.28) a | 58.67(3.08) A | 22.5(2.67) b |
| Lower | 129.42(3.46) C | 29.29(5.90) bc | 127.84(2.86) C | 25.44(2.38) c | 127.14(6.75) B | 25.13(5.06) a | 64.01(3.94) A | 19.23(2.12) a | 30.85(4.99) B | 15.14(2.59) b | |
| Front | Upper | 99.56(5.42) C | 52.56(8.95) a | 97.7(9.72) B | 54.57(5.57) b | 115.98(4.42) A | 55.81(7.05) b | 70.62(4.46) D | 32.53(2.56) b | 50.66(1.93) D | 40.25(2.14) b |
| Lower | 97.56(4.79) A | 34.45(4.49) b | 109.04(6.84) C | 37.23(2.55) a | 107.09(3.74) B | 45.98(5.05) a | 51.56(5.66) E | 19.81(2.38) b | 44.22(4.01) D | 29.31(2.61) a | |
| Bottom | Upper | 141.72(7.32) A | 33.92(3.28) ab | 118.98(5.91) B | 45.17(4.59) bc | 134.55(3.92) C | 46.75(6.34) bc | 62.06(4.97) B | 40.08(3.86) c | 41.35(2.53) B | 38.65(3.35) a |
| Lower | 163.14(5.68) A | 30.89(9.28) a | 138.67(9.45) D | 31.78(1.95) b | 123.12(5.18) C | 38.06(3.24) a | 80.66(4.67) B | 13.44(0.52) a | 36.53(2.55) D | 24.64(3.60) a | |
| Left side | Upper | 61.56(3.42) C | 44.71(6.33) c | 76.93(5.66) D | 39.63(2.97) b | 84.76(4.56) C | 37.56(0.98) b | 50.59(7.63) A | 40.95(3.05) ab | 35.25(4.81) B | 25.18(2.20) a |
| Lower | 40.97(5.09) C | 21.31(5.62) b | 48.36(7.35) D | 39.34(3.71) ab | 74.36(4.97) E | 29.03(1.21) b | 33.45(3.34) A | 27.09(4.15) ab | 13.54(3.33) B | 11.69(1.63) a | |
| Right side | Upper | 84.15(7.00) C | 43.42(9.67) bc | 66.67(5.02) A | 41.39(6.76) b | 64.87(5.01) B | 40.32(5.24) a | 41.52(6.28) AB | 22.32(2.10) c | 20.48(3.77) C | 26.47(3.65) c |
| Lower | 55.98(6.03) D | 28.43(6.56) a | 44.77(7.01) A | 28.26(2.07) b | 83.08(3.85) B | 36.39(1.17) a | 58.81(4.68) A | 26.69(1.36) c | 19.57(4.13) C | 18.18(2.63) b | |
| Middle | Upper | 83.11(6.24) A | 38.35(4.70) a | 81.33(5.31) A | 39.33(3.68) b | 86.54(3.33) D | 23.72(4.20) b | 21.52(3.63) B | 26.32(2.99) b | 15.16(2.41) C | 29.45(3.94) b |
| Lower | 82.95(4.59) B | 22.78(2.94) a | 78.57(8.67) A | 22.78(3.17) ab | 94.85(4.11) D | 29.59(3.55) c | 44.56(6.35) C | 28.01(2.59) b | 25.86(3.79) E | 19.33(3.93) ab | |
| Backside | Upper | 48.36(3.18) D | 31.86(2.44) bc | 54.35(5.78) B | 31.55(4.06) bc | 73.11(6.78) B | 35.05(1.93) b | 45.66(5.12) C | 29.07(3.02) a | 10.41(2.37) A | 29.22(4.12) d |
| Lower | 50.97(6.17) BC | 22.82(2.69) c | 66.09(6.80) B | 22.11(3.34) b | 65.56(6.28) C | 30.34(0.36) ab | 31.81(4.74) C | 10.08(1.54) bc | 14.25(2.16) A | 12.08(1.63) a | |
| T2 | |||||||||||
|---|---|---|---|---|---|---|---|---|---|---|---|
| Graded | Graded 5 | Graded 4 | Graded 3 | Graded 2 | Graded 1 | ||||||
| Sampling Location | Deposition (drop/cm2) | Coverage (%) | Deposition (drop/cm2) | Coverage (%) | Deposition (drop/cm2) | Coverage (%) | Deposition (drop/cm2) | Coverage (%) | Deposition (drop/cm2) | Coverage (%) | |
| Top | Upper | 116.97(3.61) B | 29.99(6.22) d | 123.04(6.78) A | 24.12(6.28) c | 98.98(8.62) C | 23.11(3.36) b | 51.47(3.55) B | 20.57(2.51) a | 18.02(2.44) C | 9.42(1.45) e |
| Lower | 99.83(3.81) D | 38.98(3.28) b | 99.6(4.06) B | 30.89(2.52) c | 71.48(4.87) A | 26.45(1.61) c | 40.25(5.26) C | 20.52(3.10) a | 12.73(3.20) D | 10.18(1.04) c | |
| Front | Upper | 104.55(6.01) A | 42.19(3.80) b | 118.94(5.34) B | 44.57(4.69) a | 81.23(4.18) B | 44.72(3.58) c | 50.79(2.25) C | 46.08(4.06) d | 31.45(3.48) C | 49.65(5.19) c |
| Lower | 85.09(4.13) A | 31.83(4.14) b | 94.47(7.87) B | 29.56(6.40) a | 107.97(7.28) B | 25.63(1.76) b | 48.15(4.10) C | 34.01(3.57) c | 24.89(1.64) C | 29.31(2.58) c | |
| Bottom | Upper | 118.83(5.60) A | 46.51(5.57) c | 109.09(8.04) D | 35.17(4.42) c | 104.59(3.79) D | 33.95(2.95) b | 66.75(5.21) C | 38.89(2.09) a | 21.34(2.89) B | 40.02(4.52) bc |
| Lower | 109.04(8.38) A | 31.44(3.17) a | 108.24(7.09) C | 21.78(1.91) c | 118.81(8.18) B | 20.14(3.13) a | 69.12(8.24) B | 20.93(3.49) ab | 56.44(2.57) B | 12.46(3.35) bc | |
| Left side | Upper | 93.96(7.08) D | 39.95(3.48) c | 99.83(7.95) B | 28.96(3.67) a | 65.37(4.59) C | 29.68(3.55) c | 59.08(5.04) A | 26.56(2.60) bc | 58.77(3.74) B | 28.58(4.51) ab |
| Lower | 89.42(4.01) D | 21.63(5.61) c | 87.03(5.07) BC | 35.23(4.36) a | 84.82(5.28) C | 25.89(2.78) ab | 19.53(1.41) A | 17.98(2.50) c | 43.81(2.30) AB | 11.69(3.04) ab | |
| Right side | Upper | 60.19(4.43) C | 43.42(3.29) bc | 76.93(5.29) BC | 29.24(5.87) b | 78.49(5.05) AB | 47.32(1.04) a | 35.22(1.61) A | 42.78(2.63) c | 30.92(1.53) D | 16.41(1.68) b |
| Lower | 85.09(5.32) C | 48.43(8.51) c | 93.86(6.38) A | 28.26(4.69) bc | 90.13(9.83) BC | 31.39(2.70) b | 18.54(1.18) AB | 21.92(3.45) a | 14.58(4.51) D | 18.88(1.15) ab | |
| Middle | Upper | 50.17(6.60) C | 38.01(5.25) c | 78.83(8.52) BC | 25.56(3.36) b | 52.14(2.90) AB | 32.56(1.68) a | 18.35(1.29) A | 32.66(5.32) bc | 15.35(3.46) D | 17.45(2.75) b |
| Lower | 81.91(6.62) C | 14.36(3.84) a | 85.91(3.39) A | 22.05(1.55) bc | 34.99(2.59) C | 19.08(2.15) b | 16.54(3.54) B | 25.53(5.83) c | 15.76(0.81) D | 5.33(1.14) bc | |
| Backside | Upper | 38.45(7.38) D | 18.63(2.35) c | 44.35(3.53) C | 33.55(2.91) b | 23.11(1.91) C | 35.24(2.37) bc | 18.09(1.29) B | 21.15(4.35) bc | 21.55(3.28) A | 9.42(1.17) a |
| Lower | 21.25(1.06) C | 12.82(2.82) c | 30.09(4.65) B | 23.78(3.09) c | 20.56(1.25) B | 19.99(1.65) a | 11.15(1.61) B | 14.06(2.10) c | 10.87(1.94) A | 10.01(0.74) b | |
| T3 | |||||||||||
|---|---|---|---|---|---|---|---|---|---|---|---|
| Graded | Graded 5 | Graded 4 | Graded 3 | Graded 2 | Graded 1 | ||||||
| Sampling Location | Deposition (drop/cm2) | Coverage (%) | Deposition (drop/cm2) | Coverage (%) | Deposition (drop/cm2) | Coverage (%) | Deposition (drop/cm2) | Coverage (%) | Deposition (drop/cm2) | Coverage (%) | |
| Top | Upper | 80.32(4.68) A | 34.92(4.30) c | 72.36(4.62) B | 33.12(2.78) a | 59.31(5.07) B | 28.19(3.49) b | 33.72(3.25) B | 24.47(2.84) a | 11.78(1.43) C | 14.42(1.71) c |
| Lower | 99.26(6.51) B | 27.08(3.13) a | 88.46(5.93) B | 28.07(3.84) b | 70.16(6.61) A | 20.81(4.93) a | 45.39(5.52) A | 14.32(4.11) b | 6.96(1.68) C | 5.28(1.42) c | |
| Front | Upper | 120.68(7.16) A | 28.57(3.32) a | 125.59(5.58) A | 40.65(5.89) a | 88.23(5.89) B | 33.72(5.56) b | 55.88(4.88) C | 32.29(2.33) d | 20.325.62) C | 26.91(2.02) c |
| Lower | 115.09(2.95) A | 33.13(4.93) a | 91.99(4.09) B | 26.78(2.76) a | 108.09(7.83) B | 23.81(1.08) ab | 63.55(3.36) D | 20.01(4.77) c | 39.83(3.68) C | 10.31(0.84) bc | |
| Bottom | Upper | 99.93(5.79) A | 36.23(7.57) bc | 109.24(6.48) C | 25.27(3.82) cd | 99.91(5.51) C | 23.09(3.46) d | 59.23(3.23) B | 33.99(2.71) a | 26.86(2.56) B | 20.09(2.89) ab |
| Lower | 89.04(3.93) A | 43.46(6.05) a | 80.88(7.07) D | 30.18(4.94) b | 109.88(7.13) C | 20.06(5.17) b | 69.12(6.08) B | 20.93(5.20) b | 41.52(8.22) B | 17.66(1.82) b | |
| Left side | Upper | 101.24(6.90) D | 44.92(6.30) c | 109.13(3.10) C | 38.99(7.09) a | 65.37(3.81) C | 30.87(1.80) ab | 44.96(4.72) A | 29.61(3.01) c | 21.29(3.16) B | 27.89(2.78) ab |
| Lower | 91.19(2.77) C | 26.39(3.70) c | 82.37(8.20) B | 25.98(3.43) a | 85.25(6.44) B | 20.22(2.26) b | 30.23(5.90) A | 19.44(0.94) b | 23.68(6.44) A | 10.44(0.66) ab | |
| Right side | Upper | 109.82(5.65) C | 33.81(5.38) a | 66.91(5.66) A | 49.11(5.48) b | 54.89(8.16) B | 42.22(5.43) a | 45.67()3.39 C | 38.43(1.94) ab | 33.63(3.80) D | 14.25(0.26) b |
| Lower | 90.12(8.68) B | 28.43(2.57) a | 89.213(6.37) A | 28.78(2.63) a | 89.69(1.90) A | 31.04(3.23) a | 30.41(5.16) C | 19.94(3.59) a | 22.09(4.42) D | 17.39(1.13) b | |
| Middle | Upper | 60.59(5.33) A | 28.99(3.67) b | 48.83(4.29) B | 25.22(4.13) bc | 32.18(4.73) E | 21.68(3.79) d | 20.88(4.10) D | 18.73(2.50) c | 10.98(2.13) C | 19.95(2.58) a |
| Lower | 67.97(2.48) A | 22.77(2.48) a | 54.59(5.12) B | 12.33(1.30) b | 44.27(3.53) E | 10.96(1.33) c | 19.23(3.28) D | 9.43(1.09) c | 15.92(1.87) C | 10.35(2.49) ab | |
| Backside | Upper | 33.37(3.32) C | 21.52(2.20) c | 24.98(1.63) B | 6.65(1.07) bc | 19.23(2.92) A | 25.12(3.74) b | 15.09(2.44) A | 20.12(3.05) a | 9.52(1.34) A | 8.01(1.69) ab |
| Lower | 28.53(2.24) D | 10.03(1.06) c | 26.64(2.85) C | 6.99(1.52) b | 16.62(2.07) A | 11.94(1.35) b | 10.15(1.01) AB | 15.36(1.55) b | 2.81(0.83) B | 4.32(1.17) a | |
| Graded | Graded 5 | Graded 4 | Graded 3 | Graded 2 | Graded 1 | |
|---|---|---|---|---|---|---|
| Test Tree | Sampling Location | Coverage (%) | Coverage (%) | Coverage (%) | Coverage (%) | Coverage (%) |
| T1 | Ground | 12.75(1.95) c | 5.26(1.03) d | 5.85(1.15) b | 25.55(2.32) b | 34.47(2.57) a |
| Air | 23.73(2.61) a | 13.19(1.10) b | 5.31(1.36) c | 1.54(0.34) d | 1.43(0.57) d | |
| T2 | Ground | 21.83(1.87) ab | 15.92(1.91) d | 19.38(1.67) bc | 19.95(2.58) bc | 24.31(0.40) a |
| Air | 13.43(2.73) a | 8.43(0.74) b | 8.31(1.37) b | 1.54(0.40) c | 1.43(0.45) c | |
| T3 | Ground | 15.83(1.46) c | 27.23(2.86) b | 29.83(2.42) b | 30.46(2.06) b | 35.96(1.15) a |
| Air | 10.03(1.70) a | 9.95(0.98) a | 3.31(0.55) b | 1.43(0.45) c | 0.43(0.36) c | |
Disclaimer/Publisher’s Note: The statements, opinions and data contained in all publications are solely those of the individual author(s) and contributor(s) and not of MDPI and/or the editor(s). MDPI and/or the editor(s) disclaim responsibility for any injury to people or property resulting from any ideas, methods, instructions or products referred to in the content. |
© 2024 by the authors. Licensee MDPI, Basel, Switzerland. This article is an open access article distributed under the terms and conditions of the Creative Commons Attribution (CC BY) license (https://creativecommons.org/licenses/by/4.0/).
Share and Cite
Feng, F.; Dou, H.; Zhai, C.; Zhang, Y.; Zou, W.; Hao, J. Design and Experiment of Orchard Air-Assisted Sprayer with Airflow Graded Control. Agronomy 2025, 15, 95. https://doi.org/10.3390/agronomy15010095
Feng F, Dou H, Zhai C, Zhang Y, Zou W, Hao J. Design and Experiment of Orchard Air-Assisted Sprayer with Airflow Graded Control. Agronomy. 2025; 15(1):95. https://doi.org/10.3390/agronomy15010095
Chicago/Turabian StyleFeng, Fan, Hanjie Dou, Changyuan Zhai, Yanlong Zhang, Wei Zou, and Jianjun Hao. 2025. "Design and Experiment of Orchard Air-Assisted Sprayer with Airflow Graded Control" Agronomy 15, no. 1: 95. https://doi.org/10.3390/agronomy15010095
APA StyleFeng, F., Dou, H., Zhai, C., Zhang, Y., Zou, W., & Hao, J. (2025). Design and Experiment of Orchard Air-Assisted Sprayer with Airflow Graded Control. Agronomy, 15(1), 95. https://doi.org/10.3390/agronomy15010095