Abstract
Brazil is one of the countries that has the most agricultural area under no-till (NT) management. This research study aims to evaluate life-cycle greenhouse gas (GHG) emissions from maize (M) grain production in agroecosystems that used different cover crops under NT management in southern Brazil. The data for this study were from a long-term 41-year field experiment in southern Brazil. The long-term experiment evaluated the effects of fallow (F) and cover crops (oat (O), vetch (V), cowpea (B), pigeon pea (P), and lablab (L)) on nitrous oxide and methane emissions and soil carbon (C) sequestration in maize agroecosystems. Five cropping systems, FM, OV/M, OV/MB, PM, and LM, were evaluated. Our results show that cover crops can reduce life-cycle GHG emissions by ~40 to >100% through increased soil C sequestration. The agroecosystems with winter cover crops (OV/M and OV/MB) had higher life-cycle GHG emissions (0.5 kg CO2e kg−1 of M or 2.6 Mg CO2e ha−1) than the agroecosystem with winter F (0.06 kg CO2e kg−1 of M or 0.2 Mg CO2e ha−1). Summer cover crops (P and L) resulted in negative life-cycle GHG emissions (an average of −0.2 kg CO2e kg M−1 or −1.2 Mg CO2e ha−1) and increased the M grain yield. This study shows that cover crops can reduce greenhouse gas emissions from NT M in southern Brazil.
1. Introduction
In the last decade (2010–2019), global greenhouse gas (GHG) emissions were the highest on record, with an average annual emission value of 56 Gt CO2e [1]. The primary contributing sources of GHG emissions to the atmosphere are the following: CO2 from fossil fuel combustion and industrial processes; CO2 from land use, land use change, and forestry; methane (CH4); nitrous oxide (N2O); and fluorinated gases (F-gases: HFCs, PFCs, SF6, and NF3) [1]. These sources contribute to annual GHG emissions by 36, 5.7, 10, 2.6, and 1.2 Gt CO2e, respectively [1]. The sector of agriculture, forestry, and other land use (AFOLU) accounts for 22% (13 Gt CO2e) of the total global GHG emissions, being the second largest emitting sector that is also significantly affected by climate change [1]. The main regions in the world responsible for GHG emissions from the AFOLU sector are Africa, Latin America, and Southeast Asia, with Latin America having the highest absolute and per capita AFOLU GHG emissions of any world region [1]. Brazil, one of the seventh largest emitters of GHGs globally, is responsible for 3% of global emissions. In 2021, 2.4 Gt CO2e were emitted, with the AFOLU sector being the largest source of Brazilian emissions, 74% of its total GHG emissions. These emissions are divided between agriculture, which is responsible for 25%, and land use change and forest use, which account for 49% of Brazilian GHG emissions [2]. On the other hand, the agricultural sector, which is responsible for GHG emissions, can also promote their mitigation [2]. The Greenhouse Gas Emissions and Removals Estimation System (SEEG) at the Brazilian Climate Observatory [2] estimated a carbon balance for Brazil in 2021 and found the agricultural sector has a net removal of 229 Mt of CO2e. No-till (NT) systems were responsible for the removal of −67.5 Mt CO2e [2].
NT management is known as the most practiced conservation agricultural technique in the world and is used on approximately 125 million hectares of cultivated land globally [3]. As opposed to traditional tillage practices, NT management only clears a line of aboveground crop residue for direct planting at a specified depth, with minimal disturbance to soil below a few centimeters. However, NT land represented only ~10% of cultivated land, and its adoption rate depends on the context or country-specific factors [3]. The countries with the largest NT area are the USA, Brazil, Argentina, Canada, and Australia, in descending order. Latin America is the region with the highest percentage of NT land by area globally, with Brazil, Argentina, and Paraguay representing >70% of the total croplands under NT management in the world [3]. According to Kassam et al. [4], 68.7% of the cropland area in Latin America is under conservation agriculture. In Brazil, 19% of the farmers used NT management, with an average of 33 million hectares under NT management [5].
The use of NT management brings some benefits to farming systems, mainly related to soil quality and reductions in labor and energy use, resulting in reduced environmental impacts [6]. The use of NT management can reduce GHG emissions from agriculture, especially CO2 and N2O emissions from fields, and can sequester carbon in the soil [7,8]. According to Zaher et al. [9], NT management decreased nitrification and denitrification rates and reduced N2O emissions from soil. However, during the first years of NT management, there can be higher N2O emissions that are followed by a decrease because of increased soil aggregation [10]. Converting to NT management from conventional tillage (CT) practices could reduce GHG emissions associated with field emissions of maize by 53% because of more carbon (C) sequestered and less N2O emission from the soil; in addition, NT management can reduce diesel fuel use by 12% to 44% [11]. NT management’s reduced use of resources, like labor, machinery, and energy, have allowed farmers to increase their land area for farming systems [12]. According to Kim and Dale [13], negative GHG emissions in maize production are associated with increases in soil organic carbon levels under NT conditions, which could sequester between 1.0 and 1.4 kg CO2e per kilogram of maize, while N2O emissions from fields ranged from 10 to 13 g CO2e per kilogram of maize. Silva et al. [7] also found in NT systems with cover crops that soil C sequestration can mitigate all the GHG emissions from maize production farming systems in Brazil. In fact, obtaining the ability to fully mitigate GHG emissions is not dependent on tillage only, but on numerous practices, one of which is the use of cover crops.
Farming’s CO2 emissions have been found to mainly be dependent on the characteristics of individual agroecosystems [9]. The use of NT management with large amounts of crop residues in fields can contribute significantly to the reduction in GHG emissions in maize production [7]. Thus, according to Abdalla et al. [14], the use of cover crops in agroecosystems can supply a larger amount of crop residues than cropping systems that use only maize or cash crops with fallow. These agroecosystems could be annual, biennial, or perennial herbaceous plants grown in a pure or mixed stand [14]. When using legume cover crops, they can reduce N fertilizer requirements for the subsequent crops through biological N fixation, while non-legume crops can increase the plant biomass input to the soil. In conditions of the USA, Camargo et al. [15] found that NT maize cultivation using a legume cover crop can reduce GHG emissions by 42% compared to CT using N mineral fertilization. Silva et al. [7] found in their study on southern Brazil that the use of non-legume winter cover crops had lower GHG emissions by area than using legume winter cover crops under NT management, because of reductions in N2O emissions, although the agroecosystem with the legume cover crop had a higher yield because of N supplied by the legume. Malhi et al. [16] found in a long-term study that maintaining crop residues in soil with the use of NT management improved soil properties more than CT, whereas N fertilization in CT resulted in higher N2O emissions than those in NT management. Poeplau and Don [17] in a meta-analysis found that cover crops could reduce GHG emissions from agriculture by 8% at a soil organic carbon (SOC) sequestration rate of 0.12 Pg C yr−1. Bayer et al. [18] found in their study that summer cover crops in succession or in consortium with maize can mitigate GHG emissions by soil C sequestration, although they can have higher N2O and CH4 emissions than simpler agroecosystems because of a high amount and the quality of biomass input to the soil. Therefore, the potential of cover crops to mitigate GHG emissions depends on the species used and the arrangement present in the agroecosystem.
In this study, our focus was to evaluate how the use of cover crops influences GHG emissions from NT agroecosystems that produce maize grain in southern Brazil. Quantification of GHG emissions in distributed complex systems uses the life-cycle assessment (LCA) method to quantify resource use and emissions that occur in supply chains in the production of specific products. The LCA can be used to estimate the environmental impacts from a farming system, but the results depend on the context and system boundaries of the study, being either “cradle to grave” or “cradle to farm gate” [19]. The LCA includes an evaluation of the processes of resource acquisition, production of primary materials and infrastructure, transport, processing, and recycling associated with the supply chain [20]. All the resources used and related emissions are summarized into impact categories, such as the GHG emission intensity [19]. The central aim of this study was to use the LCA to evaluate and compare the life-cycle GHG emissions from NT agroecosystems in a long-term experiment that incorporates different cover crops. Net life-cycle GHG emissions were estimated primarily based on measurements of changes in soil organic C (SOC) and chamber measurements of N2O and CH4. Through this study, we aimed to identify the primary sources and magnitudes of individual GHG emissions and, thus, the leverage points for the optimization of NT agroecosystems that produce maize grain.
2. Materials and Methods
2.1. Description of Field Experimental Design
This research was carried out in a long-term field experiment that evaluates NT management and cover crops installed at the Agricultural Experimental Station of the Federal University of Rio Grande do Sul—EEA/UFRGS. EEA/UFRGS is located at geographic coordinates 30° 50′ 52″ S and 51° 38′ 08″ W in Eldorado do Sul, RS. The area’s relief is undulating, with an average altitude of 46 m, and the predominant native vegetation is grassland, mainly composed of low grasses, such as Paspalum and Andropogon, with Desmodium.
The experimental soil is classified as a sandy clay loam granite-derived Acrisol [21] or Typic Paleudult, according to soil taxonomy [22], with 220 g kg−1 of clay. The main minerals in the clay fraction are kaolinite (720 g kg−1) and iron oxides (109 g kg−1). The experimental NT maize agroecosystems began in 1983 in an area that had been previously cultivated for 14 years with rapeseed and sunflower under CT. The experimental design is composed of three randomized blocks containing five treatments with plots of a size of 80 m2 (16 × 5 m). Five agroecosystem treatments were cultivated: uncovered soil, fallow/maize (Zea mays L.) (F/M), oat (Avena strigosa Schreb.) + vetch (Vicia sativa L.)/maize (OV/M), oat + vetch/maize + cowpea (Vigna unguiculata L.) (OV/MB), pigeon pea (Cajanus cajan L.) + maize (PM), and lablab (Lablab purpureus L.) + maize (LM). Annual fertilization was 50 kg ha−1 of P2O5 and 50 kg ha−1 of K2O incorporated into the sowing line; all the treatments had no nitrogen applied. Winter cover crops were sown in May, while summer cover crops were sown in December. Maize was always planted with an NT planter in September–October, with minimal disruption below the soil surface, at an approximate population of 50 to 60 thousand plants per hectare.
2.2. Goal and Scope
The goal of this study was to evaluate the life-cycle GHG emissions from the production of maize grain in southern Brazil by employing different configurations of agroecosystems. The methodology employed used the Feedstock Carbon Intensity Calculator (FD-CIC), a field-to-farm-gate LCA model derived from the GREET model (https://greet.anl.gov/tool_fd_cic; accessed on 1 December 2023) [23]. The treatments used F/M, OV/M, OV/MB, PM, LM. We chose these farming systems because we have GHG emission data available for our study, while the other treatments were not measured. This study makes contributions to the maize LCA literature on tropical agriculture, particularly Brazil, by relying on a range of studies of field GHG emission measurements and measured soil C sequestration. The analysis points to crop and soil management options to mitigate GHG emissions.
2.3. Functional Units and System Boundary
We used two functional units to represent GHG emissions from summer-season NT maize production with different winter-season cover crops. One unit represents the GHG emission intensity per cultivated hectare of land per year, and the other represents the GHG emission intensity per kilogram of maize grain. We used both metrics to enable us to explain the results more completely and to distinguish the effects of different inputs or management practices per area and relative to the different yields.
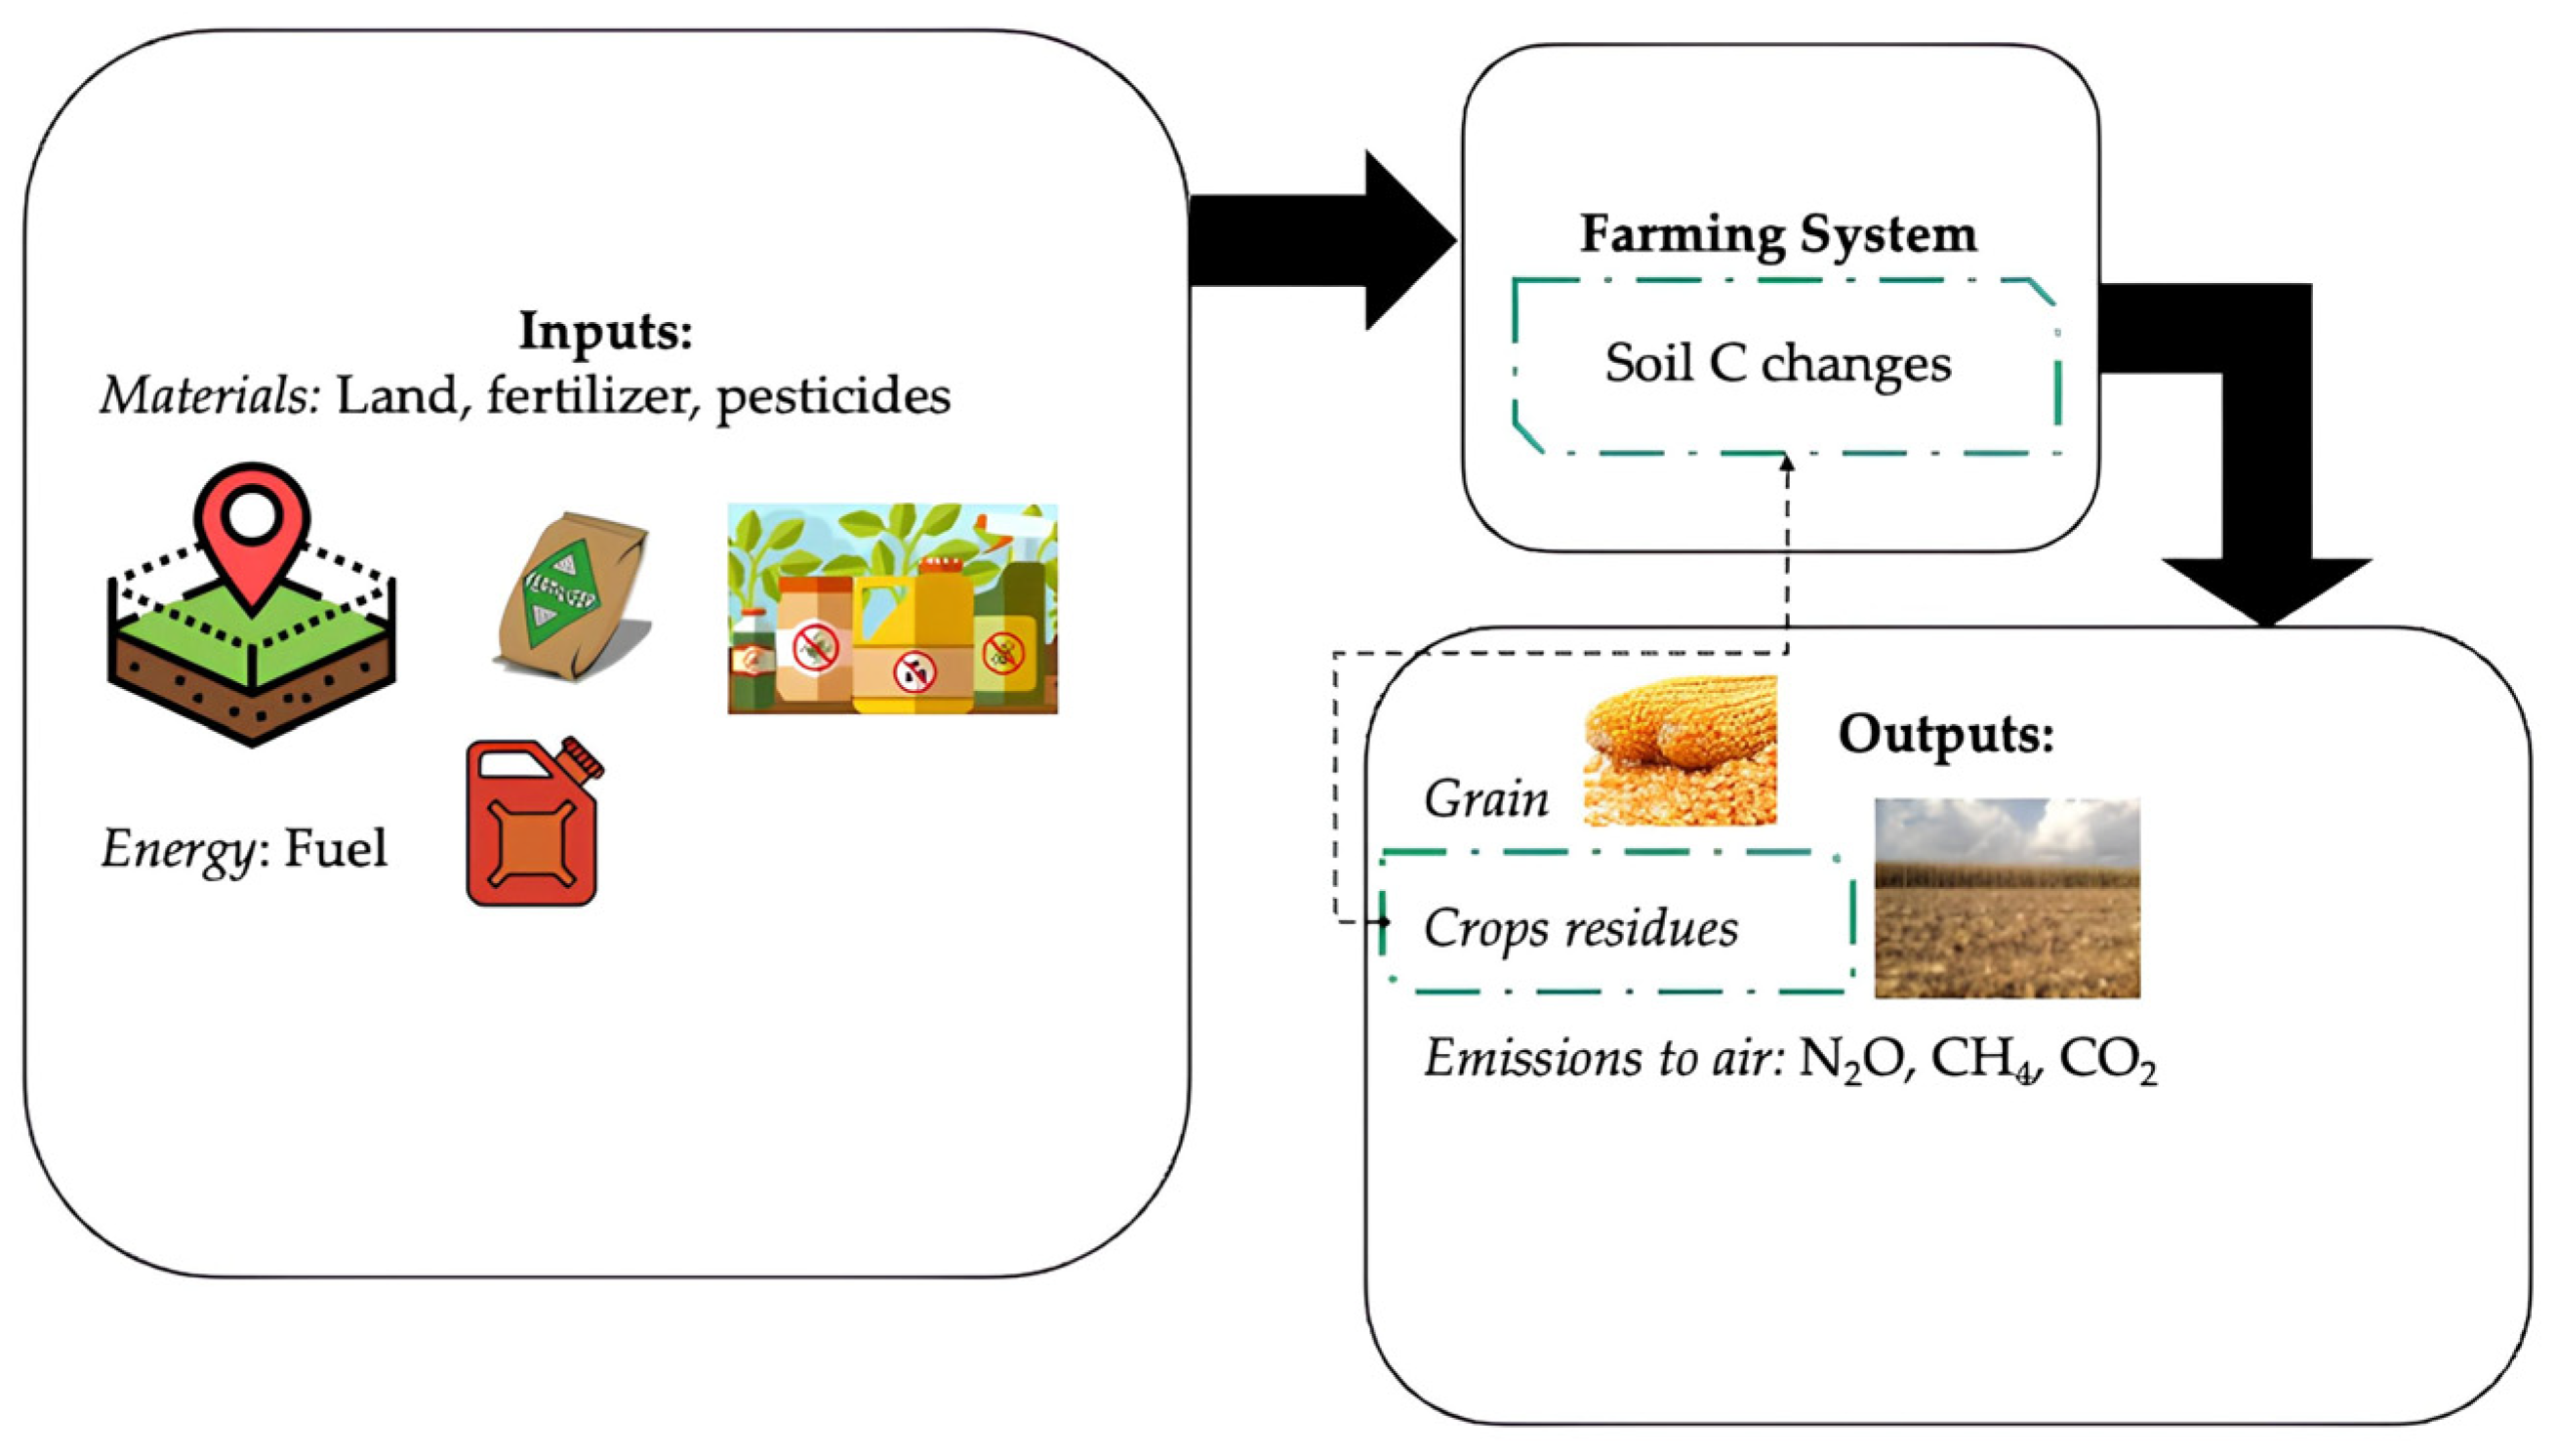
The system boundary (Figure 1) of our analysis encompasses field-to-farm-gate activities to quantify the emission intensity of maize production based on three GHGs, namely, CO2, CH4, and N2O. The energy expenditure and material flows associated with upstream fertilizer/chemical manufacturing and feedstock production stages are important components of field-to-farm-gate GHG emissions.
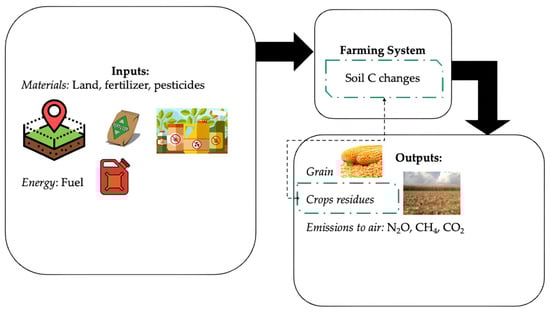
Figure 1.
System boundaries of the farming systems in the life cycle of maize grain production “from field to farm gate”.
2.4. Data Collection and Inventory Data
Emission data were measured in a long-term experiment for the main GHGs, N2O and CH4, during the 2003/2004, 2009/2010, 2010/2011, and 2011/2012 harvests, but not all the farming systems were measured during all the harvests. In 2003/2004, the farming systems where GHG measurements were collected were OV/MB, PM, and LM; in 2009/2010, measurements were taken for OV/M, OV/MB, and LM; in 2010/2011 and 2011/2012, measurements were taken for F/M, OV/M, and OV/MB. Gas collections began on the first or third days after soil preparation and management of cover crops; collections were more frequent up to 60 days after management and were subsequently carried out at intervals of every 15 days, and 30 collections were carried out per year.
To evaluate GHG emissions, the chamber method was used, with one chamber per plot, which was composed of two components: (i) an aluminum base (40 × 80 cm) inserted into the ground at a depth of 5 cm and (ii) an aluminum lid that was fitted onto the aluminum base during collection, constituting the sampling chamber. The lid has a carrying handle and holes to which a digital thermometer, an air collection extender, and the wiring for connecting the battery are connected. Internally, the chamber has two cooler-type fans.
Air samples were collected between 9:00 and 11:00 a.m., and emissions were considered as equivalent to average daily emissions. Samples were collected using BD® polypropylene syringes, with a volume of 20 mL, which were subsequently stored in a Styrofoam box at a low temperature [7]. The samples were analyzed using gas chromatography at the Environmental Biogeochemistry Laboratory of the Federal University of Rio Grande do Sul. Quantification was carried out using Shimadzu GC-2014 equipment in a model “greenhouse” under the following chromatographic conditions: a Porapak-Q column at 70 °C, N2 carrier gas at 30 mL min−1, a methanator at 380 °C, an FID detector at 250 °C, and an ECD at 325 °C.
We used the annual averages of N2O and CH4 emissions (Table 1) to calculate our study’s GHG emission intensity. Annual cumulative emissions were estimated by integrating daily fluxes in the collection period.

Table 1.
Field N2O and CH4 emissions for the agroecosystems and research thesis sources.
The equation used to calculate the gas flux was
where Q is the mass of the gas (µg N2O or CH4 m−2) inside the chamber in the time interval t (hour−1); P is the pressure inside the chamber, assumed to be 1 atm; V is the volume of the chamber (L); R is the universal gas constant (0.08205 L atm K−1 mol−1); T is the internal temperature (°K) inside the chamber; A is the area of the chamber (m−2).
f = ΔQ/Δt × PV/RT × 1/A,
The SOC stocks and soil C sequestration rates (SOC storage rates) used in this study were calculated by Vieira [27] in his thesis (Table 2). Soil samples from 0 to 30 cm layers were collected in October 2002. The rates of change were determined by comparing the treatments with the control and dividing by the length of the experiment: 19 years (1983–2002). Trenches were excavated with a backhoe to allow for the measurement of the soil bulk density in duplicate, using the volumetric ring method [28]. The soil samples were air-dried, ground, and sieved to 2 mm. After homogenization, a portion of each sample was ground in a mortar (0.5 mm) and subjected to C and total nitrogen analysis using dry combustion in Shimadzu TOC-V CSH equipment. SOC stocks were calculated using the equivalent mass method [29]. In this study, measured changes in SOC were used as a proxy for changes in CO2 emissions because SOC increases are because of more biomass input to the soil, and that biomass C is accumulated from atmospheric CO2.
Table 2.
Soil organic C (SOC) stocks and SOC storage rates [27].
Average maize yields of the experimental farming systems were taken and calculated from 1983/84 to 2021/22, except for the 2019/20 season, where samples were not collected because of the COVID-19 pandemic.
The inventory data are contained in the results section.
2.5. Life-Cycle Impact Assessment
The long-term experimental data were incorporated into the Feedstock Carbon Intensity Calculator (FD-CIC) dynamic model version 2022 (greet.es.anl.gov/tool_fd_cic; accessed on 10 October 2023). Users can change the FD-CIC default settings that affect the GHG emission intensities from farming inputs and outputs. To run the model, the initial step involved incorporating production information for a maize grain into the “Maize Inputs” sheet. The relevant quantities were recorded in the “User Specific Value (NT with cover crops)” or “Default GREET (NT with fallow)” columns.
Modifications were made to the “Maize Results” sheet of the program to include GHG emission measurements from the long-term experiment; in default mode, CH4 is not shown in the model, and N2O emission rates are calculated based on nitrogen application rates, not external measurements. Specifically, the values for “N2O emission due to nitrogen fertilizer and biomass residue” in row 18 were set to zero. Instead of relying on model calculations for these emissions, the measured soil C sequestration data (a proxy for CO2) and CH4 and N2O emission measurements were included in rows 37, 38, and 39, respectively, using the necessary unit conversions.
2.6. Uncertainty Analysis and Comparison of Agroecosystems
Because of temporal factors that affect GHG emissions from fields in maize production, each GHG emission value in the maize life cycle has inherent variability. The relative impacts of GHG emissions were assessed in a sensitivity analysis, where average and standard deviation values were used in the LCA model. Monte Carlo simulations were applied to evaluate parameter variability and to generate a probability distribution of the expected GHG emission intensities. The program @Risk, by Palisade Corporation, was used to perform 10,000 iterations of outputs by varying three parameters, consistent with their probability of occurrence (Table 3). The SOC sequestration rate, and CH4 and N2O emissions from the field were assigned normal distributions based on the standard deviation (SD) found in the databases from the theses of this experiment.
Table 3.
Annual emissions from SOC changes, CH4 from soil, and N2O from soil used in Monte Carlo analysis to estimate the GHG emission intensities of maize production in different agroecosystems. SOC sequestration rates in Table 2 were converted to CO2 equivalents.
Analysis of variance (ANOVA) was performed using the software R 4.4.2 with the ExpDes package [30] to assess the differences between the agroecosystems; significant results (p < 0.05) were compared using the Tukey test (p < 0.05). ANOVA was performed on SOC stocks, SOC sequestration rates, and CH4, N2O, and GHG intensities.
3. Results
3.1. Life-Cycle Inventory (LCI) Analysis
In the LCI step, as a part of the LCA, an inventory table was constructed for maize grain production for each of the agroecosystems studied (Table 4); it should be noted that all the input values are the same except for the crop yields. The input data for the analyzed agroecosystems in the FD-CIC model were the quantities of the means of production used. The output data for the assessment of agroecosystems in the FD-CIC model were the quantities of the sources of GHG emissions (Table 5).
Table 4.
Life-cycle inventory annual inputs for the five agroecosystems.
Table 5.
Annual GHG emissions from the agroecosystems per hectare. Superscript letters compare farming systems in lign; means with the same letter do not differ significantly according to the Tukey test (p < 0.05).
3.2. GHG Emissions from the Agroecosystems
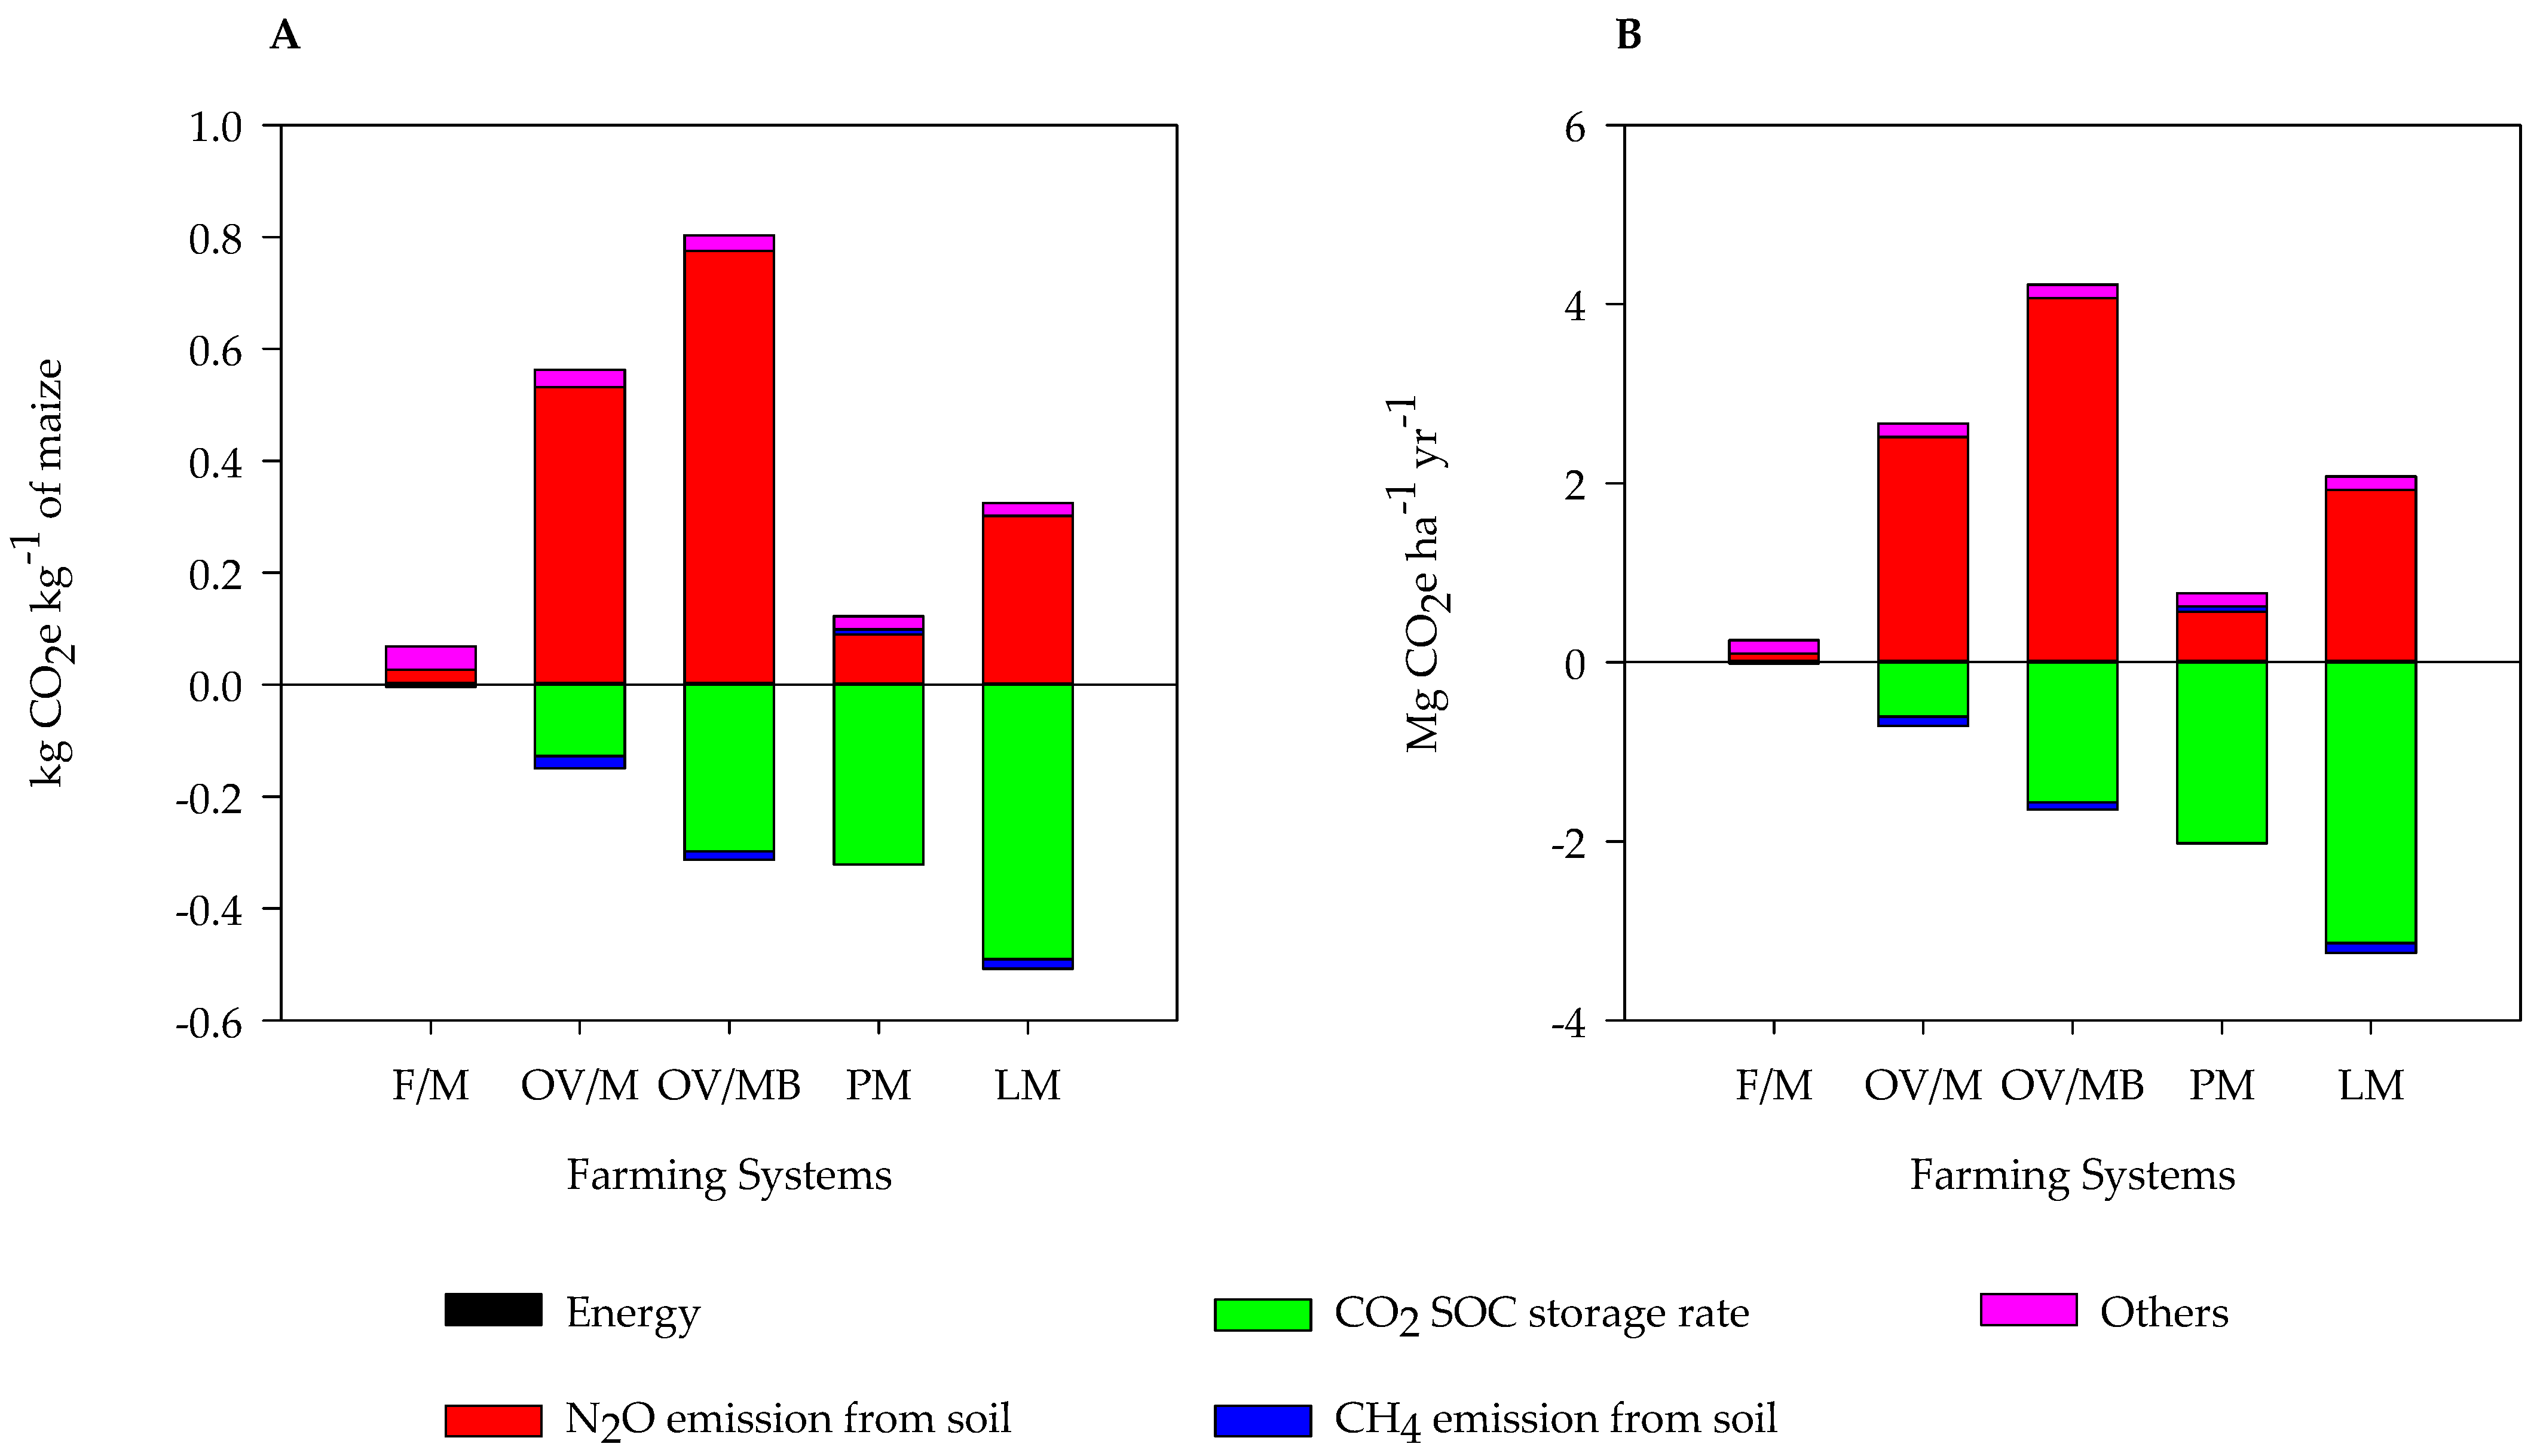
In our results, shown in Figure 2, N2O was the dominant source of GHG emissions from the agroecosystems. The N2O emissions from the soil varied from 82.7 to 4057.3 kg CO2e ha−1, where agroecosystems using cover crops had higher emissions than the agroecosystem with fallow. The OV/MB agroecosystem had more cover crop rotations, being two legume cover crops per year, and had the highest N2O emissions per kilogram of maize and per hectare. The agroecosystems (PM and LM) that used summer cover crops (pigeon pea and lablab) had lower N2O emissions than the farming systems that used winter cover crops (oat and vetch), where summer cover crops had one-quarter of that emitted per kilogram and one-third of that emitted per hectare compared to the agroecosystems that used winter cover crops. The soil had a behavior as a sink of CH4 in almost all the farming systems, except for the PM farming system, which emitted 55.4 kg CO2e ha−1 of CH4; the CH4 influx was from −14.3 to −109.3 kg CO2e ha−1 of CH4 for F/M, OV/M, OV/MB, and LM. The highest influx of CH4 was in the OV/M farming system. The CO2 emissions from the soil were from −3137.9 to 7.4 kg CO2e ha−1, where measured soil C sequestration rates were a proxy for CO2 emissions. The LM farming system had the lowest CO2e emissions per kilogram of maize and per hectare. The use of chemicals was the third highest source of GHG emissions, and energy was the fourth highest source, responsible for 148 kg CO2e ha−1 and 12.2 kg CO2e ha−1, respectively.
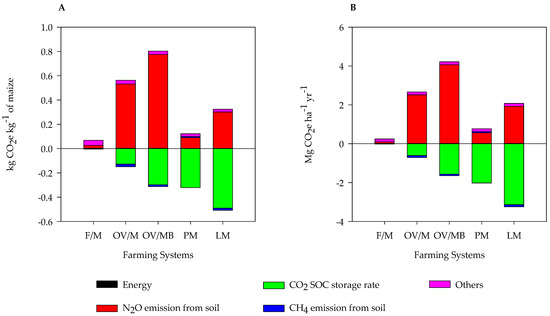
Figure 2.
Greenhouse gas emissions per kilogram of maize (A) and hectare (B) from five agroecosystems. Net annual soil CO2 emissions were calculated by taking the annual soil C storage rates in the agroecosystems compared to F/M system (control experiment).
In the five farming systems analyzed, N2O emissions and SOC sequestration rates predominantly affected the GHG emission intensity in the life cycle of maize production (Figure 2). Monte Carlo analysis was used to analyze the effects of variations in SOC sequestration rates and CH4 and N2O emission rates on the life-cycle GHG emissions intensity of the agroecosystems. The N2O emissions from the field were likely the most uncertain parameter when considering farming systems of maize production. This parameter was significant for GHG intensity because it depends on the amount of the biomass yield per year, the amount of N contained in the biomass, and the weather conditions for decomposing biomass by microorganisms’ nitrification and denitrification processes to produce N2O. SOC sequestration rates vary because of the randomized arrangement in the experimental field.
The estimated GHG emission intensities ranged from −7408.5 to 6215.1 kg CO2e ha−1 for the agroecosystems (Table 6). Monte Carlo analysis provided data with a 90% confidence interval for each agroecosystem. The ranking of the farming systems according to Monte Carlo analysis together with ANOVA (Figure 3) was PM, LM, F/M, OV/MB, and OV/M, from the lowest to the highest average life-cycle emissions. However, Monte Carlo analysis showed that there were situations in which the farming systems changed their position in this ranking (Table 6). Using the minimum values, the alternative agroecosystems reduced emissions more than F/M; this is the best simulation scenario. However, using the maximum values is the worst scenario because F/M has the least emissions compared to those of the other agroecosystems.
Table 6.
Summary of Monte Carlo analysis of GHG CO2e ha−1 outputs from each farming system.

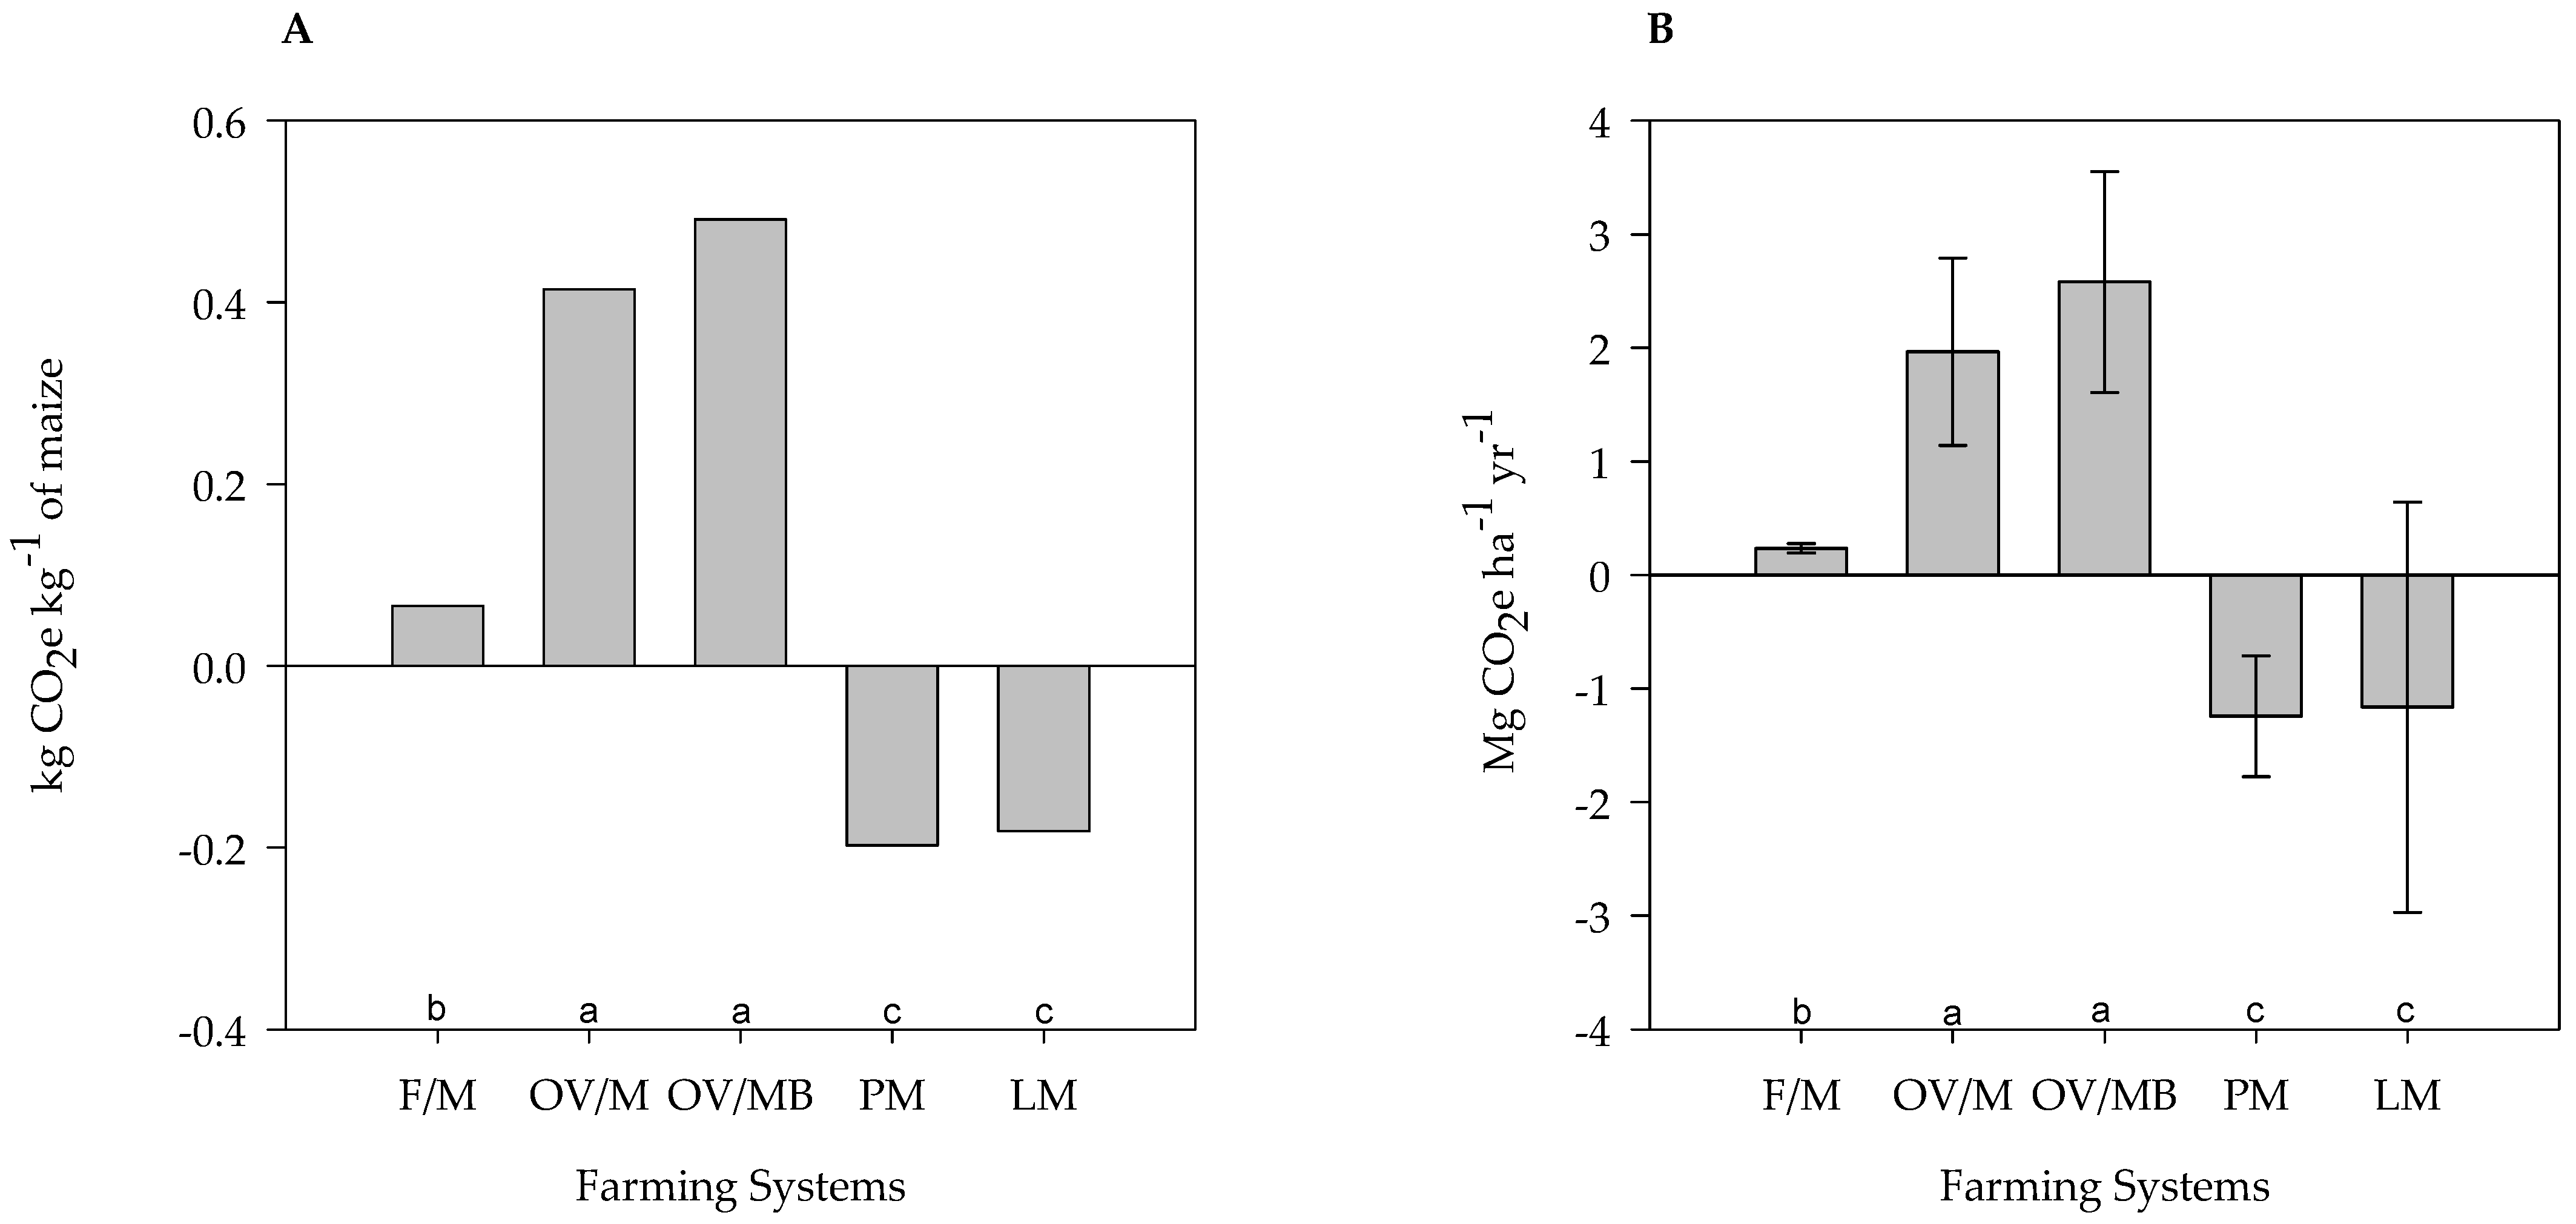
Figure 3.
Life-cycle GHG emission intensities per kilogram of maize (A) and hectare of maize (B) for five agroecosystems; the sum of the data in Figure 2 is shown here. Monte Carlo averages and standard deviations are from Table 6; standard deviations are shown as error bars. Letters compare farming systems; means with the same letter do not differ significantly according to the Tukey test (p < 0.05).
The calculated life-cycle GHG emission values for one hectare of each agroecosystem of maize grain cultivation area were from −1.2 to 2.6 Mg CO2e ha−1 (Figure 3B). The agroecosystems where cover crops were cultivated together with maize in the summer season had a life-cycle GHG emission value with an average of −1.2 Mg CO2e ha−1, while the OV/MB agroecosystems with two winter cover crops had the highest life-cycle GHG emissions, with an average value of 2.6 Mg CO2e ha−1. Our study shows that the life-cycle GHG emissions per one kilogram of grain amounted to 0.07 kg CO2e (Figure 3A) in the F/M farming system, which had a positive GHG emission value; the farming systems OV/M and OV/MB were not able to mitigate their GHG emissions and showed positive values of GHG emissions as well.
4. Discussion
Cover crops improved the resource use efficiency in these farming systems because of increases in crop yields compared to that of fallow. According to Blanco-Canqui et al. [31], the use of cover crops can increase crop yields if it is associated with long-term improvements in soil organic C, soil N, and soil properties. The adoption of legume cover crops in farming systems can provide atmospheric N fixation that can increase crop yields [32,33,34]. The use of crop rotations can improve the eco-efficiency of the agroecosystems, mainly via the use of legume cover crops, which enables a reduction in the use of synthetic N fertilizer, providing a higher efficiency per unit of input [33,34,35,36].
The treatments with the highest N2O emissions had more crops per year. Although the F/M farming system had the least N2O emissions, according to Bayer et al. [37], this was because of the relatively low biomass production of winter plants that grow during the fallow period and possibly because of less N availability compared to that in the other rotations. Legume cover crops have been found to reduce agricultural N2O emissions indirectly by reducing inorganic N fertilizer and manure application requirements [31]. Yet, agroecosystems with crop succession showed higher N2O emissions. Among the successions, the treatment with the introduction of cowpeas in spring/summer showed higher emissions than the treatment without this legume. The OV/MB farming system has the highest N2O emission intensity, followed by OV/M. This short-term effect is related to the increase in the availabilities of C and N in the soil, through the mineralization of N-containing plant biomass and soil organic matter, increasing the substrate for N2O production processes in the soil [38,39]. As we have found in this study, other studies [40,41,42,43] found, in a tropical area, higher N2O emissions when adding residue compared to another fallow area. These results indicate that the soil in the different agroecosystems, mainly with summer cover crops, even with higher N2O emissions, produced lower life-cycle GHG emissions than the agroecosystem with fallow because of soil C sequestration and higher crop yields. Although more N2O measurements should be performed to confirm these life-cycle results, these long-term results demonstrate the beneficial environmental effect of including cover crops in agroecosystems to lower life-cycle GHG emissions.
All but one agroecosystem in this study was a sink of CH4. Rainfed agroecosystems generally do not have large methane emissions because methanotrophs prevail in larger populations over methanogens in upland soils [44]. Thus, CH4 oxidation in soil is mediated by methane monooxygenase, which requires the presence of O2 [44]. According to Grassmann et al. [44], tropical clay soil is a weak sink for CH4 because of methanotrophs. In our study, only PM had significant positive CH4 emissions into the atmosphere, but this resulted from data from the first GHG measurements in this experiment; the observed positive emissions could also be because this agroecosystem had only a few years of data.
Soil C sequestration, in this study, was able to mitigate from ~40 to >100% of GHG emissions from agroecosystems. A study by Silva et al. [7] observed that soil C sequestration in agroecosystems under NT management can mitigate all the GHG emissions compared to CT. Six et al. [10] report that systems under NT management, in general, sequester C in the soil. However, the mitigation of GHG emissions is possible if the impact of this soil C sequestration reduces the GHG emissions to next to zero or negative GHG emissions, as shown in this study, which used SOC measurements down to 0.3 m. Cover crop systems with summer legumes, from environmental and productivity points of view, were the most efficient in allowing the accumulation of soil C and increased the productivity of the maize crop. Numerous studies [18,37,45,46] have observed that NT management with summer cover crops in agroecosystems promotes soil C sequestration in low-fertility soils in the tropics and subtropics because of the high production of biomass by summer cover crops. The importance of creating management conditions that allow for the maximum rate of C sequestration in the soil makes the farming system a potential GHG emission mitigator.
Our life-cycle assessment demonstrates that the crop rotation strongly affects GHG emissions, primarily because of differences in the cover crops used. The PM and LM farming systems showed overall negative GHG emissions. The OV/M system had the greatest environmental impact related to GHG emissions. The agroecosystems with cover crops in winter and summer had higher GHG emissions than the agroecosystems with fallow because of increased N2O emissions from crop residues. The same behavior was found by Prechsl et al. [19] in a similar experiment in Switzerland. Holka and Bieńkowski [47] measured GHG emissions of 1868.7 kg CO2e ha−1 from maize grain production in Poland under NT management, which is similar to our results. For GHG emissions per kilogram of maize, our results were also similar to those found by Keshavarz Afshar and Dekamin [48], with results between 0.112 and 0.252 kg CO2e kg−1 for maize under NT management. Although some studies [49,50,51,52] indicate that a greater diversity of crops can decrease GHG emissions, our data from this study showed that summer cover crops might have greater potential in mitigating GHG emissions than higher diversity crops (OV/M and OV/MB). This study shows how challenging it is to mitigate GHG emissions from agricultural systems that already adopt conservation practices, such as NT management. However, this study still shows that it is possible to reduce emissions with the appropriate crop rotations (PM and LM). Around 33 million hectares of agricultural area are under direct planting in Brazil, and these agroecosystems need to be improved to reduce their GHG emissions. This study provides evidence that the use of legumes with summer cover crops has high potential to increase soil C sequestration to mitigate other GHG emissions, particularly N2O, in the life cycle of maize production.
5. Conclusions
This research assessed the life-cycle GHG emissions of five maize agroecosystems under NT management, based on data from a long-term field experiment. The comparison of the five farming systems, based on GHG emissions, showed greater performance for PM and LM compared to F/M, even though F/M has the lowest N2O emissions. The obtained results reveal that cover crops can play an important role in increasing the grain yield of the maize in agroecosystems in southern Brazil; cover crops were found to increase the grain yield for the agroecosystems by ~30–80% compared to F/M.
Our work shows that the use of cover crops in agricultural systems can help to mitigate some of or all the life-cycle GHG emissions of maize production. This study shows that the use of summer cover crops is an efficient strategy for mitigating GHG emissions and increasing maize productivity in NT agroecosystems.
Author Contributions
Conceptualization, G.R.d.S., A.J.L. and C.B.; methodology, G.R.d.S., A.J.L. and C.B.; software, A.J.L.; validation, G.R.d.S., A.J.L. and C.B.; formal analysis, G.R.d.S.; investigation, G.R.d.S.; resources, A.J.L. and C.B.; data curation, C.B.; writing—original draft preparation, G.R.d.S.; writing—review and editing, G.R.d.S., A.J.L. and C.B.; visualization, A.J.L. and C.B.; supervision, A.J.L. and C.B.; project administration, C.B. and A.J.L.; funding acquisition, C.B. All authors have read and agreed to the published version of the manuscript.
Funding
This research was funded by the National Institute of Science and Technology in Low-Carbon-Emission Agriculture (INCT-ABC), sponsored by Brazil’s National Council for Scientific and Technological Development (CNPq, grant no. 406635/2022-6); the Foundation for Research Support of the State of Rio Grande do Sul (FAPERGS, grant no. 22/2551-0000392-3); Bayer Crop Science S.A., through the ProCarbon Project (BAYER, grant no. BR135321048282P); and the Coordination for the Improvement of Higher-Education Personnel (CAPES) Foundation.
Data Availability Statement
The data presented in this study are available on request from the corresponding author.
Conflicts of Interest
The authors declare that this study received funding from CNPq (the National Council for Scientific and Technological Development), FAPERGS (the Foundation for the Support of Research in the State of Rio Grande do Sul), and Bayer Crop Science S.A. The funders were not involved in the study design; the collection, analysis, or interpretation of the data; the writing of this article; or the decision to submit it for publication.
References
- IPCC. Emissions Trends and Drivers. In Climate Change 2022-Mitigation of Climate Change; Cambridge University Press: Cambridge, UK, 2023; pp. 215–294. [Google Scholar]
- SEEG. Análise das Emissões de Gases de Efeito Estufa e Suas Implicações para as Metas Climáticas do Brasil 1970-2021; SEEG: Piracicaba, Brasil, 2022. [Google Scholar]
- Blanco, H.; Lal, R. Tillage Systems. Soil Conserv. Manag. 2023, v.1, 127–157. [Google Scholar] [CrossRef]
- Kassam, A.; Friedrich, T.; Derpsch, R. Successful Experiences and Lessons from Conservation Agriculture Worldwide. Agronomy 2022, 12, 769. [Google Scholar] [CrossRef]
- IBGE. Censo Agropecuário 2017; IBGE: Rio de Janeiro, Brasil, 2019. [Google Scholar]
- Naseri, H.; Parashkoohi, M.G.; Ranjbar, I.; Zamani, D.M. Energy-Economic and Life Cycle Assessment of Sugarcane Production in Different Tillage Systems. Energy 2021, 217, 119252. [Google Scholar] [CrossRef]
- Silva, G.R.; Liska, A.J.; Bayer, C. Life Cycle Greenhouse Gas Emissions in Maize No-Till Agroecosystems in Southern Brazil Based on a Long-Term Experiment. Sustainability 2024, 16, 4012. [Google Scholar] [CrossRef]
- Houshyar, E.; Grundmann, P. Environmental Impacts of Energy Use in Wheat Tillage Systems: A Comparative Life Cycle Assessment (LCA) Study in Iran. Energy 2017, 122, 11–24. [Google Scholar] [CrossRef]
- Zaher, U.; Stöckle, C.; Painter, K.; Higgins, S. Life Cycle Assessment of the Potential Carbon Credit from No- and Reduced-Tillage Winter Wheat-Based Cropping Systems in Eastern Washington State. Agric. Syst. 2013, 122, 73–78. [Google Scholar] [CrossRef]
- Six, J.; Ogle, S.M.; Breidt, F.J.; Conant, R.T.; Mosiers, A.R.; Paustian, K. The Potential to Mitigate Global Warming with No-Tillage Management Is Only Realized When Practised in the Long Term. Glob. Change Biol. 2004, 10, 155–160. [Google Scholar] [CrossRef]
- Kim, S.; Dale, B.E.; Jenkins, R. Life Cycle Assessment of Corn Grain and Corn Stover in the United States. Int. J. Life Cycle Assess. 2009, 14, 160–174. [Google Scholar] [CrossRef]
- Triplett, G.B., Jr.; Dick, W.A. No-Tillage Crop Production: A Revolution in Agriculture! Agron. J. 2008, 100, S-153–S-165. [Google Scholar] [CrossRef]
- Kim, S.; Dale, B.E. Life Cycle Assessment Study of Biopolymers (Polyhydroxyalkanoates) Derived from No-Tilled Corn. Int. J. Life Cycle Assess. 2005, 10, 200–210. [Google Scholar] [CrossRef]
- Abdalla, M.; Hastings, A.; Helmy, M.; Prescher, A.; Osborne, B.; Lanigan, G.; Forristal, D.; Killi, D.; Maratha, P.; Williams, M.; et al. Assessing the Combined Use of Reduced Tillage and Cover Crops for Mitigating Greenhouse Gas Emissions from Arable Ecosystem. Geoderma 2014, 223–225, 9–20. [Google Scholar] [CrossRef]
- Camargo, G.G.T.; Ryan, M.R.; Richard, T.L. Energy Use and Greenhouse Gas Emissions from Crop Production Using the Farm Energy Analysis Tool. Bioscience 2013, 63, 263–273. [Google Scholar] [CrossRef]
- Malhi, S.S.; Lemke, R.; Wang, Z.H.; Chhabra, B.S. Tillage, Nitrogen and Crop Residue Effects on Crop Yield, Nutrient Uptake, Soil Quality, and Greenhouse Gas Emissions. Soil Tillage Res. 2006, 90, 171–183. [Google Scholar] [CrossRef]
- Poeplau, C.; Don, A. Carbon Sequestration in Agricultural Soils via Cultivation of Cover Crops–A Meta-Analysis. Agric. Ecosyst. Environ. 2015, 200, 33–41. [Google Scholar] [CrossRef]
- Bayer, C.; Gomes, J.; Zanatta, J.A.; Vieira, F.C.B.; Dieckow, J. Mitigating Greenhouse Gas Emissions from a Subtropical Ultisol by Using Long-Term No-Tillage in Combination with Legume Cover Crops. Soil Tillage Res. 2016, 161, 86–94. [Google Scholar] [CrossRef]
- Prechsl, U.E.; Wittwer, R.; van der Heijden, M.G.A.; Lüscher, G.; Jeanneret, P.; Nemecek, T. Assessing the Environmental Impacts of Cropping Systems and Cover Crops: Life Cycle Assessment of FAST, a Long-Term Arable Farming Field Experiment. Agric. Syst. 2017, 157, 39–50. [Google Scholar] [CrossRef]
- ISO 14040:2006; Environmental Management—Life Cycle Assessment—Principles and Framework. ISO: Geneva, Switzerland, 2006.
- Schad, P. World Reference Base for Soil Resources—Its Fourth Edition and Its History. J. Plant Nutr. Soil Sci. 2023, 186, 151–163. [Google Scholar] [CrossRef]
- USDA-NRCS. Keys to Soil Taxonomy, 13th ed.; NRCS: Washington, DC, USA, 2022. [Google Scholar]
- Wang, M. The Greenhouse Gases, Regulated Emissions, and Energy Use in Transportation (GREET) Model Version 1.5; US Department of Energy: Washington, DC, USA, 1999. [Google Scholar]
- Gomes, J. Emissão de Gases do Efeito Estufa e Mitigação do Potencial de Aquecimento Global por Sistemas Conservacionistas de Manejo do Solo. Ph.D. Thesis, Federal University of Rio Grande do Sul, Porto Alegre, Brazil, 2006. [Google Scholar]
- Oliveros, L.F.C. Balanço da Emissão de Gases de Efeito Estufa Em Argissolo Vermelho Sob Sistemas de Cultura Em Plantio Direto. Ph.D. Thesis, Federal University of Rio Grande do Sul (UFRGS), Porto Alegre, Brazil, 2011. [Google Scholar]
- Denega, G.L. Emissão de Gases de Efeito Estufa Em Argissolo Sob Sistemas de Preparo e Leguminosas de Cobertura No Sul do Brasil. Ph.D. Thesis, Federal University of Rio Grande do Sul (UFRGS), Porto Alegre, Brazil, 2014. [Google Scholar]
- Vieira, F.C.B. Estoques e Labilidade da Matéria Orgânica e Acidificação de um Argissolo sob Plantio Direto Afetados por Sistemas de Cultura e Adubação Nitrogenada. Ph.D. Thesis, Federal University of Rio Grande do Sul (UFRGS), Porto Alegre, Brazil, 2007. [Google Scholar]
- Blake, G.R.; Hartge, K.H. Bulk Density. In Methods of Soil Analysis, Part 1—Physical and Mineralogical Methods, 2nd ed.; American Society of Agronomy: Madison, WI, USA, 1986; pp. 363–375. [Google Scholar]
- Ellert, B.H.; Bettany, J.R. Calculation of Organic Matter and Nutrients Stored in Soils under Contrasting Management Regimes. Can. J. Soil. Sci. 1995, 75, 529–538. [Google Scholar] [CrossRef]
- Ferreira, E.B.; Cavalcanti, P.P.; Nogueira, D.A.; Ferreira, E.B.; Cavalcanti, P.P.; Nogueira, D.A. ExpDes: An R Package for ANOVA and Experimental Designs. Appl. Math. 2014, 5, 2952–2958. [Google Scholar] [CrossRef]
- Blanco-Canqui, H.; Shaver, T.M.; Lindquist, J.L.; Shapiro, C.A.; Elmore, R.W.; Francis, C.A.; Hergert, G.W. Cover Crops and Ecosystem Services: Insights from Studies in Temperate Soils. Agron. J. 2015, 107, 2449–2474. [Google Scholar] [CrossRef]
- Blanco, H.; Lal, R. Cover Crops. Soil Conserv. Manag. 2023, 1, 211–237. [Google Scholar] [CrossRef]
- Nemecek, T.; von Richthofen, J.S.; Dubois, G.; Casta, P.; Charles, R.; Pahl, H. Environmental Impacts of Introducing Grain Legumes into European Crop Rotations. Eur. J. Agron. 2008, 28, 380–393. [Google Scholar] [CrossRef]
- Nemecek, T.; Hayer, F.; Bonnin, E.; Carrouée, B.; Schneider, A.; Vivier, C. Designing Eco-Efficient Crop Rotations Using Life Cycle Assessment of Crop Combinations. Eur. J. Agron. 2015, 65, 40–51. [Google Scholar] [CrossRef]
- Grassauer, F.; Herndl, M.; Nemecek, T.; Guggenberger, T.; Fritz, C.; Steinwidder, A.; Zollitsch, W. Eco-Efficiency of Farms Considering Multiple Functions of Agriculture: Concept and Results from Austrian Farms. J. Clean. Prod. 2021, 297, 126662. [Google Scholar] [CrossRef]
- Zingale, S.; Ingrao, C.; Reguant-Closa, A.; Guarnaccia, P.; Nemecek, T. A Multifunctional Life Cycle Assessment of Durum Wheat Cropping Systems. Agron. Sustain. Dev. 2024, 44, 1–22. [Google Scholar] [CrossRef]
- Bayer, C.; Dieckow, J.; Amado, T.J.C.; Eltz, F.L.F.; Vieira, F.C.B. Cover Crop Effects Increasing Carbon Storage in a Subtropical No-till Sandy Acrisol. Commun. Soil Sci. Plant Anal. 2009, 40, 1499–1511. [Google Scholar] [CrossRef]
- Gomes, J.; Bayer, C.; de Souza Costa, F.; de Cássia Piccolo, M.; Zanatta, J.A.; Vieira, F.C.B.; Six, J. Soil Nitrous Oxide Emissions in Long-Term Cover Crops-Based Rotations under Subtropical Climate. Soil Tillage Res. 2009, 106, 36–44. [Google Scholar] [CrossRef]
- Li, X.; Feng, J.; Zhang, Q.; Zhu, B. Warming Inhibits the Priming Effect of Soil Organic Carbon Mineralization: A Meta-Analysis. Sci. Total Environ. 2023, 904, 166170. [Google Scholar] [CrossRef]
- Baggs, E.M.; Chebii, J.; Ndufa, J.K. A Short-Term Investigation of Trace Gas Emissions Following Tillage and No-Tillage of Agroforestry Residues in Western Kenya. Soil Tillage Res. 2006, 90, 69–76. [Google Scholar] [CrossRef]
- Rigon, J.P.G.; Calonego, J.C.; Pivetta, L.A.; Castoldi, G.; Raphael, J.P.A.; Rosolem, C.A. Using Cover Crops to Offset Greenhouse Gas Emissions from a Tropical Soil under No-Till. Exp. Agric. 2021, 57, 217–231. [Google Scholar] [CrossRef]
- Essich, L.; Nkebiwe, P.M.; Schneider, M.; Ruser, R. Is Crop Residue Removal to Reduce N2O Emissions Driven by Quality or Quantity? A Field Study and Meta-Analysis. Agriculture 2020, 10, 546. [Google Scholar] [CrossRef]
- Shumba, A.; Chikowo, R.; Corbeels, M.; Six, J.; Thierfelder, C.; Cardinael, R. Long-Term Tillage, Residue Management and Crop Rotation Impacts on N2O and CH4 Emissions from Two Contrasting Soils in Sub-Humid Zimbabwe. Agric. Ecosyst. Environ. 2023, 341, 108207. [Google Scholar] [CrossRef]
- Grassmann, C.S.; Mariano, E.; Rocha, K.F.; Gilli, B.R.; Rosolem, C.A. Effect of Tropical Grass and Nitrogen Fertilization on Nitrous Oxide, Methane, and Ammonia Emissions of Maize-Based Rotation Systems. Atmos. Environ. 2020, 234, 117571. [Google Scholar] [CrossRef]
- Bayer, C.; Spagnollo, E.; Wildner, L.d.P.; Ernani, P.R.; Alburqueque, J.A. Incremento de Carbono e Nitrogênio Num Latossolo Pelo Uso de Plantas Estivais Para Cobertura Do Solo. Ciênc. Rural 2003, 33, 469–475. [Google Scholar] [CrossRef]
- Spagnollo, E.; Bayer, C.; Wildner, L.P.; Ernani, P.R.; Albuquerque, J.A.; Proença, M.M. Leguminosas Estivais Intercalares Como Fonte de Nitrogênio Para o Milho, No Sul Do Brasil. Rev. Bras. Ciênc. Solo 2002, 26, 417–423. [Google Scholar] [CrossRef]
- Holka, M.; Bieńkowski, J. Carbon Footprint and Life-Cycle Costs of Maize Production in Conventional and Non-Inversion Tillage Systems. Agronomy 2020, 10, 1877. [Google Scholar] [CrossRef]
- Keshavarz Afshar, R.; Dekamin, M. Sustainability Assessment of Corn Production in Conventional and Conservation Tillage Systems. J. Clean. Prod. 2022, 351, 131508. [Google Scholar] [CrossRef]
- Costa, M.P.; Chadwick, D.; Saget, S.; Rees, R.M.; Williams, M.; Styles, D. Representing Crop Rotations in Life Cycle Assessment: A Review of Legume LCA Studies. Int. J. Life Cycle Assess. 2020, 25, 1942–1956. [Google Scholar] [CrossRef]
- Yang, X.; Gao, W.; Zhang, M.; Chen, Y.; Sui, P. Reducing Agricultural Carbon Footprint through Diversified Crop Rotation Systems in the North China Plain. J. Clean. Prod. 2014, 76, 131–139. [Google Scholar] [CrossRef]
- Abdalla, M.; Hastings, A.; Cheng, K.; Yue, Q.; Chadwick, D.; Espenberg, M.; Truu, J.; Rees, R.M.; Smith, P. A Critical Review of the Impacts of Cover Crops on Nitrogen Leaching, Net Greenhouse Gas Balance and Crop Productivity. Glob. Change Biol. 2019, 25, 2530–2543. [Google Scholar] [CrossRef]
- Gan, Y.; Liang, C.; Wang, X.; McConkey, B. Lowering Carbon Footprint of Durum Wheat by Diversifying Cropping Systems. Field Crops Res. 2011, 122, 199–206. [Google Scholar] [CrossRef]
Disclaimer/Publisher’s Note: The statements, opinions and data contained in all publications are solely those of the individual author(s) and contributor(s) and not of MDPI and/or the editor(s). MDPI and/or the editor(s) disclaim responsibility for any injury to people or property resulting from any ideas, methods, instructions or products referred to in the content. |
© 2025 by the authors. Licensee MDPI, Basel, Switzerland. This article is an open access article distributed under the terms and conditions of the Creative Commons Attribution (CC BY) license (https://creativecommons.org/licenses/by/4.0/).