Article

Optimizing Unmanned Aerial Vehicle Operational Parameters to Improve Pest Control Efficacy and Decrease Pesticide Dosage in Tea Gardens

1
Key Laboratory of Biology, Genetics and Breeding of Special Economic Animals and Plants, Ministry of Agriculture and Rural Affairs, Hangzhou 310008, China
2
Tea Research Institute, Chinese Academy of Agricultural Science, Hangzhou 310008, China
3
School of Resources and Environment, Henan Institute of Science and Technology, Xinxiang 453003, China
4
Hangzhou Xihu District Agricultural Technology Extension Service Center, Hangzhou 310013, China
*
Authors to whom correspondence should be addressed.
Agronomy 2025, 15(2), 431; https://doi.org/10.3390/agronomy15020431
Submission received: 23 December 2024 / Revised: 23 January 2025 / Accepted: 8 February 2025 / Published: 10 February 2025
(This article belongs to the Section Pest and Disease Management)

Abstract

:
Labor shortages in the Chinese tea industry have accelerated the need for crop protection unmanned aerial vehicles (CP-UAVs), which can greatly improve working efficiency. However, CP-UAV operational parameters must be optimized for effective pest control. In this study, the spraying performance of two CP-UAVs (DJI T30 and T40) under different operational parameters were compared in tea gardens. Additionally, the utility of CP-UAVs for controlling tea leafhoppers was investigated. Droplet coverage and size increased as the spray volume increased for both T30 (from 30 L·ha−1 to 90 L·ha−1) and T40 (from 60 L·ha−1 to 150 L·ha−1). Under the same operational parameters, spray deposition at the surface and inner part of the tea canopy was 1.4- and 2.9 times higher, respectively, for T40 than for T30. For T40, droplet penetrability increased significantly following decreases in working height (from 5 to 2 m) and driving speed (from 5 to 3 m·s−1). The spray performance and control effect of T40 were significantly greater under optimal operational parameters (driving speed of 3 m·s−1, working height of 2.5 m, and spray volume of 120 L·ha−1) than under conventional application parameters (driving speed of 5 m·s−1, working height of 4.5 m, and spray volume of 45 L·ha−1). Using T40 under the optimal operational parameters decreased the amount of pesticide required to control tea leafhoppers by 25%, relative to the amount required for traditional knapsack sprayers. Furthermore, pesticide residue levels were similar for T40 and the knapsack sprayer. These findings provide valuable insights into the application of CP-UAVs in tea gardens, which may be important for further developing a modern, intensive, and sustainable tea industry.

1. Introduction

After water, tea is the world’s most popular beverage, and it offers a wealth of health benefits. Tea consumption has a history of nearly 5000 y [1]. The tea plant (Camellia sinensis) is one of the most important and traditional economic crops in many developing countries in Asia, Africa, and Latin America between latitudes 41° N and 16° S [2]. However, serious pest infestations are common because of the warm and humid climate in tea-growing areas and the relatively stable ecological environment in tea gardens [2]. Frequent pest outbreaks pose a significant threat to the quality and yield of tea. Therefore, the application of chemical insecticides is very important for tea production. Traditionally, pesticides are applied manually using knapsack sprayers, but this method is labor-intensive [3,4]. In addition, knapsack sprayers tend to have large spraying volumes, coarse nozzles, and low spray quality, resulting in substantial pesticide losses and high operator exposure [3,4]. With the development of the tea industry in China, soaring labor costs are becoming a major problem. Thus, improved cultivation and management methods that reduce labor inputs are urgently required.
In recent years, there has been an increasing number of studies on the use of low-altitude and low-volume crop protection unmanned aerial vehicles (CP-UAVs) around the world [3,4,5,6]. These vehicles consist of a rotor, tank, spraying system, control system, environmental sensor, and power system [6]. CP-UAVs use pre-programmed flight plans, and are controlled by an autonomous operator at a ground station. The spray efficiency of CP-UAVs is roughly 20 times that of traditional knapsack sprayers. Apart from the high working efficiency, CP-UAVs have a number of advantages related to social, environmental, and economic sustainability, such as low-volume spraying, high flexibility, and low labor operation costs [4,7,8]. This technology also has a good adaptability to complex terrains, such as flat terrains and mountains, and can effectively control agricultural pests and diseases [9]. Nearly 10 years of trials in real pest and disease control operations in China have resulted in the significant maturation of CP-UAV technology, and vehicle and spray systems are now being commercially developed [10]. Moreover, there have been rapid advances in the application technique of CP-UAVs for rice, wheat, corn, cotton and other field crops [10]. However, the use of CP-UAVs in tea gardens in China is still in its infancy, and the reliable application technique is urgently needed for the development of the tea industry.
The application of CP-UAVs continues to face several practical problems that need to be addressed. The most significant is the optimization of the operational parameters to achieve the best outcomes [8,11], which are related to the association between the target organism and the pesticide. In terms of the pesticide dose transfer process, droplet deposition characteristics, such as droplet coverage, size, penetration, and distribution uniformity, play an important role in pest control [12]. Different CP-UAV operational parameters, such as driving speed, spray volume, and working height, greatly affect droplet deposition characteristics and pest control [9,13,14,15,16,17,18,19,20]. For example, a high-speed (3.0 m·s−1) increased droplet deposition on the canopy, but a low spray application rate (53.0 L·ha−1) was insufficient for an efficient application in vineyards [9]. In a peach orchard, a flight speed of 2.0 m·s−1 facilitated a relatively uniform droplet deposition along the canopy [17]. In citrus, application from a height of 1.40 m resulted in a 59.6% improvement in droplet density in the lower canopy layer [14]. When spraying pineapple plants, the operating height should be <2.5 m to maximize application efficiency and effectiveness [13]. In addition, improper CP-UAV operational parameters can lead to droplet drift or runoff losses, thereby increasing the risk of environmental and human contamination [19]. To date, most studies on the use of CP-UAVs have focused on optimizing operational parameters to improve spray quality.
The current study was conducted to explore the utility of CP-UAVs in tea gardens. The specific study objectives were as follows: (1) to investigate and compare the spraying performance of two commercial CP-UAVs, with the main differences being the spraying system and total weight, using different application parameters; and (2) to evaluate the utility of CP-UAVs operated under optimal application parameters for controlling the tea leafhopper Empoasca onukii, which is a serious pest of the tea plant in China.

2. Materials and Methods

2.1. Experimental Sites and Crop Characteristics

Experiments were conducted in Fushen (a 2000 ha tea garden; Shaoxing Royal Tea Village Co., Ltd., Shaoxing, China), Jingshan (a 150 ha tea garden; Zhejiang Camel Jiuyu Organic Food Co., Ltd., Hangzhou, China), and Jidong (a 60 ha tea garden; Shaoxing City Keqiao District Yulong Tea Co., Ltd., Shaoxing, China). All three tea gardens had a flat terrain and contained clone Longjing 43 tea plants that were 1.0–1.2 m tall, with a similar canopy structure. Rows of tea plants were separated by 1.5–1.8 m.

2.2. Spray Equipment and Chemicals

Two commercial CP-UAVs, named T30 and T40 (DJI Technology Co., Ltd., Shenzhen, China), were used in this study. The T30 spraying system consisted of 16 flat-fan pressure nozzles (SX11001VS) and a 30 L pesticide tank, whereas the T40 spraying system consisted of 2 centrifugal nozzles (LX8060SZ) and a 40 L pesticide tank. Specific parameters of the two CP-UAVs are shown in Table 1. A knapsack sprayer (3WBD-20 BES; Zhuji Haidao Machinery Co., Ltd., Shaoxing, China) was also used for a comparison with CP-UAVs. The knapsack sprayer had external dimensions of 0.4 × 0.2 × 0.5 m, a working capacity of 19 L, and a working pressure of 0.3–0.4 Mpa.
The following pesticide formulations were used in this study: 50 g·L−1 afidopyropen (WG; BASF SE, Berlin, Germany) and 15% tolfenpyrad (SC; Hailir Pesticides & Chemicals Group, Qingdao, China). In addition, Allura Red (85% purity; Zhejiang Jigaode Pigment Technology Co., Ltd., Wenzhou, China) was used as a tracer for assessing spray deposition.

2.3. Basic Operational Process of CP-UAVs

In all tests, CP-UAVs followed pre-determined routes and autonomous flights were conducted within the test area. CP-UAVs were flown directly above tea plant rows, with a spray width of 3.0 m. For each test, a Kestrel 5500 Link portable weather station (Nielsen-Kellerman, Minneapolis, MN, USA) was used to monitor the meteorological conditions (20 m away from the test area and 2.5 m above the ground level). If the wind speed and direction were within the acceptable range during a single flight route, this flight was considered as valid, and then relevant data were collected. For all valid T30 and T40 flights, the temperature, relative humidity, and wind speed were 23–31 °C, 48–72%, and 0.2–1.6 m·s−1, respectively.

2.4. Experimental Design

The experiment comprised three parts. The first part was completed to clarify the effect of various operational parameters on spraying performance and to identify the optimal operational parameters for T30 and T40. The second part was performed to compare the spray quality of T30 and T40. The third part was conducted to evaluate the utility of T40 operated under optimal parameters for controlling tea leafhoppers. Moreover, the utility of T40 for decreasing pesticide applications and the pesticide residue in tea after T40 application were investigated.

2.4.1. Effect of Operational Parameters on the Spraying Performance of T30 and T40

Various application parameters of T30 and T40 (including the spray volume, driving speed, working height, or atomization diameter) were tested. According to T30 and T40 characteristics, 10 and 14 treatments were designed, respectively (Table 2). The 24 treatments encompassed three test plots. Each plot was established with 15 tea plant rows, each 49 m long, and the area was approximately 1323 m2. The interval between two plots was about 20 m. Experiments were conducted in Fushen. The treatments for T30 and T40 were completed on 18 April 2022 and 24 April 2022, respectively. On each test day, randomly selected treatments were tested sequentially at the three plots.
Water-sensitive paper (WSP; 26 × 76 mm; Syngenta Crop Protection AG, Basel, Switzerland) was used to detect droplet deposition. Half a piece of WSP was fixed on a leaf with a paper clip, which did not alter the dip angle of the leaf. For each treatment, samples were taken from the middle nine tea plant rows, and three adjoining tea plant rows served as one replicate. Sampling points were set at the 8th, 19th, 30th, and 41st meter in each sampled tea plant row. At each point, two leaves at the canopy surface were randomly selected for sampling. For the T40 treatments, three leaves at 15 cm below the canopy surface were also sampled at the 19th and 30th meter in each sampled row.
After each flight, sufficient time (~10 min) was allowed for the droplets to dry. Then, WSPs were quickly collected and bagged individually, and transported to the laboratory for analysis. WSPs were scanned using a UNISM2120 scanner (Unigroup Co., Ltd., Beijing, China) to generate 600 dpi grayscale images, which were subsequently processed using DepositScan software (United States Department of Agriculture, Wooster, OH, USA) to determine droplet deposition parameters, including droplet size, coverage, and coefficient of variation (CV) [21].
Prior to the statistical analyses by SAS v8.2 (SAS Institute, Cary, NC, USA), the data about the droplet coverage and size were loge(X + 1)-transformed to satisfy the assumptions of normality and homogeneity. A factorial analysis of variance (ANOVA) was used to detect significant variations in droplet deposition, including droplet coverage and droplet size, under different application parameters for T30 or T40. The above-mentioned droplet deposition for different treatments using T30 or T40 was also analyzed by a one-way ANOVA followed by Tukey’s multiple range test.

2.4.2. Comparison of Spraying Quality Between T30 and T40

This experiment was conducted in Fushen on 10 May 2022. The spraying quality of T30 and T40 was compared using an identical spray volume (75 L·ha−1), driving speed (3 m·s−1), and working height (2.5 m). For T40, the atomization diameter was set at ‘medium’. Each treatment was completed using three replicates, each involving one plot (approximately 778 m2) containing 12 tea plant rows (36 m long). All plots were spaced in a completely randomized design, with at least 20 m separating plots. Allura Red (450 g·ha−1) was used to assess spray deposition. After spraying, droplets were allowed to dry for 10 min. Samples were collected from the middle six tea plant rows, with sampling points set at the 9th, 18th, and 27th meter. At each sampling point, five leaves at the canopy surface and five leaves at 15 cm below the canopy surface were collected, and were separately stored in zip-lock bags (12.0 × 17.0 cm).
The method for detection of Allura Red was similar to that described [22]. The leaves in each zip-lock bag were washed with 10 mL distilled water. After agitating and eluting for 15 min, 200 μL eluent was transferred to a 96-well microplate, and the absorbance of Allura Red at 514 nm was determined using a microplate reader (Varioskan™ LUX, Thermo Scientific, Waltham, MA, USA). Additionally, leaf area was measured using a UNISM2120 scanner and DepositScan software. The measured amount of Allura Red was divided by leaf area to calculate spray deposition.
The absorbance of Allura Red was linear for six concentrations (1–50 mg·L−1, R2 = 0.9998). Five clean mature leaves were spiked with Allura Red at three concentrations (n = 6) to verify the recovery and precision of the quantification analysis described above. The recoveries at the spiked amounts of 15, 60, and 150 µg for five leaves were 112.8% (relative standard deviation, RSD = 10.1%), 105.7% (RSD = 6.4%), and 103.8% (RSD = 3.7%), respectively.
Significant differences in the amount of Allura Red between T30 and T40 were detected using unpaired t-tests by SAS v8.2. Prior to statistical analyses, the data were loge(X + 1)-transformed to satisfy the assumptions of normality and homogeneity.

2.4.3. Control Effect of T40 Under Optimal Application Parameters

Two experiments were designed to test the control effect of T40. The first experiment compared the control effects of T40 under optimal and conventional application parameters, whereas the second experiment compared the control effect of T40 operated under optimal parameters and that of a knapsack sprayer. Optimal application parameters were determined on the basis of the results for the first two parts of this study, whereas conventional application parameters were determined according to the current use of CP-UAVs in Hangzhou tea plantations. For T40, the optimal spray volume, driving speed, and working height were 120 L·ha−1, 3 m·s−1 and 2.5 m, respectively. By contrast, the conventional spray volume, driving speed, and working height were 45 L·ha−1, 5 m·s−1 and 4.5 m, respectively. The atomization diameter was set at ‘medium’ for both the optimal and conventional parameters. In the two experiments, afidopyropen and tolfenpyrad were used to control the leafhoppers, with minimum doses of 15.0 and 45.0 a.i. g·ha−1, respectively. These doses were based on our preliminary results obtained using a knapsack sprayer. Experiments involving tolfenpyrad at Jidong and afidopyropen at Jingshan were conducted on 10 October 2022 and 16 October 2022, respectively.
In the first experiment, in addition to the control treatment, T40 was used to apply pesticides at 75% of the minimum dose under optimal application parameters (OP-75%) and conventional application parameters (CP-75%). In the second experiment, in addition to the control treatment, T40 was used to apply pesticides at 75% (OP-75%) and 50% (OP-50%) of the minimum dose under optimal application parameters, while a knapsack sprayer was used to apply pesticides at 100% (KS-100%) and 75% (KS-75%) of the minimum dose. The water consumption rate of the knapsack sprayer was 750 L·ha−1. In both experiments, each T40 treatment plot was approximately 882 m2, with 14 tea plant rows (35 m long). The knapsack sprayer treatment plot and the control plot were approximately 324 m2, with 14 tea plant rows (15 m long). All plots were spaced in a completely randomized design. The distance between plots was at least 20 m.
To evaluate spraying quality, WSPs were used in the middle eight tea plant rows in each T40 treatment plot, where two adjacent rows served as a replicate. Leaves at the canopy surface were collected at the 7th, 14th, 21st, and 27th meter in each sampling row, whereas leaves at 15 cm below the canopy surface were collected at the 14th and 21st meter in each sampling row. Methods for sampling and measuring droplets were as described above.
In each treatment plot of the two experiments, the leafhopper population was determined in the fourth to seventh tea plant rows, with each row representing one replicate. The leafhopper population was surveyed on the day before spraying, as well as 1, 3, and 7 days after afidopyropen was applied and 1, 7, and 14 days after tolfenpyrad was applied. On each survey day, leafhopper nymphs were randomly counted on 100 secondary leaves below tea buds from each sampling row. Because the leafhoppers hide in tea plants during the day, the survey was usually conducted before 8:00 am.
In the second experiment, pesticide residues in tea in the OP-75%, KS-100%, and control treatment were measured. In the three treatment plots, bud samples (800 g of buds with two leaves) were uniformly collected from the eighth to eleventh tea plant rows at 7 days after spraying. Each row represented one replicate. Before measuring pesticide residues, the samples were dried at 100 °C for 2 h. Afidopyropen and tolfenpyrad residues were detected using the methods described in [23] and [24], respectively. Both pesticides were detected using a Waters Acquity Ultra Performance Liquid Chromatography system in tandem with a Waters Xevo triple-quadrupole mass spectrometer (Waters, Milford, MA, USA). For afidopyropen, the recoveries at the spiked concentrations of 0.02 and 0.4 mg·kg−1 were 91.3% (RSD = 13.2%) and 90.6% (RSD = 9.4%), respectively. For tolfenpyrad, the recoveries at the spiked concentrations of 1.0 and 15.0 mg·kg−1 were 88.2% (RSD = 11.8%) and 96.5% (RSD = 5.7%), respectively.
Loge(X + 1)-transformed spray coverage and control effect were statistically analyzed using SAS v8.2. In the first experiment, significant differences in the spray coverage and control effect between OP-75% and CP-75% were determined using unpaired t-tests. In the second experiment, significant differences in the spray coverage between OP-75% and OP-50% and in the pesticide residues between KS-100% and OP-75% were determined using unpaired t-tests, and differences in the control effect among KS-100%, KS-75%, OP-50%, and OP-75% were analyzed via a one-way ANOVA followed by Tukey’s multiple range test.

3. Results

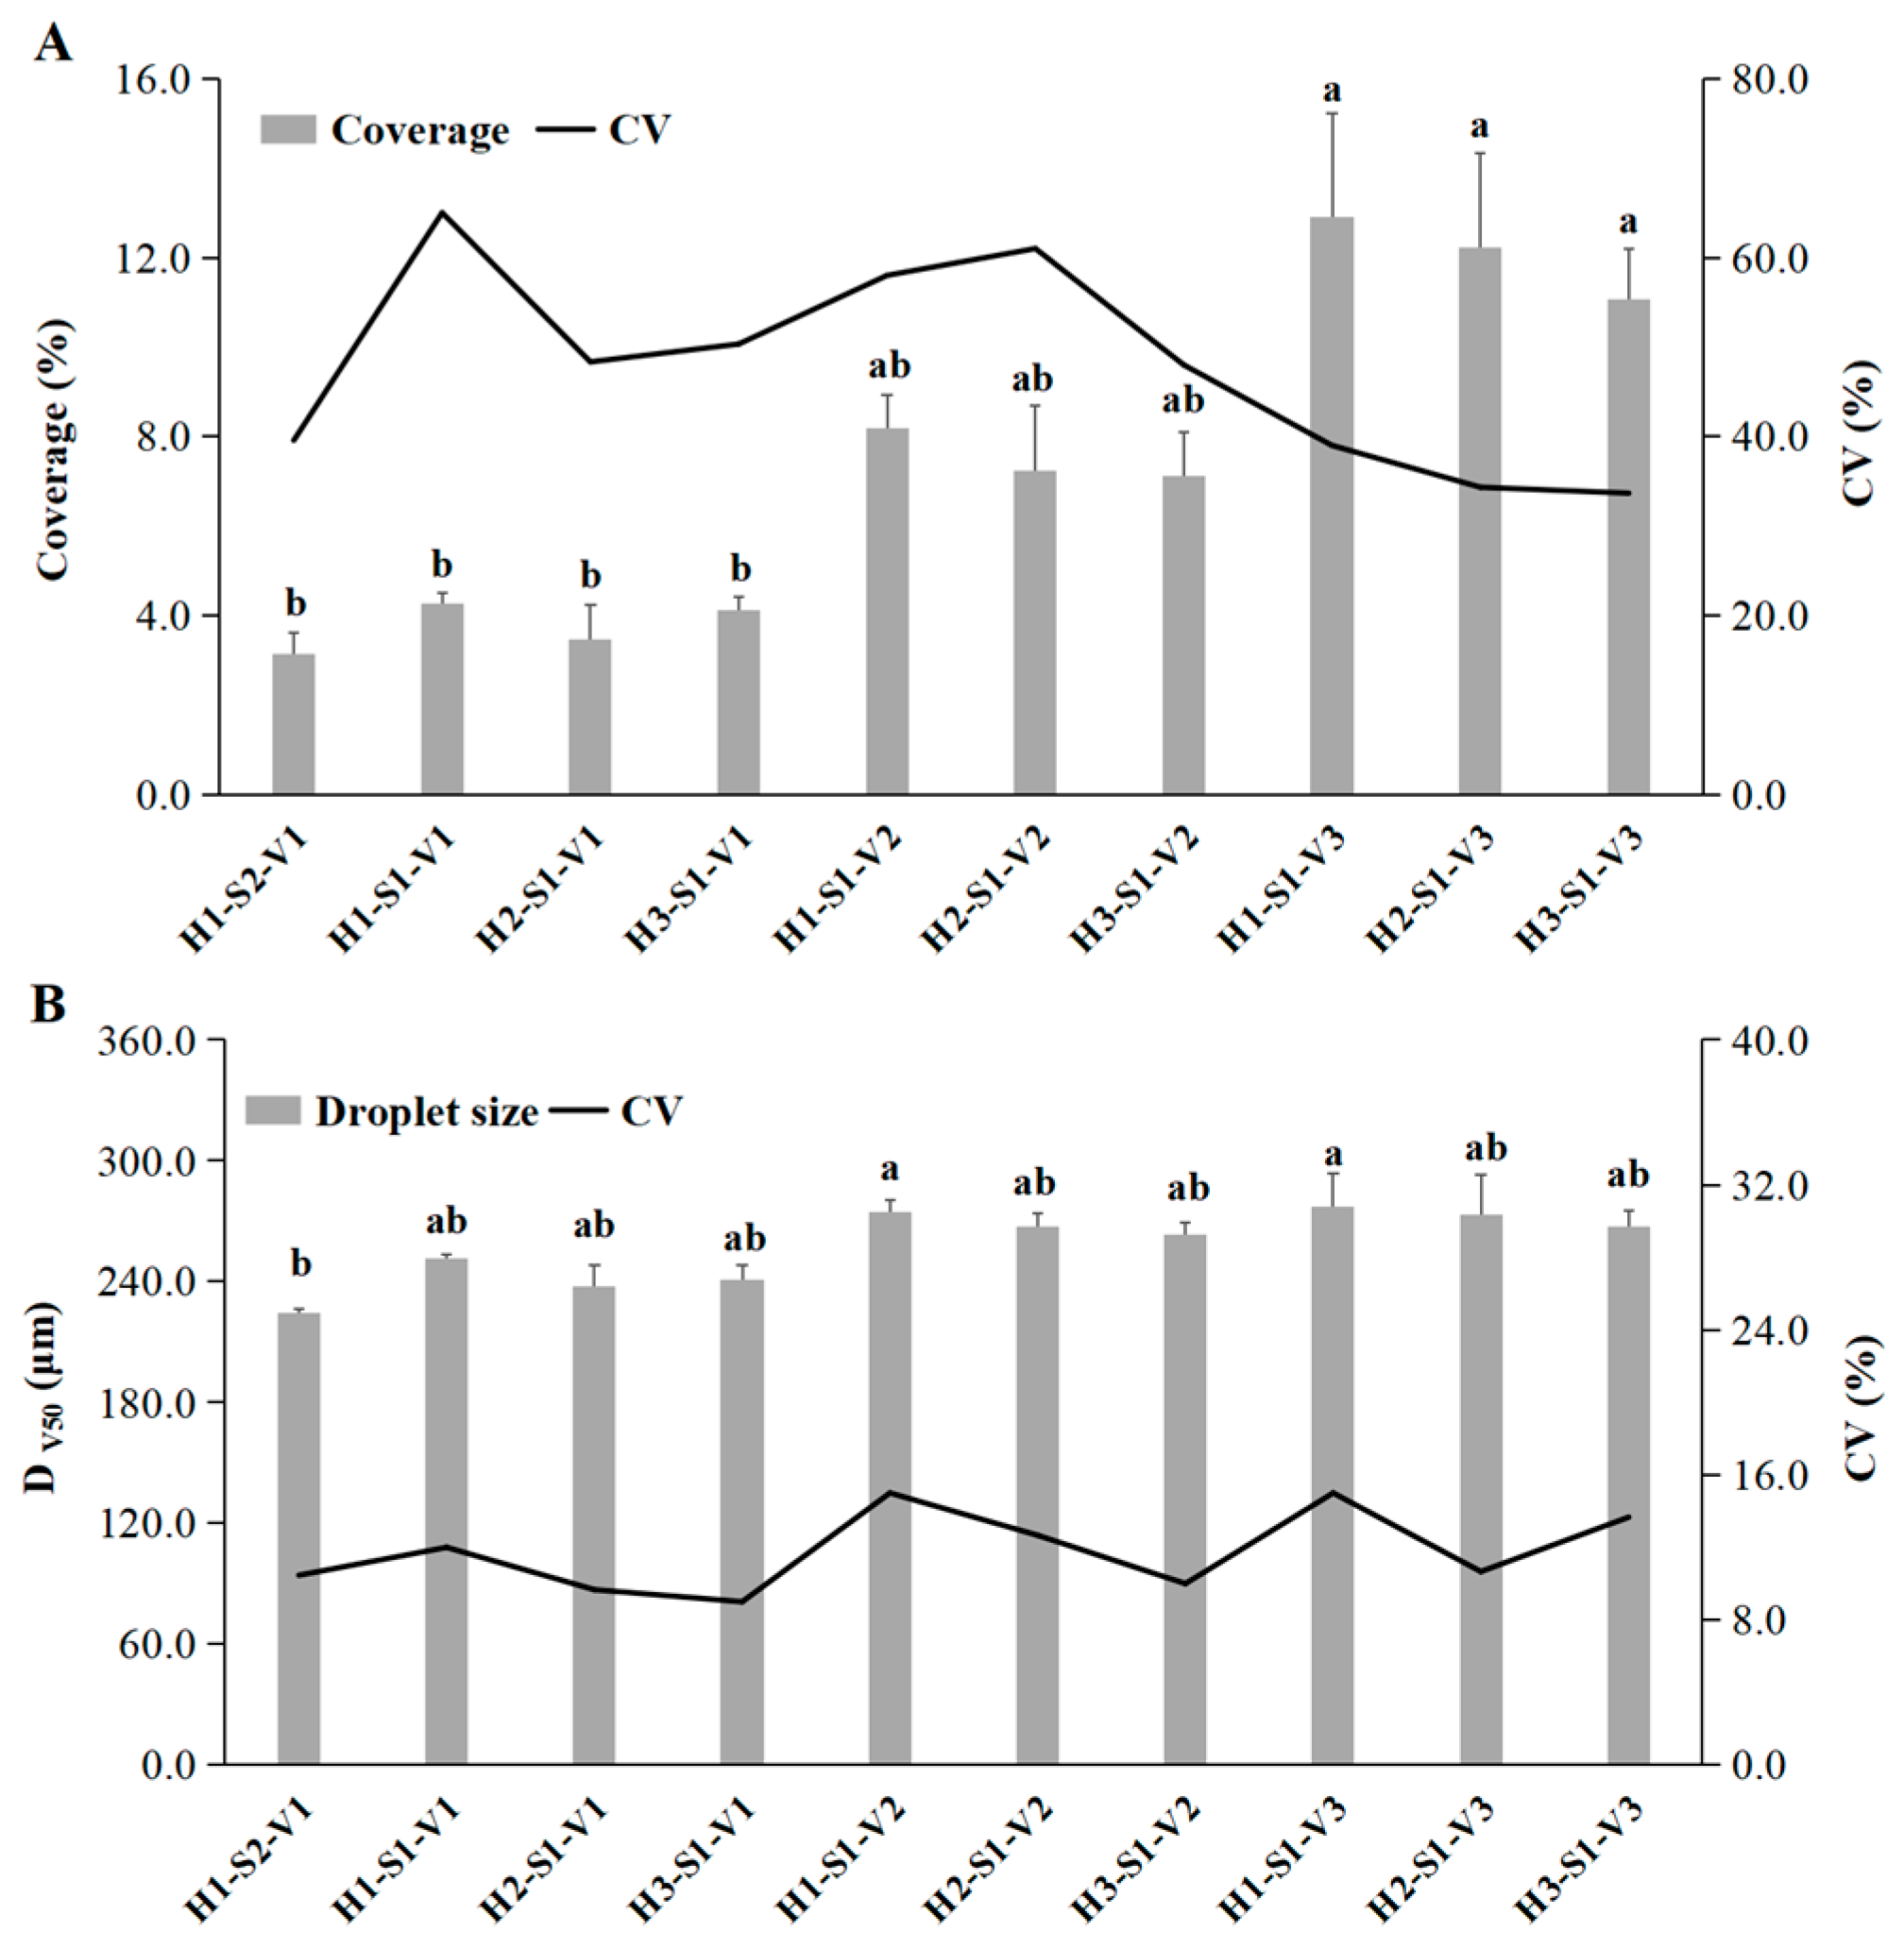
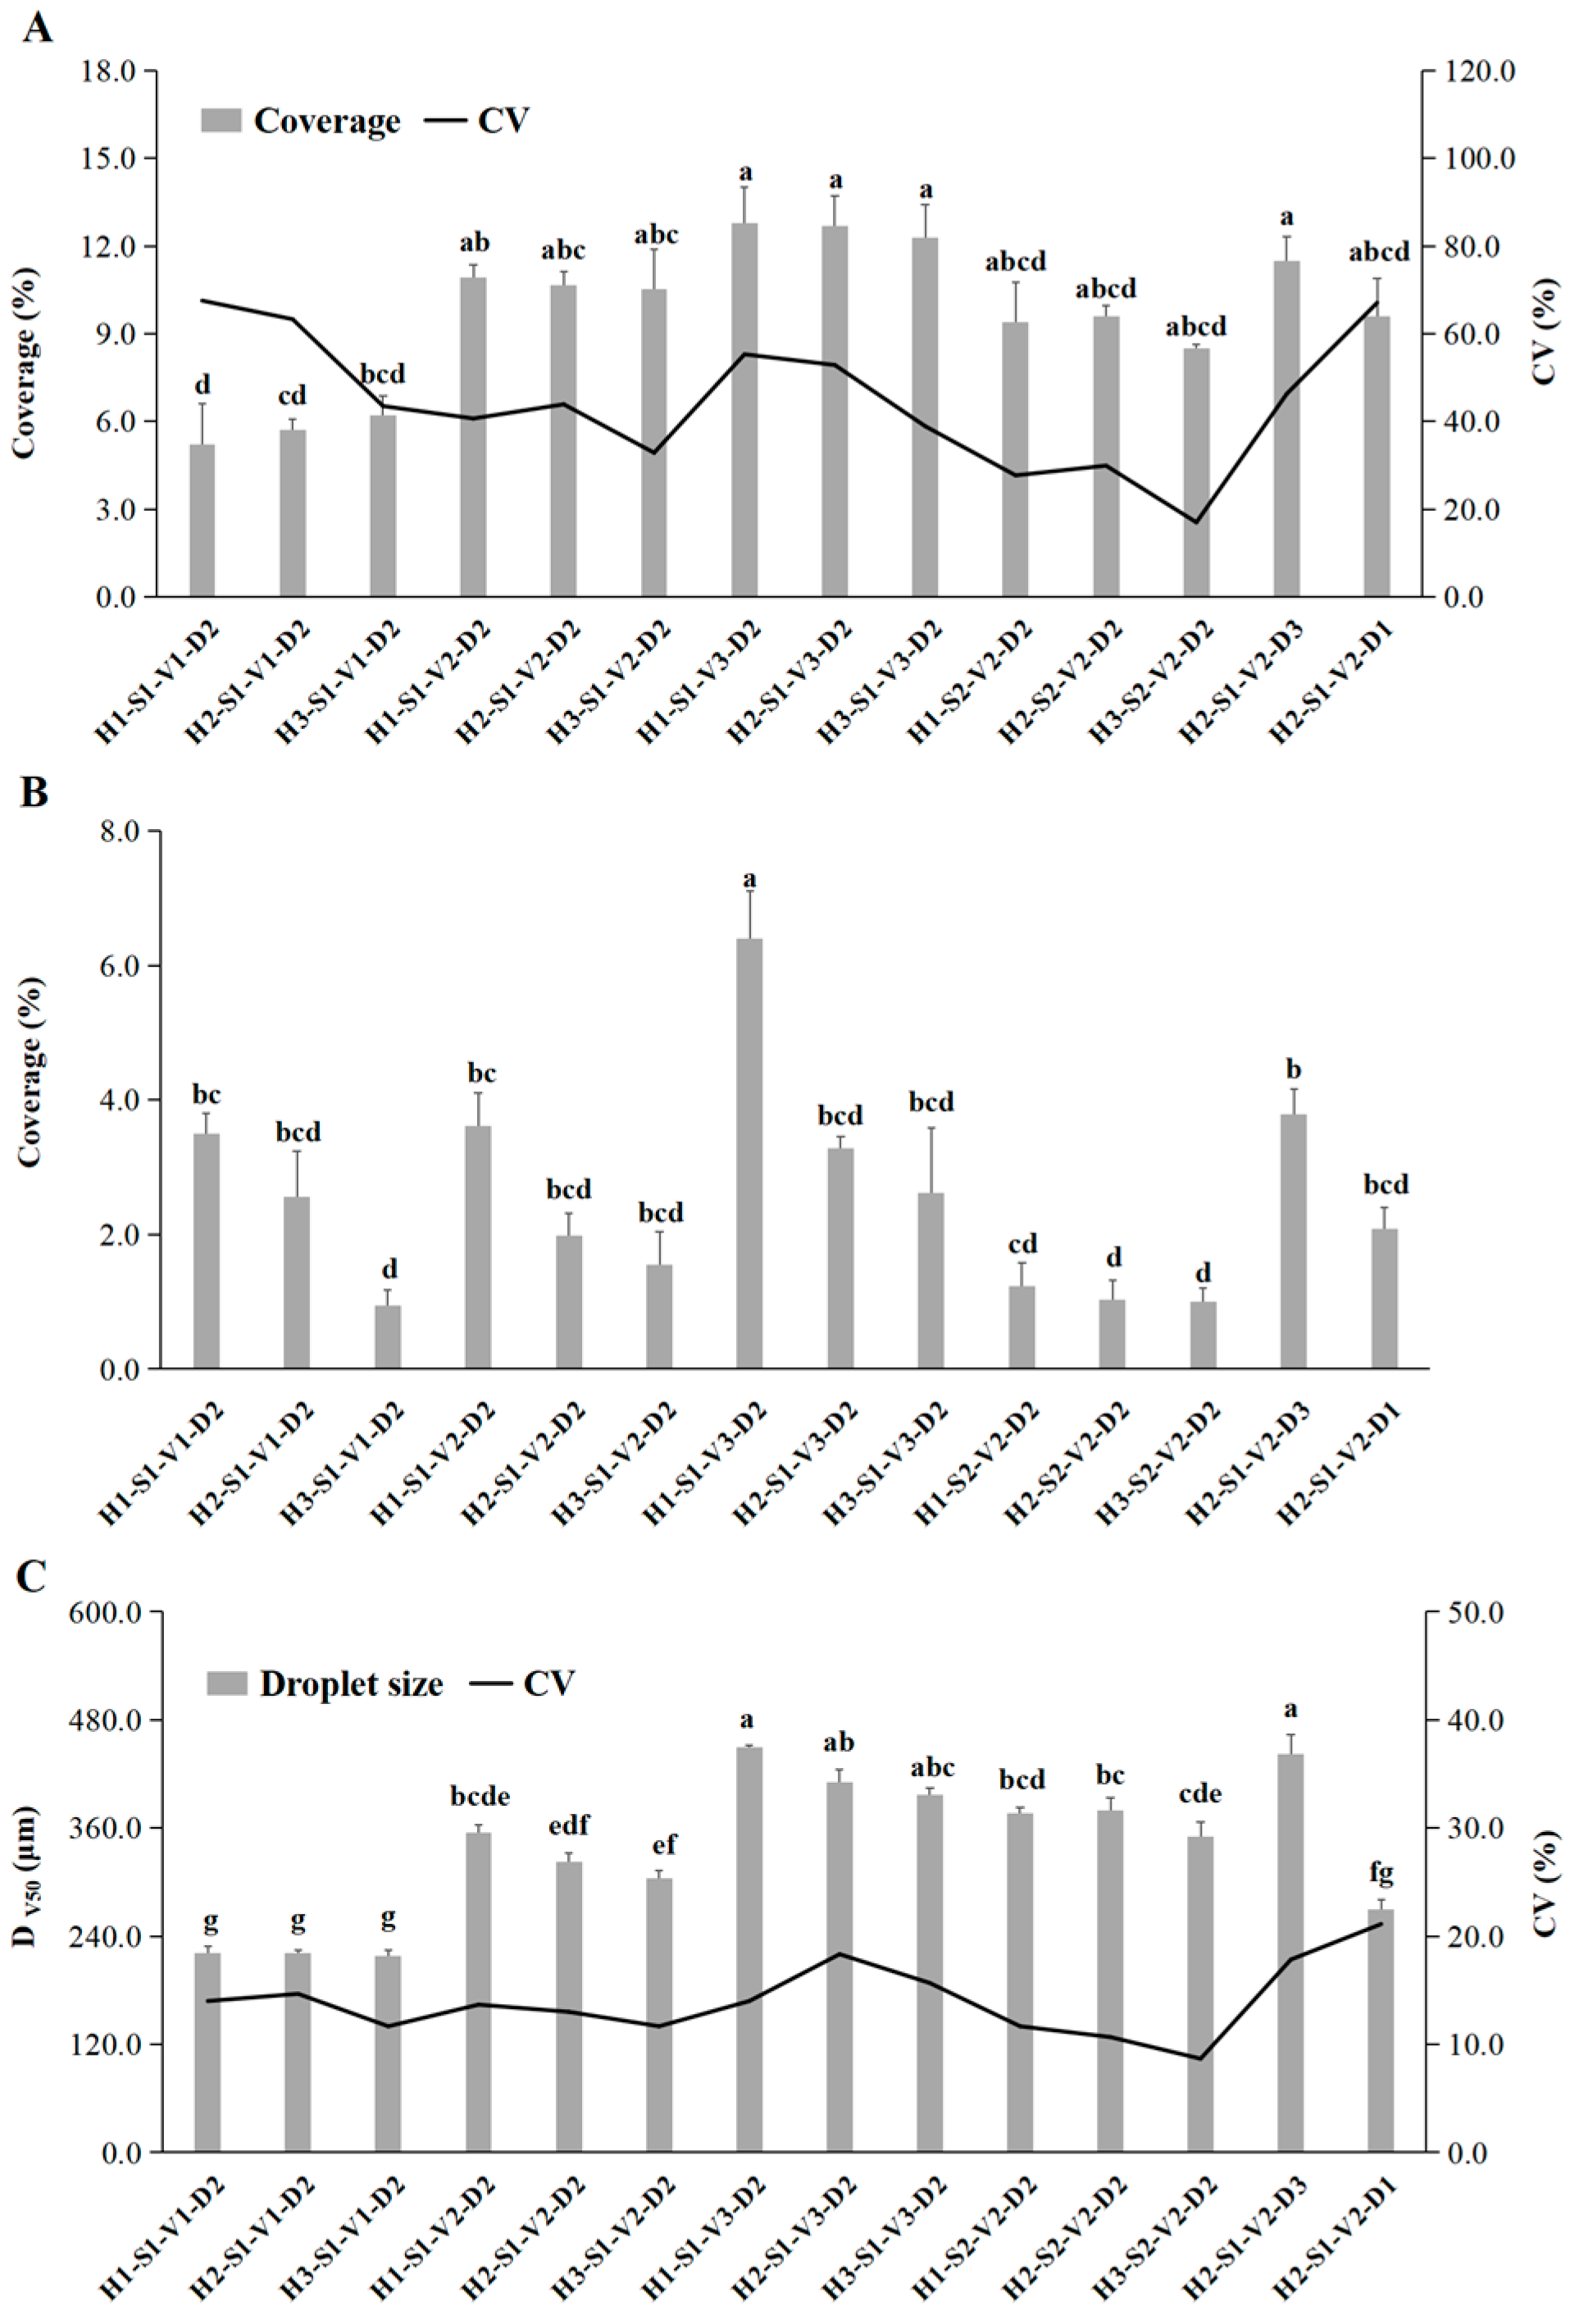
3.1. Effects of Operational Parameters on the Spraying Performance of T30 and T40

Factorial ANOVA results for the effects of different operational parameters on droplet deposition are summarized in Table 3. For T30, the spray volume significantly affected the spray coverage and droplet size at the tea canopy surface. For T40, the spray coverage at the tea canopy surface was significantly affected by the spray volume, the spray coverage at 15 cm below the tea canopy surface was significantly affected by the working height, driving speed, spray volume, and atomization diameter, while the droplet size was significantly affected by the driving speed, spray volume, and atomization diameter.
For the 10 treatments involving T30, coverage and its CV were 3.2–12.9% and 33.7–65.0%, respectively, and droplet size (Dv50) and its CV were 224.4–277.0 μm and 9.0–15.0%, respectively, at the tea canopy surface (Figure 1). Coverage increased significantly as the spray volume increased at the same working height and driving speed.
For the 14 treatments involving T40, coverage and its CV were 5.2–12.8% and 16.7–67.7%, respectively, and Dv50 and its CV were 217.6–449.5 μm and 8.7–18.3%, respectively, at the tea canopy surface (Figure 2). At the inner part of the tea canopy, coverage was 0.95–6.4% (Figure 2). In general, coverage and Dv50 at the tea canopy surface and coverage at the inner part of the tea canopy increased significantly as the spray volume increased. Moreover, increasing the driving speed caused Dv50 to increase and the coverage at the inner part of the tea canopy to decrease. Furthermore, increasing the working height decreased the coverage at the inner part of the tea canopy, whereas increasing the atomization diameter resulted in increases in Dv50 and coverage at the inner part of the tea canopy.

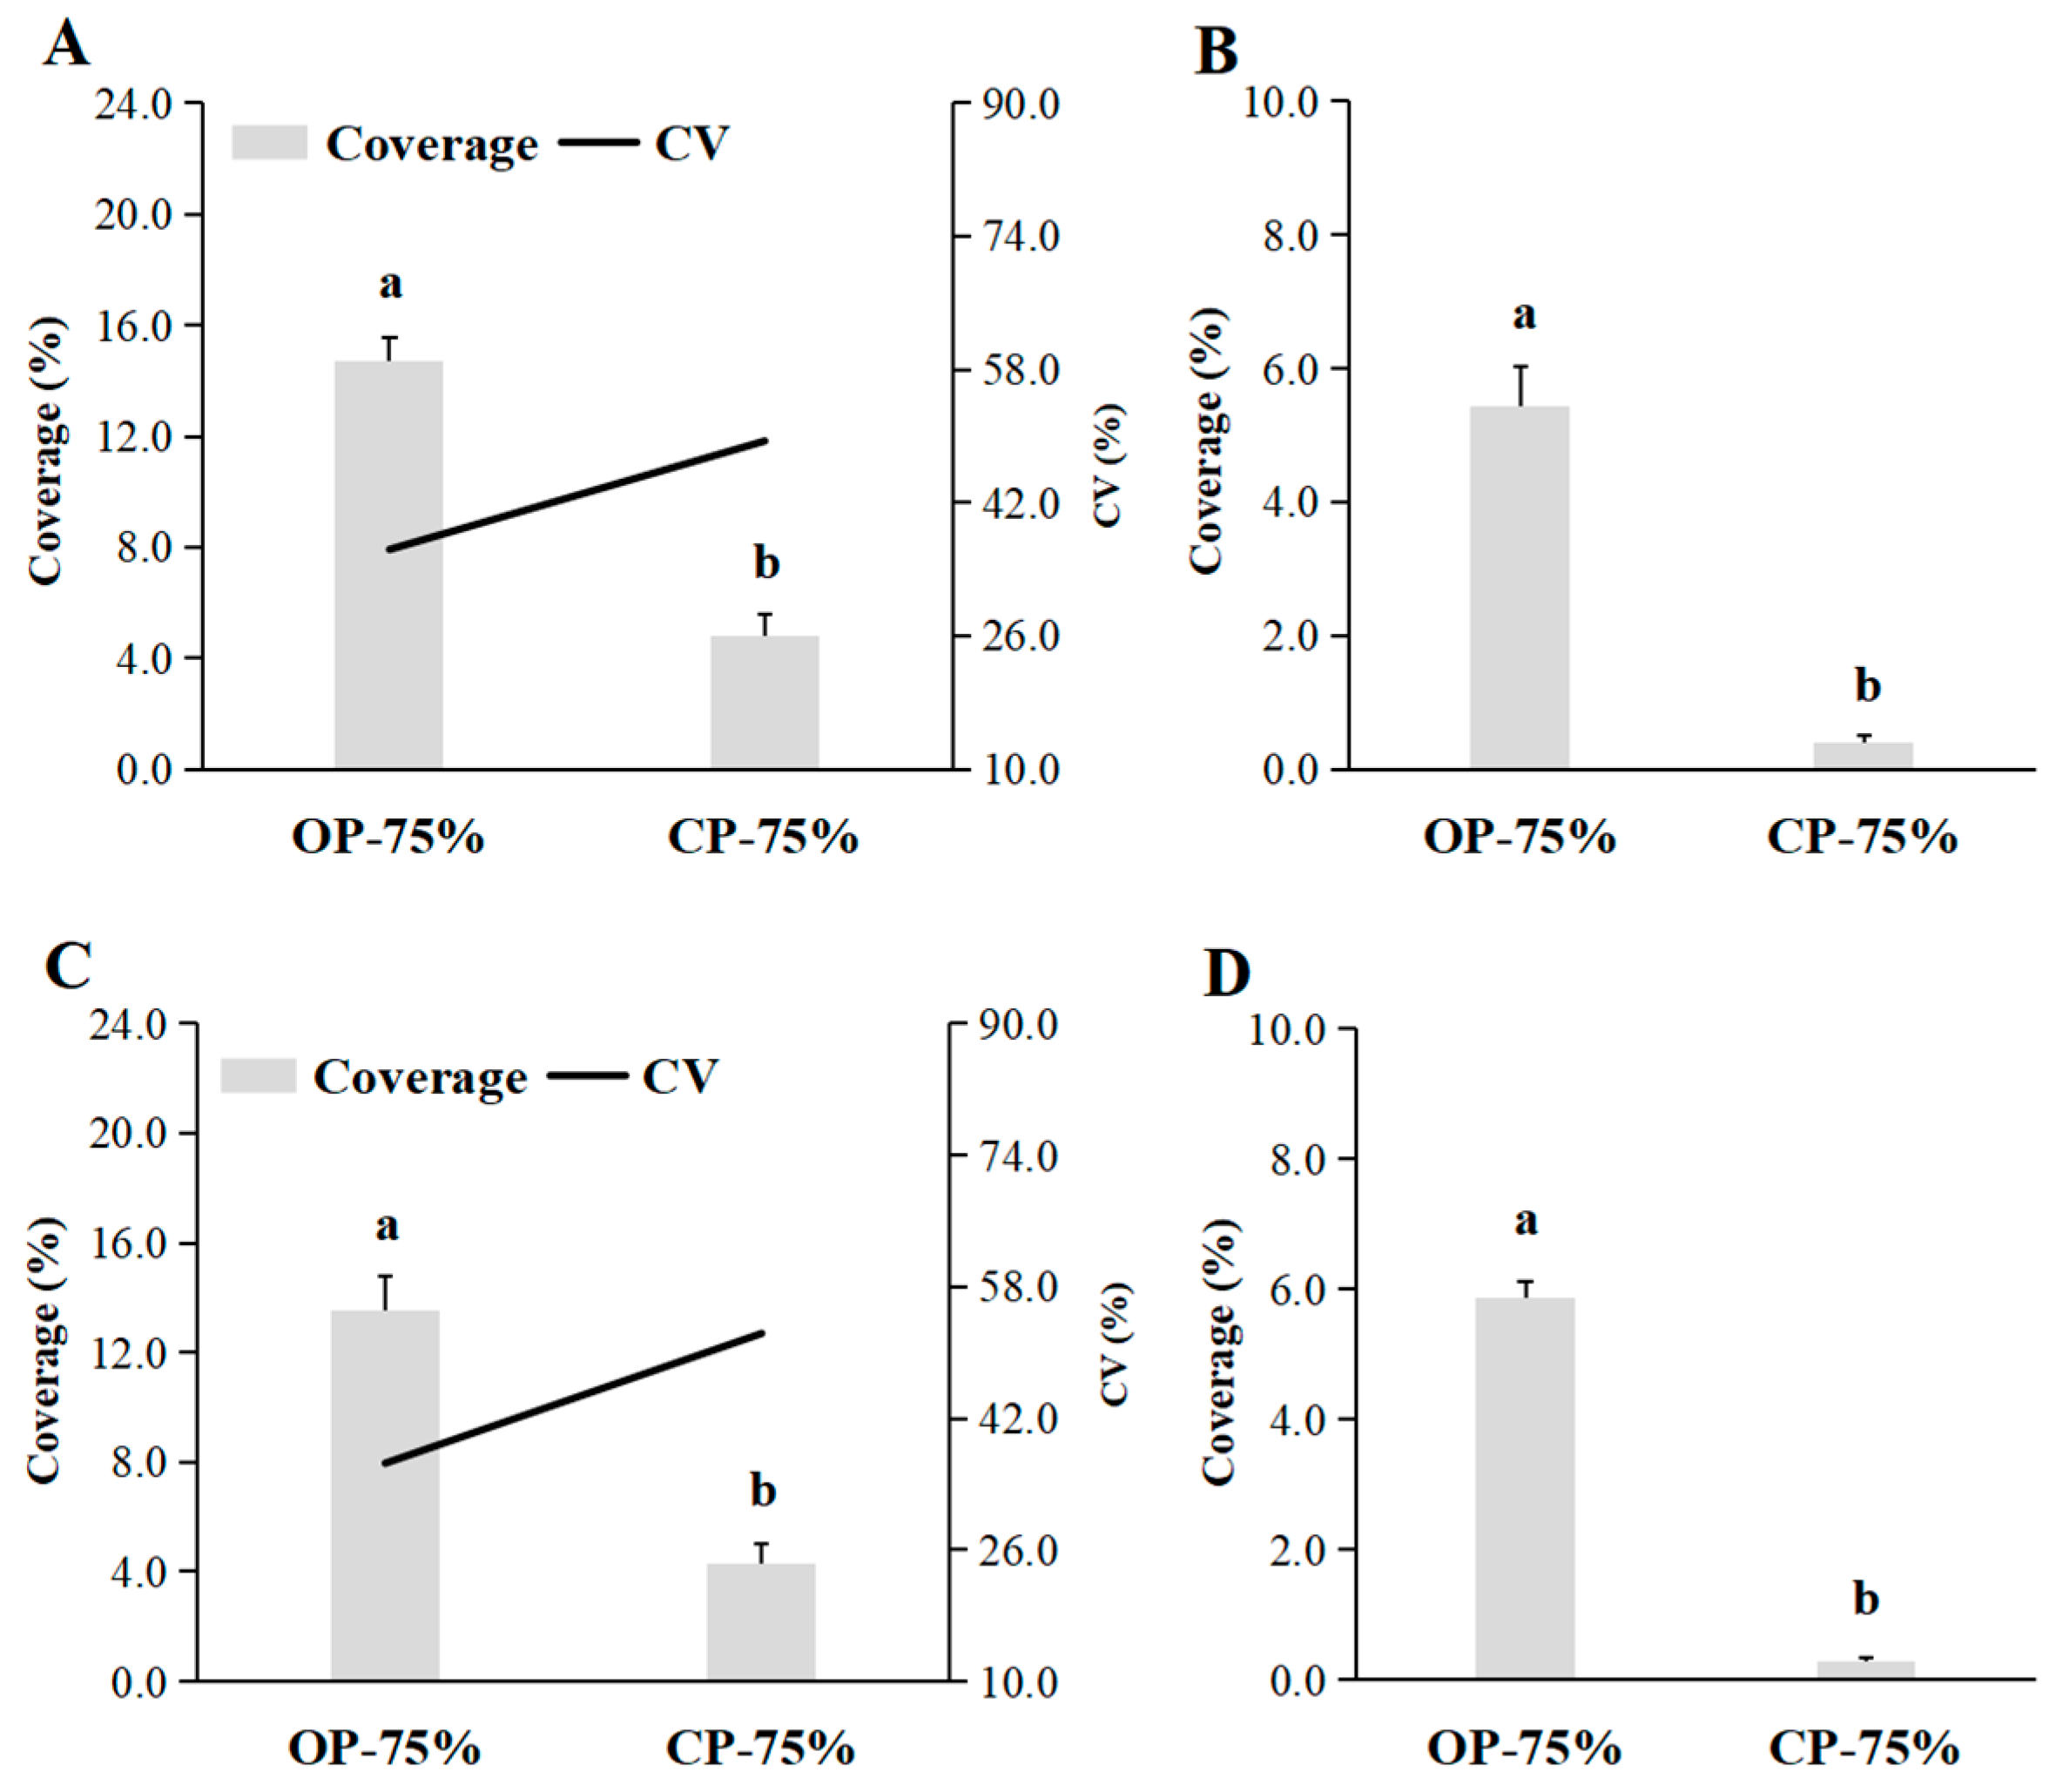
3.2. Comparison of Spraying Quality Between T30 and T40

Significantly more Allura Red was deposited at the surface and inner part of the tea canopy by T40 than by T30 under the same operational parameters (Figure 3). Allura Red levels at the surface and inner part of the tea canopy were 1.4 and 2.9 times higher, respectively, for T40 than for T30. Spray deposition CVs at the surface and inner part of the tea canopy were similar between T30 and T40.

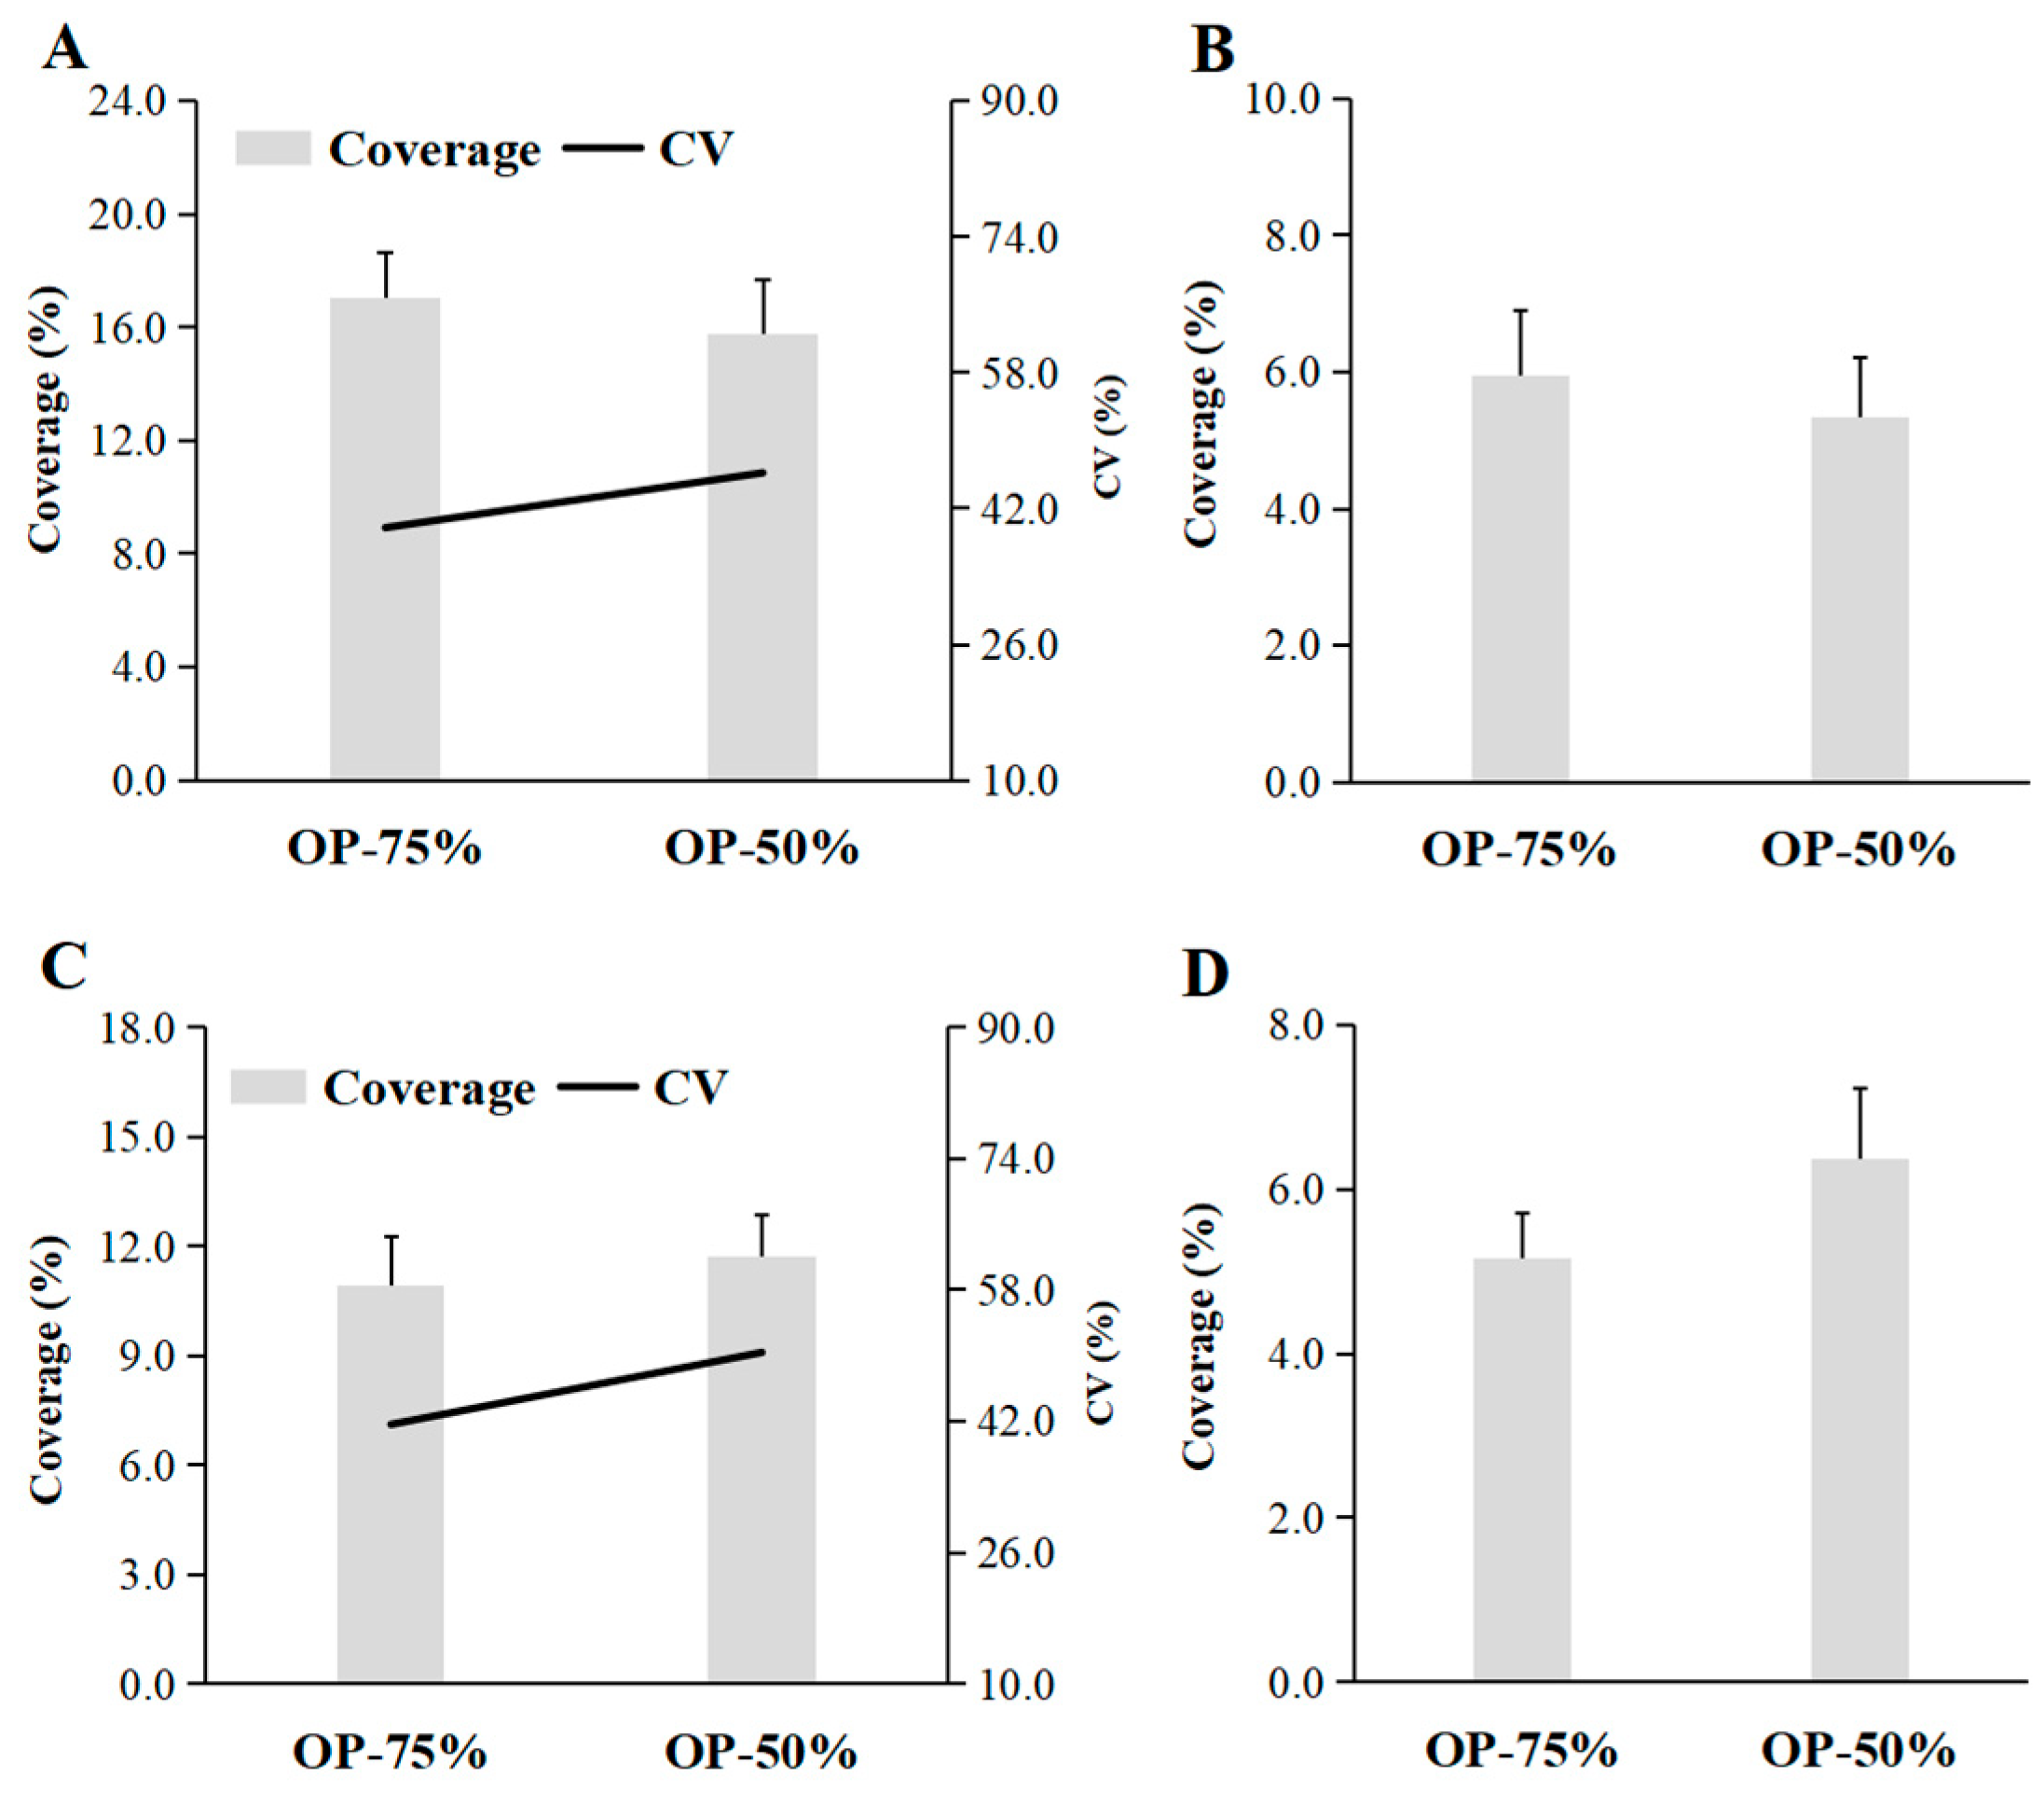
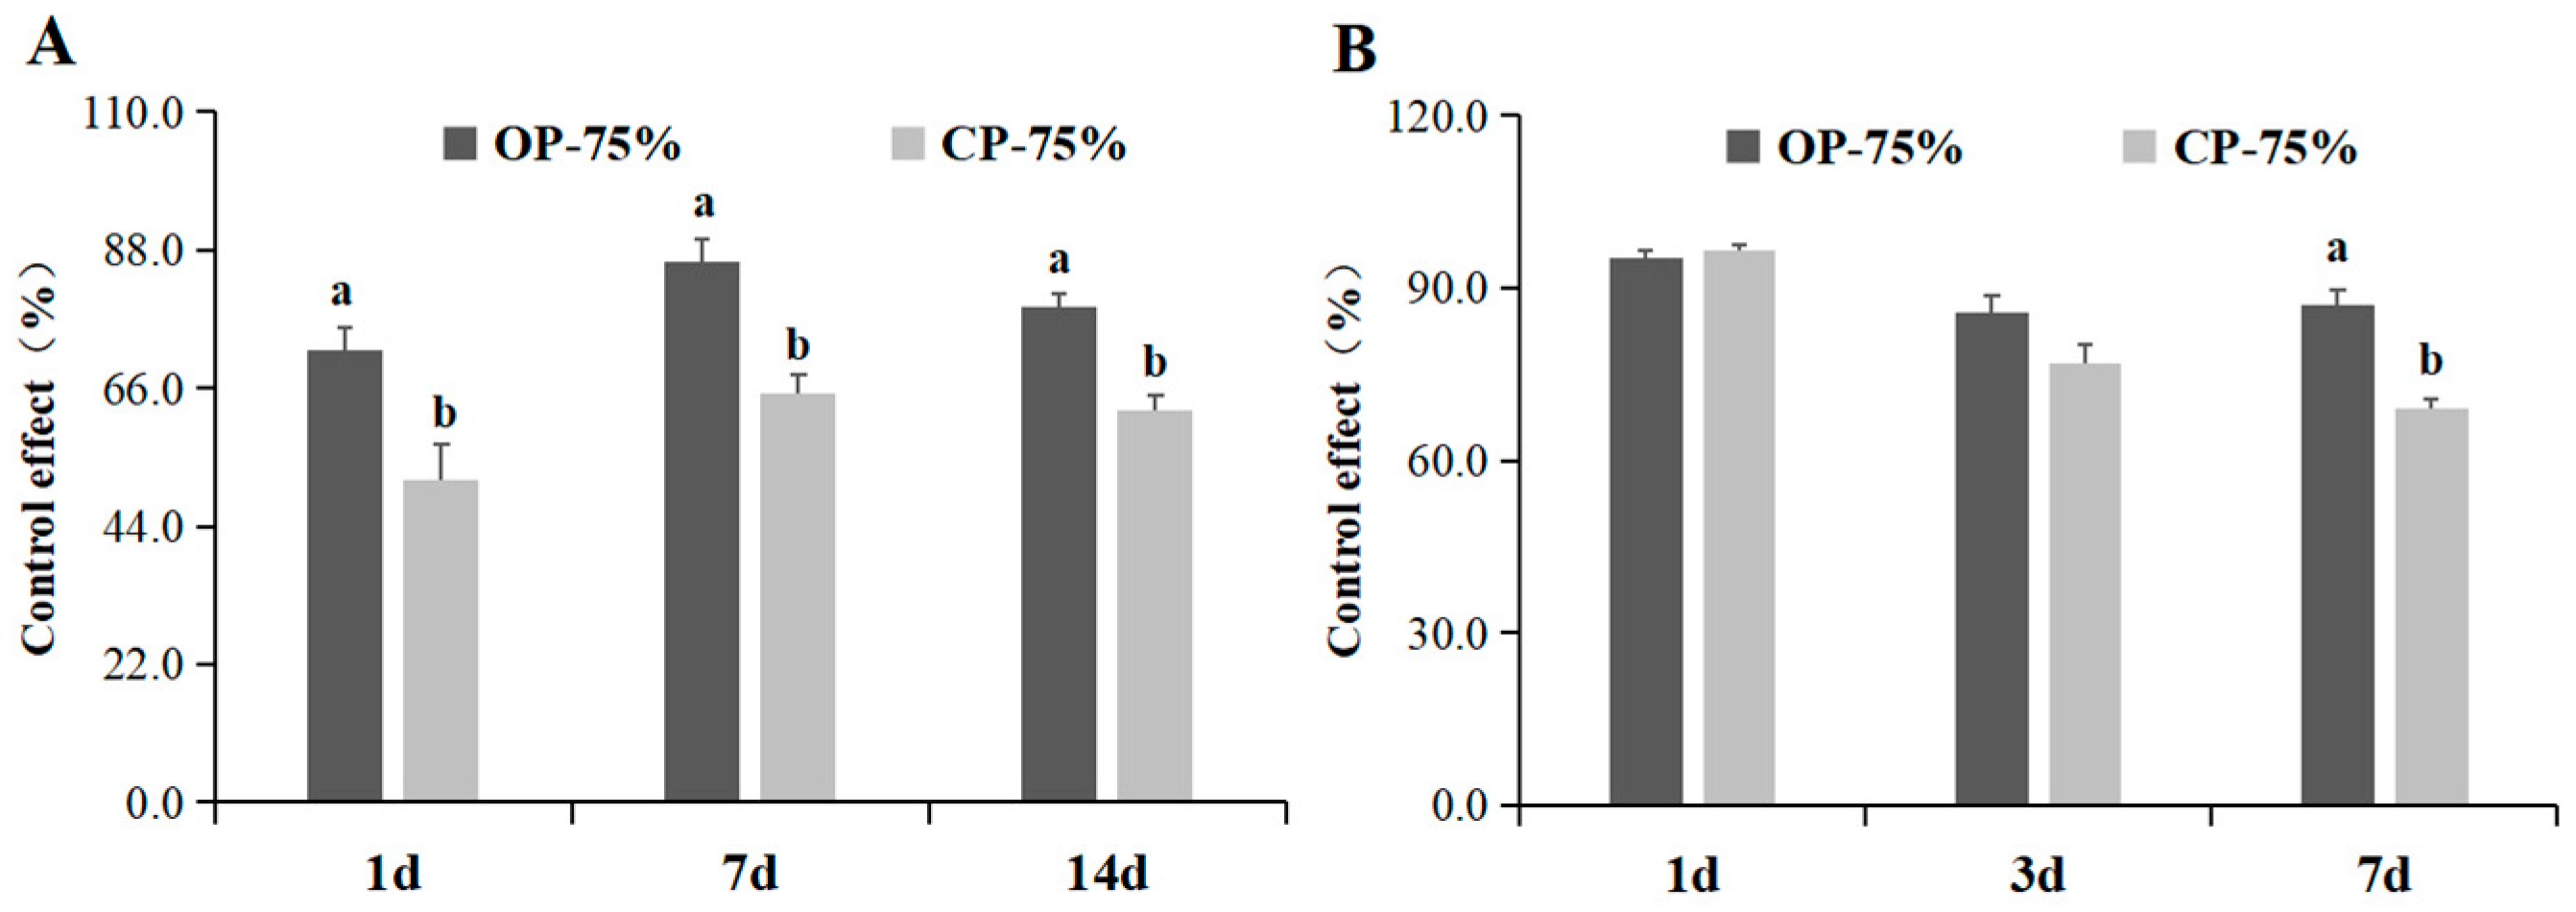
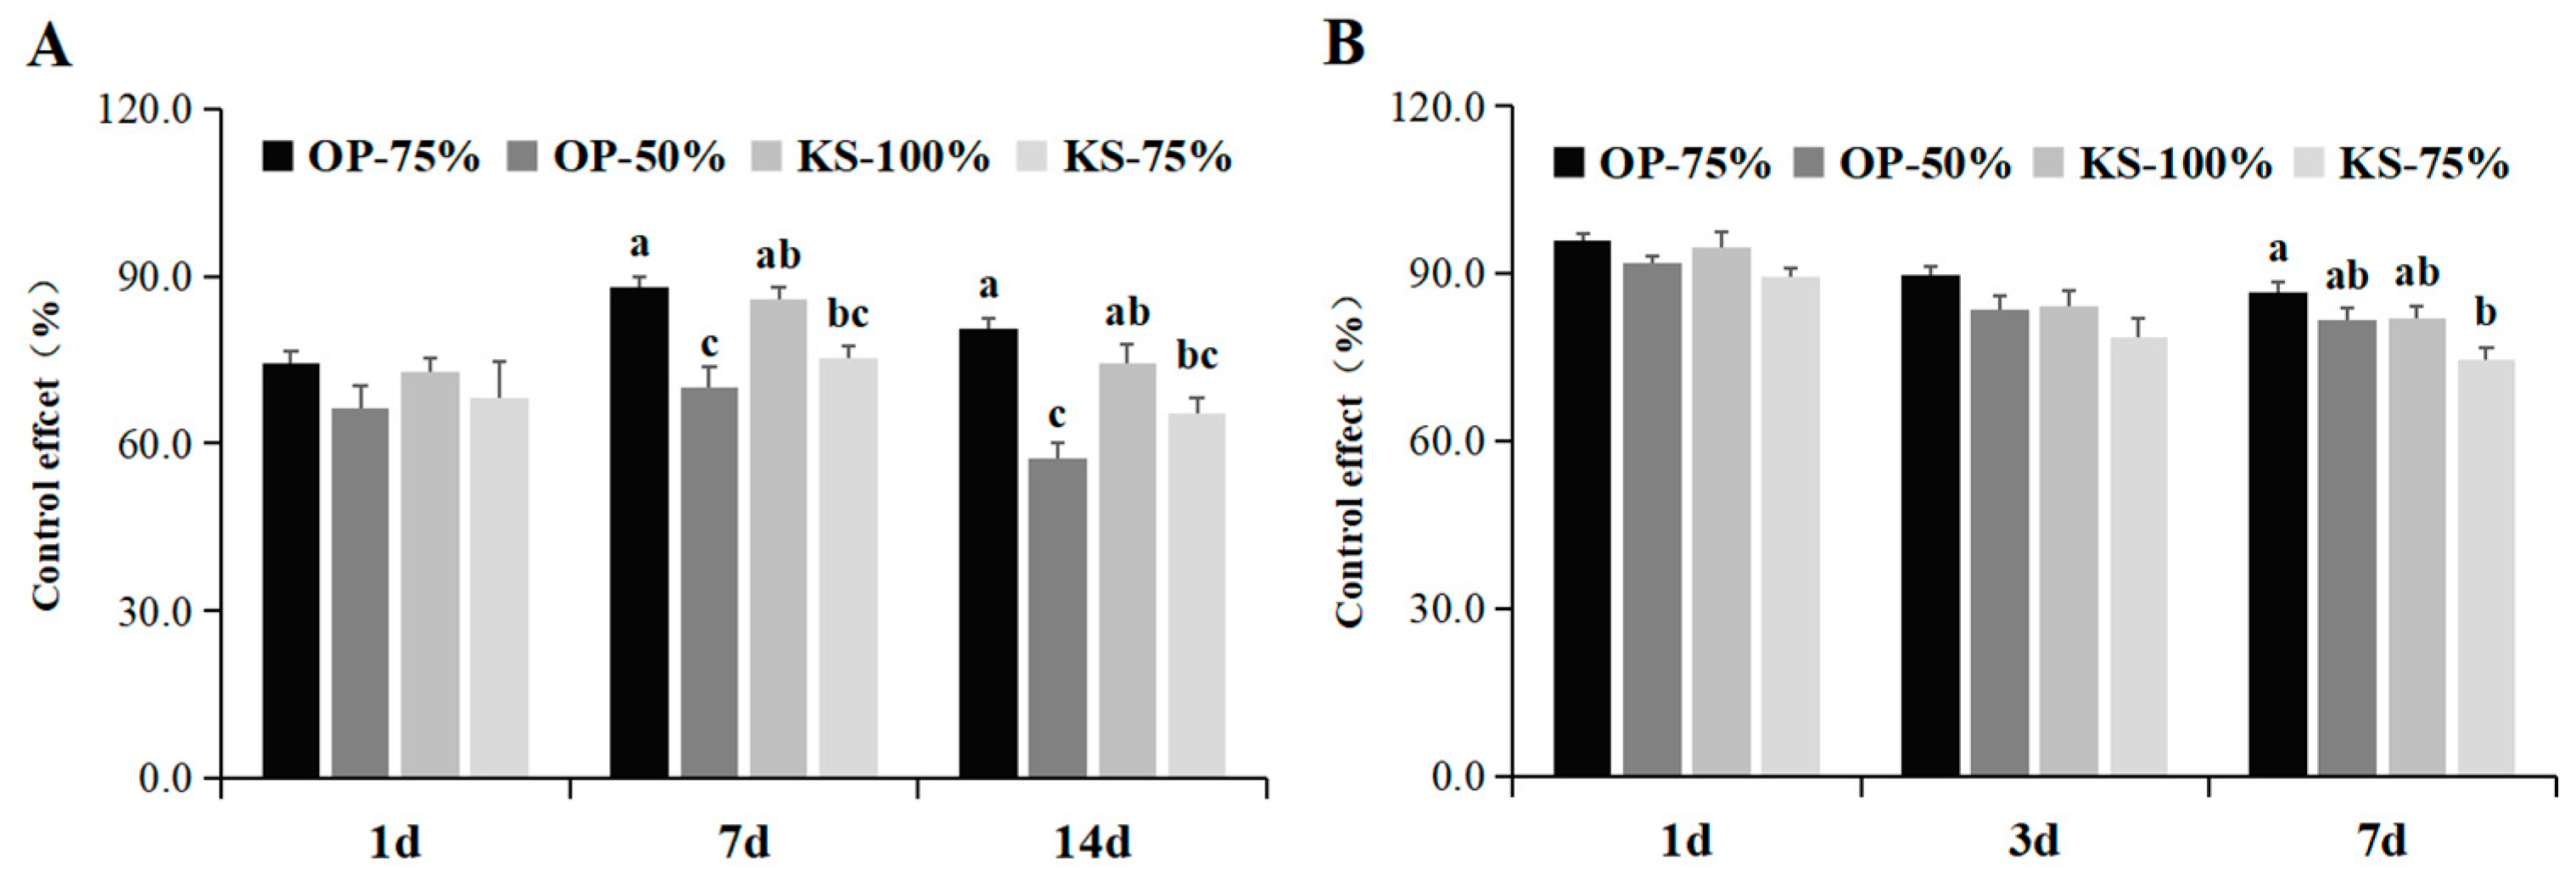
3.3. Control Effect of T40 Under Optimal Application Parameters

After operational parameters were optimized, the spray performance of T40 improved significantly. For the surface and inner part of the tea canopy, coverage in the OP-75% treatment was significantly higher than that in the CP-75% treatment in the first experiment (Figure 4), but was similar to that in the OP-50% treatment in the second experiment (Figure 5).
In the first experiment, the control effect of tolfenpyrad against the leafhoppers was significantly higher in the OP-75% treatment than that in the CP-75% treatment at 1, 7, and 14 days after spraying (Figure 6). Similar results were obtained for afidopyropen (Figure 6). In the second experiment, the control effect of tolfenpyrad in the OP-75% treatment was similar to that in the KS-100% treatment, but was significantly higher than that in the KS-75% treatment at 7 and 14 days after spraying (Figure 7). Similar results were also obtained for afidopyropen (Figure 7). The residue amounts of afidopyropen and tolfenpyrad in tea at 7 days after spraying were similar between the OP-75% and KS-100% treatments (Figure 8). Afidopyropen and tolfenpyrad residues were undetectable in the control.

4. Discussion

Spray coverage is a crucial determinant of the effectiveness of CP-UAVs. High-volume spraying (e.g., using a knapsack sprayer) is not necessarily associated with greater deposition, and a large spray volume can easily lead to run-off. Alternatively, when using CP-UAVs (low-volume spraying), a higher coverage and control effect can be obtained with a larger spray volume [4,8,11]. In this study, droplet coverage increased significantly as the spray volume increased for both T30 and T40 (Table 3, Figure 1 and Figure 2). According to earlier research, droplet coverage decreases significantly as the driving speed and working height increase [4,8,11]. However, in the present study, the droplet coverage at the tea canopy surface was not significantly affected by either of these operational parameters (Table 3). This difference is likely related to the diversity in CP-UAV types and test conditions among various studies.
To control drift and to improve the droplet adhesion rate, droplet penetrability must be enhanced [25]. Moreover, many pests and pathogens are present in the lower parts of tea plants. Therefore, droplet penetrability is an important consideration when using CP-UAVs. In this study, trials involving T40 showed that droplet penetrability can be improved by increasing the spray volume and decreasing the working height and driving speed (Table 3, Figure 2). Increasing the spray volume can make it difficult for the liquid flow to be completely atomized by the nozzle and broken up by air resistance, resulting in relatively large droplets [26]. Notably, in terms of penetrability, large droplets may be better than small droplets [27]. The driving speed and working height of CP-UAVs affect the downwash airflow, which in turn affects the droplet penetrability. The downwash airflow can accelerate the deposition speed of droplets and blow the upper leaves of the crop at the same time, thereby enabling droplets to reach the lower part of plants [28,29,30,31]. Decreasing the working height and driving speed can create a relatively strong and persistent downwash airflow, leading to enhanced droplet penetration. The results of the current study indicate that the droplet penetrability of T40 was better than that of T30 (Figure 3). Compared with T30, T40 has a greater total weight and tank volume, and requires a stronger downwash airflow to fly.
Droplet size and deposition uniformity are also important factors for pest control. Droplets should ideally be 100–300 µm [28]. If the droplets are too small, they readily evaporate and drift, but if they are too large, it is difficult for them to penetrate the plant canopy and adhere to the leaf surface [32]. However, suitable droplet size ranges vary depending on the crop and environmental conditions. In this study, the droplet size range of T30 was 224.4–277.0 µm, and that of T40 was 217.6–449.5 µm under the medium atomization diameter (Figure 1 and Figure 2). Moreover, the driving speed significantly affected the droplet size for T40, but not for T30, likely because of differences in their nozzles. T30 has hydraulic nozzles, whereas T40 has centrifugal nozzles. These two nozzles differ in terms of atomization principles [27]. For the droplet distribution uniformity, the coverage CV should be less than 60% [33]. In this study, the largest coverage CVs were 65.0% and 67.7% for T30 and T40, respectively (Figure 1 and Figure 2). These CVs were obtained under the lowest flight speed and height and smallest spray volume. These results suggest that increasing the driving speed and working height can improve the coverage CV. There are two views regarding the effects of operational parameters on the coverage CV. One is that droplet deposition uniformity is improved by a large spray volume, low flying height, and slow speed [34], while the other is that droplet deposition uniformity is enhanced by increasing the driving speed [35,36]. This inconsistency might be due to differences in CP-UAV types and test conditions among studies.
Droplet coverage, penetrability, size, and deposition uniformity reflect different aspects of spraying quality, and can differently vary with the operational parameters. For example, a low working height can improve spray coverage, but it decreases uniformity [37]. Therefore, it is important to consider the effects of operational parameters on different aspects of spraying quality and adjust these parameters to obtain a satisfactory control effect and maximize the efficiency. In this study, the droplet coverage at the surface and inner part of the tea canopy was important for selecting the CP-UAV type and optimizing operational parameters for controlling tea leafhoppers, which mainly feed on the tender tea leaves and exhibit photophobic behavior during the day. Therefore, T40 was selected, with an optimal spray volume, driving speed, and working height of 120 L·ha−1, 3 m·s−1, and 2.5 m, respectively. However, the operational parameters of CP-UAVs in tea gardens should be adjusted according to the location of pests on tea plants and the CP-UAV type.
Many studies have shown that improving droplet distribution by optimizing operational parameters can enhance the control effect of CP-UAVs [4,8,11,38,39,40]. In this study, there were approximately 3- and 10-fold increases in droplet coverage at the surface and inner part of the tea canopy, respectively, after the operational parameters of T40 were improved (Figure 4). Then, the control effects of both tolfenpyrad and afidopyropen increased by about 20% (Figure 6). The control effect of tolfenpyrad in the OP-75% treatment was similar to that in the KS-100% treatment, but was significantly higher than that in the KS-75% treatment (Figure 7). This phenomenon was less obvious for afidopyropen (Figure 7), possibly because the minimum afidopyropen dose was too high. The control effect of afidopyropen was similarly high in the OP-50% and OP-75% treatments (Figure 7). Overall, these results indicate that compared with knapsack sprayers, CP-UAVs can decrease the amount of chemical pesticide applied in tea gardens by 25%. Earlier studies showed that using CP-UAVs can decrease chemical pesticide applications by 20–30% in other crops, including rice, chestnut, pepper, and sugarcane [40,41,42].
Although the CP-UAVs applied a lower volume and had a lower coverage than the knapsack sprayer, their control effect was superior. This is because droplet density and size are more important factors for pest control than spray coverage. According to an earlier study, the median lethal dose of dicofol for the spider mite Tetranychus urticae decreased as the droplet size decreased [43]. In another study, the control effect of small droplets (50–150 μm) of Bacillus thuringiensis against gypsy moth larva was better than that of larger droplets (>150 μm) [44]. Moreover, a positive curvilinear relationship was detected between droplet size and LS50 (the spacing of droplets required to kill 50% of the targeted organism) [45]. Thus, compared with large droplets, fine and dense droplets are better for the application of pesticides. In general, CP-UAVs produce significantly smaller droplets than knapsack sprayers [6,8,11,27].
Pesticide residues must also be considered when using CP-UAVs, but there has been limited relevant research. Because tea is a beverage with health benefits, its quality and safety are of considerable interest to consumers. Therefore, pesticide residue levels in tea must be examined after the pesticide application using CP-UAVs. In this study, when T40 was used to apply pesticides at 75% of the conventional amount, there were no significant increases in pesticide residues, relative to the levels following the application of the conventional amount using a knapsack sprayer (Figure 8). Therefore, CP-UAVs are suitable for applying pesticides in tea gardens.

5. Conclusions

CP-UAVs, which can greatly reduce crop protection-related labor demands, are a relatively new tool in tea gardens. In this study, the spraying performance of two CP-UAVs (T30 and T40) under different operational parameters were compared in tea gardens, and the control effect of CP-UAVs against tea leafhoppers was investigated. The results showed that droplet coverage and size increased as the spray volume increased for both T30 (from 30 L·ha−1 to 90 L·ha−1) and T40 (from 60 L·ha−1 to 150 L·ha−1), and that the droplet penetrability of T40 increased significantly when the working height decreased from 5 to 2 m and the driving speed decreased from 5 to 3 m·s−1. When operated under the same parameters, the deposition at the surface and inner part of the tea canopy was 1.4 and 2.9 times higher, respectively, for T40 than for T30. The spray performance of T40 was significantly better under optimal operational parameters (driving speed of 3 m·s−1, working height of 2.5 m, and spray volume of 120 L·ha−1) than under conventional application parameters (driving speed of 5 m·s−1, working height of 4.5 m, and spray volume of 45 L·ha−1). Notably, the control effect against tea leafhoppers increased by approximately 20% following the optimization of operational parameters. Moreover, compared with a traditional knapsack sprayer, T40 under optimal operational parameters decreased the amount of pesticide required to control tea leafhoppers by 25%. Furthermore, pesticide residue levels in tea were similar after pesticides were applied using CP-UAVs and a knapsack sprayer. These results provide insights and data relevant for the use of CP-UAVs in tea gardens, with potential implications for the development of a modern, intensive, and sustainable tea industry, while also reflecting the importance of optimizing CP-UAV operational parameters for improving pest control practices.

Author Contributions

X.C. and G.W. conceived the research idea, designed the experiments, and revised the manuscript; Z.C. conceived the research idea and designed the experiments; M.W. performed the field experiments, analyzed the data, and wrote the paper; Z.L. (Zhaoqun Li) designed and performed the flight parameter optimization tests; Y.Y. proposed the research requirement and provided the CP-UAVs; X.M. designed and performed the control effect test; Z.L. (Zongxiu Luo) and L.B. performed the field experiments, and measured the WSP and Allura Red; C.X. and N.F. analyzed the data and wrote the paper. All authors have read and agreed to the published version of the manuscript.

Funding

This work was supported by the Modern Agricultural Industry Technology System (CARS-19, China), National Key Research and Development Program of China (2022YFD1600803), and Zhejiang Provincial Natural Science Foundation of China (LY24C140002).

Data Availability Statement

The original contributions presented in the study are included in the article; further inquiries can be directed to the corresponding authors.

Conflicts of Interest

The authors declare no conflicts of interest.

References

  1. Yang, C.S.; Hong, J. Prevention of chronic diseases by tea: Possible mechanisms and human relevance. Annu. Rev. Nutr. 2013, 33, 161–181. [Google Scholar] [CrossRef] [PubMed]
  2. Hazzrika, L.K.; Bhuyan, M.; Hazarika, B.N. Insect pests of tea and their management. Annu. Rev. Entomol. 2009, 54, 267–286. [Google Scholar] [CrossRef] [PubMed]
  3. Mogili, U.M.R.; Deepak, B.B.V.L. Review on application of drone systems in precision agriculture. Procedia Comput. Sci. 2018, 133, 502–509. [Google Scholar] [CrossRef]
  4. Delavarpour, N.; Koparan, C.; Zhang, Y.; Steele, D.D.; Betitame, K.; Bajwa, S.G.; Sun, X. A review of the current unmanned aerial vehicle sprayer applications in precision agriculture. J. ASABE 2023, 66, 703–721. [Google Scholar] [CrossRef]
  5. Hanif, A.S.; Han, X.; Yu, S.H. Independent control spraying system for UAV-based precise variable sprayer: A review. Drones 2022, 6, 383. [Google Scholar] [CrossRef]
  6. Zhang, R.R.; Hewitt, A.J.; Chen, L.P.; Li, L.L.; Tang, Q. Challenges and opportunities of unmanned aerial vehicles as a new tool for crop pest control. Pest Manag. Sci. 2023, 79, 4123–4131. [Google Scholar] [CrossRef]
  7. Martinez-Guanter, J.; Agüera, P.; Agüera, J.; Perez-Ruiz, M. Spray and economics assessment of a UAV-based ultra-low-volume application in olive and citrus orchards. Precis. Agric. 2020, 21, 226–243. [Google Scholar] [CrossRef]
  8. Subramanian, K.S.; Pazhanivelan, S.; Srinivasan, G.; Santhi, R.; Sathiah, N. Drones in insect pest management. Front Agron. 2021, 3, 640885. [Google Scholar] [CrossRef]
  9. Biglia, A.; Grella, M.; Bloise, N.; Comba, L.; Mozzanini, E.; Sopegno, A.; Pittarello, M.; Dicembrini, E.; Alcatrao, L.E.; Guglieri, G. UAV-spray application in vineyards: Flight modes and spray system adjustment effects on canopy deposit, coverage, and off-target losses. Sci. Total Environ. 2022, 845, 157292. [Google Scholar] [CrossRef]
  10. Huang, Z.; Wang, C.L.; Wongsuk, S.; Qi, P.; Liu, L.M.; Qiao, B.Y.; Zhong, L.; He, X.K. Field evaluation of a six-rotor unmanned agricultural aerial sprayer: Effects of application parameters on spray deposition and control efficacy against rice planthopper. Pest Manag. Sci. 2023, 79, 4664–4678. [Google Scholar] [CrossRef]
  11. Hu, H.; Kaizu, Y.; Huang, J.; Furuhashi, K.; Zhang, H.; Li, M.; Imou, K. Research on methods decreasing pesticide waste based on plant protection unmanned aerial vehicles: A review. Front Plant Sci. 2022, 13, 811256. [Google Scholar] [CrossRef] [PubMed]
  12. Ebert, T.A.; Taylor, R.A.; Downer, R.A.; Hall, F.R. Deposit structure and efficacy of pesticide application. 1: Interactions between deposit size, toxicant concentration and deposit number. Pest Sci. 1999, 55, 783–792. [Google Scholar]
  13. Wang, J.; Lan, Y.; Zhang, H.; Zhang, Y.; Wen, S.; Yao, W.; Deng, J. Drift and deposition of pesticide applied by UAV on pineapple plants under different meteorological conditions. Int. J. Agric. Biol. Eng. 2018, 11, 5–12. [Google Scholar] [CrossRef]
  14. Hou, C.; Tang, Y.; Luo, S.; Lin, J.; He, Y.; Zhuang, J.; Huang, W. Optimization of control parameters of droplet density in citrus trees using UAVs and the Taguchi method. Int. J. Agric. Biol. Eng. 2019, 12, 1–9. [Google Scholar] [CrossRef]
  15. Martin, D.E.; Woldt, W.E.; Latheef, M.A. Effect of application height and ground speed on spray pattern and droplet spectra from remotely piloted aerial application systems. Sensors 2019, 3, 83. [Google Scholar] [CrossRef]
  16. Li, X.; Giles, D.K.; Niederholzer, F.J.; Andaloro, J.T.; Lang, E.B.; Watson, L.J. Evaluation of an unmanned aerial vehicle as a new method of pesticide application for almond crop protection. Pest Manag. Sci. 2021, 77, 527–537. [Google Scholar] [CrossRef]
  17. Li, L.; Hu, Z.; Liu, Q.; Yi, T.; Han, P.; Zhang, R.; Pan, L. Effect of flight velocity on droplet deposition and drift of combined pesticides sprayed using an unmanned aerial vehicle sprayer in a peach orchard. Front. Plant Sci. 2022, 13, 981494. [Google Scholar] [CrossRef]
  18. da Vitória, E.L.; de Oliveira, R.F.; Crause, D.H.; Ribeiro, L.F.O. Effect of flight operative height and genotypes on conilon coffee spraying using an unmanned aerial vehicle. Coffee Sci. 2022, 17, e172003. [Google Scholar]
  19. Dengeru, Y.; Ramasamy, K.; Allimuthu, S.; Balakrishnan, S.; Kumar, A.P.M.; Kannan, B.; Karuppasami, K.M. Study on spray deposition and drift characteristics of UAV agricultural sprayer for application of insecticide in redgram crop (Cajanus cajan L. Millsp.). Agronomy 2022, 12, 3196. [Google Scholar] [CrossRef]
  20. Ribeiro, L.F.O.; Vitória, E.L.D.; Soprani Júnior, G.G.; Chen, P.; Lan, Y. Impact of operational parameters on droplet distribution using an unmanned aerial vehicle in a papaya orchard. Agronomy 2023, 13, 1138. [Google Scholar] [CrossRef]
  21. Qi, P.; Zhang, L.; Wang, Z.; Han, H.; Müller, J.; Li, T.; Wang, C.L.; Huang, Z.; He, M.; Liu, Y.J.; et al. Effect of operational parameters of unmanned aerial vehicle (UAV) on droplet deposition in trellised pear orchard. Drones 2023, 7, 57. [Google Scholar] [CrossRef]
  22. Hua, D.K.; Zheng, X.B.; Zhang, K.; Zhang, Z.; Wan, Y.R.; Zhou, X.G.; Zhang, Y.J.; Wu, Q.J. Assessing pesticide residue and spray deposition in greenhouse eggplant canopies to improve residue analysis. J. Agric. Food Chem. 2020, 68, 11920–11927. [Google Scholar] [CrossRef] [PubMed]
  23. Guo, M.M.; Qin, Y.J.; Sun, H.Z.; Li, Z.Q.; Zhang, X.Z.; Wang, X.R.; Yang, M.; Luo, F.J.; Chen, Z.M.; Zhou, L. Method validation for detection of afidopyropen and M440I007 in tea. J. Sci. Food Agric. 2023, 103, 5738–5746. [Google Scholar] [CrossRef] [PubMed]
  24. Wang, Z.H.; Wang, X.R.; Wang, M.; Li, Z.Q.; Zhang, X.Z.; Zhou, L.; Sun, H.Z.; Yang, M.; Lou, Z.Y.; Chen, Z.M.; et al. Establishment of a QuEChERS-UPLC-MS/MS method for simultaneously detecting tolfenpyrad and its metabolites in tea. Agronomy 2022, 12, 2324. [Google Scholar] [CrossRef]
  25. Wang, G.B.; Lan, Y.B.; Yuan, H.Z.; Qi, H.X.; Chen, P.C.; Ouyang, F.; Han, Y.X. Comparison of spray deposition, control efficacy on wheat aphids and working efficiency in the wheat field of the unmanned aerial vehicle with boom sprayer and two conventional knapsack sprayers. Appl. Sci. 2019, 9, 218. [Google Scholar] [CrossRef]
  26. Giles, D.; Billing, R. Unmanned aerial platforms for spraying: Deployment and performance. Asp. Appl. Biol. 2014, 122, 63–69. [Google Scholar]
  27. Chen, P.; Douzals, J.P.; Lan, Y.; Cotteux, E.; Delpuech, X.; Pouxviel, G.; Zhan, Y.L. Characteristics of unmanned aerial spraying systems and related spray drift: A review. Front Plant Sci. 2022, 13, 870956. [Google Scholar] [CrossRef]
  28. Ferguson, J.C.; Chechetto, R.G.; Hewitt, A.J.; Chauhan, B.S.; Adkins, S.W.; Kruger, G.R.; O’Donnell, C.C. Assessing the deposition and canopy penetration of nozzles with different spray qualities in an oat (Avena sativa L.) canopy. Crop Prot. 2016, 81, 14–19. [Google Scholar] [CrossRef]
  29. De, C.S.; Bin, L.Y.; Li, J.Y.; Zhou, Z.Y.; Liu, A.M.; Mao, Y.D. Effect of wind field below unmanned helicopter on droplet deposition distribution of aerial spraying. Int. J. Agric. Biol. Eng. 2017, 10, 67–77. [Google Scholar]
  30. Shi, Q.; Liu, D.; Mao, H.; Shen, B.; Li, M. Wind-induced response of rice under the action of the downwash flow field of a multi-rotor UAV. Biosyst. Eng. 2021, 203, 60–69. [Google Scholar] [CrossRef]
  31. Zhan, Y.L.; Chen, P.C.; Xu, W.C.; Chen, S.D.; Han, Y.F.; Lan, Y.B.; Wang, G.B. Influence of the downwash airflow distribution characteristics of a plant protection UAV on spray deposit distribution. Biosyst. Eng. 2022, 216, 32–45. [Google Scholar] [CrossRef]
  32. Qin, W.C.; Qiu, B.J.; Xue, X.Y.; Chen, C.; Xu, Z.F.; Zhou, Q.Q. Droplet deposition and control effect of insecticides sprayed with an unmanned aerial vehicle against plant hoppers. Crop Prot. 2016, 85, 79–88. [Google Scholar] [CrossRef]
  33. Wongsuk, S.; Qi, P.; Wang, C.L.; Zeng, A.J.; Sun, F.Y.; Yu, F.Q.; Zhao, X.; He, X.K. Spray performance and control efficacy against pests in paddy rice by UAV-based pesticide application: Effects of atomization, UAV configuration and flight velocity. Pest Manag. Sci. 2024, 80, 2072–2084. [Google Scholar] [CrossRef]
  34. Kharim, M.N.A.; Wayayok, A.; Shariff, A.R.M.; Abdullah, A.F.; Husin, E.M. Droplet deposition density of organic liquid fertilizer at low altitude UAV aerial spraying in rice cultivation. Comput. Electron. Agric. 2019, 167, 105045. [Google Scholar] [CrossRef]
  35. Tang, Y.; Hou, C.J.; Luo, S.M.; Lin, J.T.; Yang, Z.; Huang, W.F. Effects of operation height and tree shape on droplet deposition in citrus trees using an unmanned aerial vehicle. Comput. Electron. Agric. 2018, 148, 1–7. [Google Scholar] [CrossRef]
  36. Zhang, X.Q.; Song, X.P.; Liang, Y.J.; Qin, Z.Q.; Zhang, B.Q.; Wei, J.J.; Li, Y.R.; Wu, J.M. Effects of spray parameters of drone on the droplet deposition in sugarcane canopy. Sugar Tech. 2020, 22, 583–588. [Google Scholar] [CrossRef]
  37. Lou, Z.X.; Xin, F.; Han, X.Q.; Lan, Y.B.; Duan, T.Z.; Fu, W. Effect of unmanned aerial vehicle flight height on droplet distribution, drift and control of cotton aphids and spider mites. Agronomy 2018, 8, 187. [Google Scholar] [CrossRef]
  38. Miranda, M.P.; Eduardo, W.I.; Scapin, M.D.S.; Volpe, H.X.L.; Rodriguez, G.M.; Vizoni, M.C.; Hakvoort, R.B.J. Insecticide application using an unmanned aerial vehicle for Diaphorina citri control in citrus orchards. J. Appl. Entomol. 2023, 147, 716–727. [Google Scholar] [CrossRef]
  39. Ochieng’, V.; Rwomushana, I.; Ongamo, G.; Ndegwa, P.; Kamau, S.; Makale, F.; Chacha, D.; Gadhia, K.; Akiri, M. Optimum flight height for the control of desert locusts using unmanned aerial vehicles (UAV). Drones 2023, 7, 233. [Google Scholar] [CrossRef]
  40. Arakawa, T.; Kamio, S. Control efficacy of UAV-based ultra-low-volume application of pesticide in chestnut orchards. Plants 2023, 12, 2597. [Google Scholar] [CrossRef] [PubMed]
  41. Zhang, X.Q.; Liang, Y.J.; Qin, Z.Q.; Li, D.W.; Wei, C.Y.; Wei, J.J.; Li, Y.R.; Song, X.P. Application of multi-rotor unmanned aerial vehicle application in management of stem borer (Lepidoptera) in Sugarcane. Sugar Technol. 2019, 21, 847–852. [Google Scholar] [CrossRef]
  42. Xiao, Q.G.; Du, R.; Yang, L.; Han, X.Q.; Zhao, S.F.; Zhang, G.Q.; Fu, W.; Wang, G.B.; Lan, Y.B. Comparison of droplet deposition control efficacy on Phytophthora capsica and aphids in the processing pepper field of the unmanned aerial vehicle and knapsack sprayer. Agronomy 2020, 10, 215. [Google Scholar] [CrossRef]
  43. Munthali, D.C.; Wyatt, I.J. Factors affecting the biological efficiency of small pesticide droplets against Tetranychus urticae eggs. Pest Manag. Sci. 1986, 17, 155–164. [Google Scholar] [CrossRef]
  44. Bryant, J.E.; Yendol, W.G. Evaluation of the influence of droplet size and density of Bacillus thuringiensis against gypsy moth larvae (Lepidoptera: Lymantriidae). J. Econ. Entomol. 1988, 81, 130–134. [Google Scholar] [CrossRef]
  45. Yuan, H.Z.; Wang, G.B. Effects of droplet size and deposition density on field efficacy of pesticides. Plant Prot. 2015, 41, 9–16. [Google Scholar]
Figure 1. Deposition characteristics of T30 in different operational parameters. (A) Droplet coverage and its CV at the tea canopy surface; (B) droplet size (Dv50) and its CV at the tea canopy surface. The operational parameters of T30 in different treatments are shown in Table 2. Data are presented as mean + standard error for droplet coverage and droplet size, and as mean for CV. Different letters above each column represent significant differences between treatments (Tukey’s test, p < 0.05).
Agronomy 15 00431 g001
Figure 2. Deposition characteristics of T40 in different operational parameters. (A) Droplet coverage and its CV at the tea canopy surface; (B) droplet coverage at 15 cm below the tea canopy surface; (C) droplet size (Dv50) and its CV at the tea canopy surface. The operational parameters of T40 in different treatments are shown in Table 2. Data are presented as mean + standard error for droplet coverage and droplet size, and as mean for CV. Different letters above each column represent significant differences between treatments (Tukey’s test, p < 0.05).
Agronomy 15 00431 g002
Figure 3. Comparison of Allura Red deposition and its CV between T30 and T40 under the same spray volume (75 L·ha−1), driving speed (3 m·s−1) and working height (2.5 m). (A) At the tea canopy surface; (B) at 15 cm below the tea canopy surface. Data are presented as mean + or ± standard error. Different letters above each column represent significant differences between treatments (t-tests, p < 0.05).
Agronomy 15 00431 g003
Figure 4. Spraying quality comparison of T40 under the optimal and conventional application parameters in control effect experiment. (A,C) Droplet coverage at the tea canopy surface and its CV for tolfenpyrad and afidopyropen, respectively; (B,D) droplet coverage at 15 cm below the tea canopy surface for tolfenpyrad and afidopyropen, respectively. OP-75%, under the optimal application parameters and at 75% of the pesticide minimum dose; CP-75%, under the conventional application parameters and at 75% of the pesticide minimum dose. Data are presented as mean + standard error for droplet coverage, and as mean for CV. Different letters above each column represent significant differences between treatments (t-tests, p < 0.05).
Agronomy 15 00431 g004
Figure 5. Spraying quality comparison of T40 at two pesticide doses in control effect experiment. (A,C) Droplet coverage at the tea canopy surface and its CV for tolfenpyrad and afidopyropen, respectively; (B,D) droplet coverage at 15 cm below the tea canopy surface for tolfenpyrad and afidopyropen, respectively. OP-75%, under the optimal application parameters and at 75% of the pesticide minimum dose; OP-50%, under the optimal application parameters and at 50% of the pesticide minimum dose. Data are presented as mean + standard error for droplet coverage, and as mean for CV.
Agronomy 15 00431 g005
Figure 6. Control effect comparison of T40 under the optimal and conventional application parameters. (A) Tolfenpyrad; (B) afidopyropen. OP-75%, under the optimal application parameters and at 75% of the pesticide minimum dose; CP-75%, under the conventional application parameters and at 75% of the pesticide minimum dose. Data are presented as mean + standard error. Different letters above each column represent significant differences between treatments (t-tests, p < 0.05).
Agronomy 15 00431 g006
Figure 7. Control effect comparison between the knapsack sprayer and T40. (A) Tolfenpyrad; (B) afidopyropen. OP-75%, T40 under the optimal application parameters and at 75% of the pesticide minimum dose; OP-50%, T40 under the optimal application parameters and at 50% of the pesticide minimum dose; KS-100%, the knapsack sprayer at the pesticide minimum dose; KS-75%, the knapsack sprayer at 75% of the pesticide minimum dose. Data are presented as mean + standard error. Different letters above each column represent significant differences between treatments (Tukey’s test, p < 0.05).
Agronomy 15 00431 g007
Figure 8. Pesticide residue level comparison between the knapsack sprayer and T40. (A) Tolfenpyrad; (B) afidopyropen. OP-75%, T40 under the optimal application parameters and at 75% of the pesticide minimum dose; KS-100%, the knapsack sprayer at the pesticide minimum dose. Data are presented as mean + standard error.
Agronomy 15 00431 g008
Table 1. The main parameters of T30 and T40 unmanned aerial vehicles.
ParametersT30T40
Total weight (kg)36.550
Dimensions (arms and propellers unfolded, m)2.9 × 2.7 × 0.82.8 × 3.2 × 0.8
Tank volume (L)3040
Maximum power (W)3600 W/rotor3600 W/rotor
Number of rotors68
Type of nozzlesSX11001VSLX8060SZ
Number of nozzles162
Particle diameter (μm)130–25050–300
Maximum effective swath width (m)4–911
Type of water pumpplunger pumpmagnetic drive impeller pump
Max flow rate of water pump (L·min−1)46
Number of water pump12
Table 2. Treatments for the effect of operational parameters of T30 and T40 on the spraying performance.
T30WH
(m)
DS
(m·s−1)
SV
(L·ha−1)
T40WH
(m)
DS
(m·s−1)
SV
(L·ha−1)
AD
H1-S2-V12730H1-S1-V1-D22360medium
H1-S1-V12330H2-S1-V1-D23.5360medium
H2-S1-V13.5330H3-S1-V1-D25360medium
H3-S1-V15330H1-S1-V2-D223105medium
H1-S1-V22360H2-S1-V2-D23.53105medium
H2-S1-V23.5360H3-S1-V2-D253105medium
H3-S1-V25360H1-S1-V3-D223150medium
H1-S1-V32390H2-S1-V3-D23.53150medium
H2-S1-V33.5390H3-S1-V3-D253150medium
H3-S1-V35390H1-S2-V2-D225105medium
H2-S2-V2-D23.55105medium
H3-S2-V2-D255105medium
H2-S1-V2-D33.53105coarse
H2-S1-V2-D13.53105fine
WH, working height; DS, driving speed; SV, spray volume; AD, atomization diameter.
Table 3. ANOVA results (p-value) for the variables and interactions evaluated in the effects of operational parameters on the spraying performance of T30 and T40.
Operational ParametersT30T40
dfDC-SDZ-SdfDC-SDC-IDZ-S
WH20.57300.423520.88310.00170.1035
DS10.52870.073110.05940.0023<0.0001
SV2<0.00010.00352<0.0001<0.0001<0.0001
AD///20.39010.0190<0.0001
WH × SV40.95180.988740.94390.15330.1605
WH × DS///20.88000.14770.2464
WH, working height; DS, driving speed; SV, spray volume; AD, atomization diameter. DC-S, droplet coverage at the tea canopy surface; DC-I, droplet coverage at 15 cm below the tea canopy surface; DZ-S, droplet size (Dv50) at the tea canopy surface. Statistical significance level: p < 0.05.
Disclaimer/Publisher’s Note: The statements, opinions and data contained in all publications are solely those of the individual author(s) and contributor(s) and not of MDPI and/or the editor(s). MDPI and/or the editor(s) disclaim responsibility for any injury to people or property resulting from any ideas, methods, instructions or products referred to in the content.

