Abstract
The flatness of the cut surface in enoki mushrooms (Flammulina filiformis Z.W. Ge, X.B. Liu & Zhu L. Yang) is a key factor in quality classification. However, conventional automatic cutting equipment struggles with deformation issues due to its inability to adjust the grasping force based on individual mushroom sizes. To address this, we propose an improved method that integrates visual feedback to dynamically adjust the execution end, enhancing cut precision. Our approach enhances YOLOv8n-seg with Star Net, SPPECAN (a reconstructed SPPF with efficient channel attention), and C2fDStar (C2f with Star Net and deformable convolution) to improve feature extraction while reducing computational complexity and feature loss. Additionally, we introduce a mask ownership judgment and merging optimization algorithm to correct positional offsets, internal disconnections, and boundary instabilities in grasping area predictions. Based on this, we optimize grasping parameters using an improved centroid-based region width measurement and establish a region width-to-PWM mapping model for the precise conversion from visual data to gripper control. Experiments in real-situation settings demonstrate the effectiveness of our method, achieving a mean average precision (mAP50:95) of 0.743 for grasping area segmentation, a 4.5% improvement over YOLOv8, with an average detection speed of 10.3 ms and a target width measurement error of only 0.14%. The proposed mapping relationship enables adaptive end-effector control, resulting in a 96% grasping success rate and a 98% qualified cutting surface rate. These results confirm the feasibility of our approach and provide a strong technical foundation for the intelligent automation of enoki mushroom cutting systems.
1. Introduction
Enoki mushrooms (Flammulina filiformis Z.W. Ge, X.B. Liu & Zhu L. Yang) are a significant strain of edible fungi in China, ranking as the fifth most consumed mushroom species. In 2023, their production exceeded 2.1 million tons, with an export value surpassing 250 million RMB [1]. Unlike overseas markets such as Japan, the Chinese market has stricter requirements for the appearance and quality of enoki mushrooms [2]. After root cutting, these mushrooms are packaged in large quantities and must have small caps, smooth stems, and neatly cut white roots [3]. These high standards have driven Chinese breeding experts and enterprises to focus on improving root-cutting technology.
Despite the root-cutting equipment’s higher efficiency, the resulting products usually have “wavy” cut surfaces; this is a significant challenge in the Chinese market, which strongly emphasizes product appearance. Consequently, the root-cutting process for enoki mushrooms is predominantly manual. Analyzing and mitigating the factors causing “wavy” cuts in factory-produced enoki mushrooms is crucial.
Field research shows that the gripping mechanism’s “hardening” action primarily contributes to uneven cut surfaces. The design parameters of this mechanism are based on the smallest size of enoki mushrooms in their normal growth state. However, at the back end of the production process, multiple bottles within the frame are sequentially fed into the root-cutting station, with each bottle containing mushrooms of varying sizes, causing “wavy” cut surfaces when mismatched gripped.
Considering the significant amount of mucus and debris generated during the cutting process, this study opted for a non-contact vision sensor. This approach aims to effectively enhance the precision of the grasping operation by employing image recognition technology to identify various sizes of enoki mushrooms and adjust the clamping mechanism’s actions in real time. Due to the current lack of direct research on the identification and localization of enoki mushrooms, this paper reviews and investigates the research conducted on other agricultural crops.
The recognition of various crops currently relies primarily on image-based target detection methods [4,5]. For instance, Genno [6] developed an automated apple growth assessment system using high-resolution images. They identified the cumulative maximum GBVI leaf area as the most accurate metric for evaluating apple growth. Li [7] created the Cotton-You Only Look Once (YOLO) algorithm, achieving a 99.12% detection accuracy and 132.2 FPS (frames per second) for foreign fibers in seed cotton, significantly improving detection speed and accuracy. Dang [8] established a dataset with 5648 images of weeds in cotton fields. They evaluated 25 YOLO object detectors, finding YOLOv4 to have the best performance, with a mean average precision (mAP50) score of 95.22%. Kim [9] developed a machine-vision-based system for measuring crop heights in field conditions, demonstrating strong agreement with manual measurements (coefficient of determination (R2) values ranging from 0.78 to 0.84) and effective performance even with overlapping objects. Shen [10] proposed AAFormer for the semantic segmentation of agricultural aerial images, achieving a mIoU (mean intersection over union) of 45.44% on the Agriculture Vision validation set. Kim [11] presented an image-based field monitoring system for automatic onion crop disease detection, achieving a mAP of 74.1–87.2% at an intersection over union (IoU) of 0.5, demonstrating effective real-time disease symptom detection. Thai [12] introduced FormerLeaf, which was used to reduce the model size by 28%, accelerate the evaluation by 15%, and shorten the training time by 10% while enhancing the accuracy by 3%. These studies have addressed various agricultural production challenges, such as bumpy surfaces, crop growth assessment, and pest and disease detection.
However, the research subjects in these studies above have a dense texture and regular shapes, allowing anchor boxes to encompass the target objects, thereby facilitating further tasks such as measurement and grasping point acquisition. Under their own weight, bottled enoki mushrooms deform and exhibit irregular appearances, rendering anchor boxes ineffective for precise identification and localization tasks.
As the edible mushroom industry advances, studies have increasingly focused on mainstream mushroom species such as shiitake [5]. For example, Tongcham [13] developed a machine learning algorithm to classify oyster mushroom spawns, achieving a 98.8% accuracy using a deep neural network with optimized parameters despite limited and unbalanced sample data. Li [14] introduced an online measurement method for surface wrinkles during the hot air drying of shiitake mushrooms based on image segmentation, optimizing the relative humidity control and reducing the drying time by approximately 12%. Wang [15] developed D-VGG, achieving a 96.21% accuracy and a recognition time of 46.77 ms per image, enhancing the efficiency and precision of automatic grade recognition. Lu [16] created a new algorithm combining a convolutional neural network with a score-punishment method to measure mushroom cap diameters, outperforming the circle Hough Transform in robustness and practicality without requiring parameter adjustments. Sutayco [17] developed a device using deep learning models and a Raspberry Pi to classify six medicinal mushrooms, achieving a 92.7% accuracy on 600 images. Tao [18] introduced ReYOLO-MSM for the selective harvesting of shiitake mushrooms, achieving a 99.3% detection accuracy and 98.9% mAP with a detection speed of 7.1 ms. Charisis [19] developed a method for detecting and segmenting oyster mushrooms in clusters, achieving instance detection with a mAP of 0.71, a recall of 0.75, and an F1-score of 0.73, respectively, and successfully producing well-defined mushroom masks.
The aforementioned studies indicate that there are relevant measurement and identification techniques for edible fungi, which can be effectively applied to the localization and measurement of enoki mushroom grasping positions. However, due to the highly similar color and texture of bottled enoki mushrooms, as well as their fragility, the accuracy of the grasping position and action directly affects the quality of subsequent root cutting. The unique characteristic of bottle-cultivated golden needle mushrooms lies in the fact that it simultaneously considers multiple factors for identification while also addressing control requirements, distinguishing it from other mushroom species.
In summary, this study addresses the issue of poor cut surface quality in enoki mushrooms, which arises from improper pre-cutting grasping behavior, taking into account the mushrooms’ texture, shape, and tenderness. Building on existing research methods, the main objective of this study is to propose a visual detection model, MPG-YOLO v8, specifically designed for enoki mushrooms, to use its output data to control the clamp’s actions. Specifically, the approach integrates techniques such as Star Net, SPPECAN, and C2fDStar, which improve both detection speed and accuracy. The model employs masking techniques to address distortion in the grasping region localization caused by anchor boxes. Additionally, through optimizing mask details with mask affiliation judgment, fusion optimization, and target point refinement, the model enhances measurement precision and reduces the likelihood of grasp position prediction errors. Furthermore, by incorporating mapping with PWM control, the model overcomes the limitation of current grasping systems, enabling differentiated grasping actions on enoki mushrooms, and ultimately improving the quality of root cutting.
2. Materials and Methods
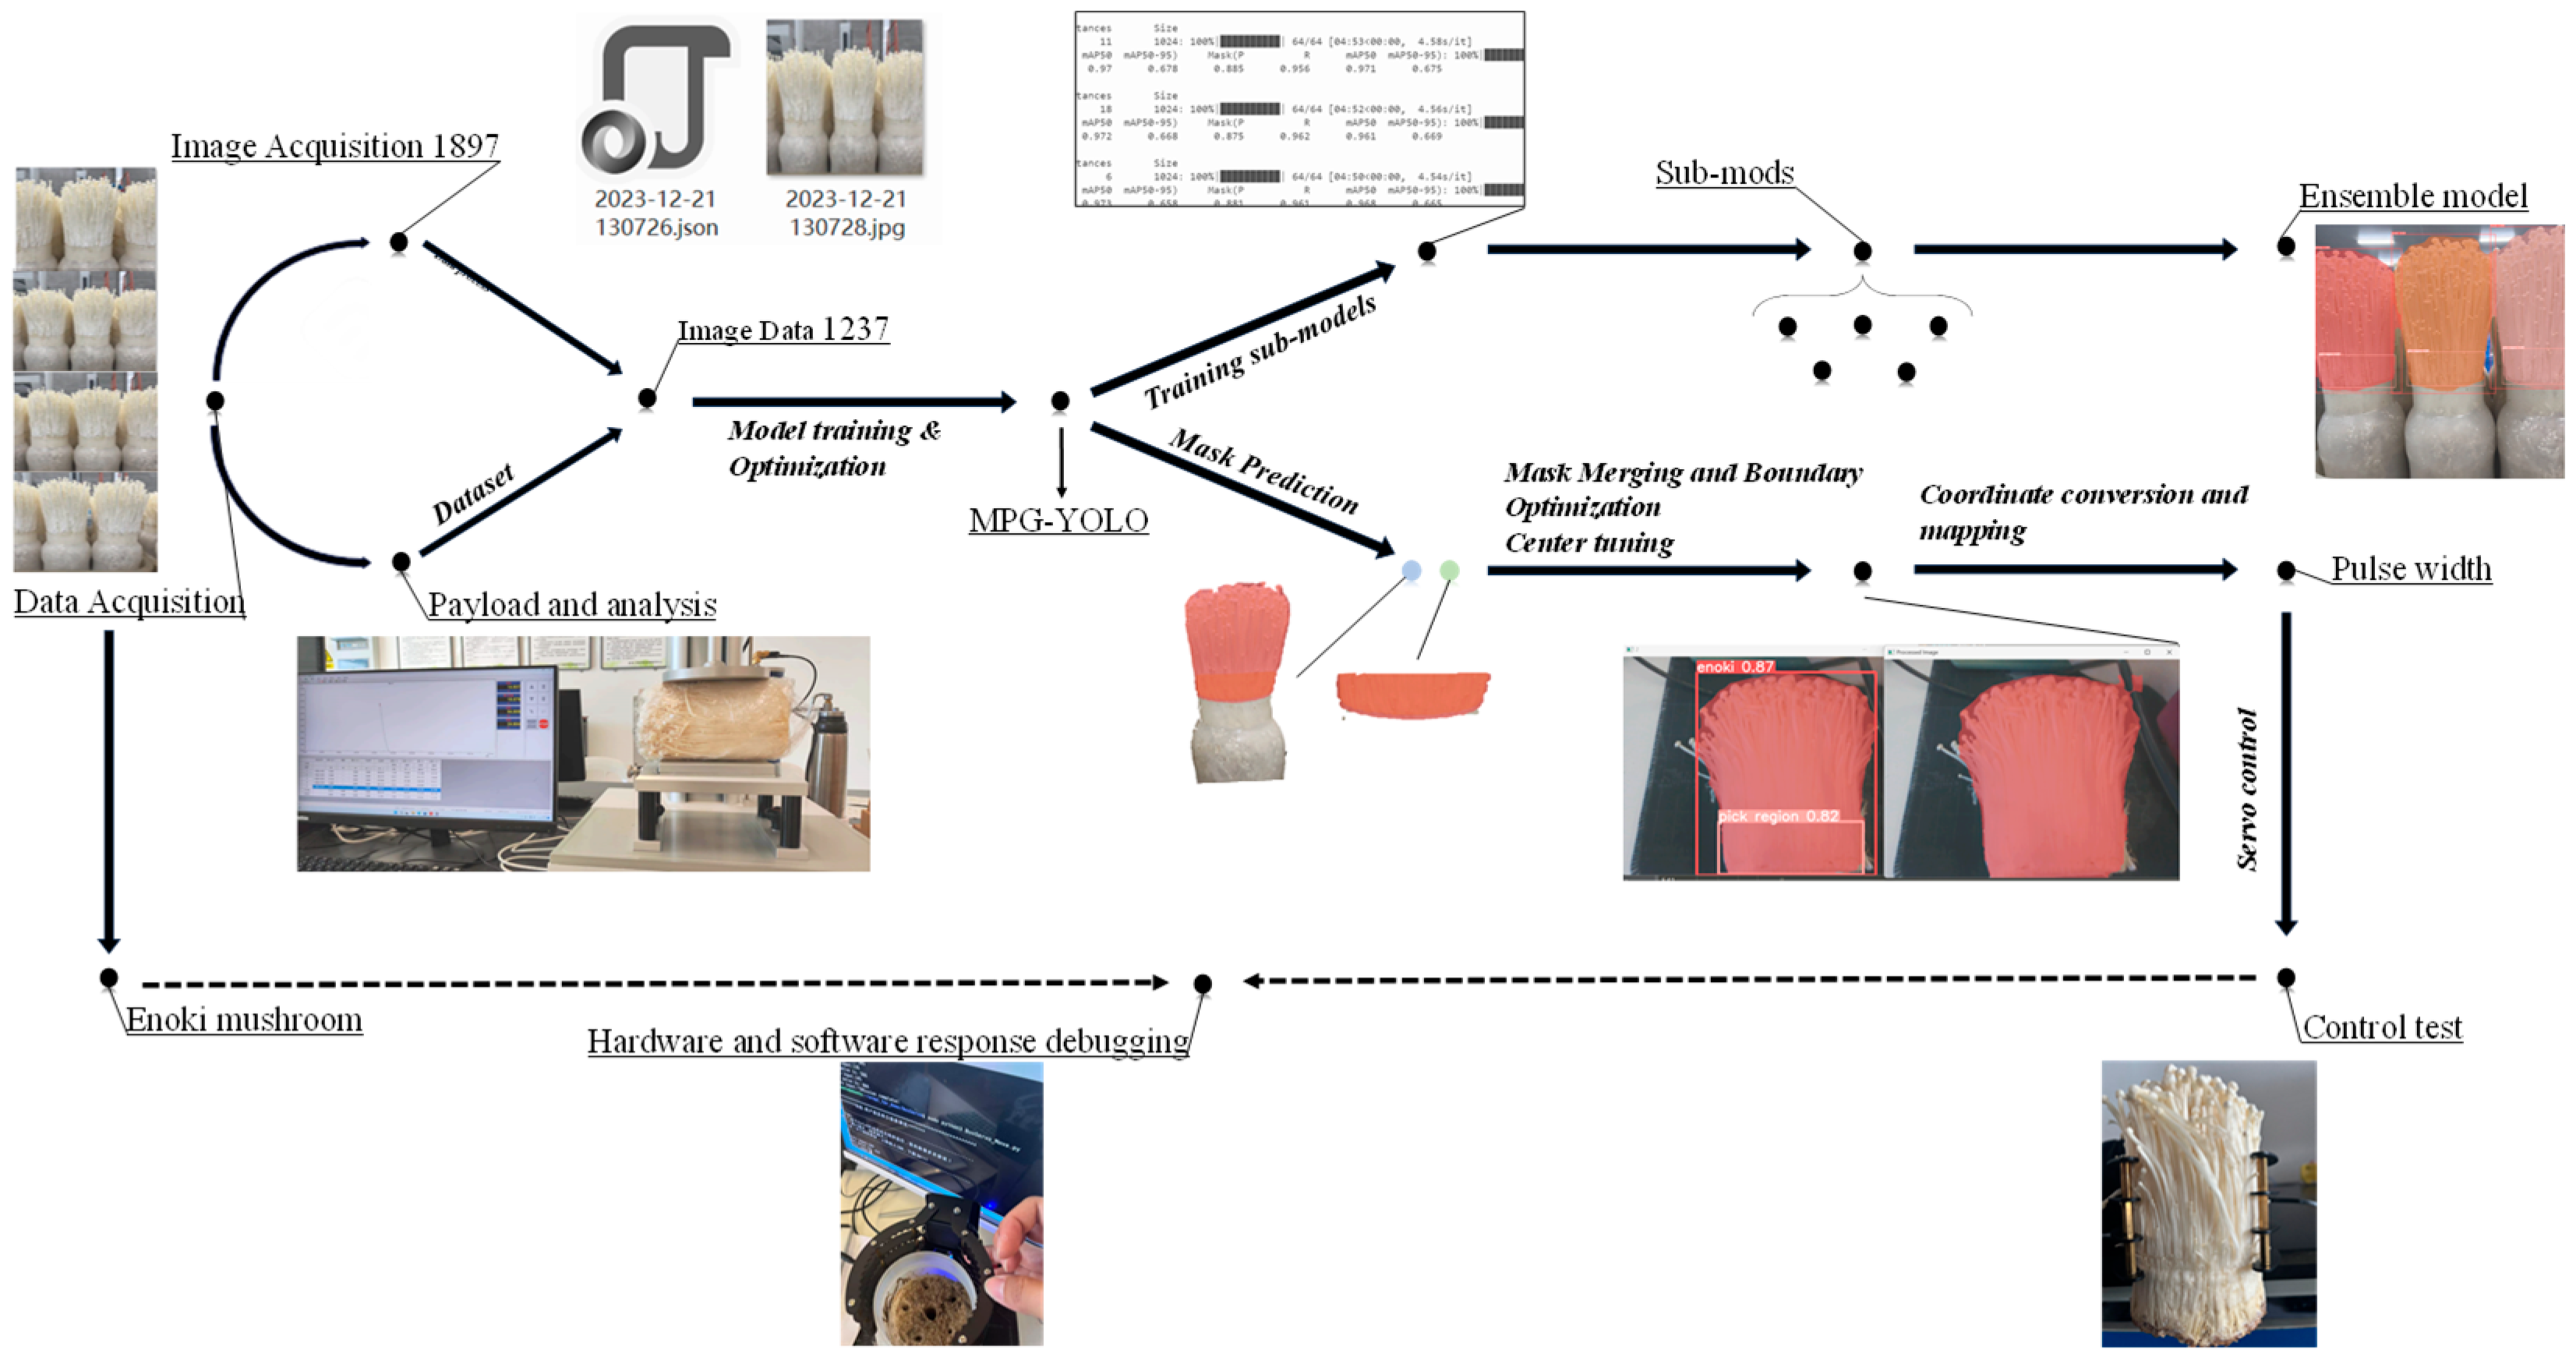
In summary, the research process carried out in this paper is shown in Figure 1 and is described in detail next.
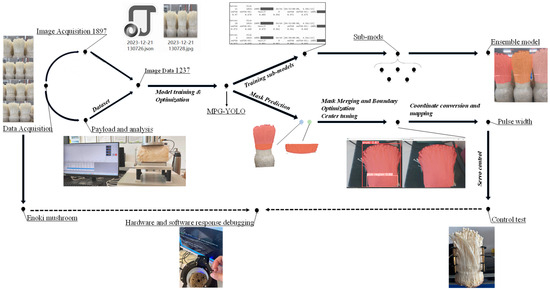
Figure 1.
Study flow of intelligent gripping method for bottle-planted enoki mushrooms.
2.1. Plant Material
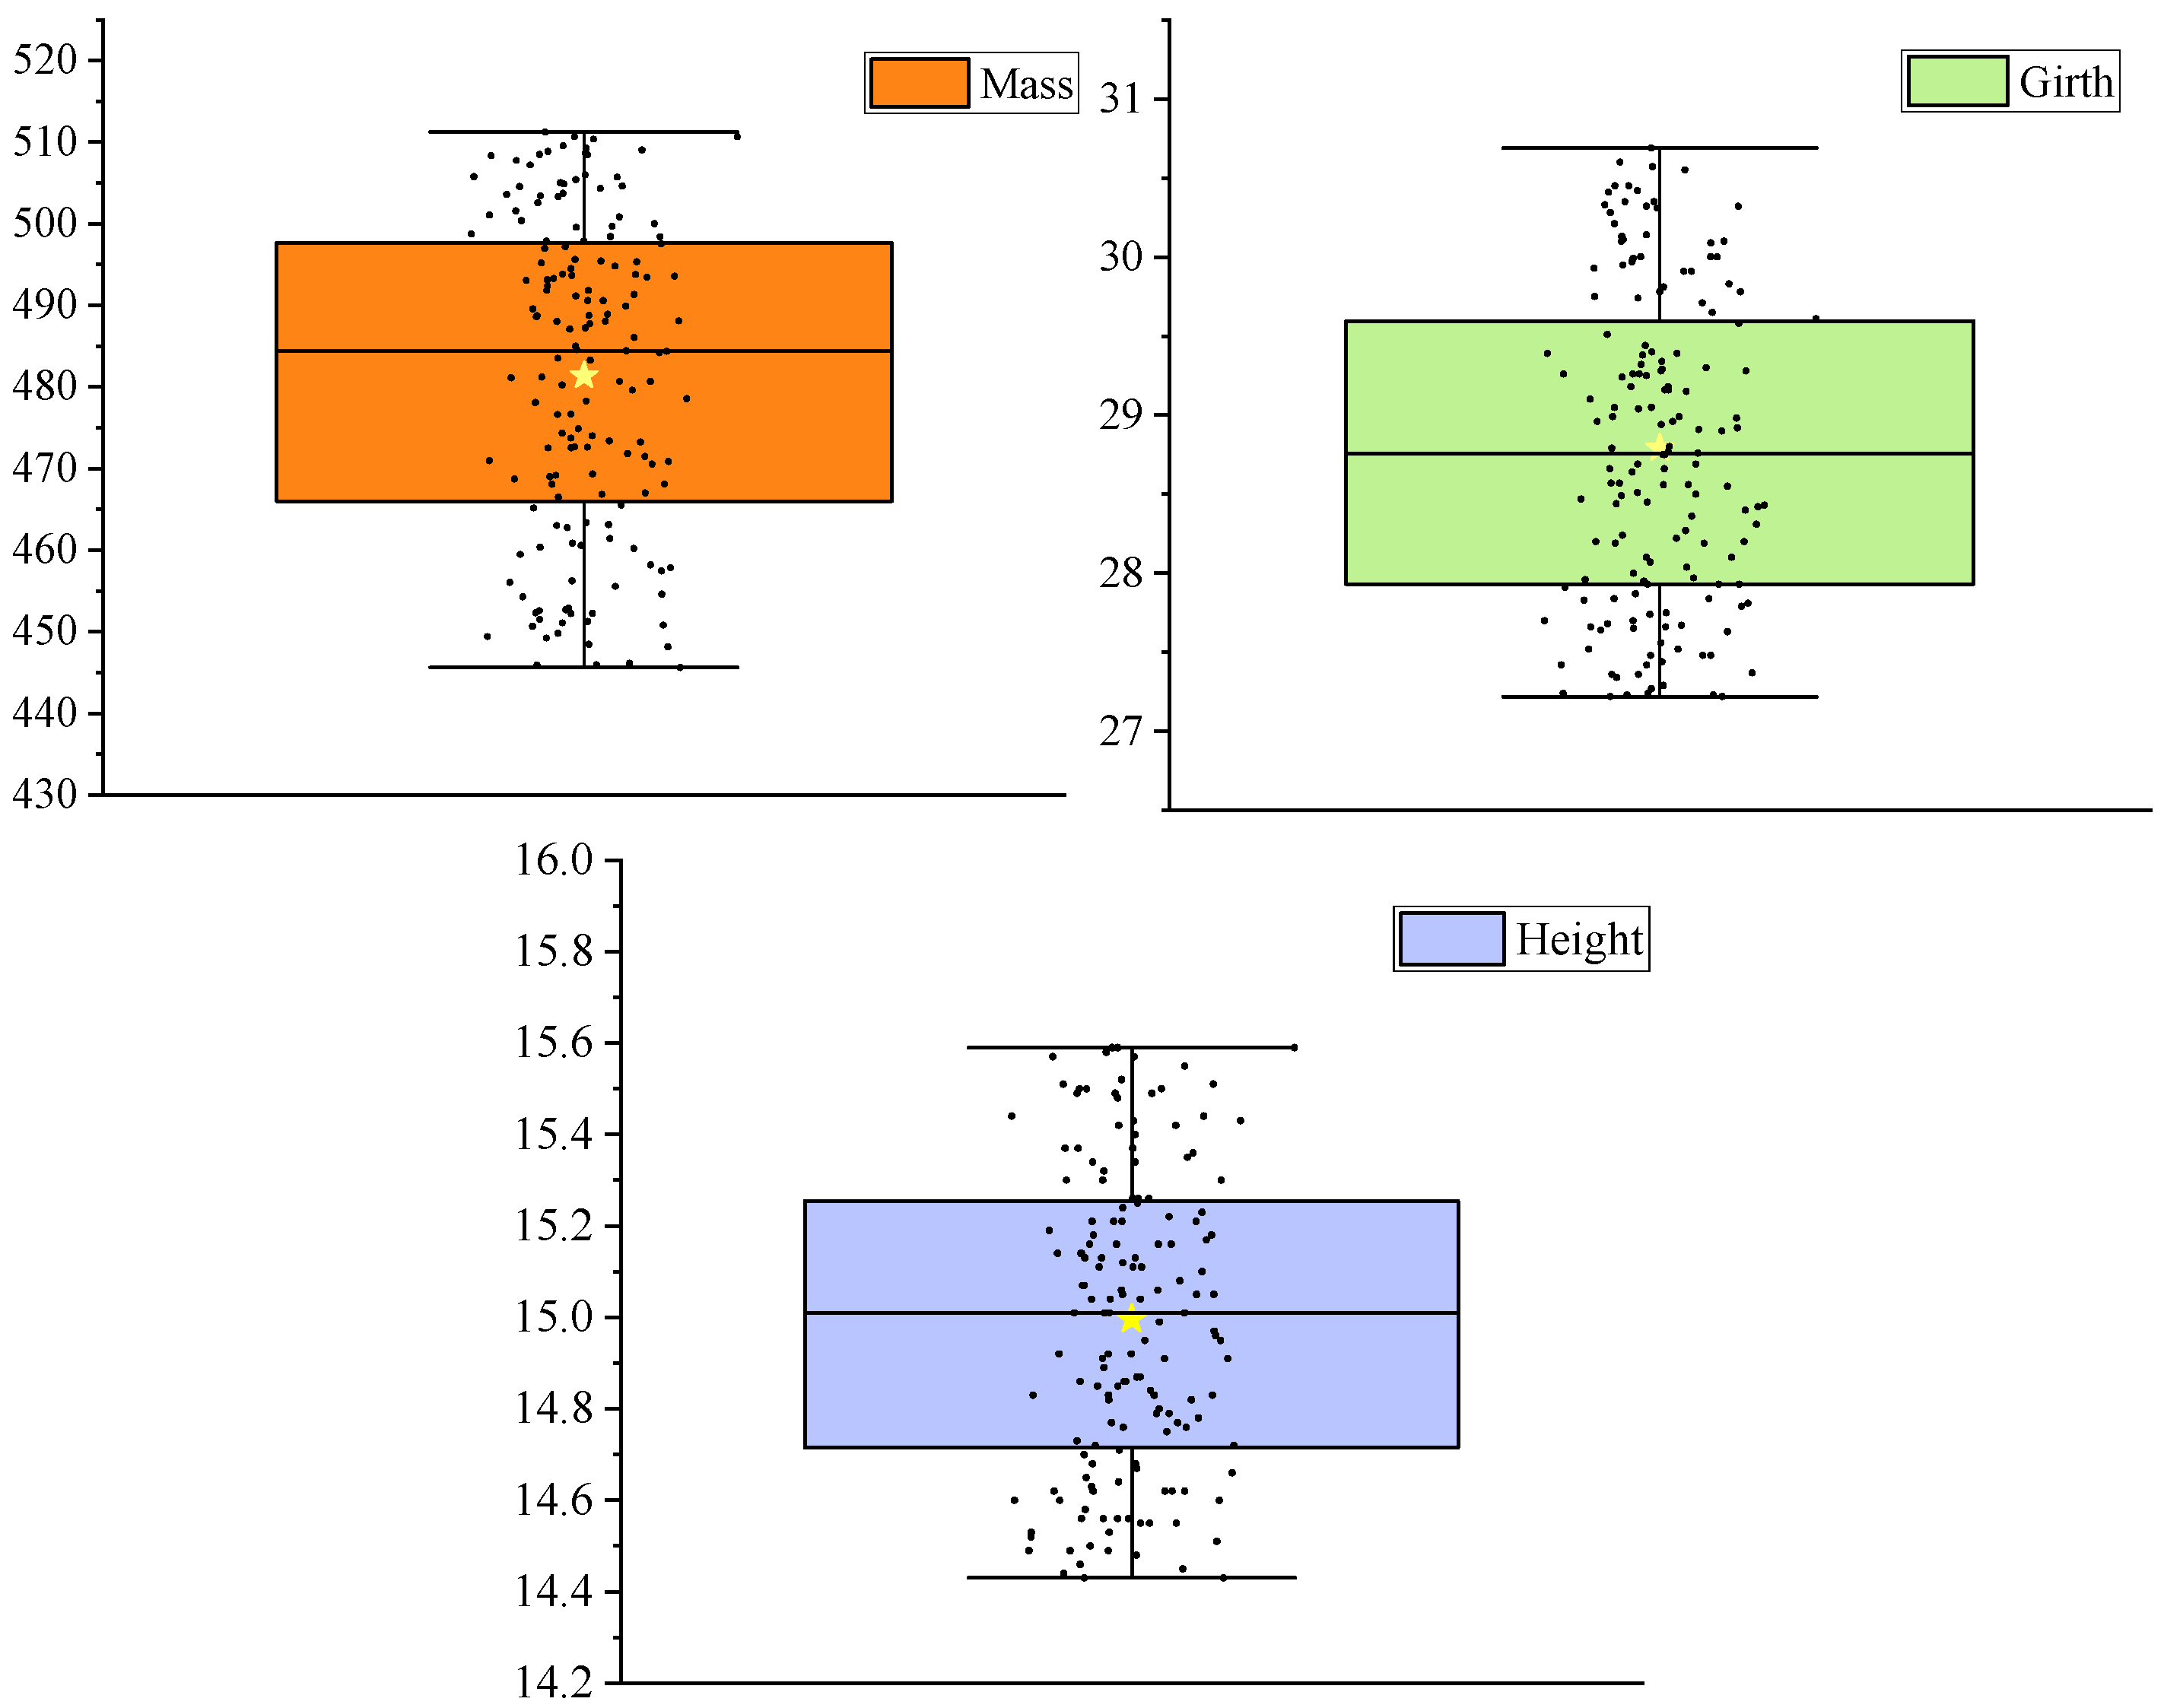
As shown in Figure 2, the enoki mushrooms used in this study have circumferences ranging from 27.22 cm to 30.69 cm, with a difference of 3.47 cm between the maximum and minimum values. The average circumference is 28.79 cm, the average mass is 481.36 g, and the average height is 14.99 cm. The external shape of the bottle-cultivated enoki mushrooms typically exhibits a “wider top and narrower base” profile: The circumference increases as the mushroom moves farther from the bottle opening, and decreases as it approaches the opening.

Figure 2.
Introduction to enoki mushroom samples. The star represents the center point of the data.
To assess the reliability of the measurement results more intuitively, the coefficient of variation (CV) is introduced. This statistical measure indicates the degree of data dispersion, with a higher value signifying greater variability and less consistency in the data. The formula for calculating the CV is as follows:
where σ is the standard deviation and μ is the mean value. The CV values for height, circumference, and mass were calculated as 0.02221, 0.03419, and 0.040017, respectively. These results indicate that the quality of the enoki mushroom samples used in this study is stable, providing a solid data foundation for subsequent work.
2.2. Image Data Acquisition
Field collection at the enoki mushroom harvesting production workshop of Wanchen Biotechnology Co., Ltd. in Zhangpu County, Zhangzhou City, Fujian Province, yielded 1897 RGB (red, green, and blue) images of bottle-planted enoki mushrooms. The exact time of the experiment was May 2024–December 2024. The images were captured using an iPhone (version 13, made in China) in square shooting mode with a sampling distance of 225 mm and an image resolution of 3024 × 3024 pixels. Due to the use of a mobile phone and that the bottle-planted mushrooms were in motion, some blurred images were captured. After manually eliminating low-quality images, 1237 images remained.
2.3. Production of Dataset
2.3.1. Analysis of the Optimal Stress Position of the Enoki Mushrooms
During image acquisition, the optimal loading area for gripping the bottle-planted enoki mushrooms was located at the root position, just above the bottle opening. Given the focus of this study on vision technology, efficiently identifying and localizing this area was crucial. Using vernier calipers, we measured the average root height of the enoki mushrooms to be 29.81 mm and the average height of the entire plant to be 175.77 mm. The roots below the bottle mouth were unsuitable for gripping, and the upper and middle parts of the substrate were unsuitable because of the large gap.
These observations selected an area 60 mm above the bottle opening as the experimental loading area. Three trial gripping positions were marked at 20 mm intervals. A compression test was conducted using a Universal TA (Shanghai Tengba Instrument Technology Co., Ltd., Shanghai, China) mass tester to determine the optimal stress area, which was used as the gripping location.
2.3.2. Labeled Segmentation and Analysis of Datasets
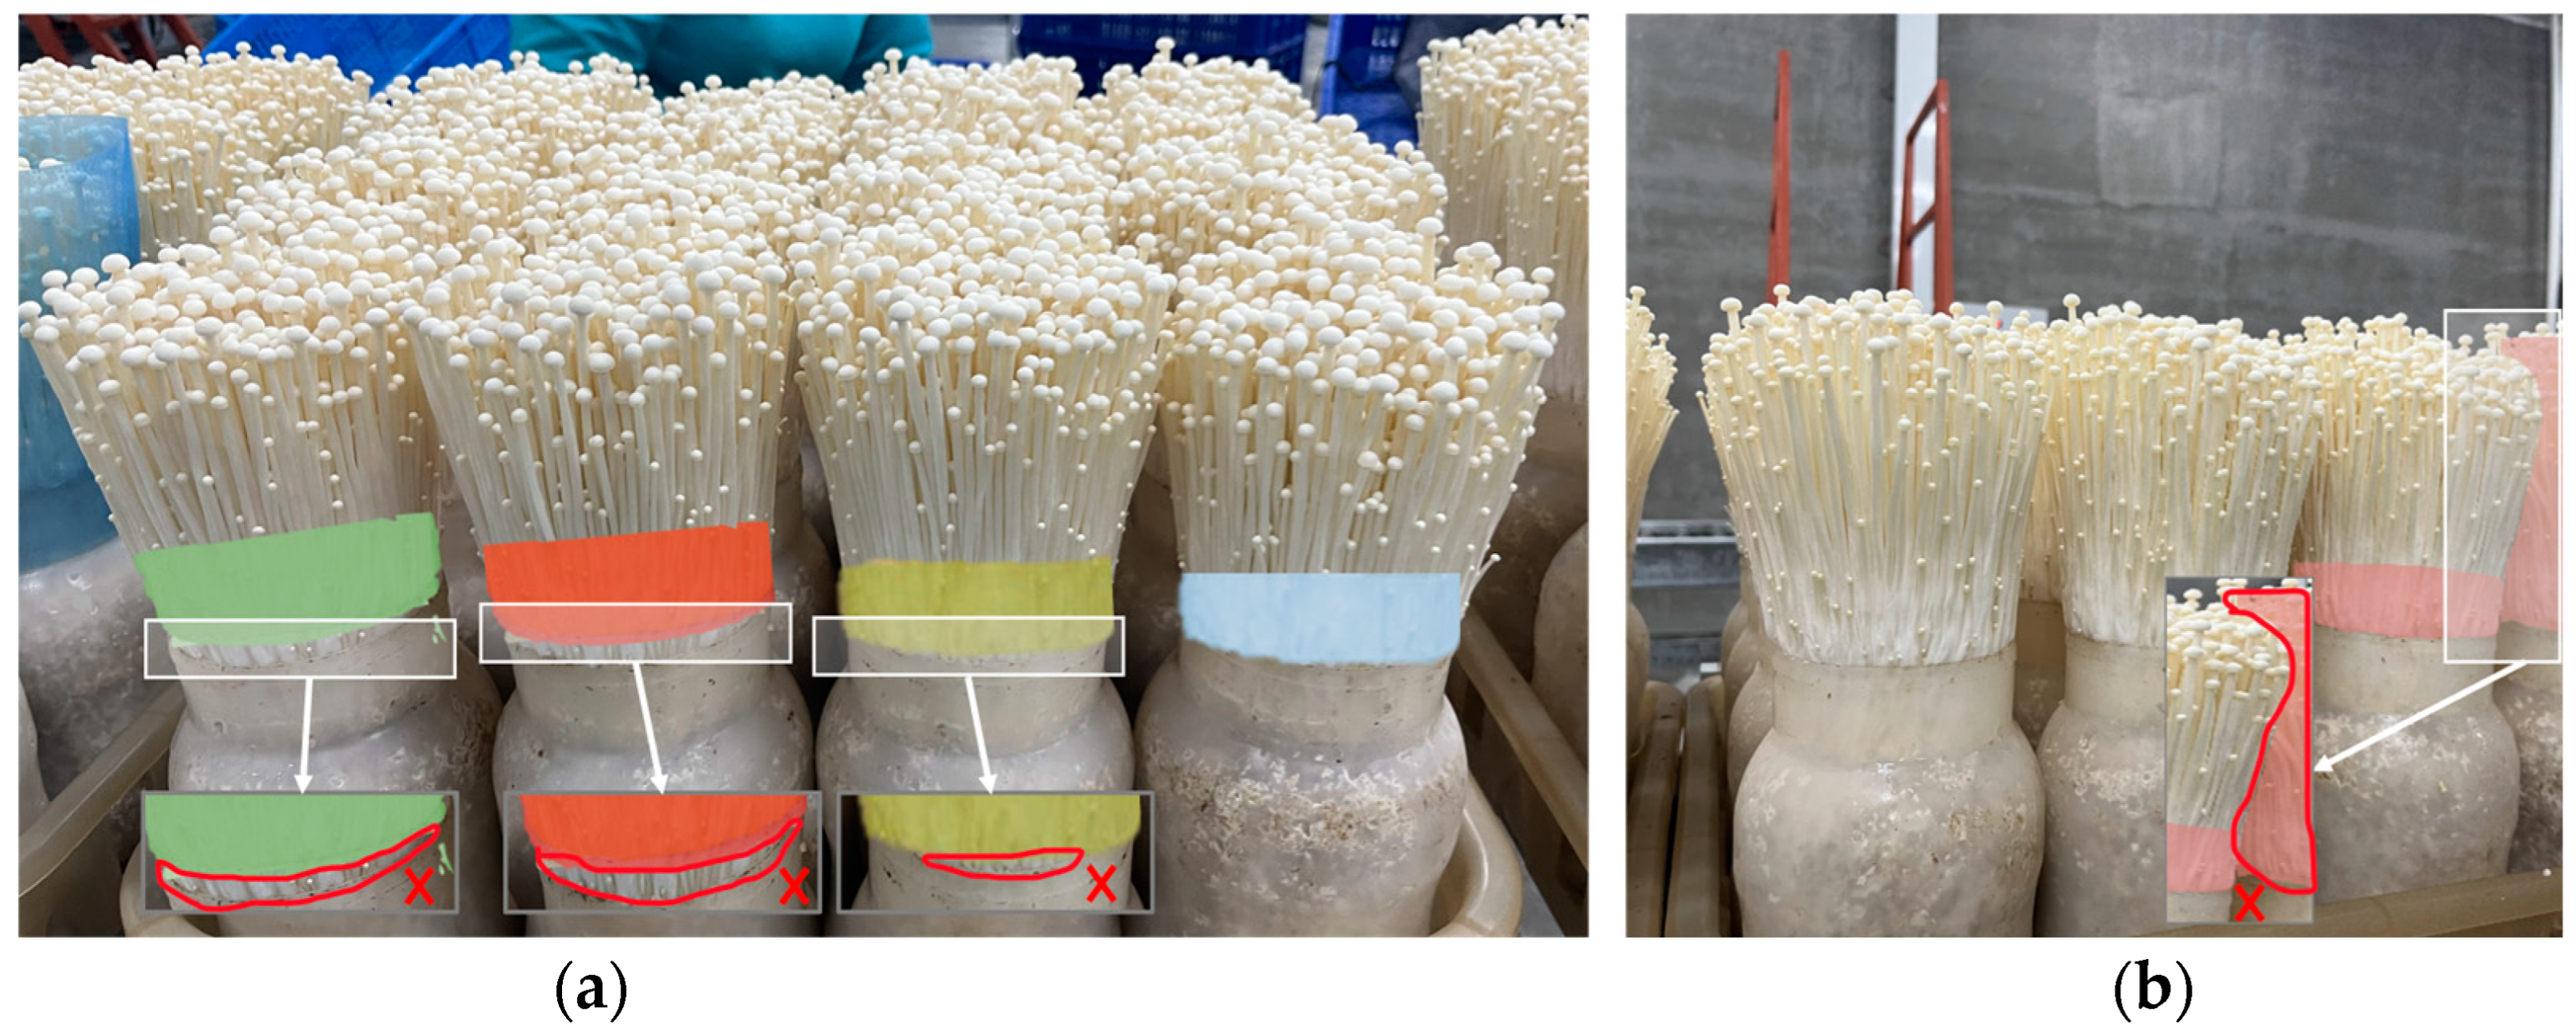
A reference for manual labeling was built. However, the pick region was similar to other parts of the enoki mushrooms in terms of color and morphological features, making position prediction challenging. In the pre-experiment, only the pick region was labeled; however, the prediction results were unstable, as shown in Figure 3. Some mask positions have shifted, resulting in inaccurate coverage, while some masks have incorrectly covered areas that should not have been covered. To constrain the relative position of ROIs and avoid large shifts, we used a constrained labeling method that involved labeling the ROI (“pick region”) and the overall “enoki” to strengthen boundary conditions and improve the convergence of the function.
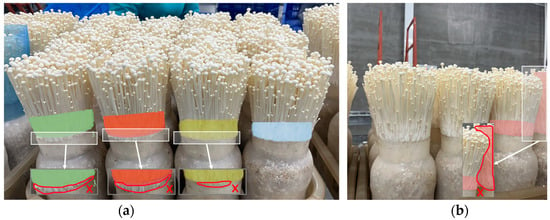
Figure 3.
Region of interest (ROI) error prediction graph result. (a) mask positions were shifted; (b) masks incorrectly covered.
The image content was labeled using Labelme’s polygonal pattern: The enoki mush-room was labeled “enoki”, and the grabbing region was labeled “pick region”. We augmented the data using Gaussian blurring, mirror flipping, and brightness adjustments to simulate poor vision.
After data augmentation, randomly dividing the data may lead to high similarity be-tween different partition sets, which could affect the accuracy of the model’s performance. To mitigate this issue and ensure the reliability of the results, we chose to use stratified sampling. Specifically, we first organized the augmented data into separate folders, each labeled according to the corresponding augmentation method. Then, we extracted samples from each folder and partitioned them into the training, validation, and test sets in an 8:1:1 ratio. This approach effectively ensures a balanced distribution of augmented samples across the partition sets, minimizes similarity, and maintains the intended diversity introduced by the data augmentation.
The above method was used to construct a relative positional association between the crawl position and the overall enoki mushroom to avoid excessive fluctuations in the predicted position of the ROI. To explain the location association better, the label distribution of the ‘.json’ file was counted, and the results are shown in Figure 4.

Figure 4.
Label information analysis and statistics.
As shown in Figure 3, the center of mass of the “pick region” in pixel space was below the center of mass of the “enoki”. The pixel distances between the substrate under the bottle and the center of mass of the grasping region ranged from [−350, 250] in the x-direction to [0, 300] in the y-direction. Given the consistent labeling scheme, the center of mass and boundary maintained a relative positional relationship.
To analyze the space of vectors, the plane where the mouth of the bottle was located was made , and the centers of mass of “enoki” and “pick region” were and , respectively. denotes the absolute position vector of , denotes the absolute position vector of , denotes the relative position vector of , denotes the relative position vector from O2 to P, and denotes the relative position vector of O1 and P. The following relationships hold: and . The distance between and was computed using , the boundary conditions of the problem were equal to the number of unknown variables, and had a definite solution. The results confirmed a relative position relationship in the pixel space between the labeled centers of mass and , which is conducive to the convergence of the position function and provides data and theoretical support for establishing the attribution relationship model.
2.4. MPG-YOLOv8 Segmentation Model of Bottle-Planted Enoki Mushrooms
2.4.1. StarNet
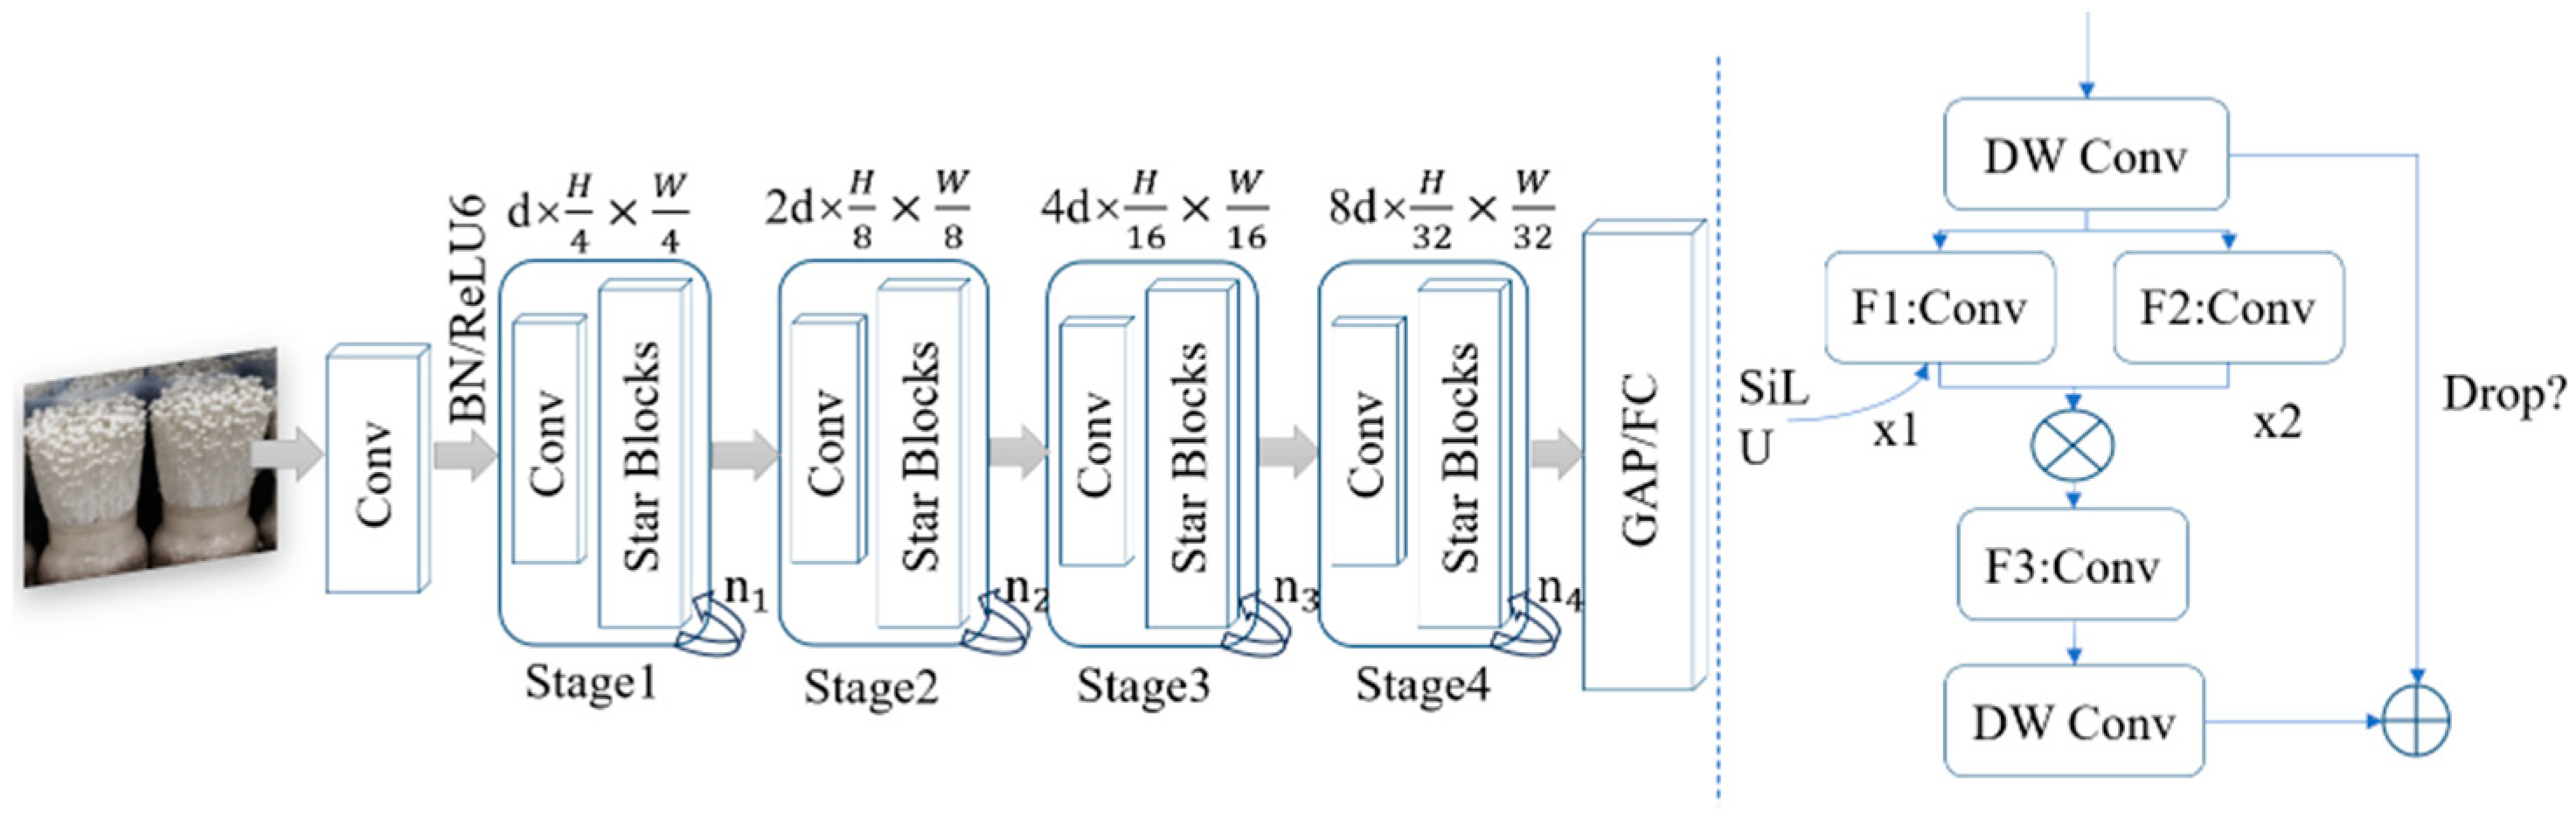
StarNet [20] involves using a four-stage hierarchical architecture for efficient image processing. Its structure includes convolutional layers for down-sampling, an enhanced feature extraction block, and batch normalization applied following a depth-wise convolution to improve its efficiency and flexibility. The activation function was replaced with ReLU instead of GELU to optimize the model performance. The detailed structure is shown in Figure 5.
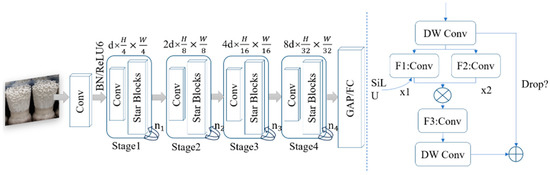
Figure 5.
StarNet structure.
2.4.2. SPPECAN
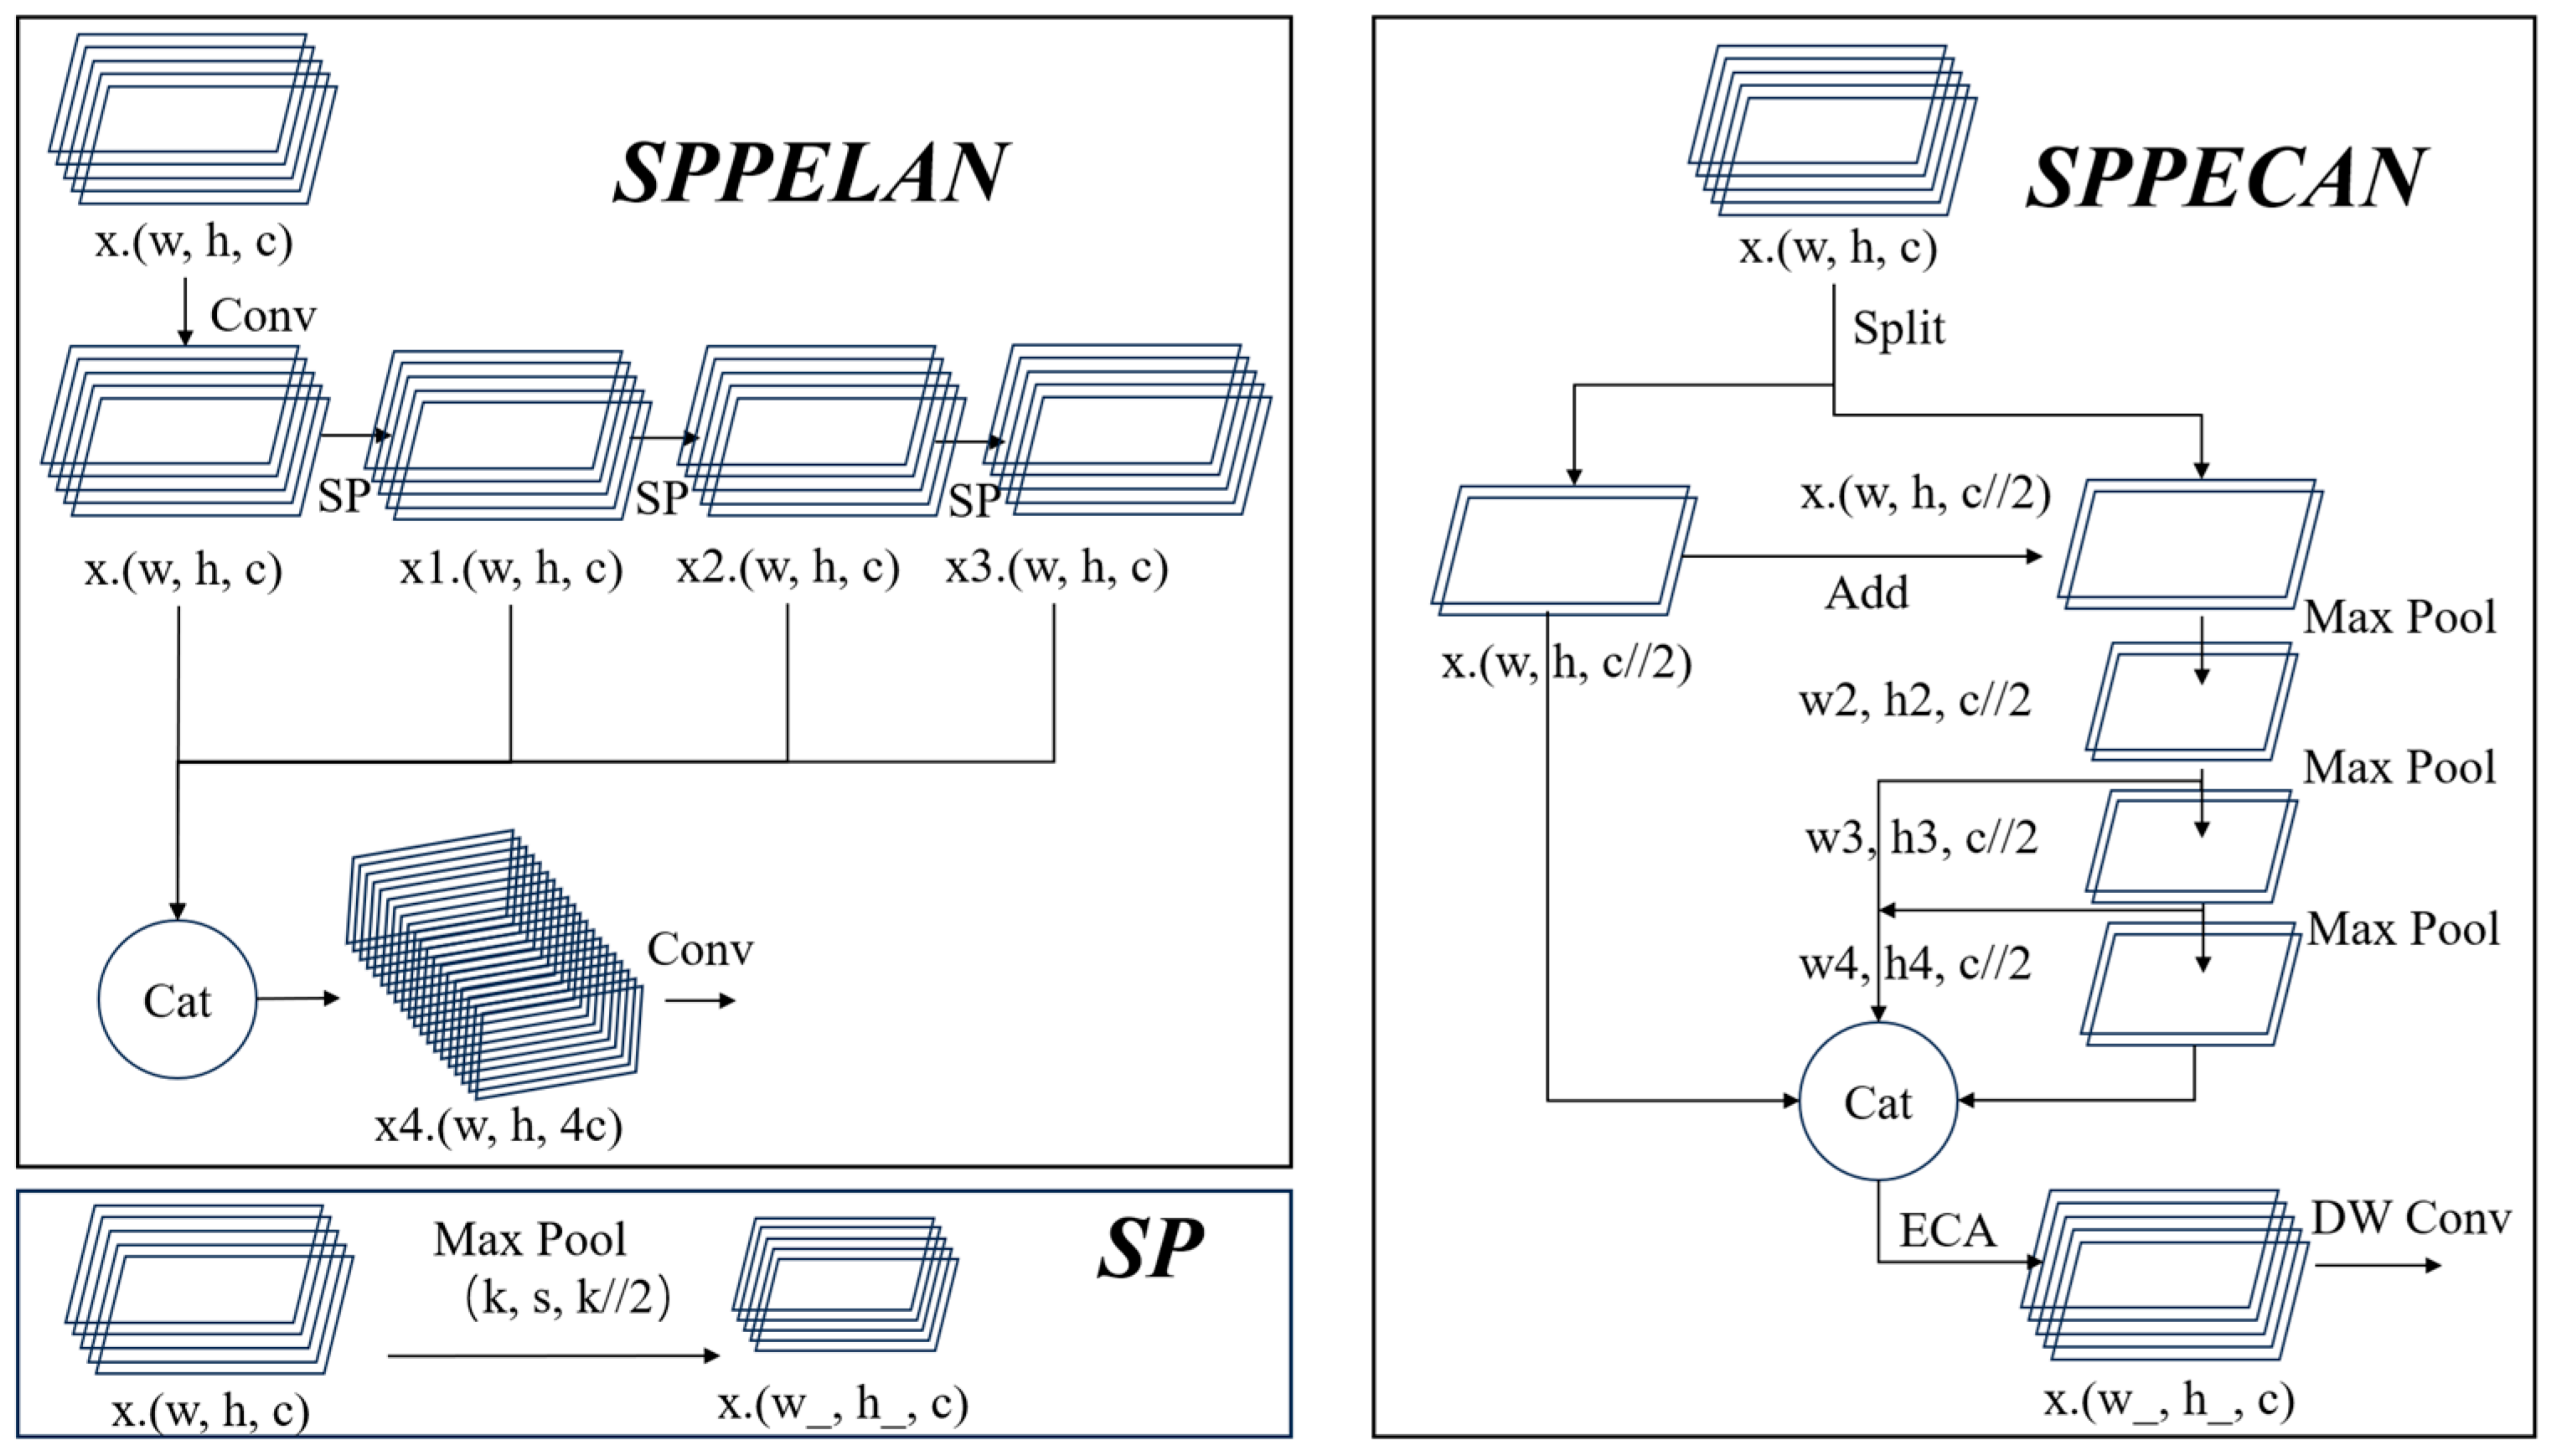
Cao [21] is a novel multilevel feature fusion method that involves combining spatial pyramid pooling (SPP) with an efficient local aggregation network (ELAN). This lightweight network structure enhances the feature extraction capability of the model through local aggregation and global integration, significantly improving its performance. By integrating the SPP with the efficient feature aggregation of ELAN, SPPELAN can be used to effectively increase generalization and accuracy without increasing the number of parameters [22,23,24].
This study optimized SPPECAN based on SPPELAN, and the structures are shown in Figure 6. SPPECAN specifically involves using parallel-branching feature extraction. Using the chunk method, the input feature map was initially divided into two parts along the channel dimensions. The right-path channel features were first fused with the left-path channel to enhance feature richness, followed by three consecutive max-pooling operations to reduce the feature map size while retaining the most salient features. The left-path features were concatenated with the right-path features at each level along the channel dimensions. The efficient channel attention (ECA) mechanism was used to intensify the attention on salient features, reducing computational parameters and improving feature characterization. Finally, the Conv Layer was replaced by a DW Conv to achieve a lightweight convolution without compromising feature extraction.
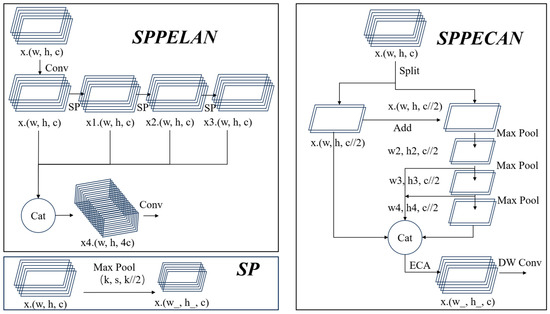
Figure 6.
SPPECAN structure.
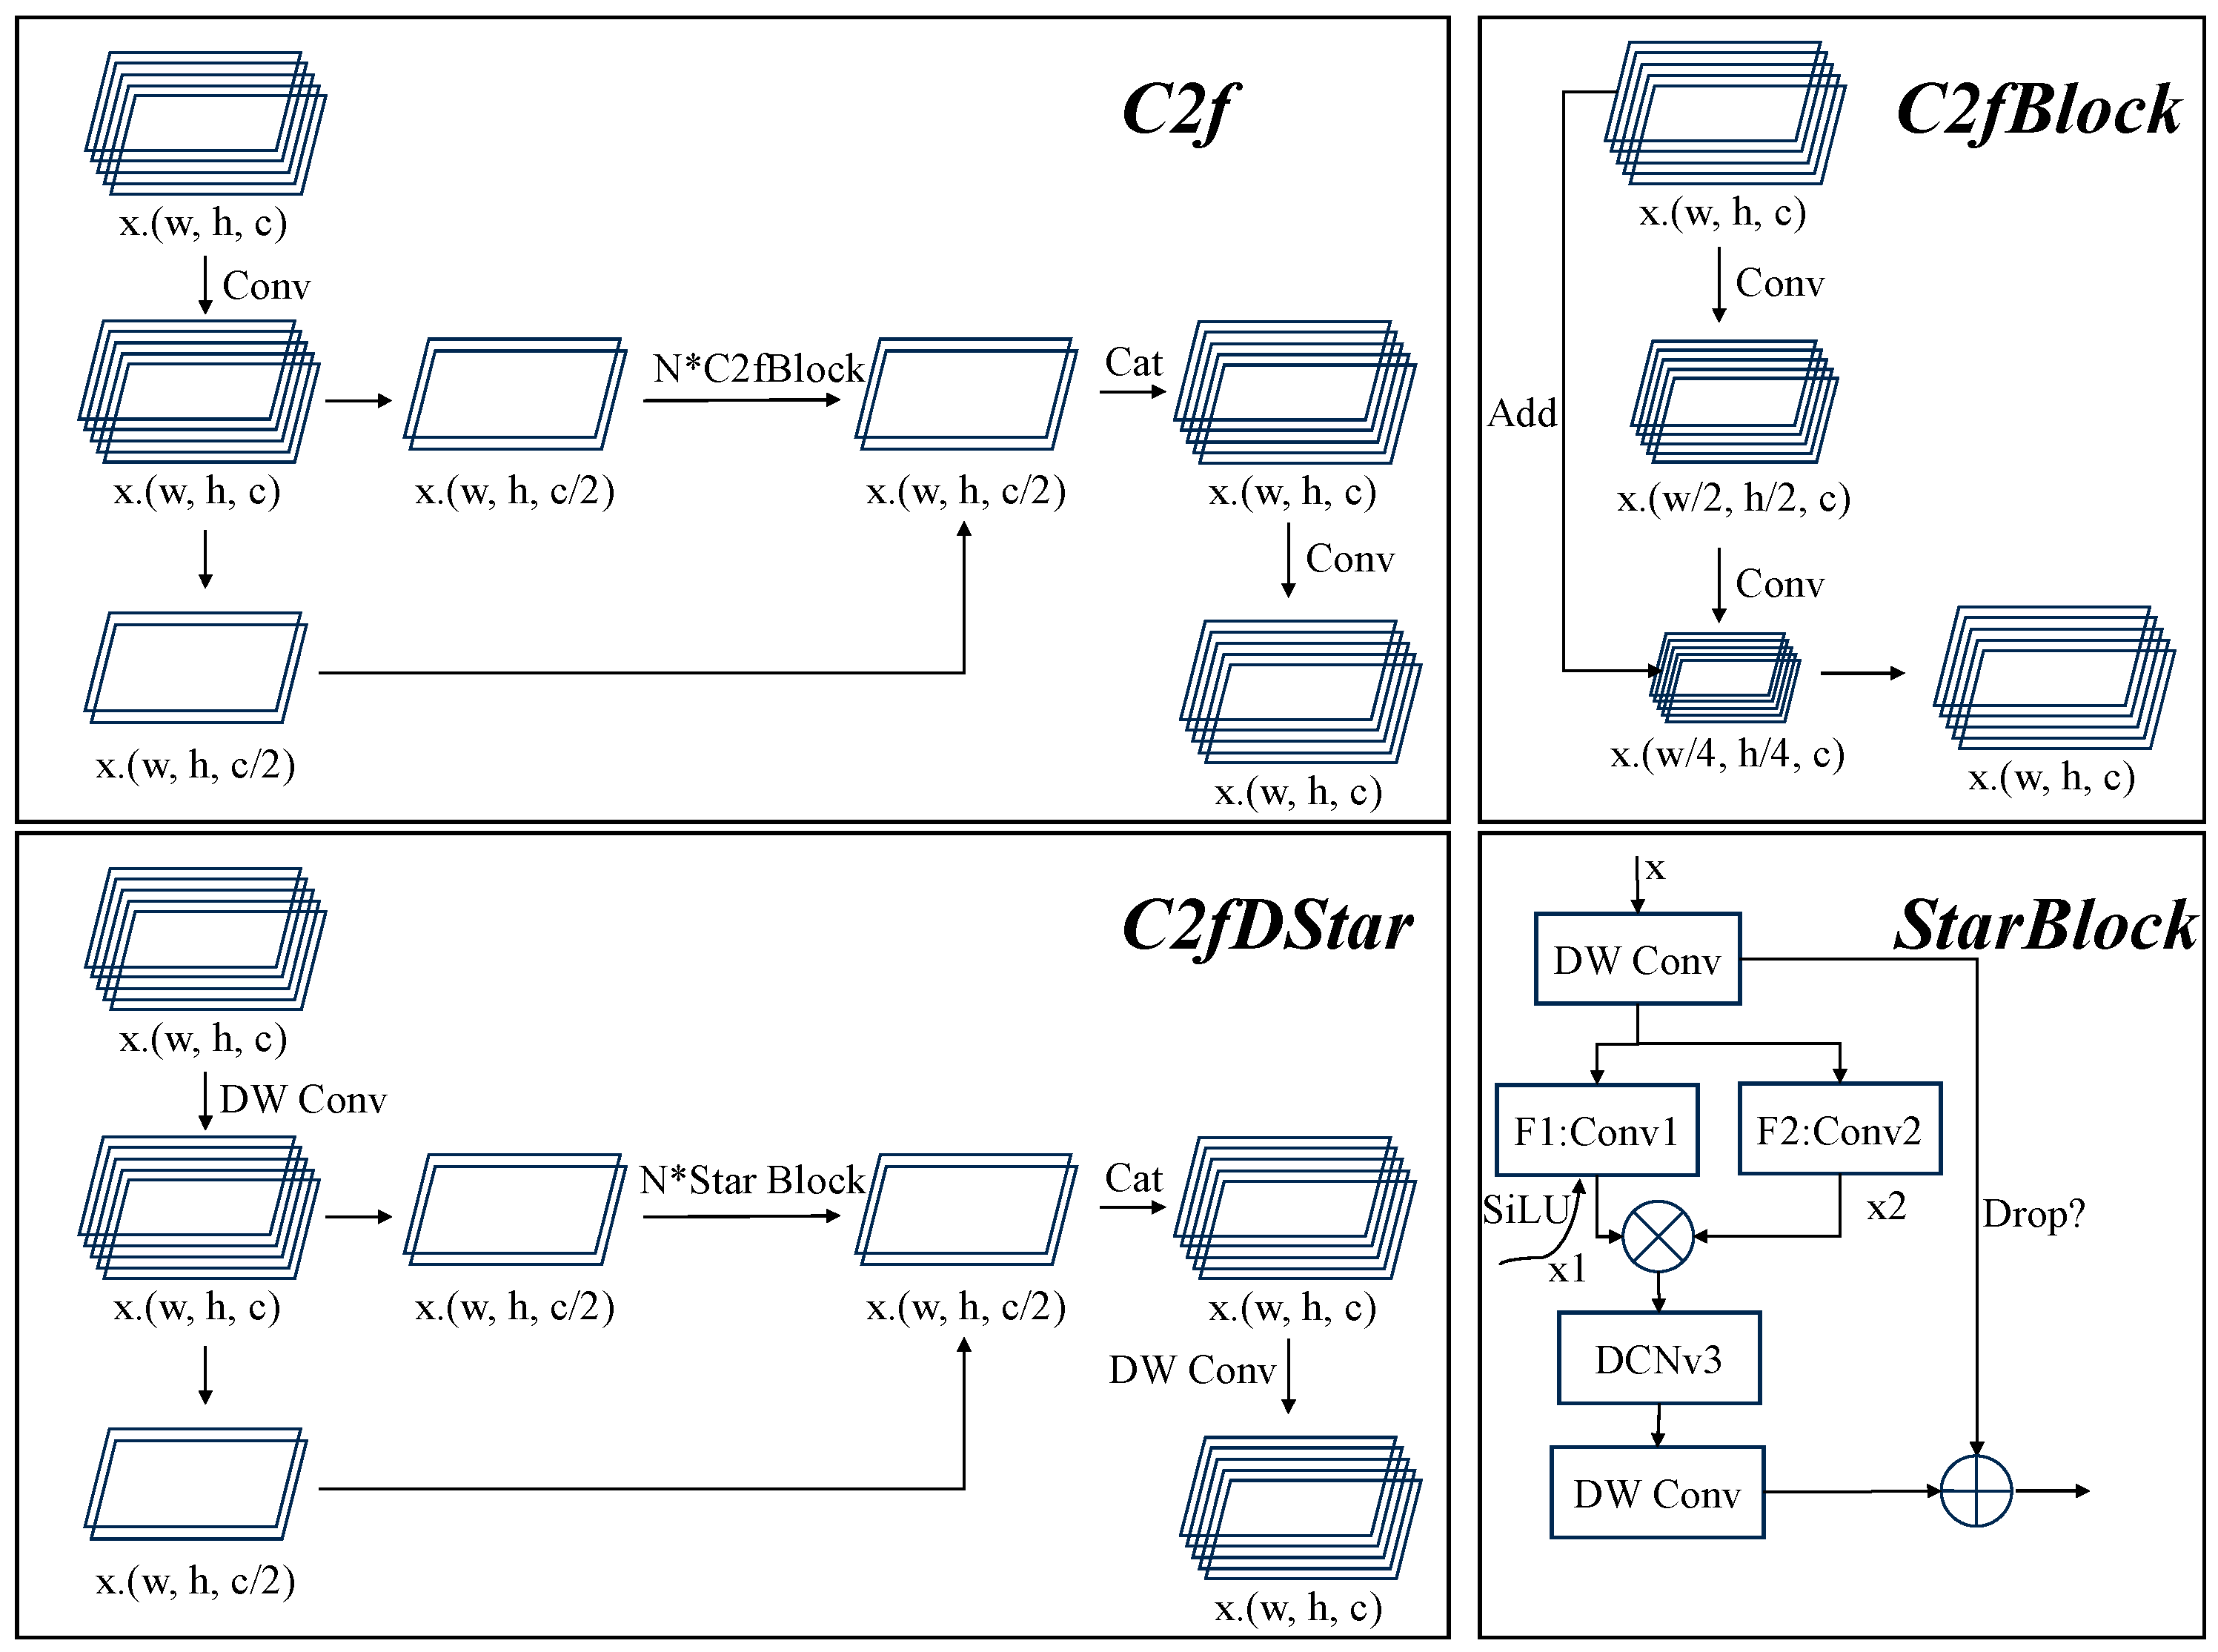
2.4.3. C2fDStar
C2f is a lightweight feature fusion module in YOLOv8 [25,26]. Its primary advantage is its low computational cost, effectively enhancing model performance. Additionally, the C2f module ensures richer gradient flow information, which is crucial in feature extraction, transformation, and fusion to generate outputs with improved representational capabilities.
Deformable convolution (DCN) enhances traditional convolution operations by introducing dynamic spatial offsets, allowing the convolutional kernel to adaptively adjust its sampling positions to better fit the shape and structure of the input data [27]. Compared with standard convolution, DCN is more flexible in capturing irregular shapes or complex geometric features, making it particularly suitable for tasks such as object detection and instance segmentation, which require complex spatial transformations [28,29,30,31,32].
We proposed C2fDStar, an improvement based on C2f that involves incorporating the excellent ideas of StarNet. The structure and propagation path of C2fDStar are illustrated in Figure 7. The primary differences between C2fDStar and C2f are DCNv3, DW Conv, and StarBlock. This parameter-lightweight optimization is particularly valuable for real-time detection of enoki mushrooms, where efficient and fast computation is essential.
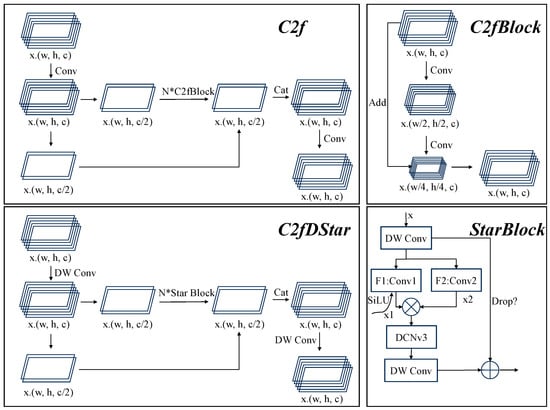
Figure 7.
C2fDStar structure.
2.5. Mask Relation Determination and Merger Optimization Based on Euclidean Distance
Section 2.3.2 involved using a constrained labeling method to avoid prediction devia-tions of the ROI. However, this approach caused the appearance of numerous masks in the window, which interfered with the result evaluation and reduced the inference efficiency. To address this challenge, we constructed a parent–child hierarchical mask attribution model to accurately determine the “enoki” and “pick region” mask attribution for the same bottle of enoki mushrooms. We also performed mask merging and boundary optimization using a logical algorithm.
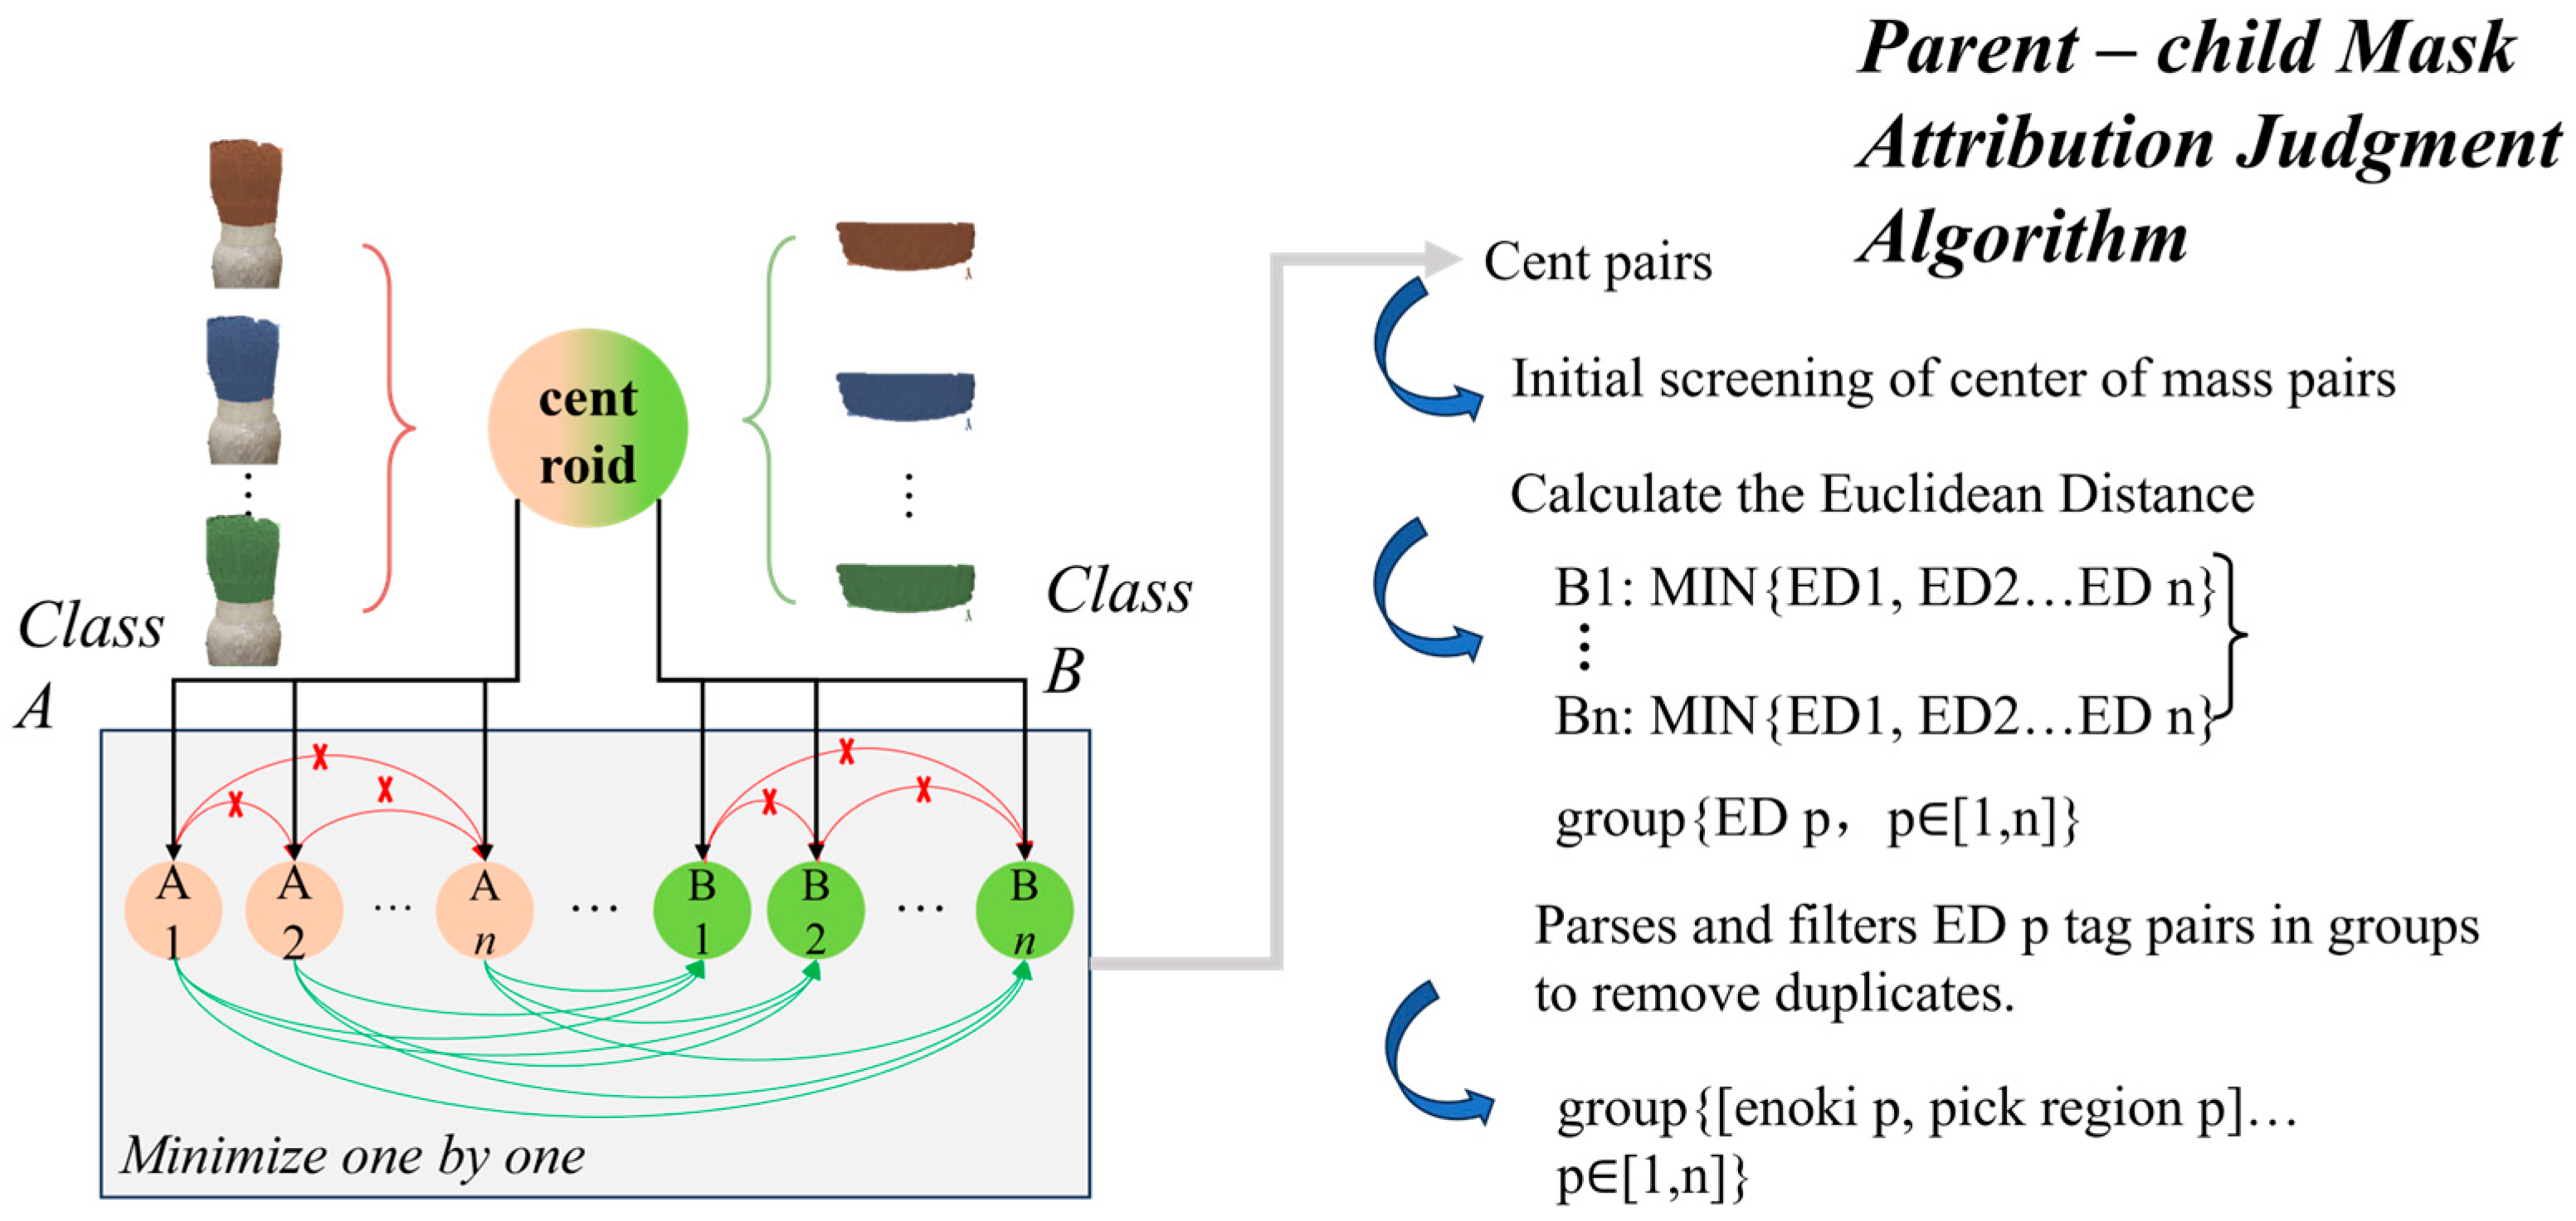
2.5.1. Modeling Parent–Child Relationship
To define the labels “enoki” (Class A) and “pick region” (Class B), we established that the Class A label was the parent mask, and the Class B label was the child mask. Each Class A mask should be paired with a Class B mask if a Class B result is detected. We used a parent–child attribution method based on the minimum Euclidean distance to determine whether a Class B object has a true parent–child relationship with a Class A object, as illustrated in Figure 8.
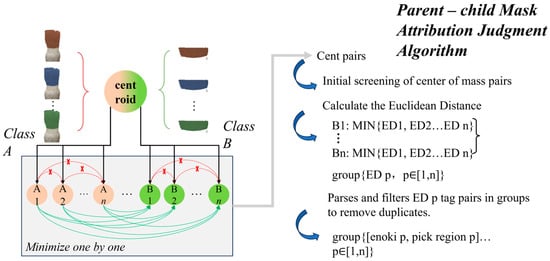
Figure 8.
Parent–child relationship judgment algorithm. ‘x’ stands for existential problem.
The pseudocode for this process is as follows (shown as Algorithm 1):
| Algorithm 1. Generate label pairs based on region distribution and center of mass distance |
| Input: enoki_tags: Set of “enoki” tags pick_region_tags: Set of “pick region” tags Output: group: Set of label pairs {enoki_tag, pick_region_tag} 1. Initialize group ← ∅ 2. For each enoki_tag ∈ enoki_tags do For each pick_region_tag ∈ pick_region_tags do // Step 2a: Read contour pixels corresponding to the labeled objects contour_pixels ← ReadContourPixels(enoki_tag, pick_region_tag) 3. Calculate center_of_mass(enoki_tag, pick_region_tag) for each contour 4. Filter pairs of centers of mass that meet region distribution conditions 5. For each pair of centers of mass (Class A, Class B) do // Step 5a: Compute Euclidean distance (ED) between centers of mass ED ← EuclideanDistance(center_of_mass_A, center_of_mass_B) // Step 5b: Track the minimum Euclidean distance for each pair min_ED ← min(min_ED, ED) 6. For each pair {enoki_tag, pick_region_tag} do // Step 6a: If minimum ED value is obtained, add label pair to group if ED = min_ED then group ← group ∪ {enoki_tag, pick_region_tag} 7. Remove duplicates from group Return group |
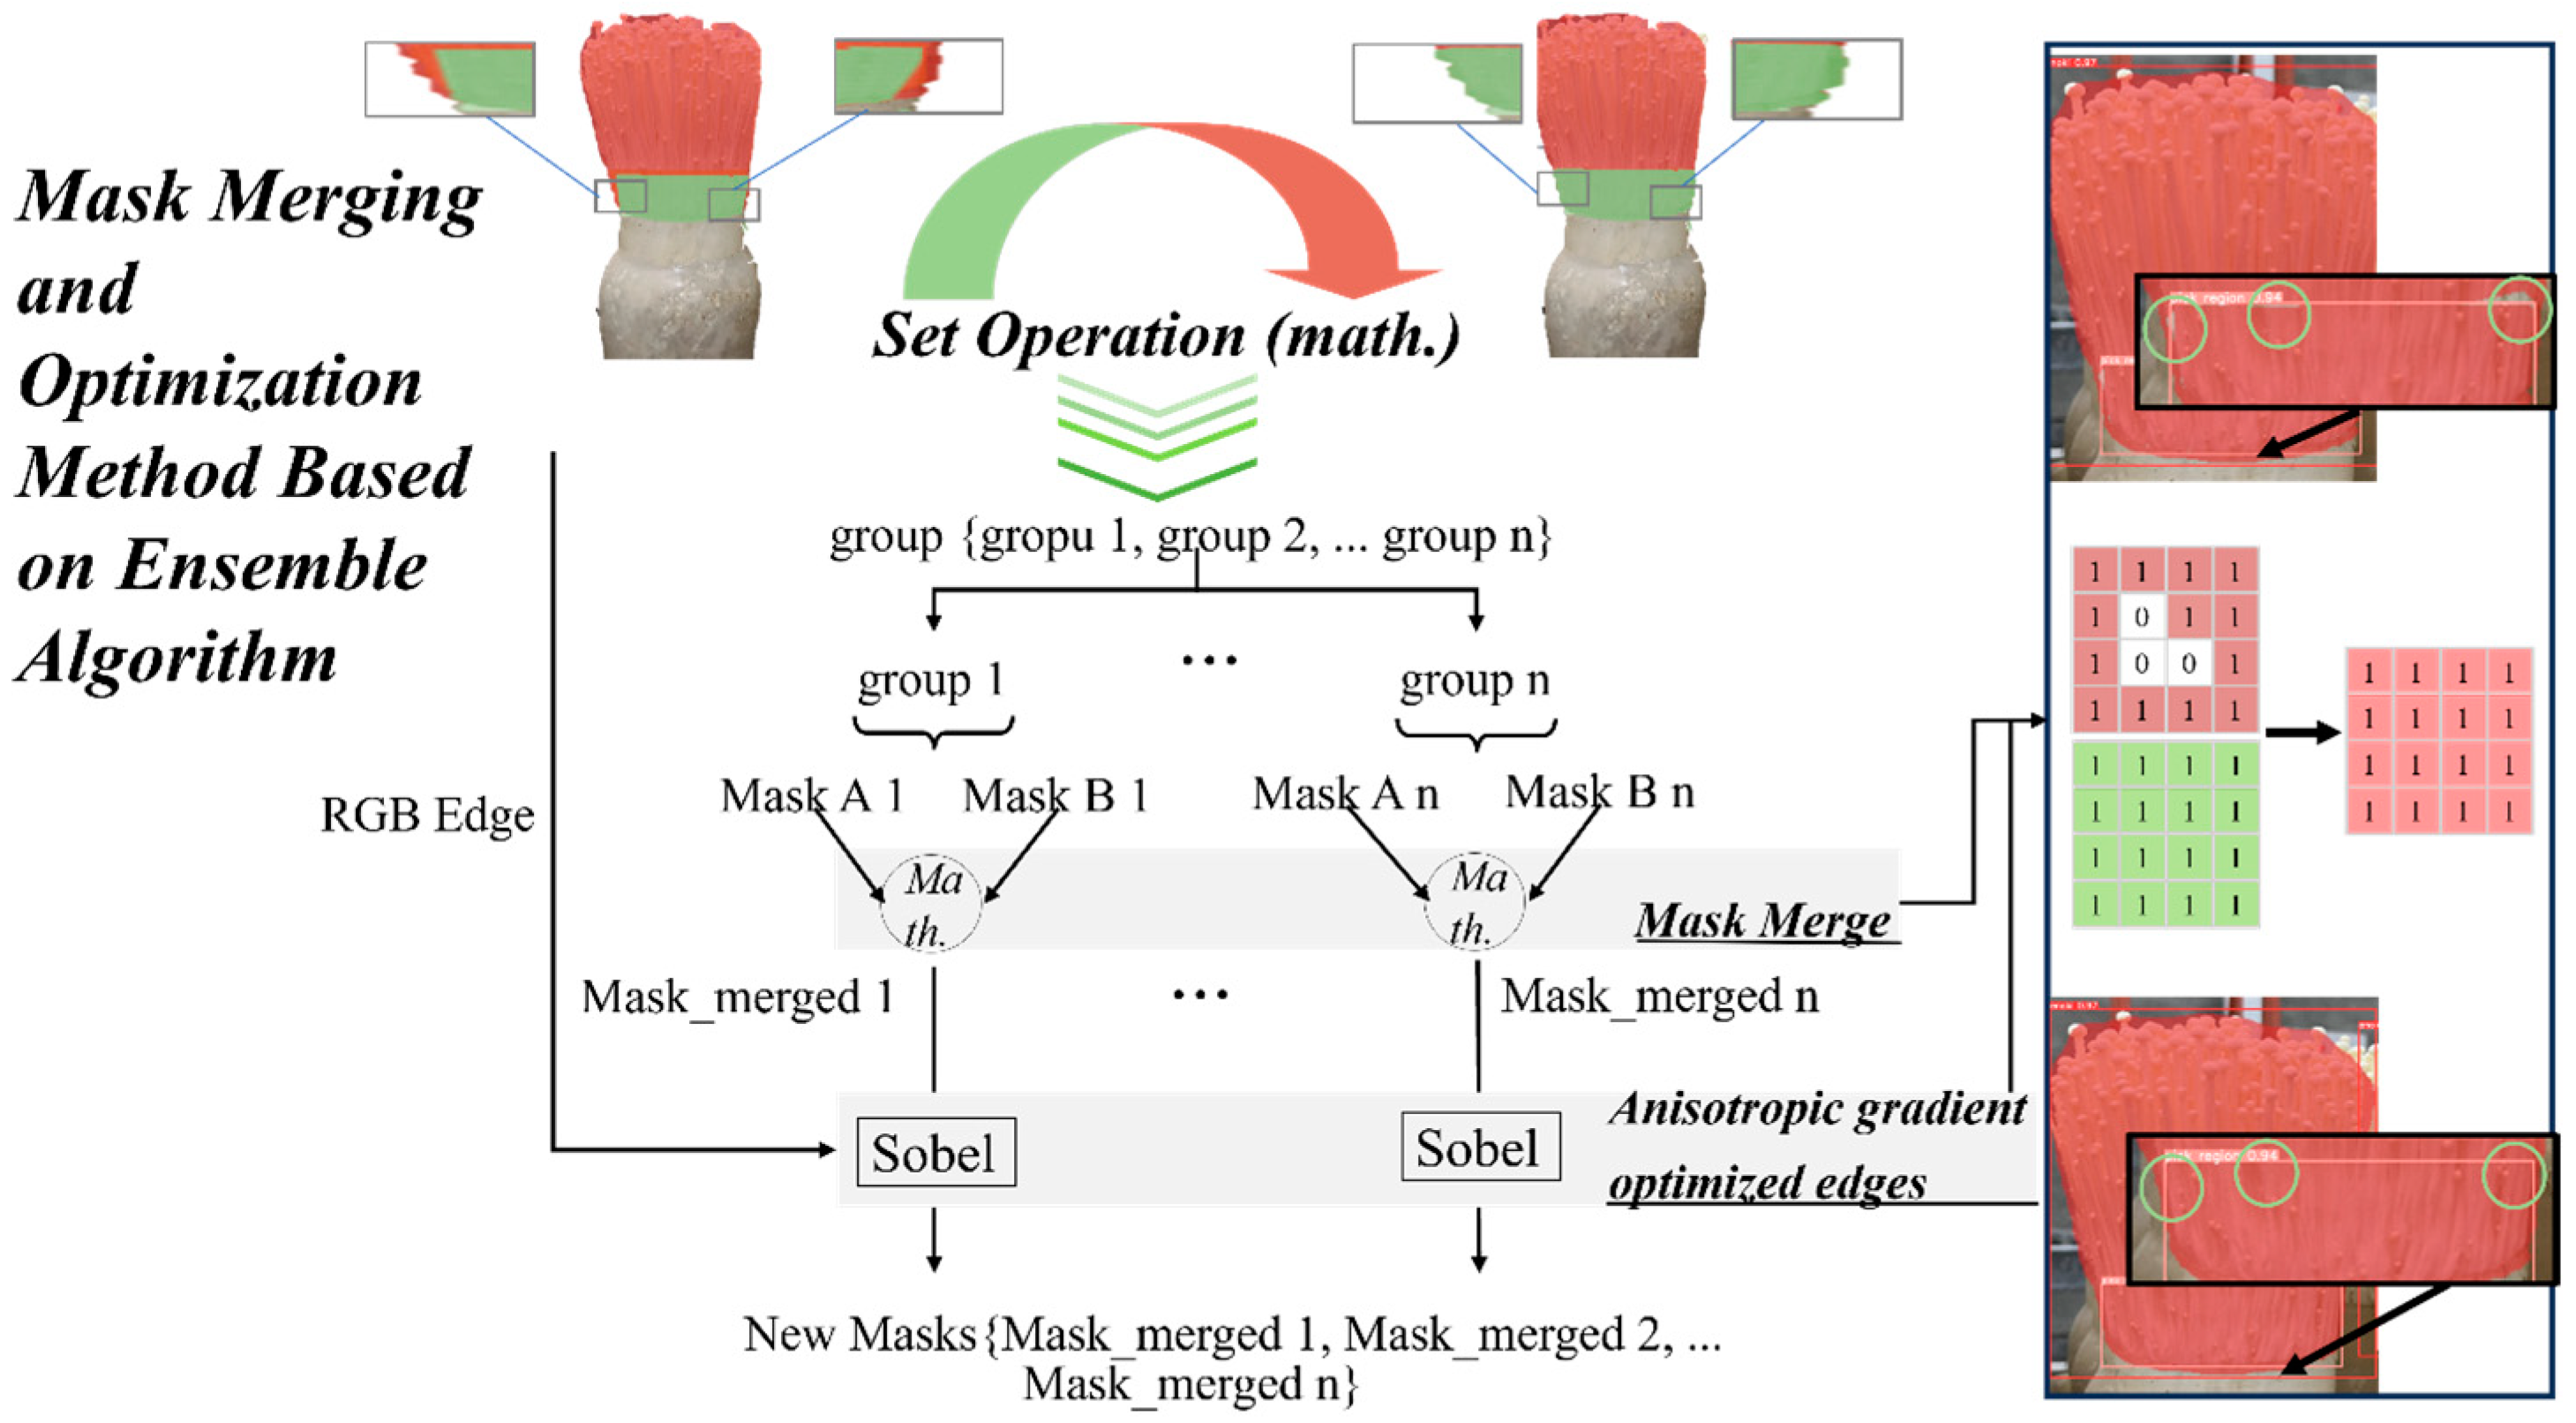
2.5.2. Mask Merging and Edge Optimization
As demonstrated in the previous section, high-quality target detection and segmentation are crucial for the individualized grasping of enoki mushrooms. Experimentally, the Class B mask usually has incomplete coverage or exceeds the target boundary, causing inaccuracies in representing the contour boundary; this causes error accumulation in the subsequent coordinate calculations, affecting the grasping accuracy. To address this challenge, we proposed a mask merging and optimization method based on an ensemble algorithm, as shown in Figure 9.

Figure 9.
Mask-merging algorithm.
The group label pairs were iterated to obtain mask pixel values mapped to a binary 0–1 space. Using XOR (exclusive OR) to merge the masks helps fill any gaps within the mask that should not contain empty spaces. XOR compares overlapping mask values by assigning a value of 1 to the masked regions and 0 to the non-masked regions, effectively highlighting differences. This approach identifies and fills areas where the masks should have been continuous.
The Sobel operator, which is more practical and lightweight than the Canny operator, is used to extract image edges using first-order differentiation. The Sobel gradients in both the x and y directions are computed to measure the intensity of changes in pixel values, and the gradient magnitude is obtained by combining these two gradients. After calculating the gradient magnitude, Otsu’s method is applied to automatically determine the optimal threshold value. This process fine-tunes the segmentation contour boundaries, mitigates error propagation, and improves overall segmentation performance by providing more accurate and stable edge detection.
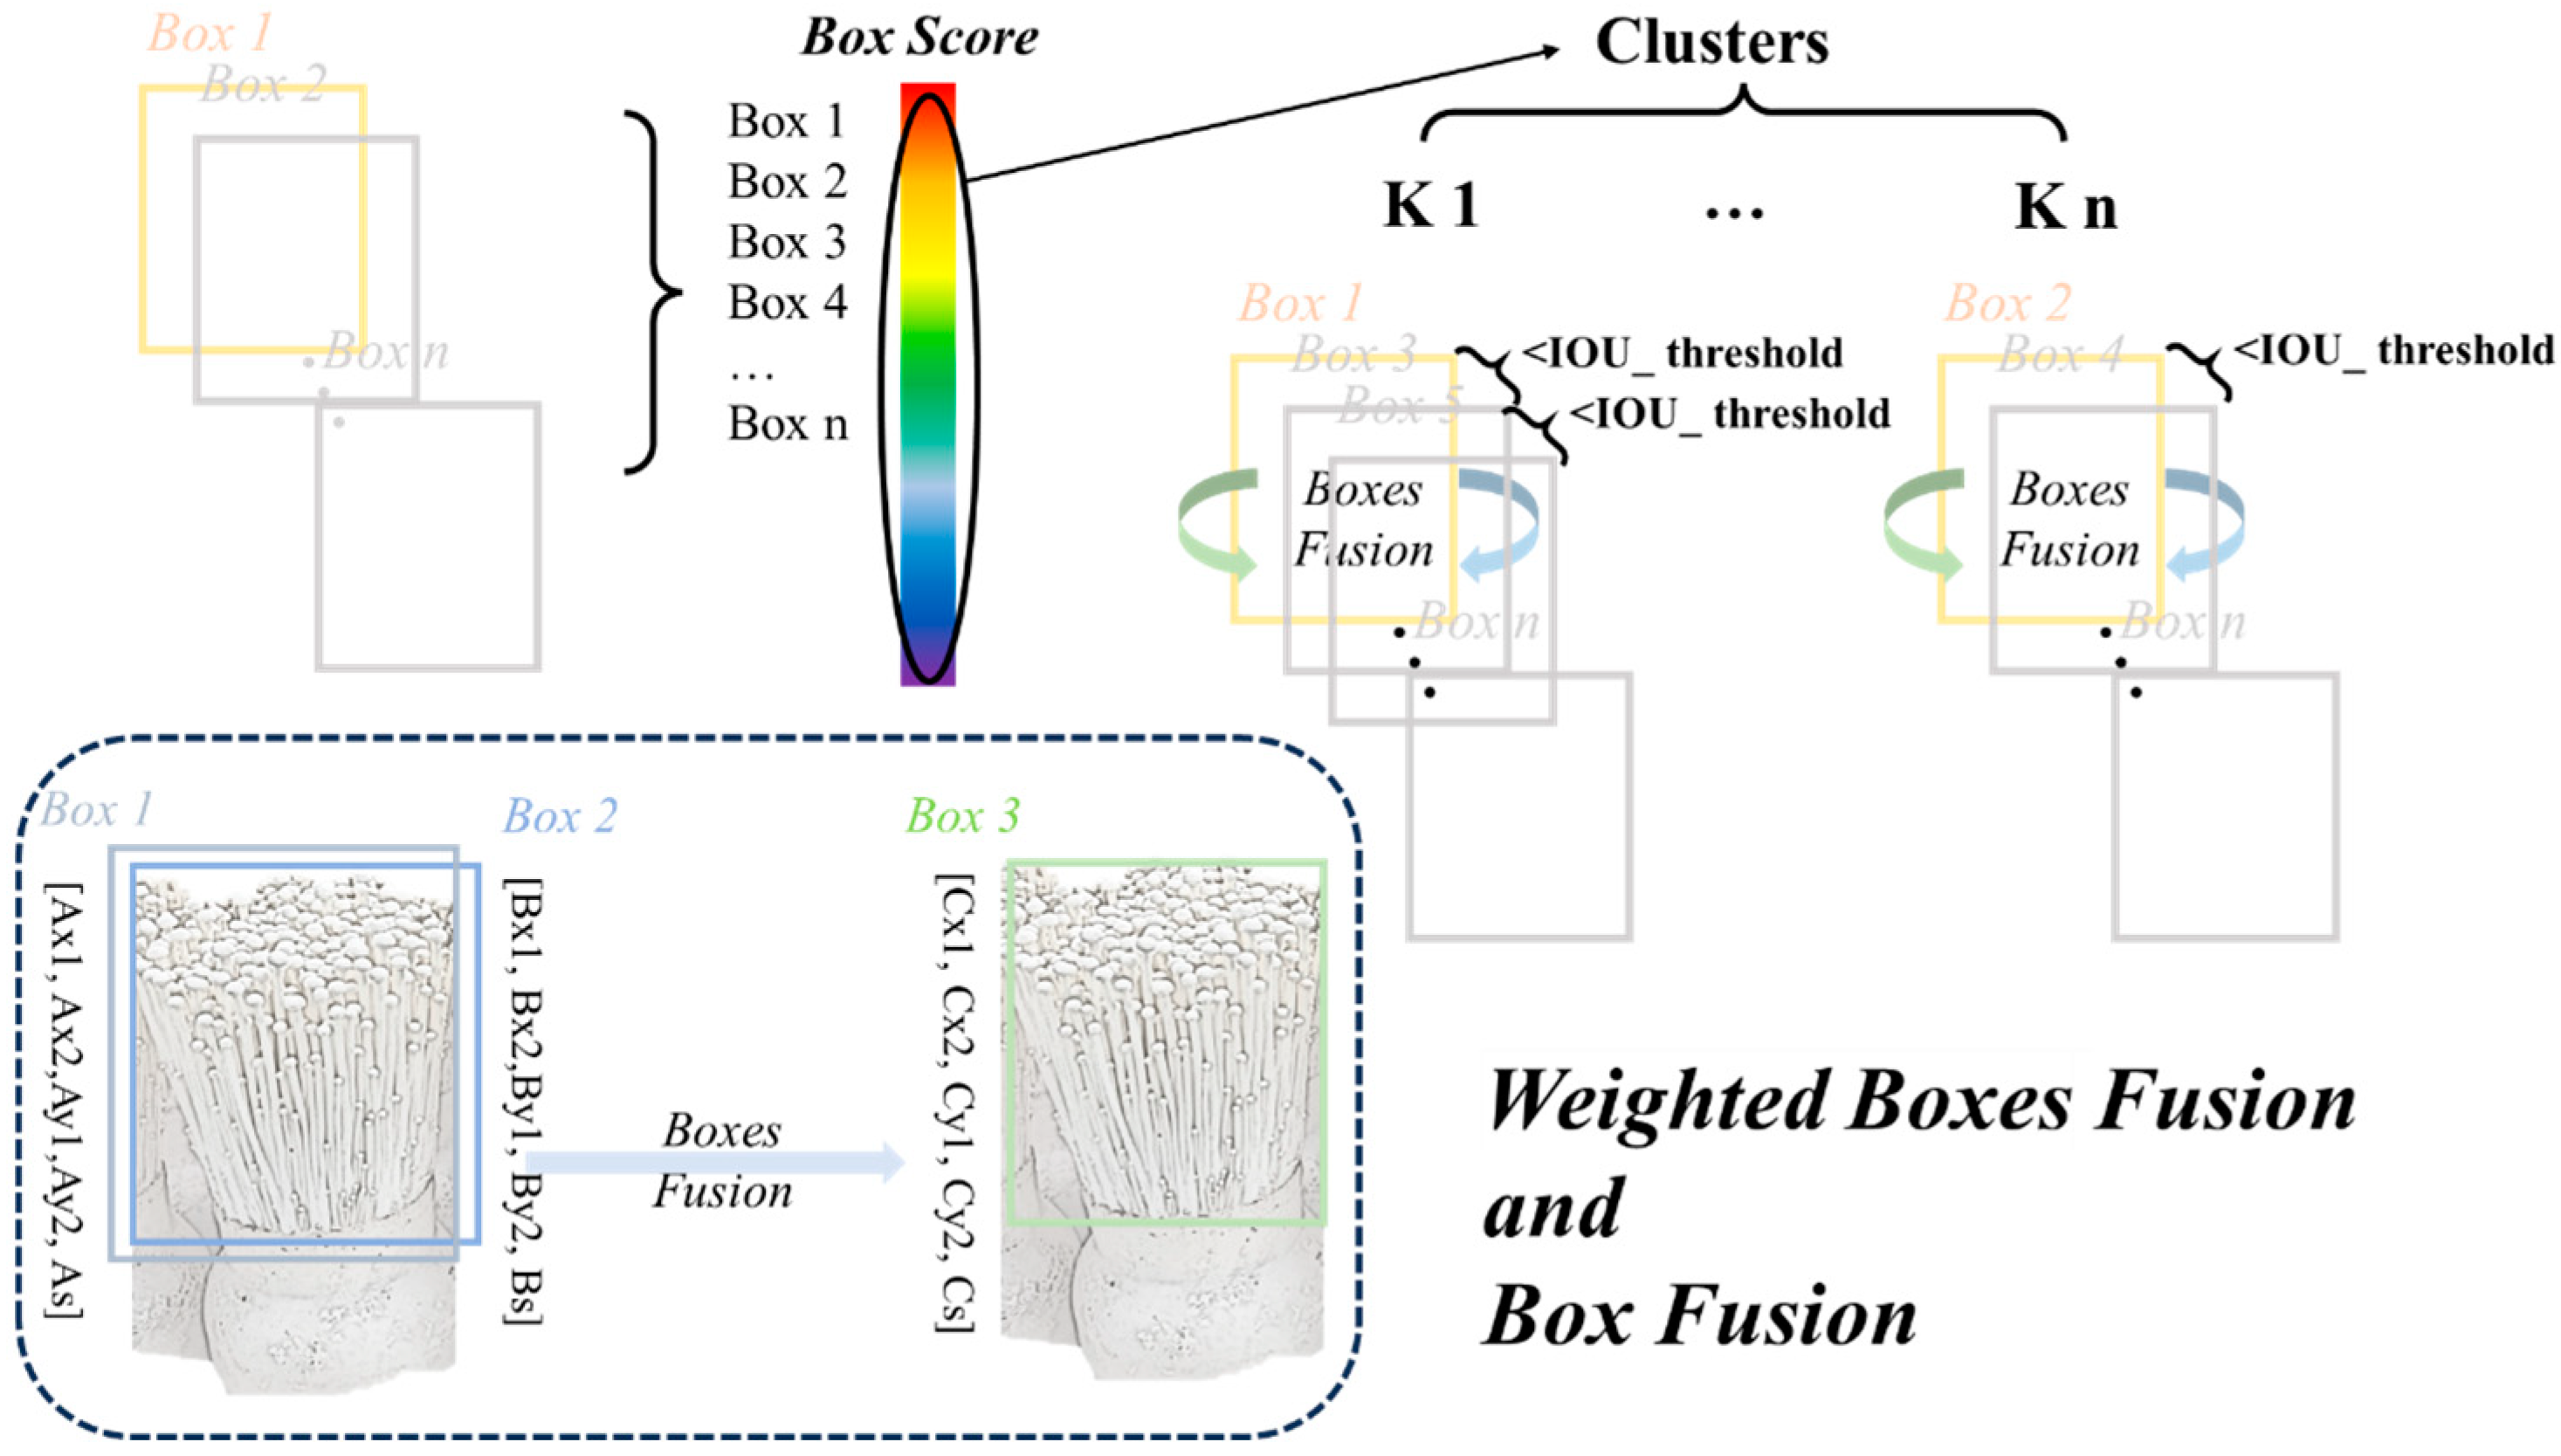
2.5.3. Weighted Box Fusion (WBF)
Several factors influence the model’s performance, including parameter size, hardware capabilities, and image size. As YOLO involves performing image up-sampling and down-sampling before feature extraction, this process may introduce noise or cause feature loss. The images used in this study had a resolution of 3024 × 3024 pixels, while the training images were resized to 640 × 640 pixels, which may have limited the model’s performance.
To investigate this, we conducted comparison and ensemble experiments to explore the impact of different image sizes on the prediction results. These results were combined to enhance the model’s accuracy and robustness. The WBF strategy was used in the ensemble process. This method sorts and clusters the prediction boxes based on their confidence scores and iteratively checks each box to determine which cluster it should be fused with based on the IoU_threshold (with the value set to 0.5), as illustrated in Figure 10. This process helps to reduce duplicate predictions and improve the final detection accuracy by consolidating highly overlapping boxes into a single, more accurate bounding box.
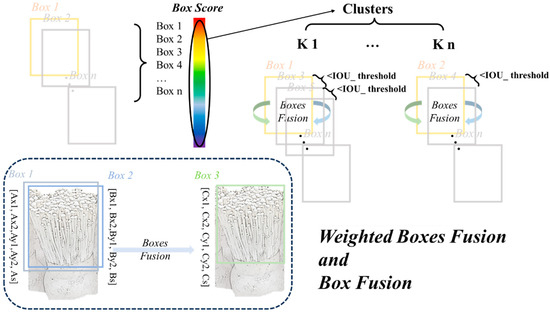
Figure 10.
How weighted box fusion (WBF) and box fusion work.
Unlike non-maximum suppression (NMS), which directly eliminates redundant frames, WBF fully uses the used detection frames through weighted fusion, where the fused frames were formulated as follows:
where denote the quadrangle coordinates of the prediction box, ‘s’ denotes the confidence level, and the confidence level (box score) is used to express the score of the prediction boxes.
2.6. Optimization of Grabbing Parameters for Enoki Mushrooms
The solution usually involves selecting the center of mass as the target point when recognizing and grasping targets with high spatial symmetry and uniform texture. The corresponding target width is a line segment that intersects the contours on both sides of the center of mass. However, the center of mass position shifts accordingly for objects with heterogeneous textures and low spatial symmetry, such as bottle-planted enoki mushrooms.
In this study, we proposed a target point optimization method that can dynamically adjust the center of mass position based on the specific boundary of the grasping region. This approach helps obtain a new, more accurate target point, as shown in Figure 11.
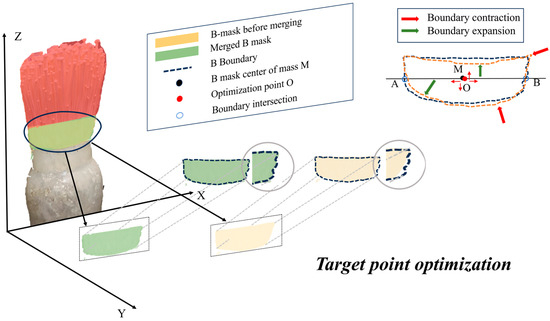
Figure 11.
Schematic diagram of the optimization algorithm.
Let the center of mass of the B mask before merging be Point O, the new center of mass after merging and optimization be , and the two points in the same horizontal plane as M that intersected the boundary be A and B. Take Point A to B to form the line segment connecting the two ends of the B mask as the required pixel width. The calculation formula is , where is the line segment, A represents the coordinates of the left endpoint of Line AB, and B is the right one.
2.7. Communications and Control
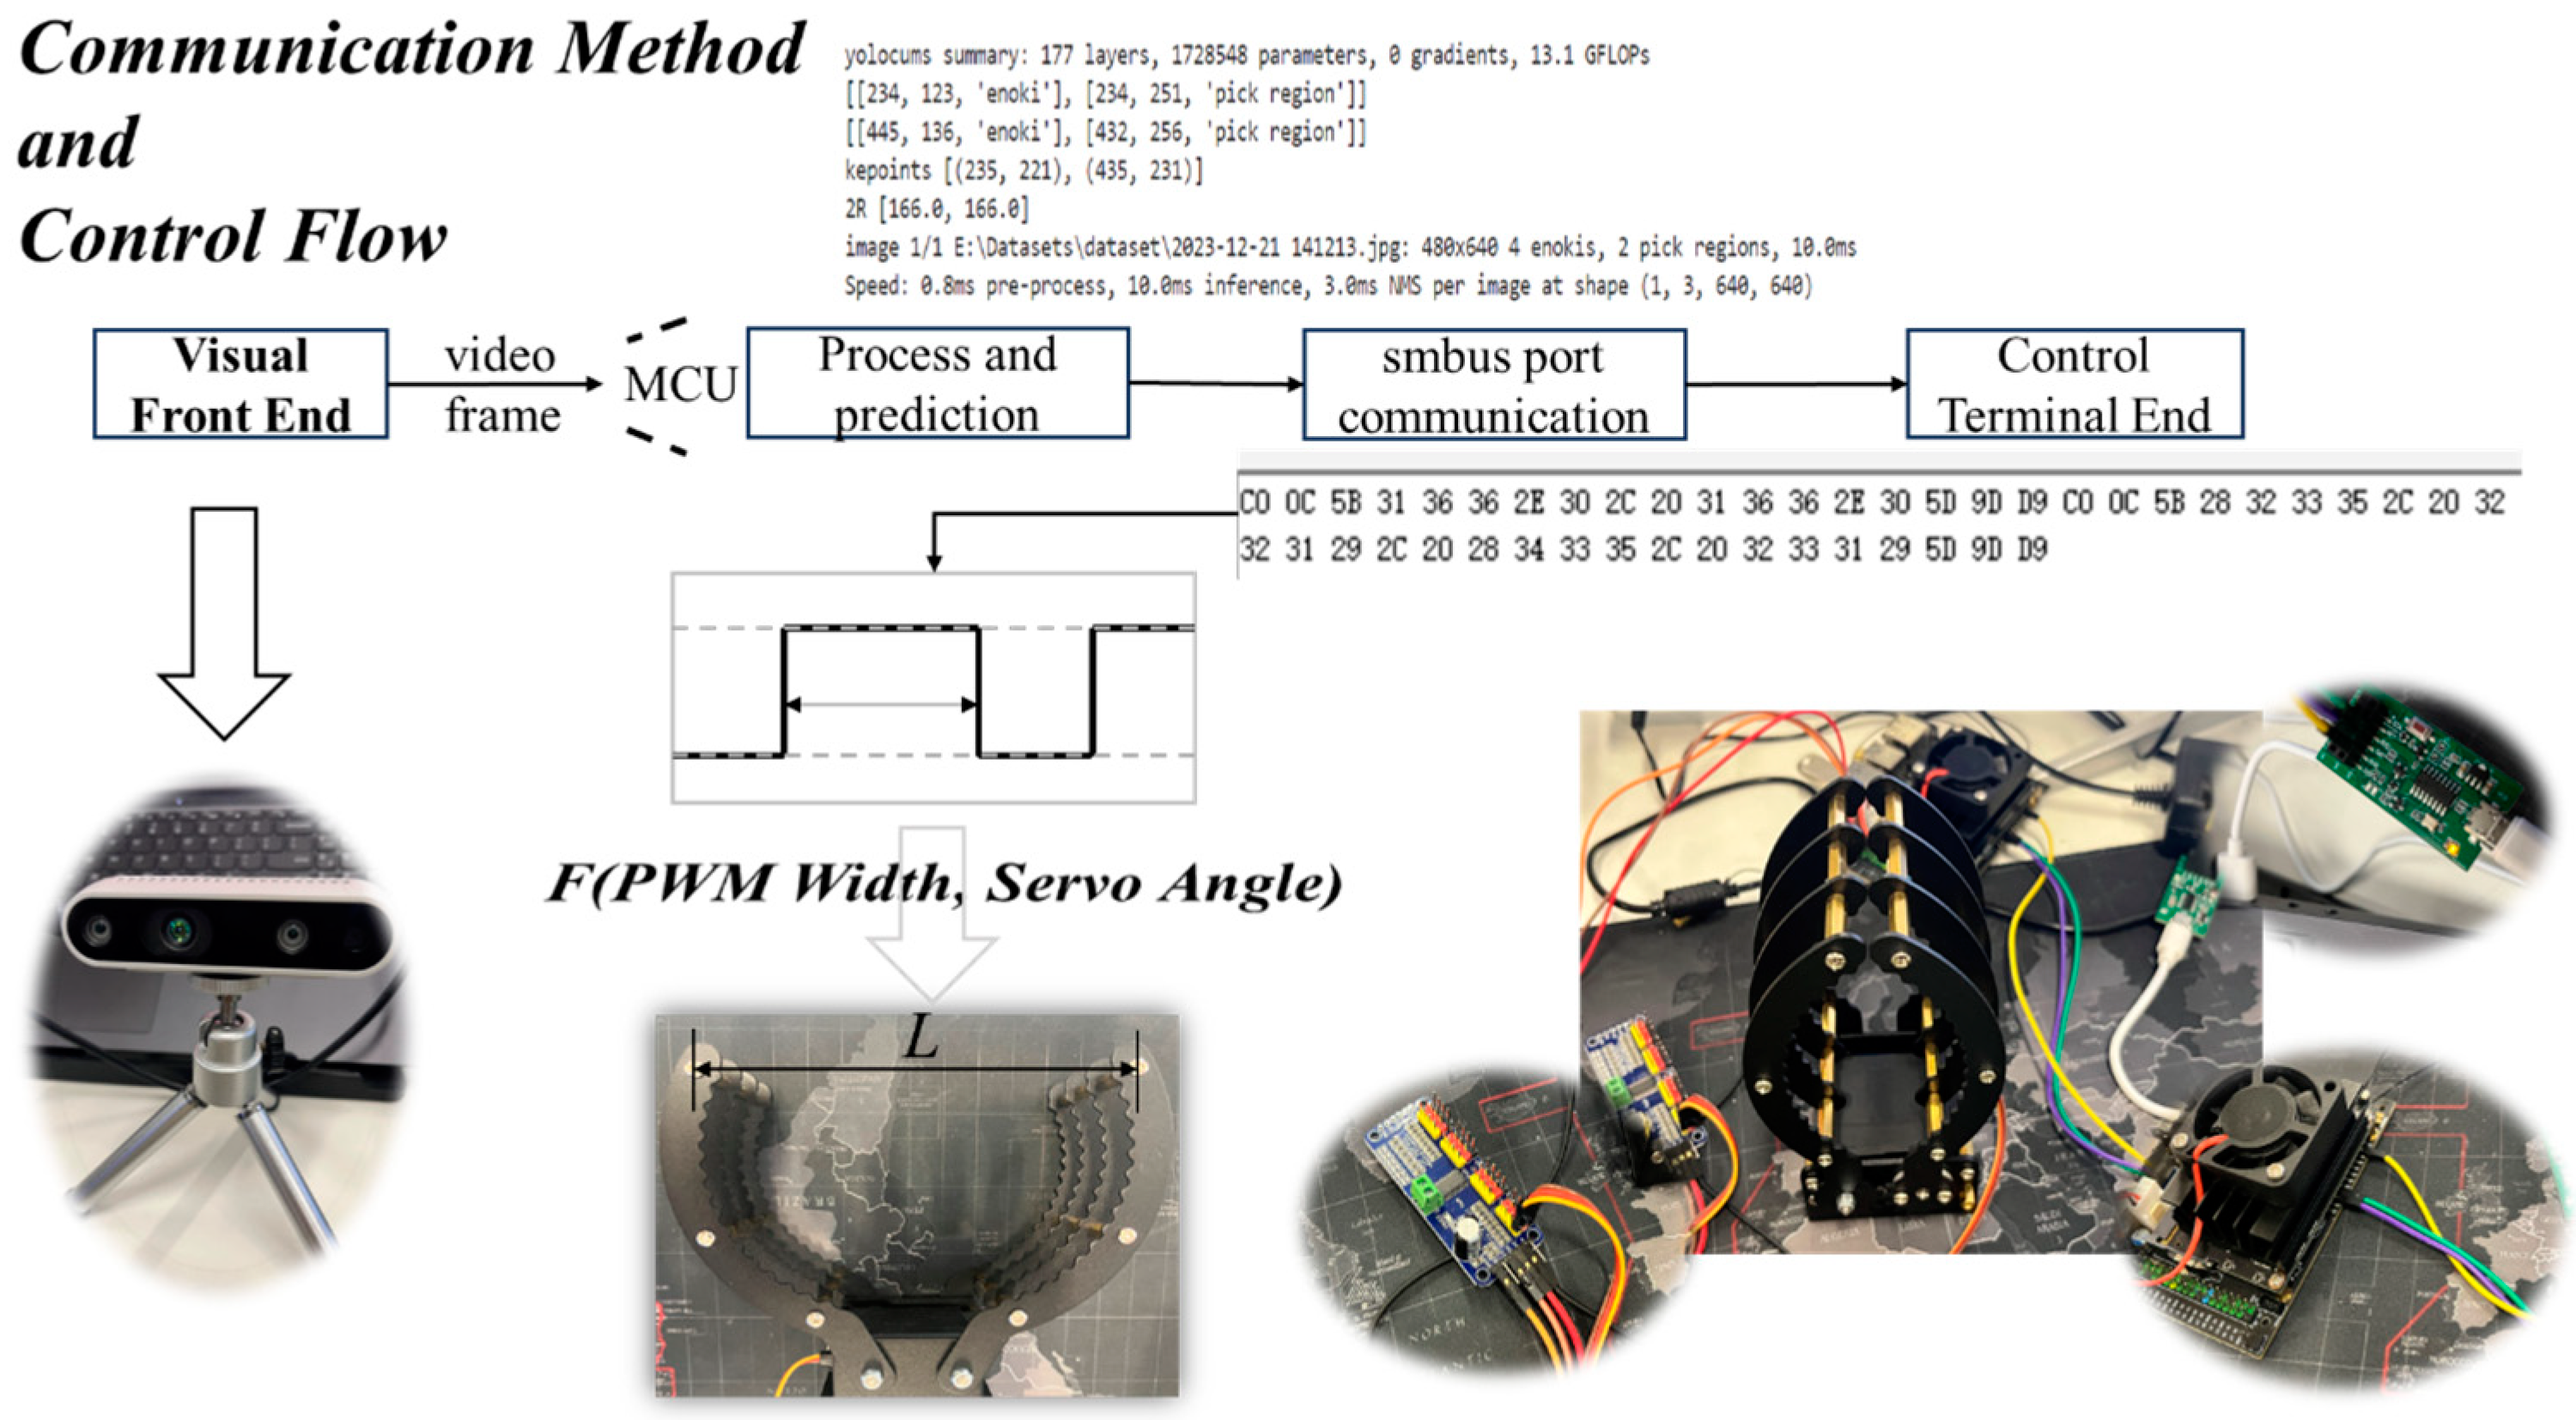
As shown in Figure 12, the conversion from pixel to world coordinates satisfies , where (u, v) denotes the pixel coordinates, K denotes the camera’s internal reference, T denotes the camera’s external reference, and (x, y, z) denotes the world coordinates. There were , and d is the depth value that can be obtained directly. The camera type was RealSense d435i, and the internal and external parameters were accessible, which can be obtained as internal reference: x-direction focal length ; y-direction focal length . External reference: rotation matrix R =; translation matrix . Ranges from 0 to 270° were used as the servo angle, and the pulse width ranged from 0 to 1000. The mapping of the servo angle and pulse width satisfies

Figure 12.
Communication, mapping, and control flowchart.
PWM represents the pulse width modulation. Finally, the initial state of the servo was maintained at 0 pulse width. Because the servo angle position was absolute, the corresponding angle at any moment had a unique position; therefore, the equation indicates the angle at the k state and indicates the pulse width at the k state. is the mapping function, and the deviation indicates the claw position error correction; 0, 270, 0, and 1000 indicate the angle and pulse width parameters of the servo in this model.
To reduce the extra computation generated by the change in the coordinate system during spatial coordinate transformation, the depth camera position was fixed in this study, and the captured images were input into the model to obtain the width information of the gripping area of the enoki mushroom. After coordinate conversion, the width value was mapped to the corresponding pulse width through the established {pixel width–pulse width–servo angle} mapping relationship to control the servo angle. The process was communicated in the IIC (inter-integrated circuit) protocol to transmit the pulse width to the servo control board. It was precisely used to control the amount of travel through the end gripper. Regarding effectiveness, whether the error between the width of the gripper hand and the width of the ROI of the enoki mushroom after driving was less than a threshold value was considered an indicator. Regarding communication protocol and data processing, because the initial serial port information was difficult to distinguish between multiple messages, we adopted the method of self-defined data frames; that is, the data sent from the serial port were in the form of frame header (‘/xC0’, ‘/x0C’) + width information + frame tail (‘/xD9’, ‘/x9D’), which helps ensure the synchronization of information transmission and the integrity of information decoding.
2.8. Software and Hardware for Data Analysis
The programming software used in this study was Visual Studio Code (version 1.97), with model training conducted on the Windows 11 operating system. The PyTorch framework was integrated into the Anaconda environment. The Python version used was 3.7.12, and the CUDA version was 11.7. The hardware setup consisted of a 12th Gen Intel® Core™ i9-12900H processor (2.50 GHz), with 16 GB of internal storage, and an NVIDIA GeForce RTX 3060 graphics card. The initial learning rate was set to 0.01, with a total of 120 epochs, the first three of which were warm-up epochs. The momentum factor was 0.937, and the batch size was set to −1 (automatically determined). Additionally, Origin 2021 was employed for data analysis and curve plotting.
2.9. Model Evaluation Indicators
The mAP was chosen as the detection and segmentation accuracies evaluation index. The higher the mAP value, the better the detection and segmentation effect of the model. The IoU was set with different thresholds to calculate the mAP values in the experiment. In this study, the mAP50-95, precision, and recall were selected as the evaluation indices of the model. Among them, mAP50-95 denotes the mean value of mAP for all IoU values in the interval from 0.5 to 0.95, with an increment of 0.05, and mAP50 denotes the mAP when the IoU is 0.5. In addition, the filling and adjustment error were set to further verify the algorithm’s feasibility; where S represents the area of pixels within the ground truth boundary, represents the area of optimized mask pixels, represents the width of the grasped width after the pixel coordinate conversion, and L represents the width after its successful manual adjustment.
3. Results
3.1. Results of Payload on Enoki Mushrooms
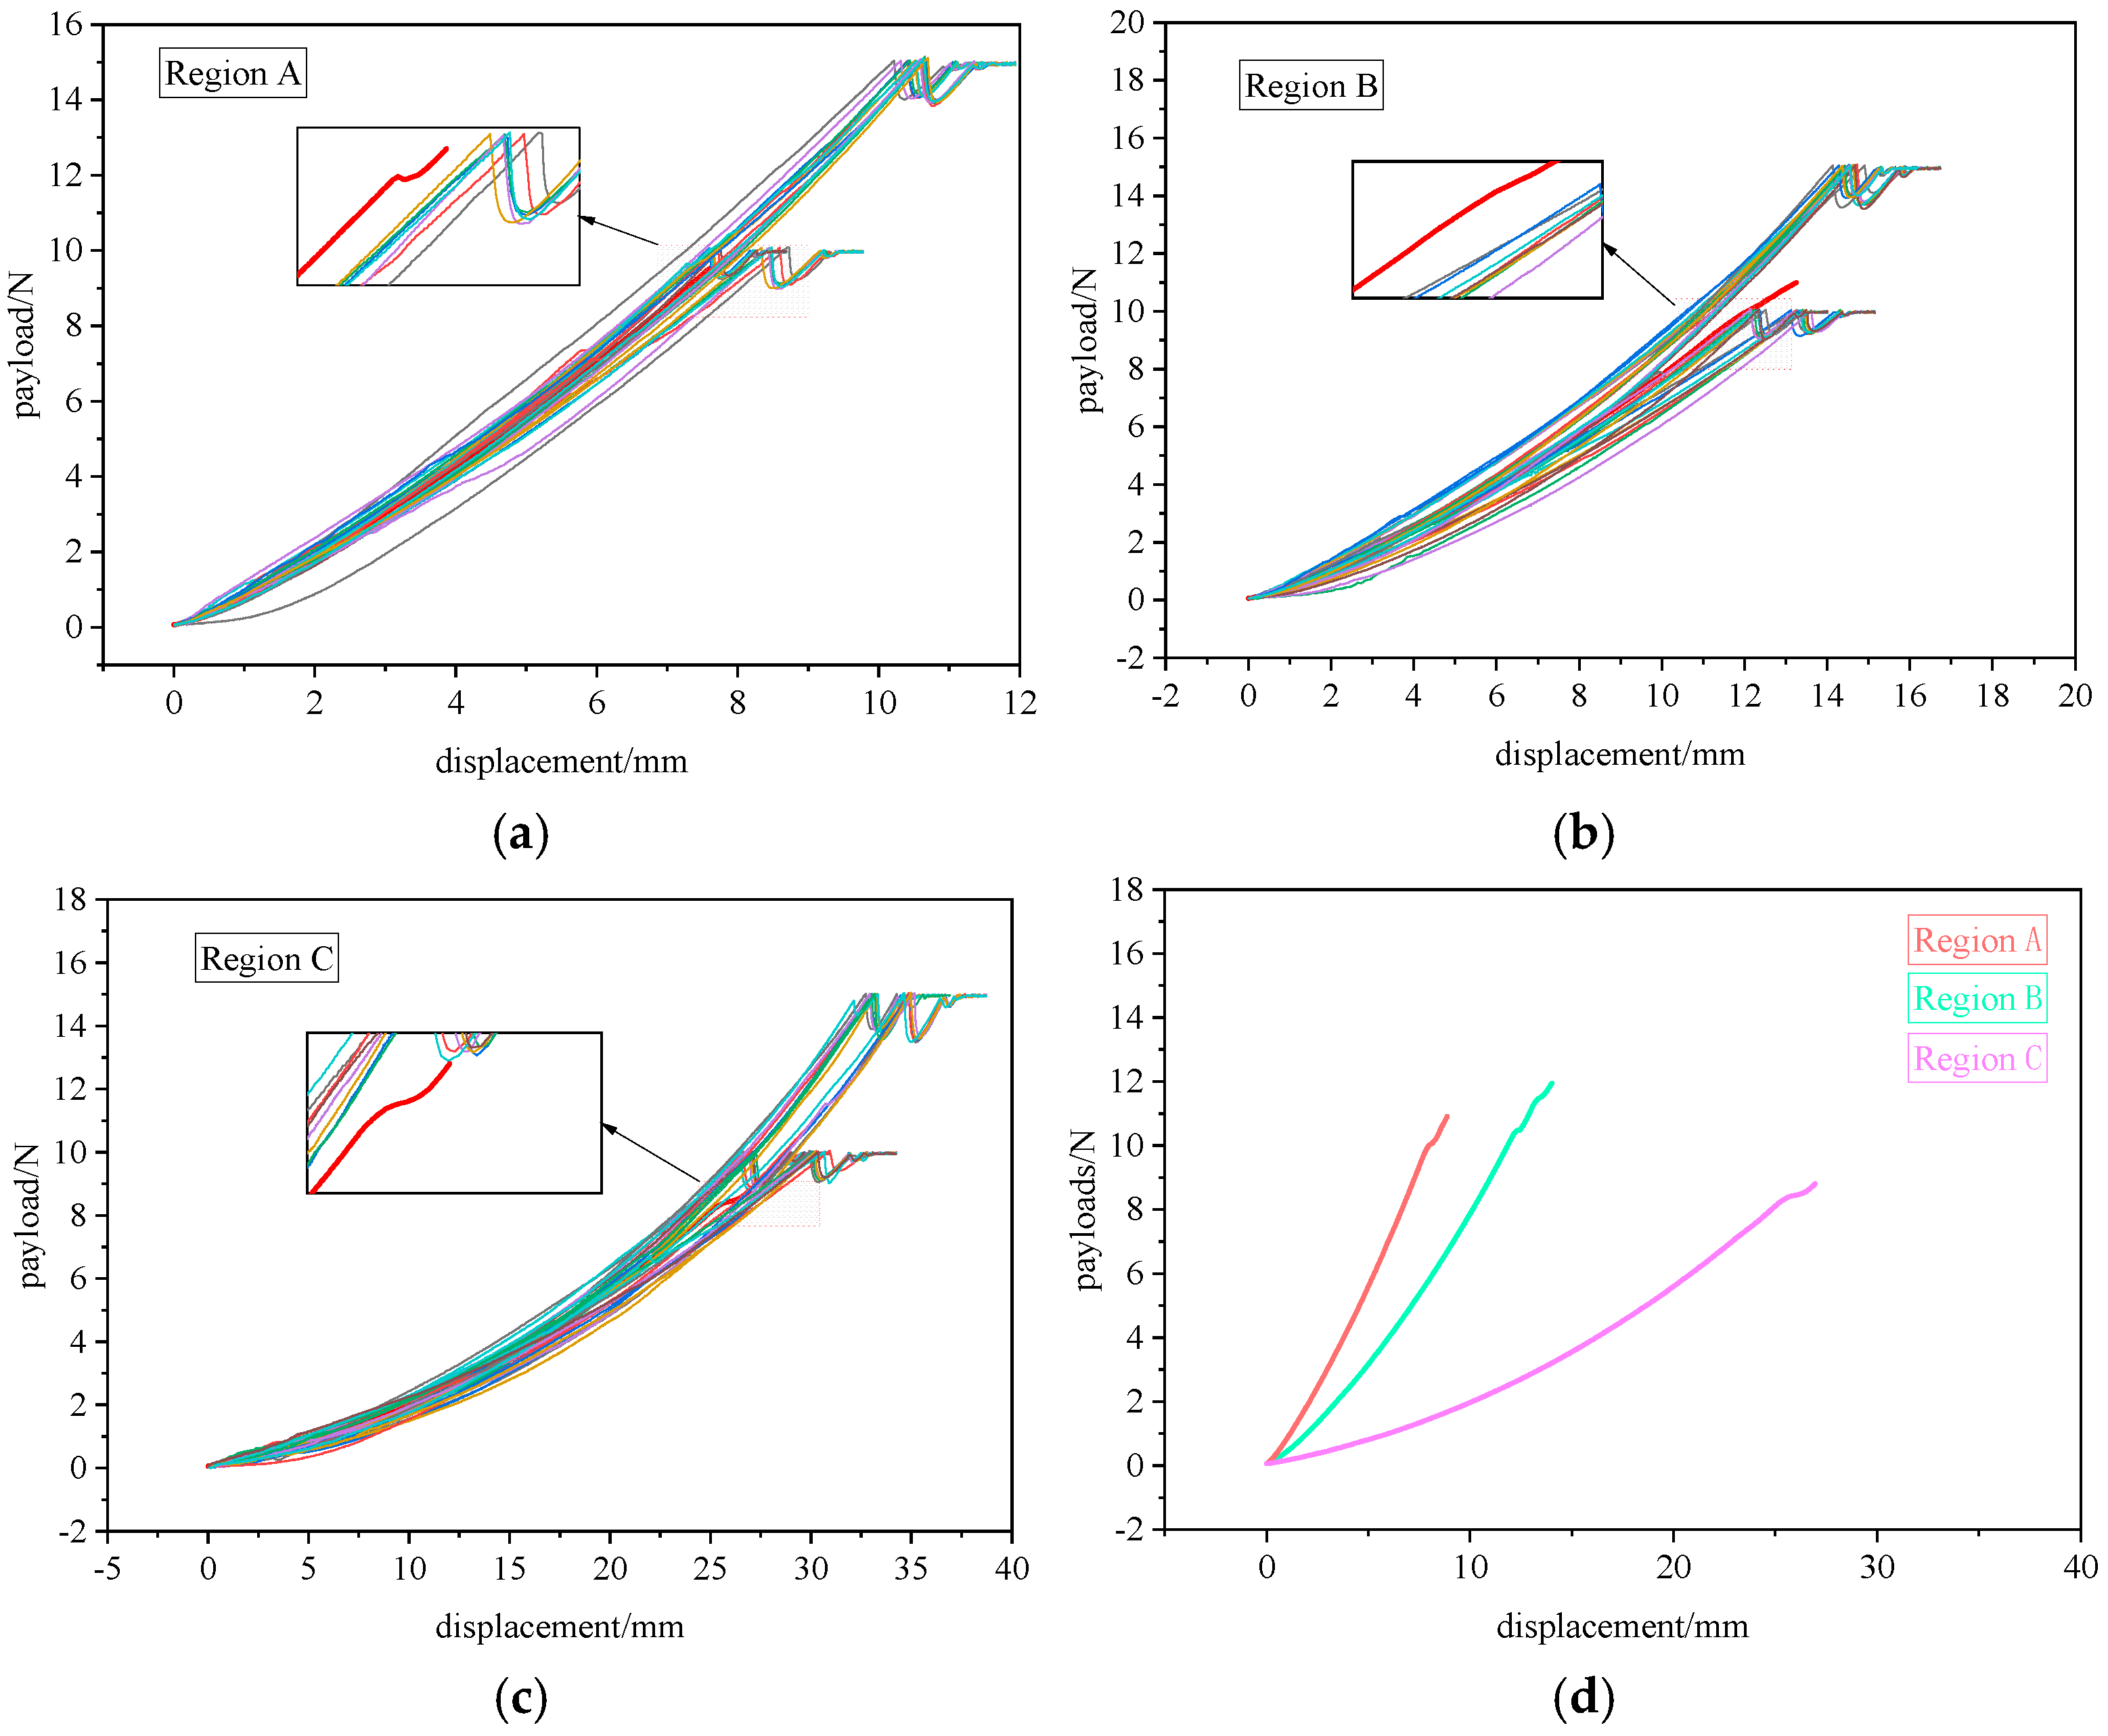
In this study, three regions labeled “Region A”, “Region B”, and “Region C” on 101 enoki mushrooms were subjected to compression tests under four combinations of applied loads and downward compression speeds: 15 N at 1 mm/s, 10 N at 1 mm/s, 15 N at 1.5 mm/s, and 10 N at 1.5 mm/s. The results of the compression experiments are shown in Figure 13.
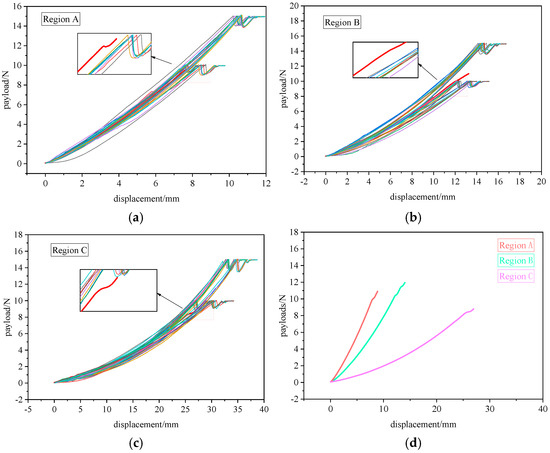
Figure 13.
Compression experimental curves of three regions of bottle-planted enoki mushrooms. (a) Force curves of Region A under different compression conditions. (b) Force curves of Region B under different compression conditions. (c) Force curves of Region C under different compression conditions. (d) Fitting of multiple load-displacement curves in three regions.
Figure 13 illustrates the compression performances of the three regions under different external conditions. Figure 13d shows the fitting results of the load–displacement curves for each region. When an 8 N load was applied, the deformation of Region A was only 5.17 mm, which was significantly smaller than the deformations of regions B and C, measuring 7.56 and 20.21 mm, respectively; this indicates that Region A had the best stiffness and can effectively resist deformation during the gripping process. Therefore, Region A, located approximately 20 mm above the bottle opening, was selected as the ROI for this study.
3.2. Model Training Details
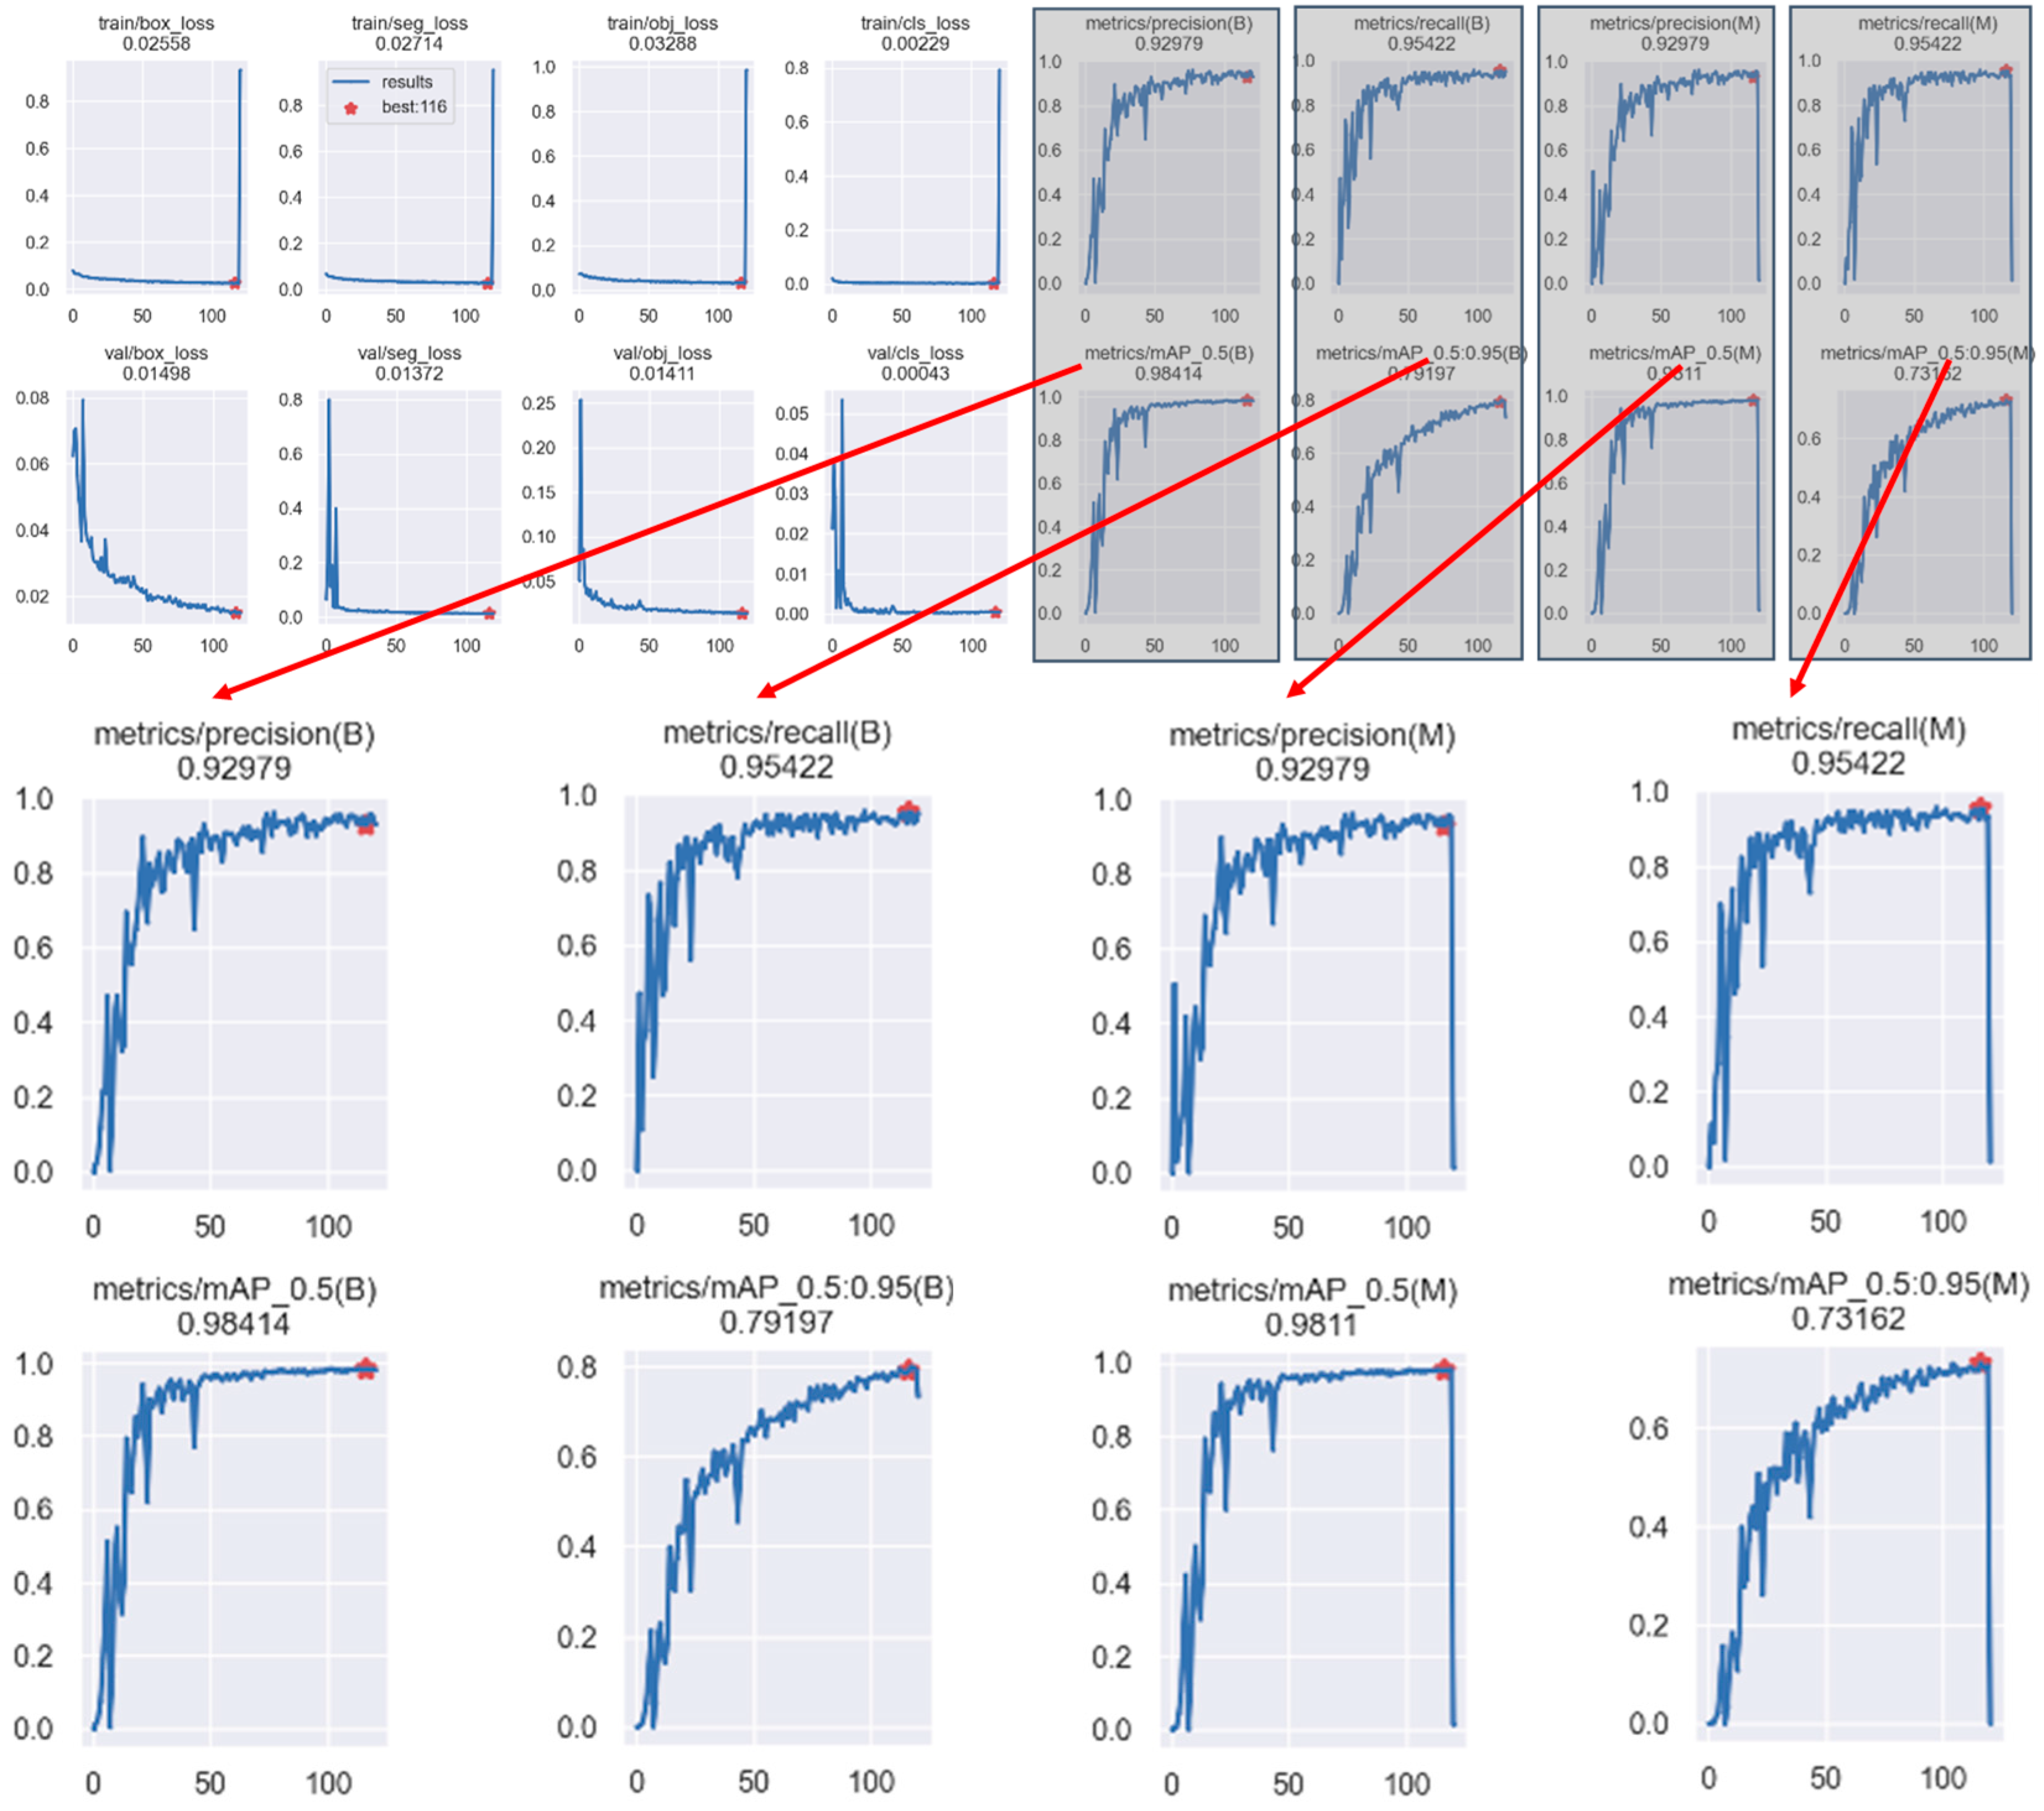
Figure 14 shows the combined results of MPG-YOLOv8. The prediction loss of the prediction box in this stage was 0.02558, and the prediction loss of the mask was 0.02714; the prediction loss of the prediction box in the validation stage was 0.01498, and the prediction loss of the mask was 0.01372, both of which were lower than the training loss, indicating that the model had a better fitting state and excellent performance during the training process.
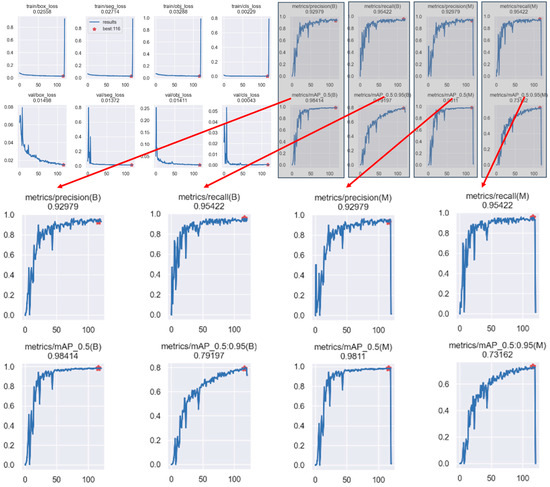
Figure 14.
Training/validation loss curve.
3.3. Results of Ablation Analysis
This study used StarNet, SPPECAN, and C2fDStar to achieve a lightweight model and optimize performance. To investigate the effect of each method on the model performance, ablation experiments are designed as presented in Table 1, where A denotes “enoki” and B denotes “pick region”.

Table 1.
Results of ablation experiments (mask).
Table 1 reveals that the methods proposed in this study, StarNet, SPPECAN, and C2fDStar, effectively satisfied the requirements for lightweight and accurate models.
- (1)
- StarNet: By comparing YOLOv8 and YOLOv8 + StarNet, it was found that the mAP50-95 of A and B masks were improved from 0.713 and 0.711 to 0.717 and 0.715, respectively, which improved the prediction ability of the model significantly. Regarding lightweighting, the model size was reduced from the original 7.6 to 6.1 M, the number of parameters was reduced from close to 3.2 to close to 2.8 M, and the number of network layers was also reduced to 173. Although the floating-point operation volume increased, the overall goal of lightweighting was achieved, confirming that StarNet has a lightweighting advantage over the original backbone network.
- (2)
- SPPECAN: When comparing YOLOv8 + StarNet + SPPECAN and YOLOv8 + StarNet, it was found that SPPECAN could effectively improve model performance compared with SPPELAN. After replacing SPPELAN with SPPECAN, the mAP50-95 for the A and B masks was improved from 0.717 and 0.715 to 0.734 and 0.724, respectively, and the model size was reduced by 0.5 M. The number of covariates was also reduced by approximately 0.2 M. When comparing YOLOv8 + StarNet + SPPELAN and YOLOv8 + StarNet + SPECAN, it was found that the mAP50-95 for the A and B masks was improved from 0.721 and 0.717 to 0.734 and 0.724, respectively, and the model size was reduced by 0.2 M. However, SPPECAN uses the two-branch feature idea; the left-branch feature was added to the right-branch before the convolution. Thus, the expected loss did not occur in the features. Similarly, an effective reduction in the number of parameters involved in the operation can be achieved by reducing the number of channels by half.
- (3)
- C2fDStar: By comparing YOLOv8 + StarNet + C2fDStar and YOLOv8 + StarNet, it was found that C2fDStar can be used to effectively reduce the model size and number of parameters without affecting the model performance. Similarly, a comparison of YOLOv8 + StarNet + C2fDStar + SPPECAN and YOLOv8 + StarNet + SPPECAN showed the advantage of C2fDStar in achieving model gain and lightweighting simultaneously.
- (4)
- Commonality: By adding three modules—StarNet, SPPECAN, and C2fDStar—to both YOLOv5 and YOLOv9, it was observed that the parameter count of YOLOv9 with StarNet, C2fDStar, and SPPECAN decreased significantly from 57,991,744 to 12,971,324. At the same time, the model size was reduced from 579 MB to 33.4 MB. Similarly, YOLOv5 with the same modules saw its parameter count drop from 7,621,277 to 1,741,257, shrinking the model size from 6.7 MB to 1.7 MB. These results demonstrate that the three proposed methods effectively reduce other models’ parameter count and model size while improving detection performance, thereby confirming the approach’s effectiveness.
3.4. Comparative Performance Analysis Against Alternative Models
To demonstrate the advantages of MPG-YOLOv8 in enoki mushroom detection, we conducted a side-by-side comparison of multiple models, as presented in Table 2. The results reveal that although MPG-YOLOv8 had 13.1 giga floating-point operations per second (GFLOPs) for floating-point operations, representing a 47.2% increase compared with YOLOv8 and a 67.4% increase compared with YOLOv5, its parameter count was only 1.7 M. This was 34.6 and 46.9% lower than those of the lighter models, YOLOv5 and YOLOv8, respectively. Furthermore, MPG-YOLOv8 was used to achieve mAP50-95 scores of 0.739 and 0.743 for masks A and B, respectively, surpassing the corresponding values for YOLOv5 and YOLOv8. Compared with larger models such as YOLOv7, Swin Transformer, and TPH-YOLOv5, MPG-YOLOv8 shows a significant advantage regarding lightness despite having slightly lower mAP50-95 scores. The comprehensive analysis reveals the strengths of MPG-YOLOv8 in lightweight design and accuracy, making it well-suited for real-time detection and control tasks.
Table 2.
Results of comparison experiments (mask).
3.5. Results of Multi-Scale Sub-Model Ensemble
The characterization of the action was based on WBF, and the results of the prediction boxes were selected for comparative analysis. Five representative image sizes were set, using resolution reconstruction techniques, for easy calculation: 576 × 576, 640 × 640, 768 × 768, 896 × 896, and 1024 × 1024. With this, five models were trained to obtain the features of the same semantic information image at different image scales, and multiple models’ outputs were ensembled with the WBF method to analyze the prediction boxes of the two A and B categories with the composite “all” as a point for analysis; the results are presented in Table 3.
Table 3.
Results of ensemble experiments (box).
The validation results indicate that the ensembled model had the best overall performance. As the default processing size increased, the sub-model size also increased, affecting accuracy and training duration. Model B achieved the best validation results among the models, with a training time of 7.73 h. However, Model C showed a decreased training time and accuracy, suggesting excessive feature information might be lost during feature extraction at this size. These findings highlight the effect of image size on feature extraction and utilization efficiency.
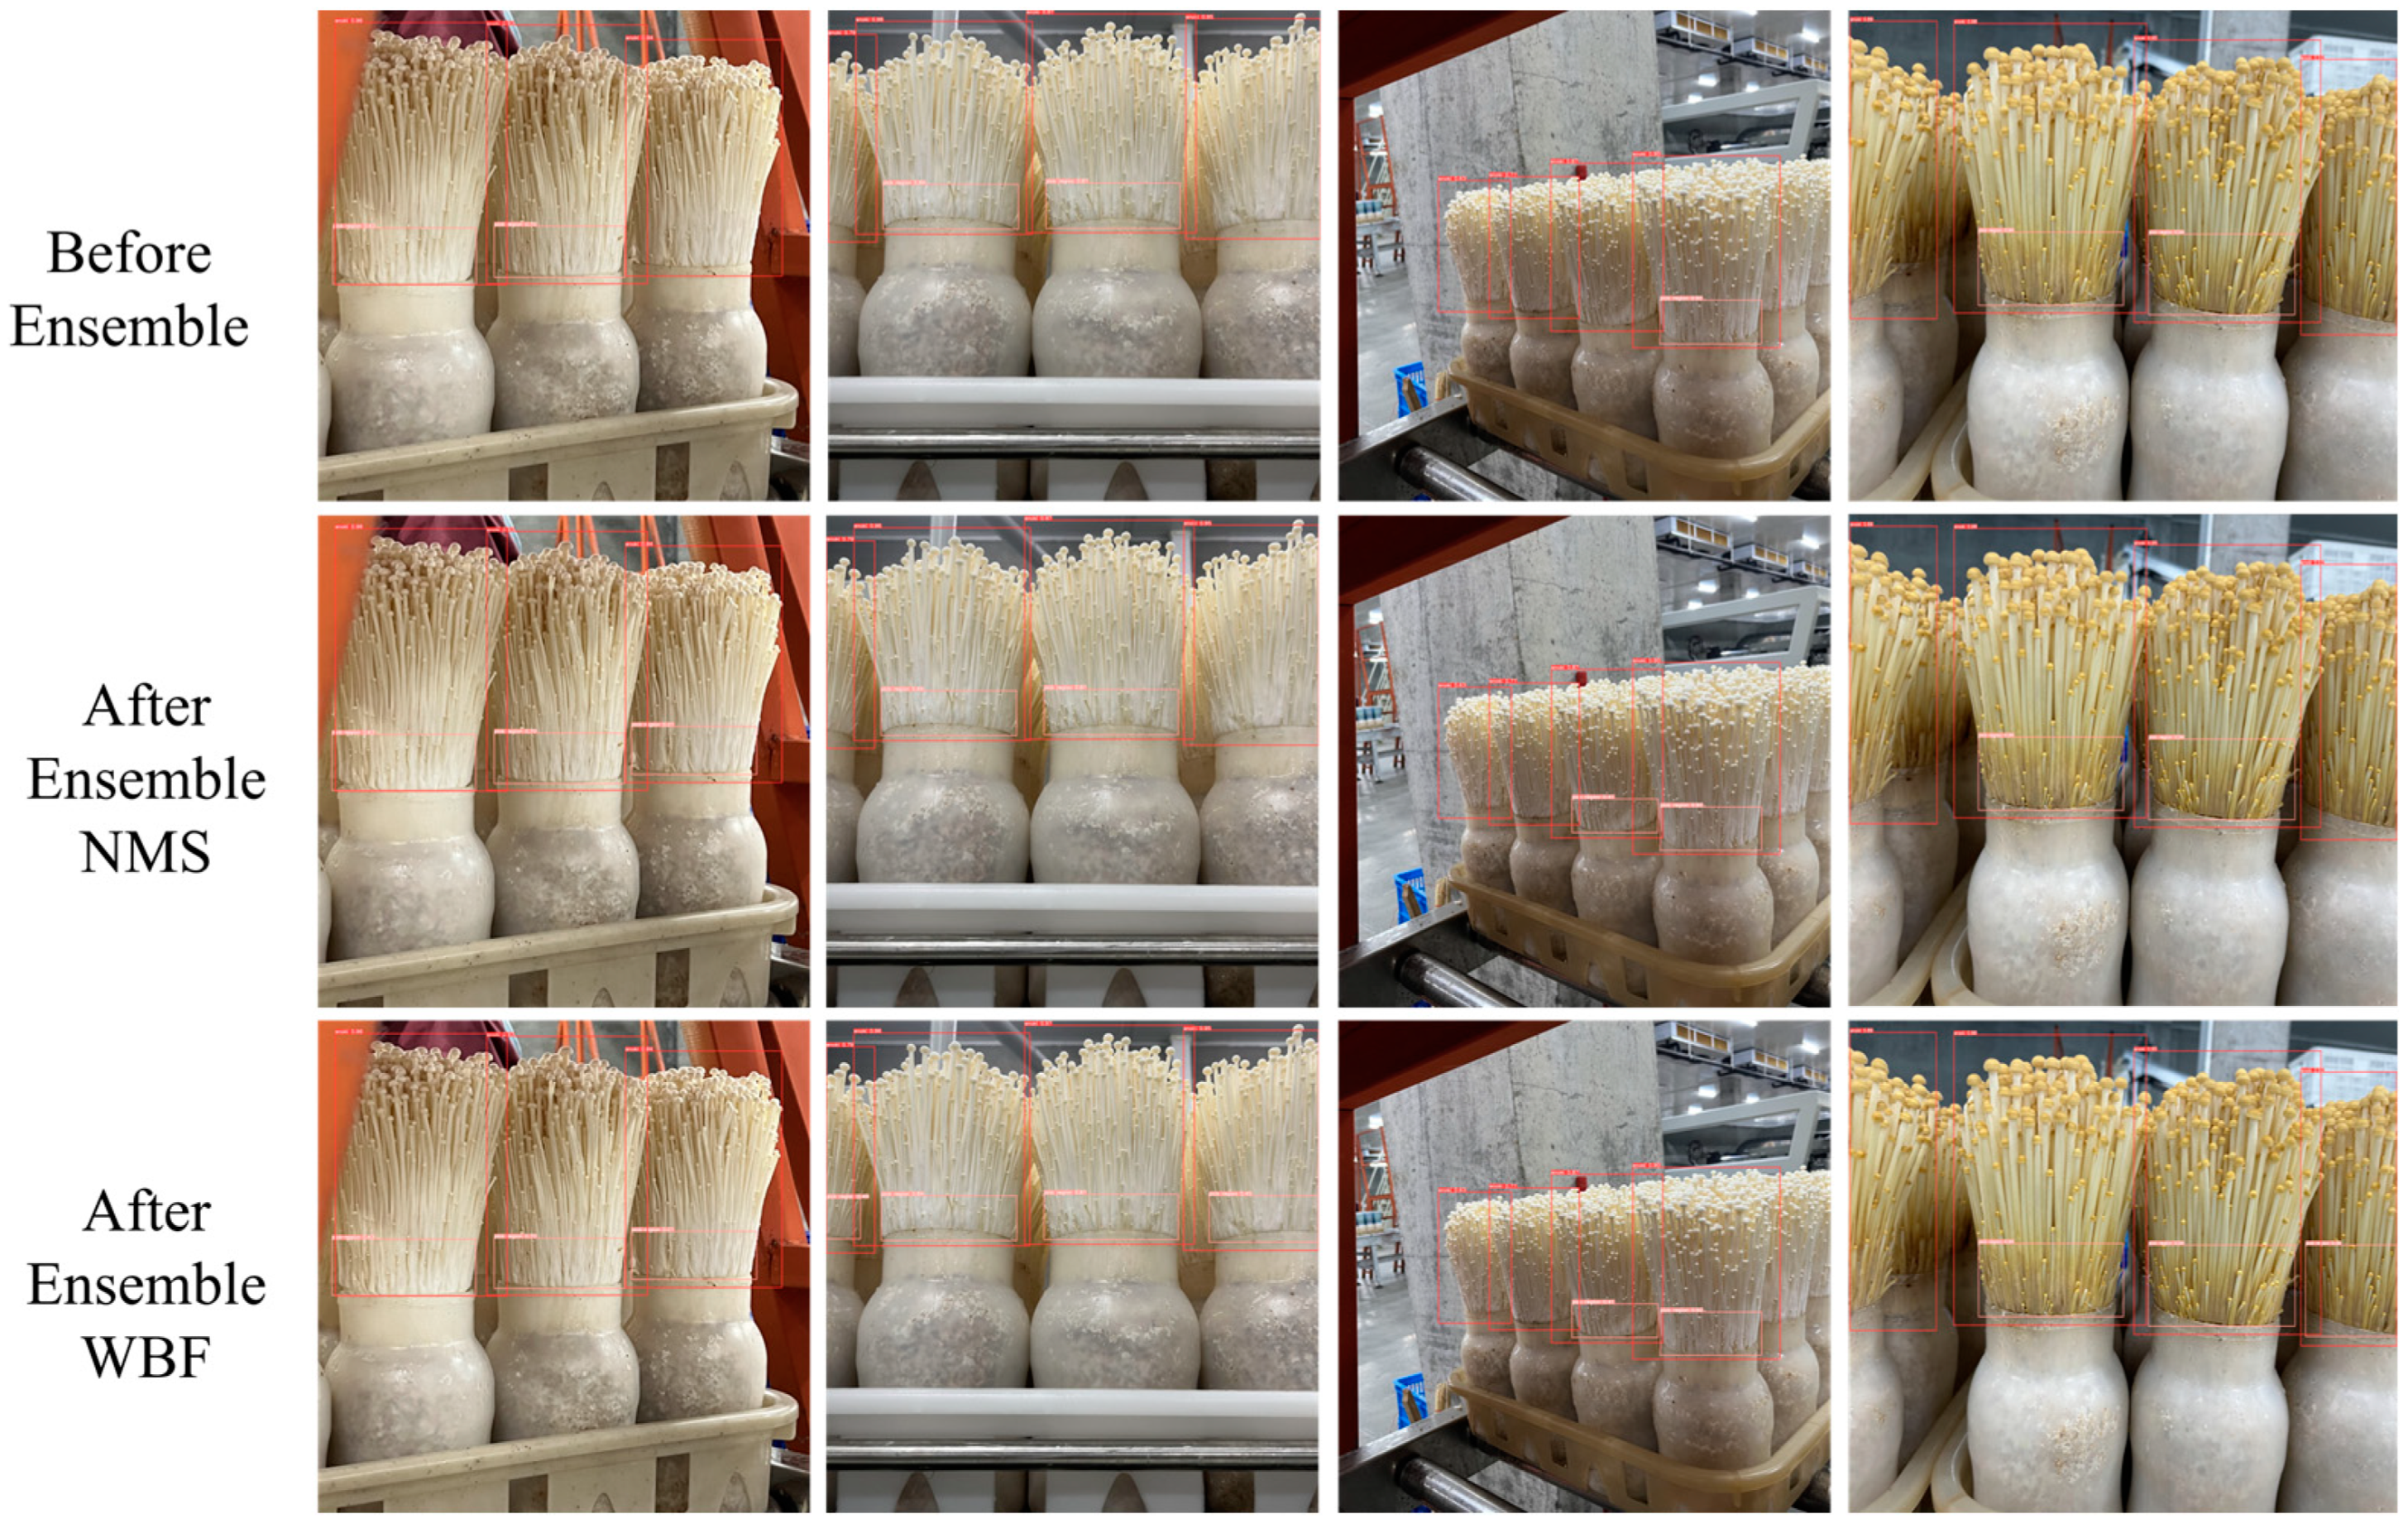
A comparison of two model ensemble methods, NMS and WBF, reveals that both significantly improve the recall rate of detection boxes compared to models without ensemble (shown in Figure 15). Notably, WBF further enhances the model’s sensitivity to targets, leading to more accurate and robust predictions than NMS; this suggests that the model ensemble approach effectively mitigates the potential loss of feature information from adaptive image cropping, thereby improving the model’s reliability and overall performance. Although multi-model ensemble increases inference time and computational complexity, it provides a notable gain in accuracy, particularly when the application environment allows for such trade-offs.
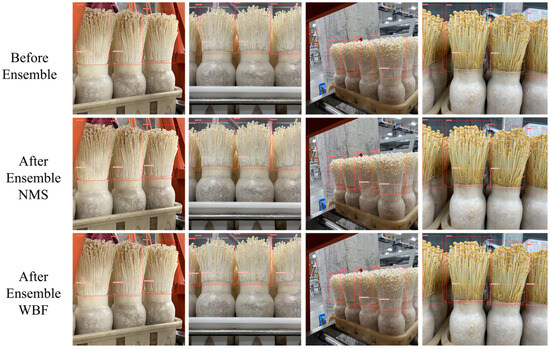
Figure 15.
Visualization of results before and after model ensemble.
3.6. Evaluations of Algorithm Effectiveness
3.6.1. Results Compared with Those Obtained Using the Traditional Method
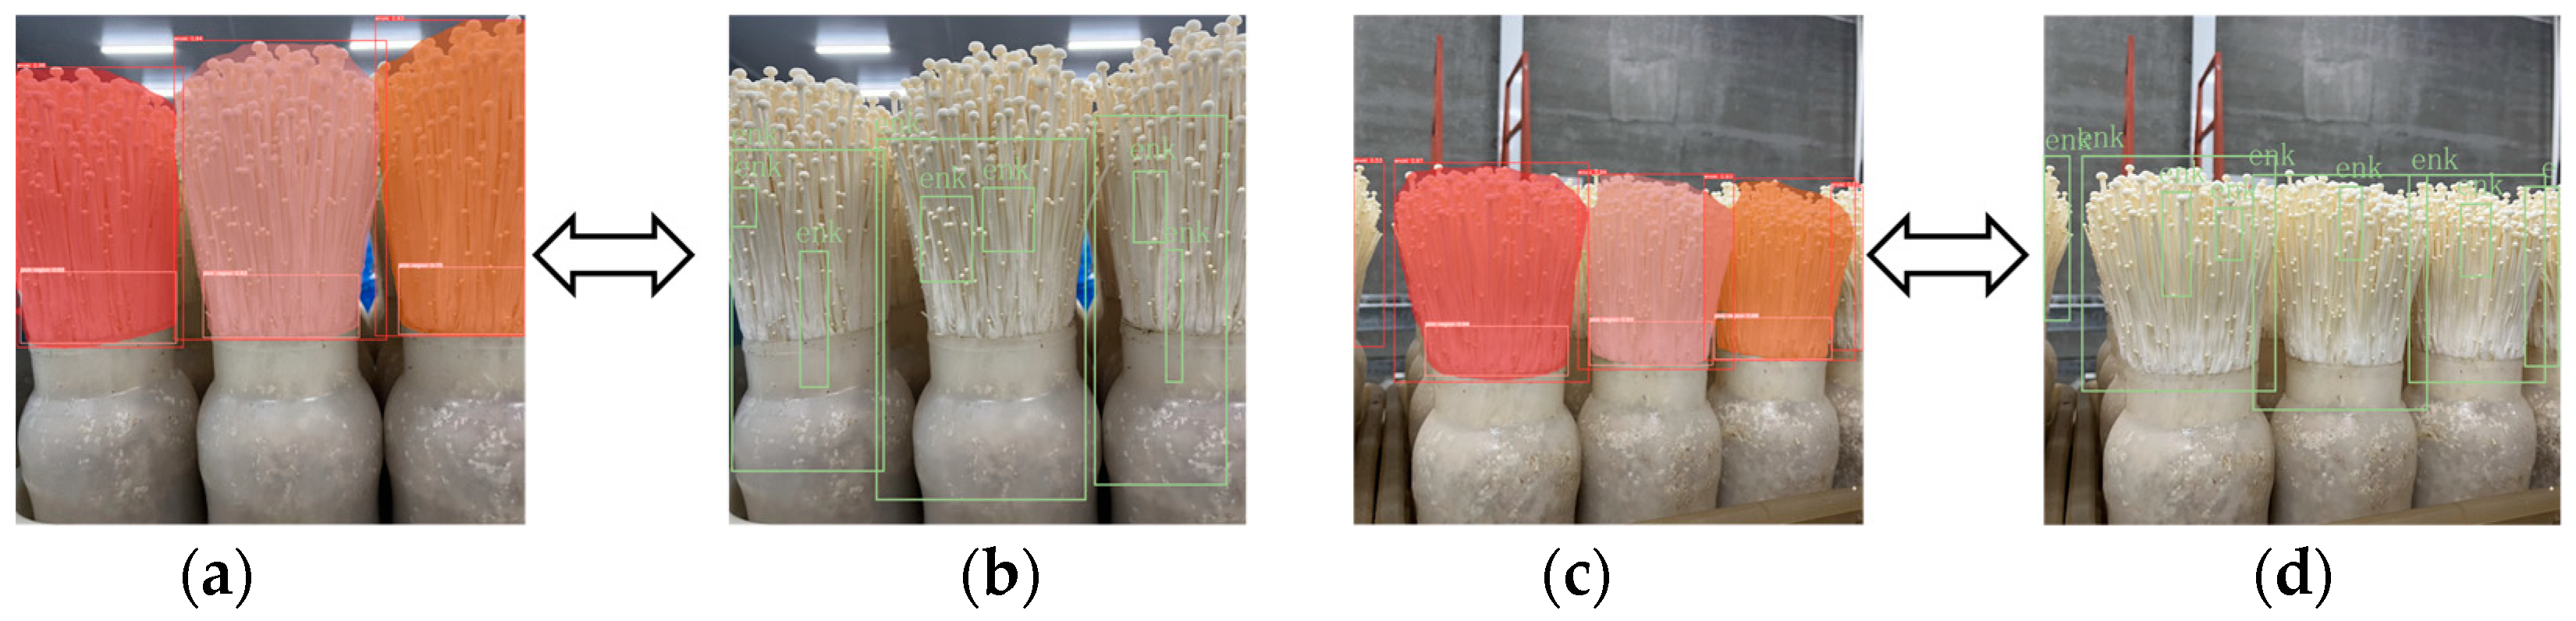
Given that enoki mushrooms’ current automatic root-cutting equipment does not include a vision system, the vision module that automatically sorts apricot mushrooms was used to compare the traditional detection algorithm with MPG-YOLOv8. We evaluated the advantages and disadvantages of each method regarding detection effect and speed.
The average detection time for video frames using the traditional method was 3.1 ms, while MPG-YOLOv8 took 10.3 ms. Figure 16 shows the real-time detection effects of both methods. The traditional method, which involved using OpenCV color thresholding-based processing, usually includes a bottle in the outer contour box because of the similar colors of the bottle and mushroom body. Additionally, gaps and edges in enoki mushrooms can cause unsatisfactory results when using the traditional method. Similarly, it is challenging to differentiate the grasping area and obtain appropriate grasping parameters based on the contour boundaries.

Figure 16.
Comparison of recognition performance between traditional algorithms and MPG-YOLOv8. (a) Results 1 (MPG-YOLO v8); (b) Results 1 (Conventional method); (c) Results 2 (MPG-YOLO v8); (d) Results 2 (Conventional method).
Therefore, despite its slightly higher detection speed, the traditional method cannot meet practical and effective demands. In contrast, MPG-YOLOv8, although slower, provided more accurate and reliable detection, making it better suited for practical applications.
3.6.2. Comparative Analysis Against Mask Quality
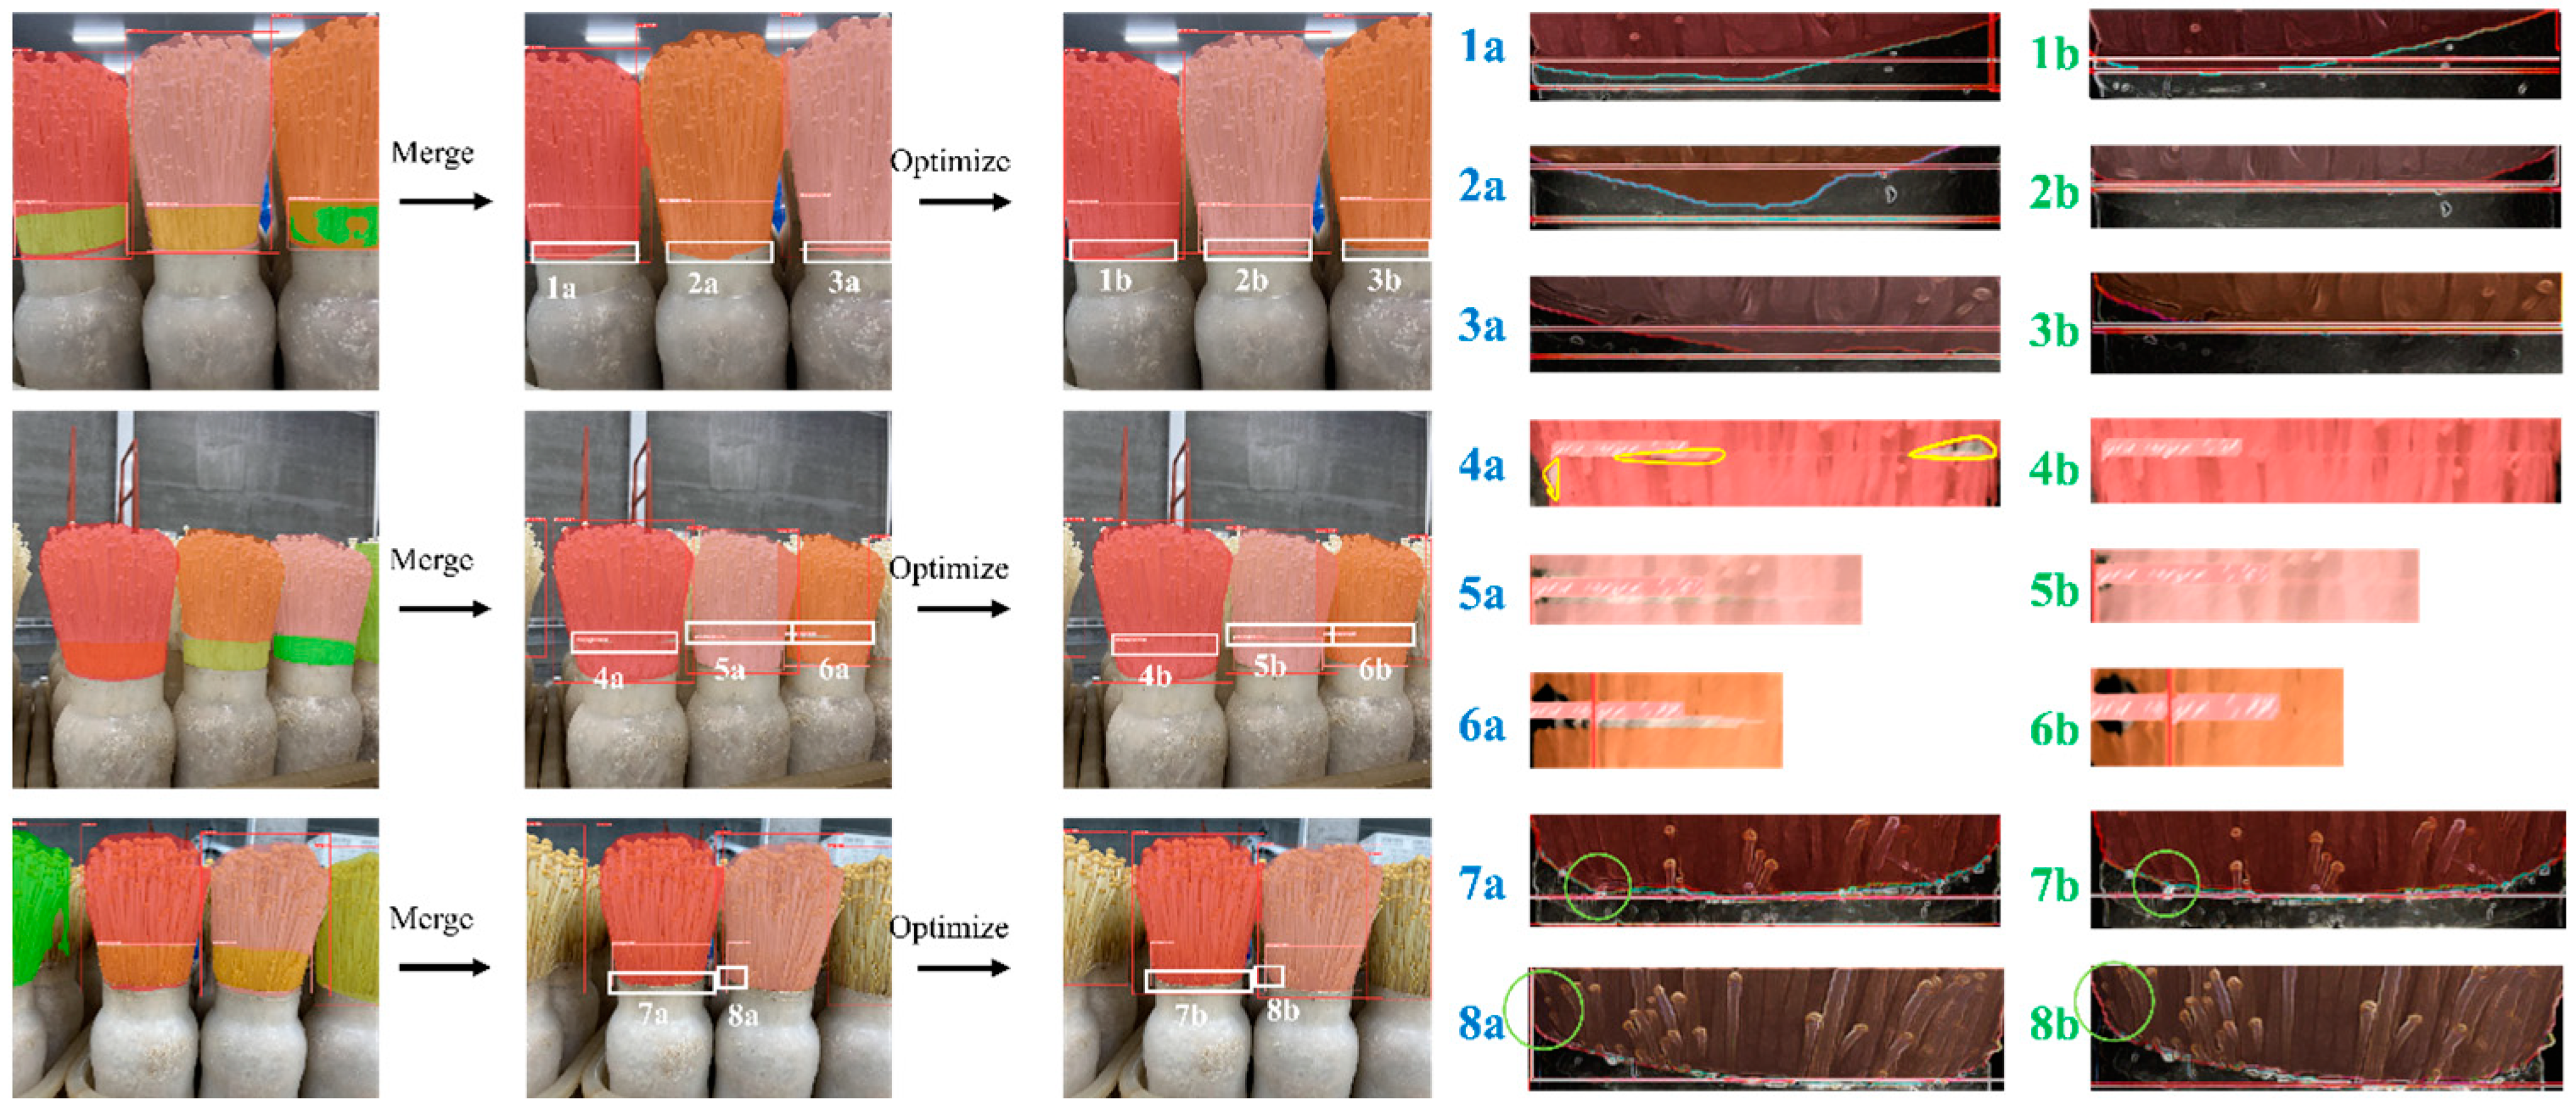
As shown in Figure 17, mask merging optimization can be used to effectively improve the fineness of the mask contour of the enoki mushrooms and ROI regions while simultaneously alleviating the problems of mask overflow boundaries and the prominence of internal gaps, which is beneficial to the optimization of the center-of-mass tuning computation to obtain a better region width and reduce the accumulation of errors.
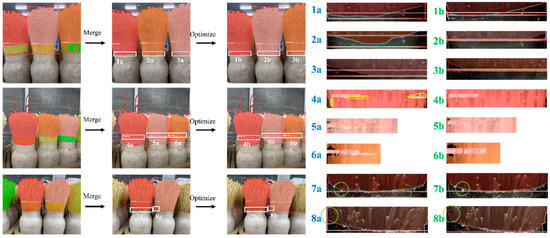
Figure 17.
Comparison of local mask optimization visualization. The circles and lines in the figure indicate the internal disconnection and boundary of the mask.
To represent the optimization effect of the mask quality more effectively, the manually drawn ROI area was used as the ground truth to calculate the IoU before and after optimizing the masks of the eight objects in Figure 17, and the threshold was set to 0.8. The mask optimization effect is good if it is larger than the threshold. The results are presented in Table 4; g1–g8 corresponds to the order of the figure from top to bottom and left to right, where Sall merged denotes the pixel area of the entire enoki mushroom mask after merging.
Table 4.
Results of mask IoU.
The presence of a mask overflow causes the center-of-mass position to be biased toward the overflow direction, and the presence of internal gaps destroys the internal connectivity of the mask, which affects the correctness of the center-of-mass position. The fill rate of the optimized mask was significantly improved, which can make the “divergence” boundary converge and extend the internal connectivity area. The pixel IoU between the optimized mask and ground truth were all larger than the threshold, which shows a good optimization effect. However, optimizing sample g5 mitigated the problem of large gaps, and there was a certain degree of accuracy challenge compared with the that in other samples. The pixel area difference between SM and S was significantly larger than that of the other samples, which may be caused by the low quality of the predicted mask in this sample.
3.6.3. Mapping and Control Reliability Verification
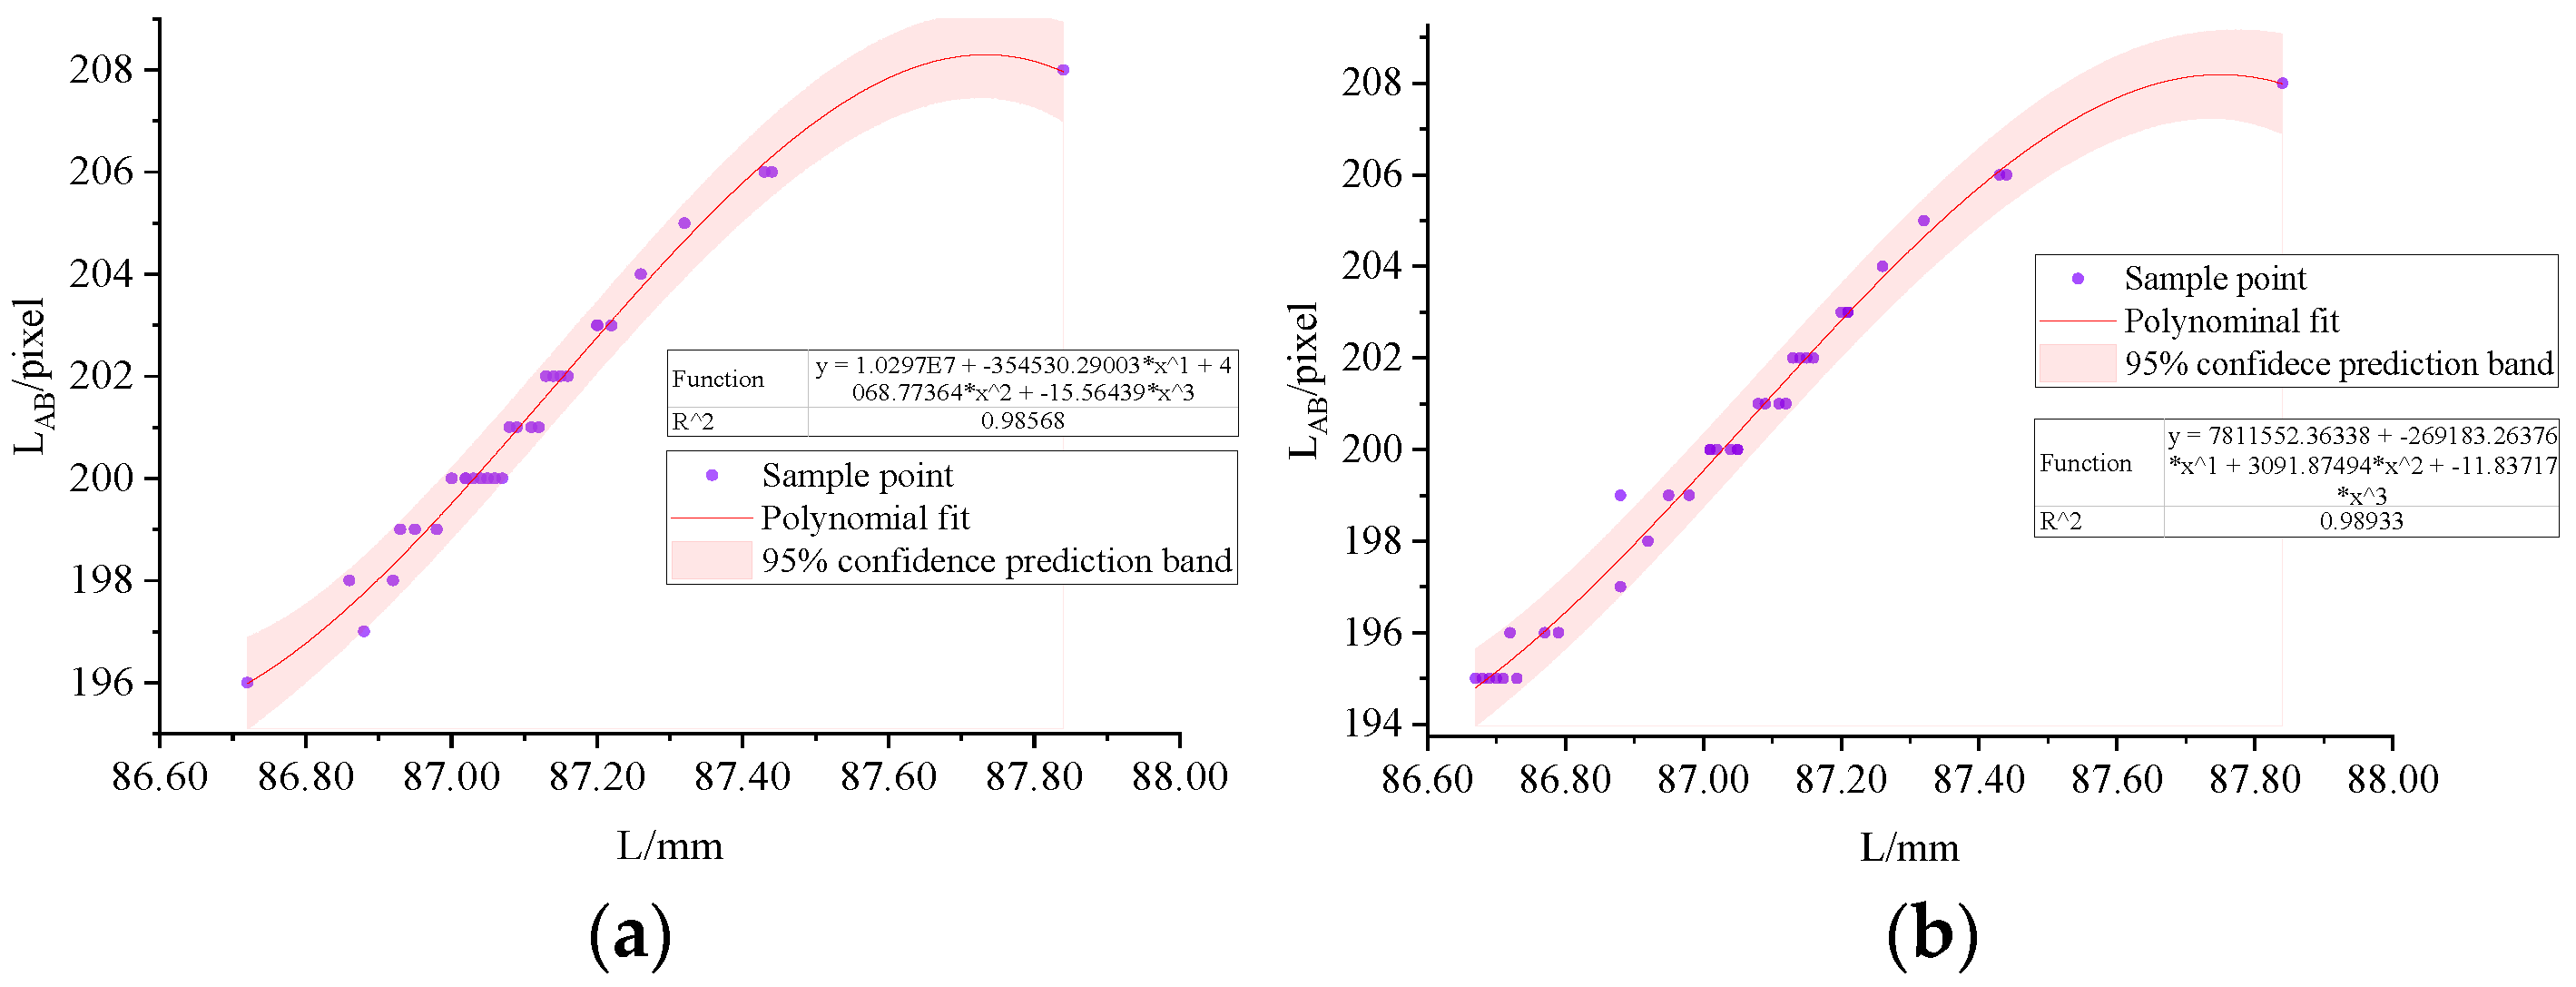
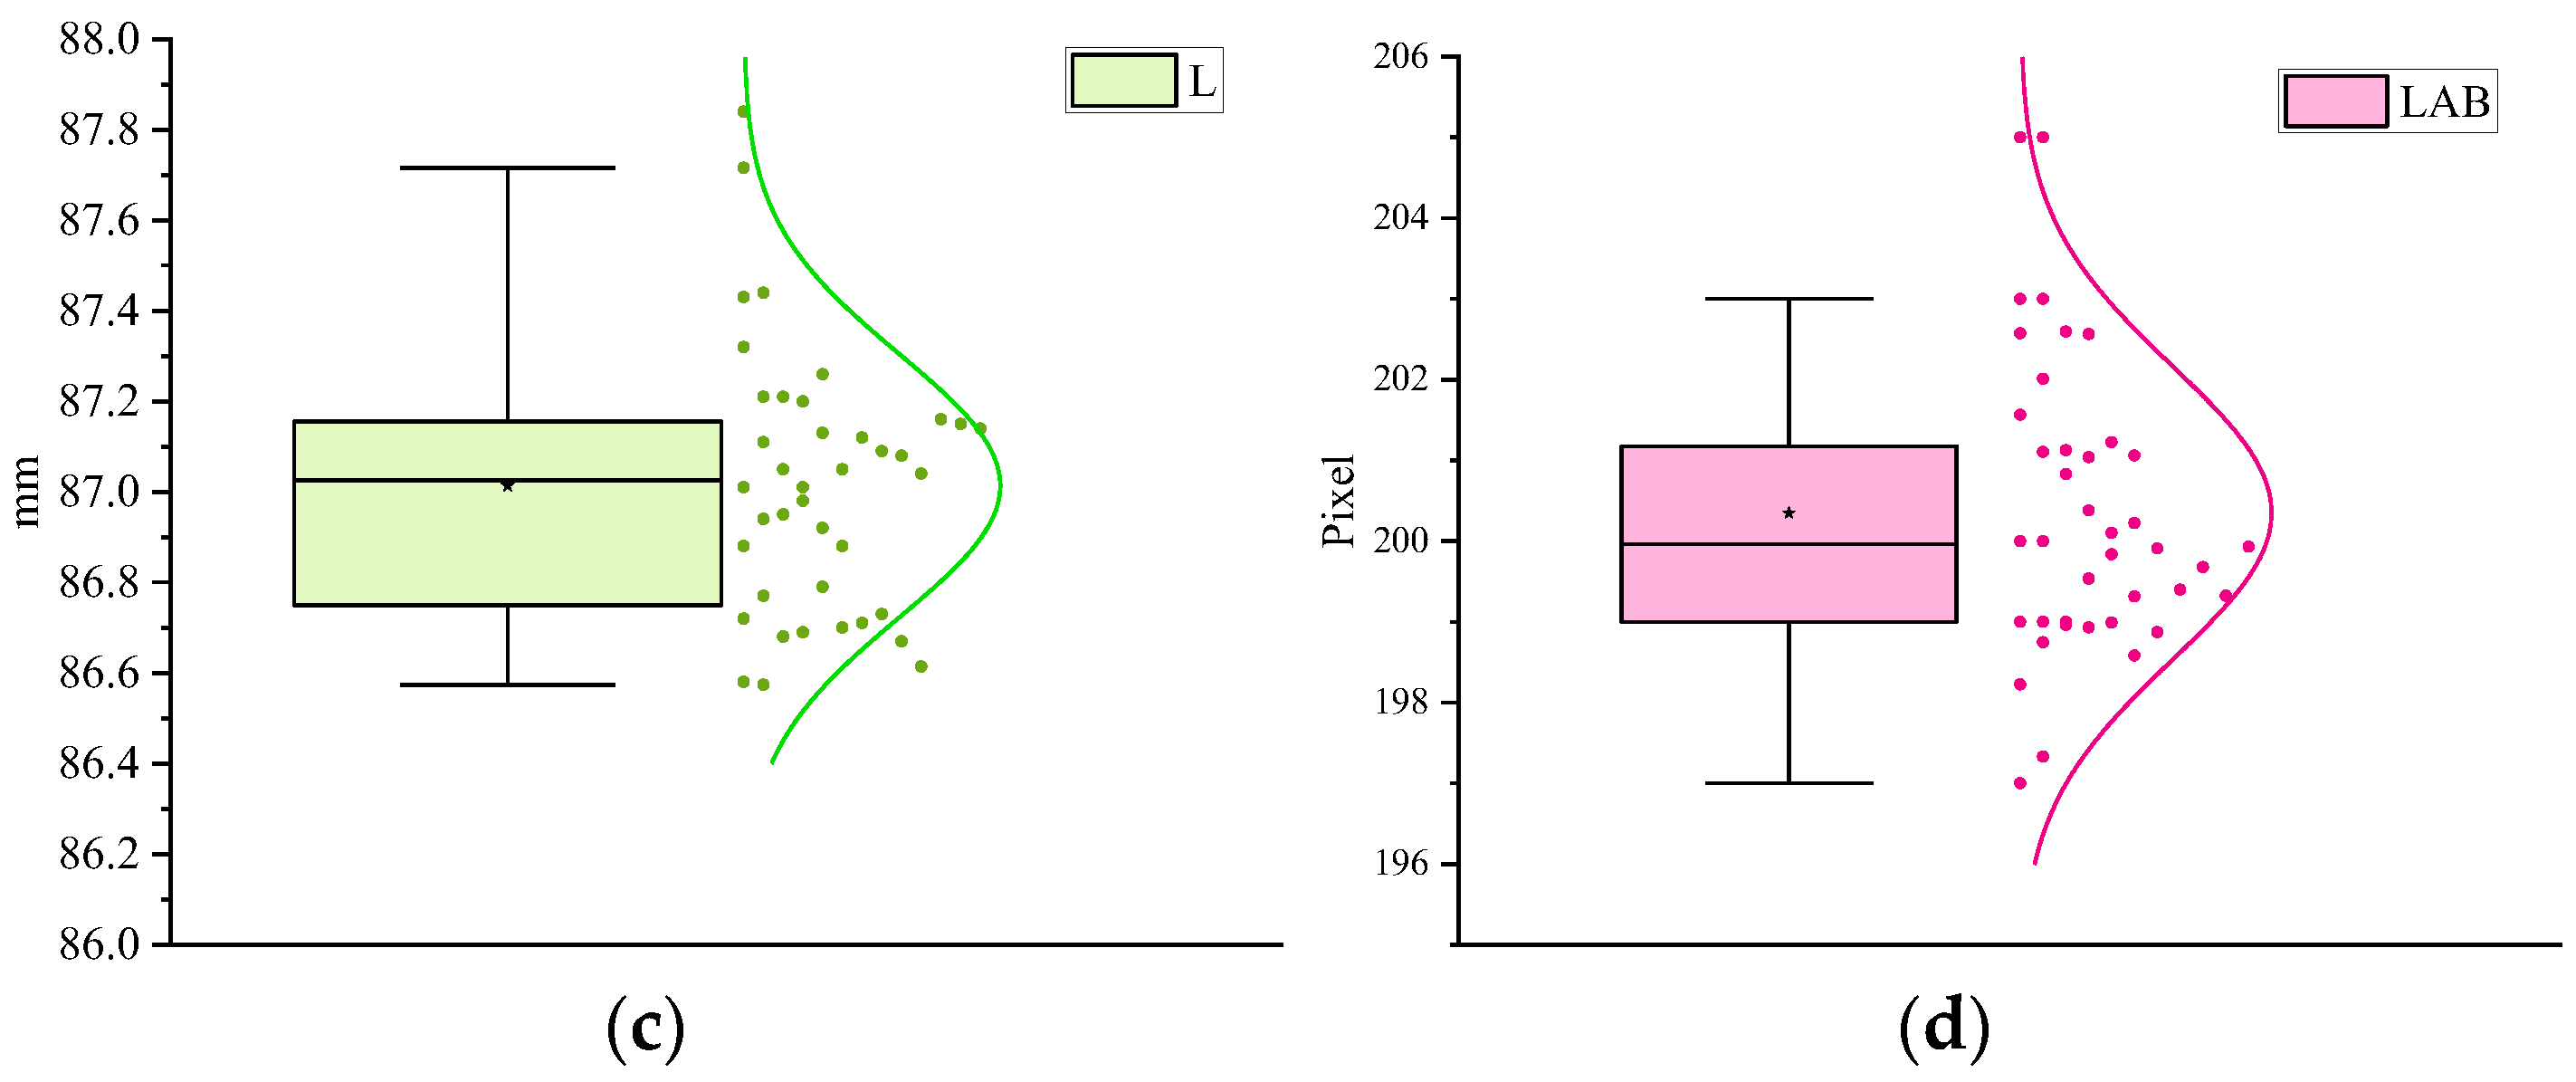
In the mapping relationship of “pixel width—pulse width—servo angle”, the “pixel width—pulse width” link is crucial as it determines the severity of error accumulation. The key to this link is in the accuracy of the “pixel width—actual width” conversion. To explore this, we selected 41 enoki mushrooms and divided them into experimental and validation groups in a ratio of 31:10. Parameter measurements and tests were conducted on 31 mushrooms in the experimental group. The results are shown in Figure 18. It reveals each sample’s LAB and L values, fitting curves, function names, and prediction bands corresponding to a 95% confidence level. Figure 18a shows that when the growth width of the grasping region was between 87 and 87.2 mm, the prediction band was narrower, indicating a higher prediction accuracy in this range. Conversely, experimental targets with growth parameters outside this range may exhibit a larger error range, possibly owing to insufficient data for such targets.
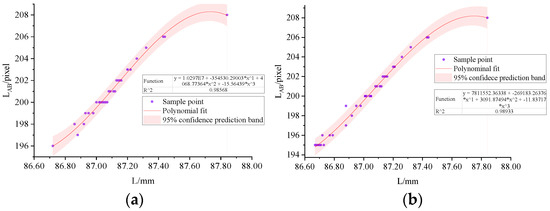
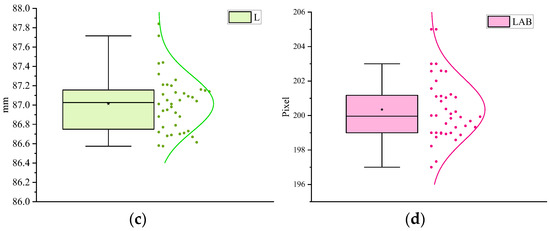
Figure 18.
Coordinate mapping experiment. (a) Fitting results before data enhancement; (b) Fitting results after data enhancement; (c) L data distribution; (d) LAB data distribution; The star represents the center point of the data.
To address this, we augmented the data for these targets by rotating, redetecting, and measuring them from different directions. After data augmentation, the prediction band for the L < 86.80 mm part converged significantly, and the R2 increased from 0.98568 to 0.98933 (Figure 18b); this indicates that the mapping data are valid and well-fitted, ensuring the reliability of the data after coordinate transformation. Figure 18c,d reveals the statistical analysis using a box line diagram, including the full mapping parameters in this study. There were only a few data outliers in the graph, among which the outliers in Figure 18c originated from the abnormal growth of individual enoki mushrooms; the distribution of outliers in Figure 18d is similar to that of Figure 18c, which confirms the reliability of the mapping of ‘pixel width—actual width’.
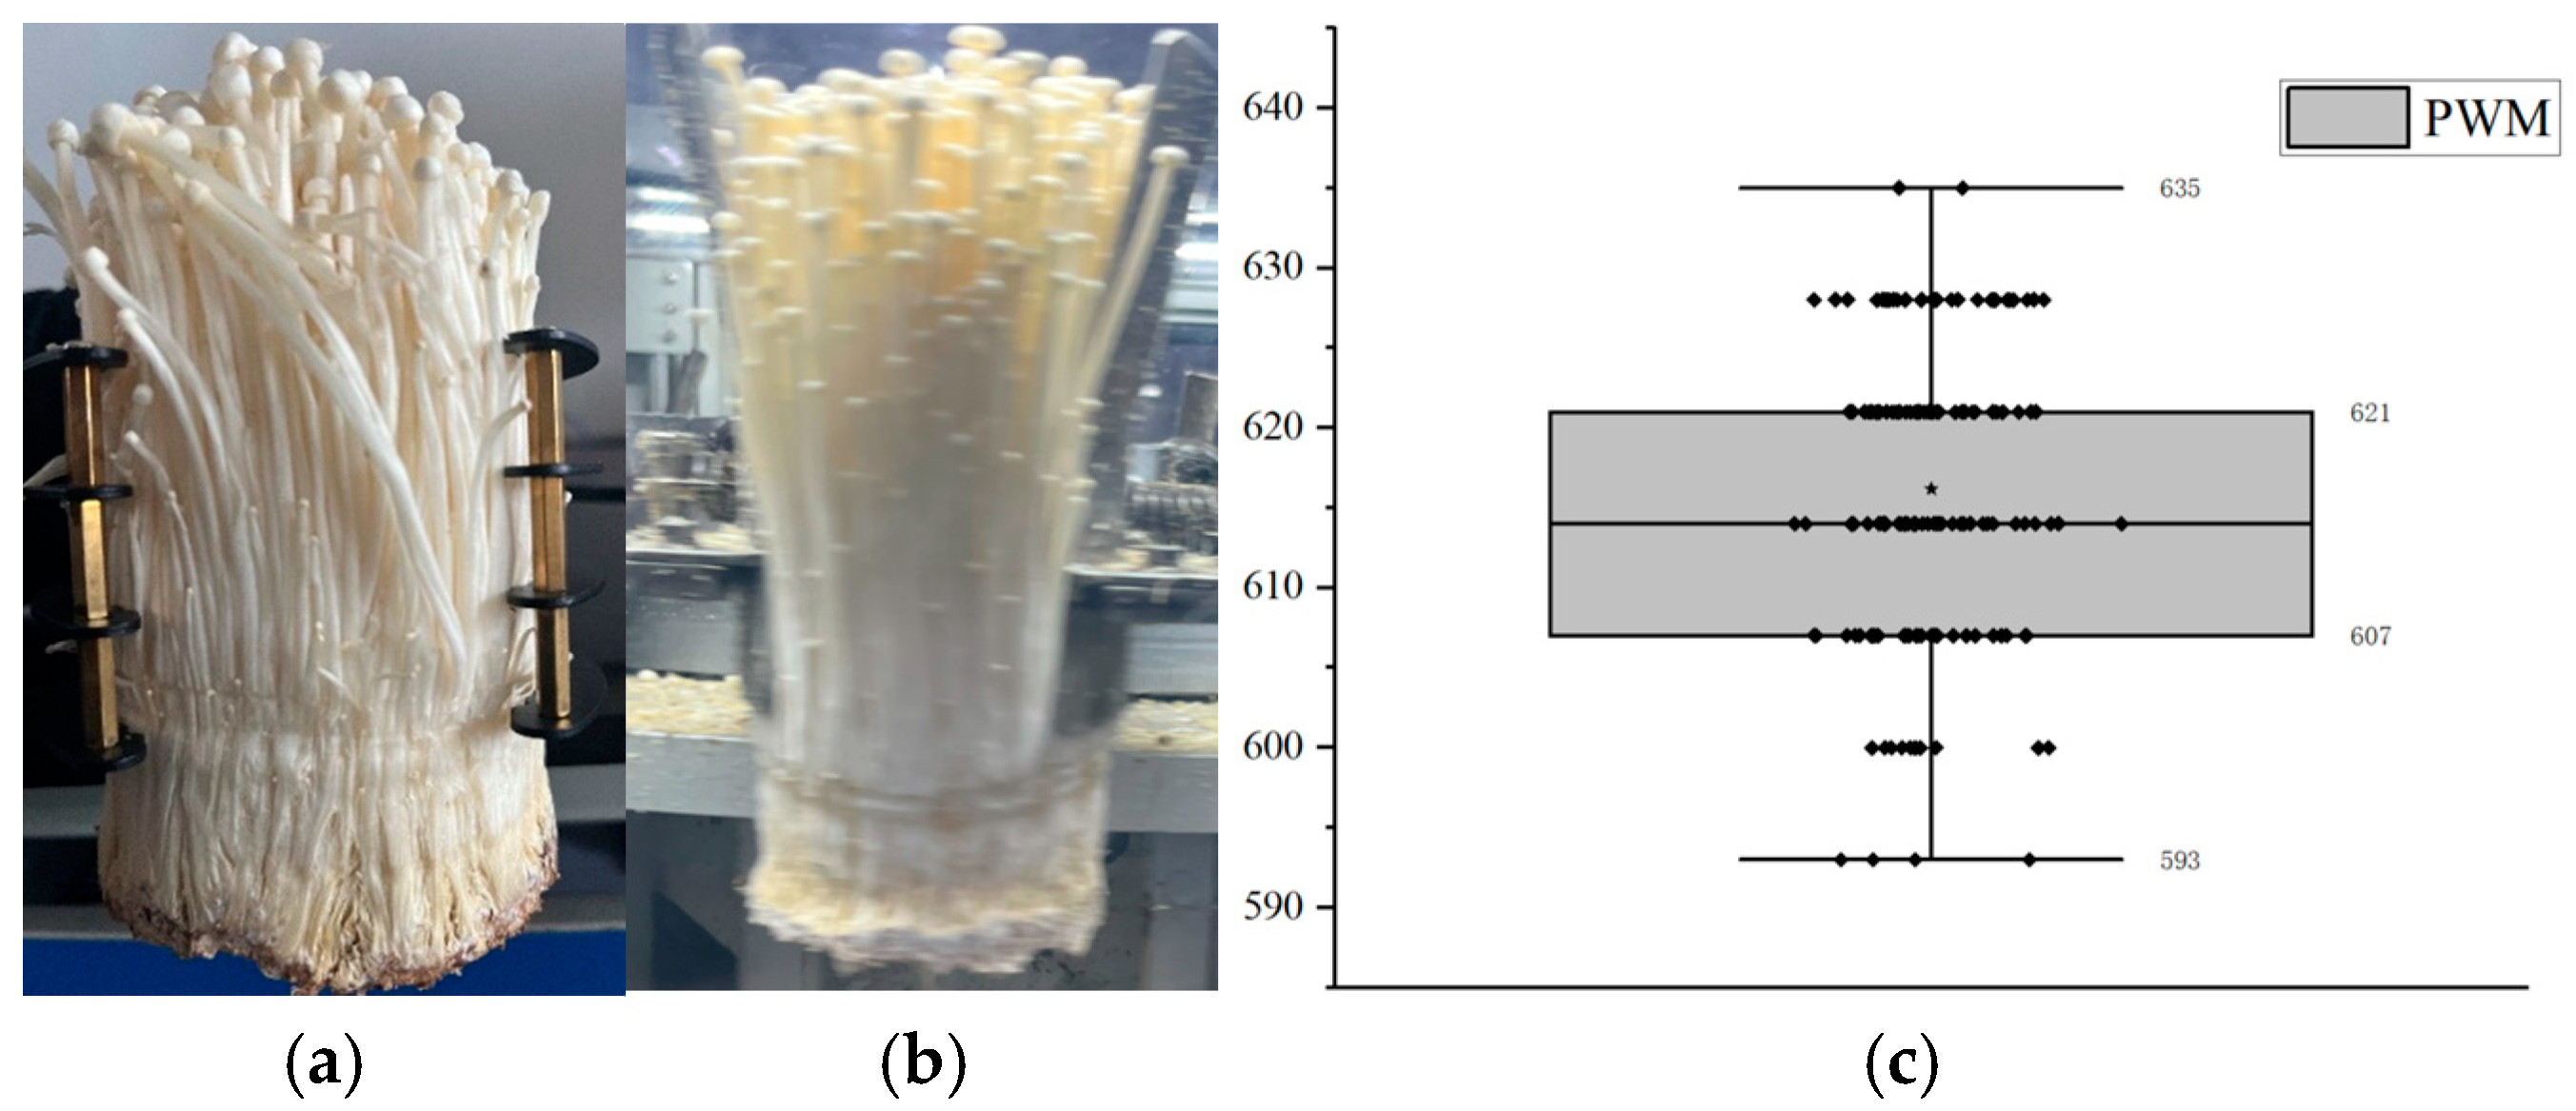
These data were tested using the PWM mapping model obtained from numerous previous tests. The results are shown in Figure 19c. The applicable pulse width range was 593–645 for the normal growth range of enoki mushrooms. In contrast, the differentiated pulse width control can be realized for abnormal growth individuals, confirming the feasibility of this study’s proposed mapping model.

Figure 19.
Grabbing validity experiment. (a) MPG grab. (b) Reality grab. (c) Mapping box plot of PWM.
Detection and grasping tests were conducted on 10 enoki mushrooms in the validation group. The results, presented in Table 5 and Figure 19, indicate that the average error (∆) between the width (L), measured using the high-precision depth camera, and the actual width () was only 0.14%. Additionally, enoki mushrooms were successfully grasped. Figure 19a illustrates the grasping method used in this study, and Figure 18b shows the method used at the production site. Figure 18b shows a significant deformation, whereas Figure 18a demonstrates stable grasping with minimal deformation, confirming the feasibility of the method used in this study.
Table 5.
Results of controlling experiments.
Finally, the device was integrated into the constructed experimental platform for test cutting. A total of 100 enoki mushrooms were tested for root cutting, with 96 successfully achieving effective and accurate differentiated control, resulting in a success rate of 96%. Among these 96 mushrooms, 94 met the quality requirements after root cutting, achieving a qualified cut surface rate of 98%. The results are shown in Figure 20. Surfaces 1 and 2 represent the root section detached after cutting and the cross-section of the finished enoki mushroom, respectively. The MPG surfaces were complete, with good flatness, and the angle between the cut surface and the horizontal plane did not exceed 5°. The results demonstrate that the method proposed in this study effectively alleviates the issue of ‘wavy’ cut surfaces, leading to significant improvements in product quality.
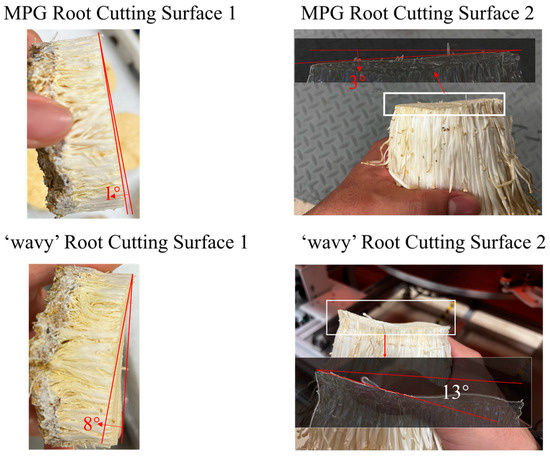
Figure 20.
Cutting plane contrast.
4. Discussion
To reduce the labor intensity of manual tasks, most current research on crop detection focuses on the classification or recognition of specific targets. For example, Li [7] proposed the Cotton-YOLO model for detecting foreign fibers in cotton seeds, Genno [6] introduced a detection model for apple counting and growth status classification, Wang [15] developed a model for classifying the dryness of shiitake mushrooms, and Charisis [19] presented a segmentation model for oyster mushrooms. In contrast, this study not only emphasizes model efficiency and accuracy but also addresses critical detection quality challenges, such as mask boundary overflow and internal disconnections. Unlike previous models that primarily focus on performance metrics, the improvements introduced in MPG-YOLO, as highlighted in Table 1 and Table 2, enhance both precision and post-processing optimization. For instance, MPG-YOLO v5 demonstrated a notable 2.68% increase in mAP50:95 for enoki mushroom mask detection compared to YOLO v5, while simultaneously reducing the model size by 5 MB. This trend is consistent with the improvements observed in MPG-YOLO v8 over YOLO v8, indicating that the MPG enhancement method is broadly applicable across the YOLO series, offering a superior balance of speed and accuracy. Furthermore, the integration of a mask optimization algorithm in the post-processing stage, as shown in Figure 17 and Table 4, significantly improves the visualization quality of the enoki mushroom grasping area mask. This advancement underscores the strength of this study in refining the visual output of detection, an aspect often overlooked in previous research.
While crop detection research has also explored phenotypic measurements—such as Kim’s [9] visual system for measuring corn stalk height and Lu’s [16] algorithm for mushroom cap diameter—most existing methods treat measurement as an independent task. Yin [33] introduced ORD-Net to determine the drying status of Oudemansiella raphanipies mushrooms. In contrast, this study uniquely synchronizes localization and measurement, encapsulating both functions within a single framework, which significantly enhances real-time performance. Notably, Wang [34] proposed a lightweight semantic segmentation model using knowledge distillation for grape-picking point localization. However, these measurement methods did not leverage recognition results as actionable data for subsequent applications. Unlike these approaches, this study not only focuses on improving the model’s quantitative metrics but also enhances detection quality and utilizes detection results as direct input for controlling lower-level systems. Although Chen [35] developed an improved YOLO algorithm for pepper target detection, it did not incorporate further enhancements to detection quality.
It is undeniable that this study also has some limitations. While the mask merging algorithm effectively enables parent–child determination and merging, some low-quality masks persist (shown in Figure 17). Figure 17 (5b and 6b) shows that the optimized ROI still contains noticeable internal gaps. Several factors contribute to this issue: 1. The quality of the initial mask is poor. The regions 4a, 5a, and 6a exhibit varying degrees of internal gaps, with 5a and 6a being more severely affected. Consequently, the mask quality after processing 5b and 6b does not improve to the same level as that of 4b. 2. Occlusion and overlap issues arise. It is evident that the ROI region of the enoki mushrooms in Figure 17 (5a and 6a), particularly 6a, overlaps with the enoki mushroom bodies of other clusters, leading to occlusion. This overlap introduces noise, adversely impacting feature extraction and reducing the mask quality. An analysis of the locations where low-quality masks occur indicates that the most severe internal disconnections are found along the boundaries of enoki mushrooms, where overlapping structures often lead to recognition confusion. In contrast, Figure 17 (1a–3a, 7a, and 8a) does not exhibit this issue, as these regions contain no overlapping objects. This suggests that the primary cause of internal mask disconnections is the model’s limited ability to distinguish boundary features in cases of enoki mushroom overlap. Addressing this issue could involve enhancing image data to increase diversity. Additionally, Figure 19 highlights a notable difference in ROI detection accuracy before and after model integration. Prior to integration, even when excluding ROIs with incomplete shots, some complete ROIs were misclassified as undetectable. However, applying an ensemble model approach successfully detected these previously unrecognized regions, suggesting that the robustness of individual sub-models still requires further improvement.
5. Conclusions
This study introduces MPG-YOLOv8, a visual servo-based end-gripping stroke optimization method for the automatic root-cutting process of factory-bottled enoki mushrooms. MPG-YOLOv8 integrates the StarNet, SPPECAN, and C2fDStar modules. The experimental results demonstrated the ability of the StarNet and C2fDStar models to accelerate model detection, while the SPPECAN module enhanced MPG-YOLOv8’s performance in achieving outstanding detection accuracy for enoki mushrooms. Specifically, the parameters of MPG-YOLOv8 were reduced from 3,157,200 to 1,728,548, with its mAP50-95 for the grasped region reaching 0.743, surpassing YOLOv8 (0.711) by 4.5%. Furthermore, the average detection speed for a single-frame image was 10.3 ms, confirming the method’s feasibility for real-time detection. In the post-processing stage, mask merging and optimization techniques were applied to effectively improve the mask quality. The intersection over union (IoU) of the optimized mask and ground truth areas consistently exceeded 0.8, enhancing the accuracy of the grasping area mask and ensuring the precision of subsequent measurement and grasping operations. The mapping model achieved an R2 value of 0.9833, with the average error between LAB and L being only 0.14%, further confirming the viability of the mapping approach. Finally, the method was tested in a factory environment, where the differentiated grasp success rate reached 96% and the qualified cut surface rate was 98%. These results demonstrated that the end could adaptively adjust the stroke size and grasp without significant deformation, while the flatness of the cut surface improved markedly after cutting. This indicates that the method proposed in this study meets the application requirements. The method is highly significant for advancing the automation of enoki mushroom production equipment and improving business profitability.
Author Contributions
L.X.: Supervision, Resources, Writing—review and editing. J.J.: Conceptualization, Data curation and analysis, Investigation, Methodology, Validation, Visualization, Writing—original draft, Software, Hardware. H.W.: Writing—original draft, Visualization. Q.K.: Writing—original draft, Validation. Y.Z.: Writing—original draft. D.Y.: Funding acquisition, Project administration. All authors have read and agreed to the published version of the manuscript.
Funding
This research was funded by Fujian Provincial Technological Innovation Key Research and Industrialization Projects (No. 2024XQ010) and Fujian Forestry Science and Technology Project (2023FKJ01).
Data Availability Statement
The data have to be used further and cannot be shared for the time being.
Acknowledgments
The authors gratefully acknowledge all the Funding and Industrialization Projects for supporting this research.
Conflicts of Interest
The authors declare that they have no known competing financial interests or personal relationships that could have appeared to influence the work reported in this paper.
Abbreviations
The following abbreviations are used in this manuscript:
| SPPELAN | Spatial pyramid pooling enhanced with efficient local aggregation network |
| ELAN | Efficient local aggregation network |
| R2 | Coefficient of determination |
| ECA | Efficient channel attention |
References
- Grocholl, J.; Ferguson, M.; Hughes, S.; Trujillo, S.; Burall, L.S. Listeria monocytogenes contamination leads to survival and growth during enoki mushroom cultivation. J. Food Prot. 2024, 87, 100290. [Google Scholar] [CrossRef] [PubMed]
- Liu, Q.Y.; Qi, J.; Wang, Z.R.; Zhou, H.Y.; Sun, B.; Zhao, H.C.; Wu, H.L.; Xu, Z.Q. Current situation and thinking of Flammulina filiformis in industrialized production in China. Edible Fungi China 2021, 40, 83–88+92. Available online: https://link.cnki.net/doi/10.13629/j.cnki.53-1054.2021.12.015 (accessed on 6 February 2025). (In Chinese).
- Li, C.; Xu, S. Edible mushroom industry in China: Current state and perspectives. Appl. Microbiol. Biotechnol. 2022, 106, 3949–3955. [Google Scholar] [CrossRef]
- Lu, Y.; Young, S. A survey of public datasets for computer vision tasks in precision agriculture. Comput. Electron. Agric. 2020, 178, 105760. [Google Scholar] [CrossRef]
- Yin, H.; Yi, W.; Hu, D. Computer vision and machine learning applied in the mushroom industry: A critical review. Comput. Electron. Agric. 2022, 198, 107015. [Google Scholar] [CrossRef]
- Genno, H.; Kobayashi, K. Apple growth evaluated automatically with high-definition field monitoring images. Comput. Electron. Agric. 2019, 164, 104895. [Google Scholar] [CrossRef]
- Li, Q.; Ma, W.; Li, H.; Zhang, X.; Zhang, R.; Zhou, W. Cotton-YOLO: Improved YOLOV7 for rapid detection of foreign fibers in seed cotton. Comput. Electron. Agric. 2024, 219, 108752. [Google Scholar] [CrossRef]
- Dang, F.; Chen, D.; Lu, Y.; Li, Z. YOLOWeeds: A novel benchmark of YOLO object detectors for multi-class weed detection in cotton production systems. Comput. Electron. Agric. 2023, 205, 107655. [Google Scholar] [CrossRef]
- Kim, W.-S.; Lee, D.-H.; Kim, Y.-J.; Kim, T.; Lee, W.-S.; Choi, C.-H. Stereo-vision-based crop height estimation for agricultural robots. Comput. Electron. Agric. 2021, 181, 105937. [Google Scholar] [CrossRef]
- Shen, Y.; Wang, L.; Jin, Y. AAFormer: A multi-modal transformer network for aerial agricultural images. In Proceedings of the 2022 IEEE/CVF Conference on Computer Vision and Pattern Recognition Workshops (CVPRW), New Orleans, LA, USA, 19–20 June 2022; pp. 1704–1710. [Google Scholar] [CrossRef]
- Kim, W.-S.; Lee, D.-H.; Kim, Y.-J. Machine vision-based automatic disease symptom detection of onion downy mildew. Comput. Electron. Agric. 2020, 168, 105099. [Google Scholar] [CrossRef]
- Thai, H.-T.; Le, K.-H.; Nguyen, N.L.-T. FormerLeaf: An efficient vision transformer for Cassava Leaf Disease detection. Comput. Electron. Agric. 2023, 204, 107518. [Google Scholar] [CrossRef]
- Tongcham, P.; Supa, P.; Pornwongthong, P.; Prasitmeeboon, P. Mushroom spawn quality classification with machine learning. Comput. Electron. Agric. 2020, 179, 105865. [Google Scholar] [CrossRef]
- Li, X.; Liu, Y.; Gao, Z.; Xie, Y.; Wang, H. Computer vision online measurement of shiitake mushroom (Lentinus edodes) surface wrinkling and shrinkage during hot air drying with humidity control. J. Food Eng. 2021, 292, 110253. [Google Scholar] [CrossRef]
- Wang, L.; Dong, P.; Wang, Q.; Jia, K.; Niu, Q. Dried shiitake mushroom grade recognition using D-VGG network and machine vision. Front. Nutr. 2023, 10, 1247075. [Google Scholar] [CrossRef] [PubMed]
- Lu, C.P.; Liaw, J.J. A novel image measurement algorithm for common mushroom caps based on convolutional neural network. Comput. Electron. Agric. 2020, 171, 105336. [Google Scholar] [CrossRef]
- Sutayco, M.J.Y.; Caya, M.V.C. Identification of medicinal mushrooms using computer vision and convolutional neural network. In Proceedings of the 2022 6th International Conference on Electrical, Telecommunication and Computer Engineering (ELTICOM), Medan, Indonesia, 22–23 November 2022; pp. 167–171. [Google Scholar] [CrossRef]
- Tao, K.; Liu, J.; Wang, Z.; Yuan, J.; Liu, L.; Liu, X. ReYOLO-MSM: A novel evaluation method of mushroom stick for selective harvesting of shiitake mushroom sticks. Comput. Electron. Agric. 2024, 225, 109292. [Google Scholar] [CrossRef]
- Charisis, C.; Gyalai-Korpos, M.; Nagy, A.S.; Karantzalos, K.; Argyropoulos, D. Detecting and Locating Mushroom Clusters by a Mask R-CNN Model in Farm Environment; Brill|Wageningen Academic: Wageningen, The Netherlands, 2023; pp. 393–400. [Google Scholar] [CrossRef]
- Wang, X.; Yang, W.; Qi, W.; Wang, Y.; Ma, X.; Wang, W. STaRNet: A spatio-temporal and Riemannian network for high-performance motor imagery decoding. Neural Netw. 2024, 178, 106471. [Google Scholar] [CrossRef]
- Cao, M.-T. Drone-assisted segmentation of tile peeling on building façades using a deep learning model. J. Build. Eng. 2023, 80, 108063. [Google Scholar] [CrossRef]
- An, R.; Zhang, X.; Sun, M.; Wang, G. GC-YOLOv9: Innovative smart city traffic monitoring solution. Alex. Eng. J. 2024, 106, 277–287. [Google Scholar] [CrossRef]
- Duong, V.H.; Nguyen, D.Q.; Van Luong, T.; Vu, H.; Nguyen, T.C. Robust data augmentation and ensemble method for object detection in fisheye camera images. In Proceedings of the IEEE/CVF Conference on Computer Vision and Pattern Recognition Workshops (CVPRW), Seattle, WA, USA, 17–18 June 2024; pp. 7017–7026. [Google Scholar] [CrossRef]
- Wang, C.-Y.; Yeh, I.-H.; Liao, H.-Y.M. YOLOv9: Learning What You Want to Learn Using Programmable Gradient Information. In Computer Vision—ECCV; Springer: Berlin/Heidelberg, Germany, 2024. [Google Scholar]
- Aboah, A.; Wang, B.; Bagci, U.; Adu-Gyamfi, Y. Real-time multi-class helmet violation detection using few-shot data sampling technique and YOLOv8. In Proceedings of the 2023 IEEE/CVF Conference on Computer Vision and Pattern Recognition Workshops (CVPRW), Vancouver, BC, Canada, 17–24 June 2023; pp. 5350–5358. [Google Scholar] [CrossRef]
- Li, H.; Wu, A.; Jiang, Z.; Liu, F.; Luo, M. Improving object detection in YOLOv8n with the C2f-f module and multi-scale fusion reconstruction. In Proceedings of the Electronic and Automation Control. Conference (IMCEC), Chongqing, China, 24–26 May 2024; pp. 374–379. [Google Scholar] [CrossRef]
- Chen, F.; Wu, F.; Xu, J.; Gao, G.; Ge, Q.; Jing, X.-Y. Adaptive deformable convolutional network. Neurocomputing 2021, 453, 853–864. [Google Scholar] [CrossRef]
- Sapkota, R.; Ahmed, D.; Karkee, M. Comparing YOLOv8 and Mask R-CNN for instance segmentation in complex orchard environments. Artif. Intell. Agric. 2024, 13, 84–99. [Google Scholar] [CrossRef]
- Liu, N.; Long, Y.; Zou, C.; Niu, Q.; Pan, L.; Wu, H. ADCrowdNet: An attention-injective deformable convolutional network for crowd understanding. In Proceedings of the 2019 IEEE/CVF Conference on Computer Vision and Pattern Recognition (CVPR), Long Beach, CA, USA, 15–20 June 2019; pp. 3220–3229. [Google Scholar] [CrossRef]
- Wang, X.; Chan, K.C.K.; Yu, K.; Dong, C.; Loy, C.C. EDVR: Video restoration with enhanced deformable convolutional networks. In Proceedings of the 2019 IEEE/CVF Conference on Computer Vision and Pattern Recognition Workshops (CVPRW), Long Beach, CA, USA, 16–17 June 2019; pp. 1954–1963. [Google Scholar] [CrossRef]
- Wang, W.; Dai, J.; Chen, Z.; Huang, Z.; Li, Z.; Zhu, X.; Hu, X.; Lu, T.; Lu, L.; Li, H.; et al. InternImage: Exploring large-scale vision foundation models with deformable convolutions. In Proceedings of the 2023 IEEE/CVF Conference on Computer Vision and Pattern Recognition (CVPR), Vancouver, BC, Canada, 17–24 June 2023; pp. 14408–14419. [Google Scholar] [CrossRef]
- Liu, Z.; Lin, W.; Li, X.; Rao, Q.; Jiang, T.; Han, M.; Fan, H.; Sun, J.; Liu, S. ADNet: Attention-guided deformable convolutional network for high dynamic range imaging. In Proceedings of the 2021 IEEE/CVF Conference on Computer Vision and Pattern Recognition Workshops (CVPRW), Nashville, TN, USA, 19–25 June 2021; pp. 463–470. [Google Scholar] [CrossRef]
- Yin, H.; Zhao, J.; Lei, D. Detecting dried Oudemansiella raphanipies using RGB imaging: A case study. Dry. Technol. 2024, 42, 1466–1479. [Google Scholar] [CrossRef]
- Wang, J.; Lin, X.; Luo, L. Cognition of grape cluster picking point based on visual knowledge distillation in complex vineyard environment. Comput. Electron. Agric. 2024, 39, 166177. [Google Scholar] [CrossRef]
- Chen, H.; Zhang, R.; Peng, J. YOLO-chili: An efficient lightweight network model for localization of pepper picking in complex environments. Appl. Sci. 2024, 14, 5524. [Google Scholar] [CrossRef]


Disclaimer/Publisher’s Note: The statements, opinions and data contained in all publications are solely those of the individual author(s) and contributor(s) and not of MDPI and/or the editor(s). MDPI and/or the editor(s) disclaim responsibility for any injury to people or property resulting from any ideas, methods, instructions or products referred to in the content. |
© 2025 by the authors. Licensee MDPI, Basel, Switzerland. This article is an open access article distributed under the terms and conditions of the Creative Commons Attribution (CC BY) license (https://creativecommons.org/licenses/by/4.0/).