Abstract
Monitoring agricultural drought is crucial for mitigating yield losses in winter wheat, especially in the Huang-Huai-Hai (HHH) region of China. Current drought indices often fall short in accurately representing the water supply–demand dynamics for crops, neglect irrigation practices, and overemphasize drought intensity rather than its evolution and overall impact. To address these concerns, we developed a novel transpiration drought index utilizing the Water Balance for Winter Wheat (WBWW) model. This index integrated variations in atmospheric conditions, soil moisture conditions, crop resistance, and irrigation practices to enhance the evaluation of water supply and demand dynamics. The WBWW model was initially validated against field transpiration measurements, achieving an R2 of 0.7573, thereby confirming its reliability for subsequent analyses. To create a mechanistic understanding of crop water supply and demand, we adopted the reduction rate of actual and potential transpiration to identify drought events and constructed joint probability distributions of drought duration and severity using copulas. This led to the development of the Winter Wheat Drought Assessment Index (WDAI). The grade threshold for the WDAI was established based on historical drought data from the HHH region through a series of statistical threshold determination methods. Our findings showed that the WDAI successfully identified 87.36% of drought samples according to their recorded grades, with 97.13% within one grade of historical records. Comparative analyses with retained regional data and existing indices—the Crop Water Deficit Index (CWDI) and the Relative Soil Moisture Index (RSMI)—further demonstrated its effectiveness. Our study represents a robust tool for dynamic drought monitoring in the HHH region and offers critical insights into agricultural irrigation practices.
1. Introduction
Winter wheat (Triticum aestivum L.) is the most important food diet component in many regions worldwide and represents the primary wheat variety cultivated in China [1]. Data from the National Bureau of Statistics of China in 2022 (https://data.stats.gov.cn/ (accessed on 20 September 2024)) indicate that the Huang-Huai-Hai (HHH) region serves as the primary hub for winter wheat production in China, where it comprises over 75% of the planted area and over 80% of the national yield. Drought is a significant meteorological hazard in the HHH region, particularly during the winter and spring months when precipitation levels are notably low [2,3]. It serves as the primary factor inhibiting the growth of winter wheat, resulting in diminished crop yield and quality [2] and posing significant threats to food security, biodiversity, economic development, societal stability, and overall well-being [4,5,6,7]. Climate change has led to more frequent drought events, which further exacerbate these challenges [8,9,10]. Projections suggest a heightened likelihood of drought occurrences in the future [11,12,13,14]. Currently, irrigation is a vital agricultural management practice employed to combat these adversities and to mitigate the impacts of drought in the HHH region, a representing over 70% of the total agricultural irrigation water utilized in China [6,15]. Existing irrational irrigation schedules pose significant threats to freshwater and energy resources [6,16,17]. Therefore, there is an urgent need for a timely and accurate drought monitoring approach capable of informing effective drought prevention and mitigation strategies for winter wheat.
Agricultural drought typically refers to the phenomenon characterized by a water deficiency within crops due to sustained insufficient soil moisture during the growing period. This deficiency negatively impacts the normal growth and development of the crops, ultimately leading to decreased yields or potential crop failure [3,18,19]. The monitoring of agricultural drought typically employs a range of agricultural drought monitoring indices, which primarily consist of the vegetation indices, soil moisture drought indices, and crop evapotranspiration drought indices [5,18,20].
With the increasing availability of remote sensing products, the monitoring of vegetation growth across extensive areas has become feasible. Drought stress can lead to water deficiency in crops, subsequently affecting their growth processes [21,22]. Therefore, vegetation indices derived from remote sensing technology, such as the Normalized Difference Vegetation Index (NDVI) [23], the Normalized Difference Water Index (NDWI) [24], and the Normalized Difference Moisture Index (NDMI) [25], are widely used for monitoring vegetation drought across expansive regions, as they provide direct insights into the crop growth condition [5,26]. However, several factors limit their effectiveness, including relatively low spatiotemporal resolution, weather and terrain impacts, noise from non-vegetated areas, and a weak correlation between vegetation activity and reflectance [27,28,29]. Recent studies have demonstrated a significant temporal lag between changes in vegetation indices and the processes of plant photosynthesis and water dynamics [5,30,31,32]. This suggests that vegetation indices may face challenges in terms of the swift detection of agricultural drought.
Soil moisture is a fundamental component of the water cycle, regulates the water and energy fluxes within the soil–vegetation–atmosphere continuum (SPAC), and plays a pivotal role in agricultural drought [20,31,33]. It serves as the primary reservoir of accessible moisture for crops, effectively integrating various sources of water supply, including precipitation and irrigation. Numerous studies have demonstrated that soil moisture plays a crucial role in the growth and development of winter wheat, as well as in the formation of yield and the enhancement of quality [2,34,35]. Therefore, soil moisture drought indices, such as the Standardized Soil Moisture Index (SSI) [36] and Soil Water Deficit Index (SWDI) [37], are recognized as effective tools for monitoring agricultural drought [38,39,40]. However, the presence of crops introduces considerable challenges for the regional application of soil moisture drought indices, arising predominantly from diversity of crop varieties and unique growth characteristics [20,32,41,42]. The depth of soil water accessibility to crops is predominantly influenced by the development of their root systems. Research indicates that the importance of deeper soil moisture for winter wheat considerably increases as the growing season advances [31,43,44,45]. The growth of roots is influenced by a variety of intricate factors, including soil moisture content, crop drought resistance and irrigation practices, leading to considerable spatiotemporal heterogeneity [46,47]. This variability suggests a limited spatiotemporal comparability of these indices in the assessment of agricultural drought impacts.
Crop evapotranspiration facilitates the monitoring of variations in crop water supply and demand, which is significantly affected by soil moisture, the root system, and atmospheric demand on basis of the SPAC [2,20,48,49]. Therefore, crop evapotranspiration drought indices, obtained from in situ measurements, model estimation or remote sensing, serve as effective tools for characterizing agricultural drought. These indices provide a robust mechanistic framework for the quantitative characterization and assessment of agricultural drought, offering profound insights into the water stress experienced by crops. However, they may not fully capture the actual water status of crops due to crop evapotranspiration encompassing crop transpiration and evaporation from the soil and water intercepted by the leaves in agroecosystems. The existing of evaporation may introduce uncertainties in the representation of crop water supply and demand, thereby impacting the monitoring of agricultural drought [31,50,51]. Recent studies have sought to substitute actual crop evapotranspiration with available soil moisture to provide a more accurate representation of the crop water supply, thereby improving agricultural drought monitoring [20,52]. Nonetheless, as droughts worsen, the capacity of crops to absorb available soil moisture declines due to a reduced water potential gradient between the soil and the crops [53,54]. This phenomenon can lead to an overestimation of the water available to crops, resulting in an underestimation of drought [41,55].
From the perspective of crop water transport, a crop water deficit arises when the soil moisture absorbed by the roots is insufficient to meet the atmospheric demand for transpiration [6,47,56]. To address the environmental stress of insufficient water supply, crops have evolved various adaptive mechanisms, among which one of the primary physiological responses is the regulation of stomatal aperture. By minimizing water loss through these stomata, crops can effectively mitigate the adverse effects associated with internal water deficiency. This physiological adaptation is crucial for maintaining water levels and overall plant health during periods of drought [35,47,57]. This prompts our attention towards transpiration. Transpiration functions as the most direct indicator of crop water status and also reflects the overall growth conditions of crops [58]. It is interconnected with photosynthesis, as well as stomata conductance and the metabolic processes in crops that respond to drought conditions [59]. Moreover, it provides a comprehensive reflection of water movement within all three components of the SPAC. Hence, we propose the adoption of actual crop transpiration as a more accurate measure of the crop water supply and the utilization of potential crop transpirations to quantify crop water demand [60,61].
The direct measurement of transpiration rate presents challenges, being both costly and unavailable in numerous regions. Models such as the Shuttleworth–Wallace model [62], the improved Priestley–Taylor model [63,64], and the double crop coefficient model [61] are commonly used to estimate transpiration rate. Among these, the double crop coefficient model is particularly favored for regional applications due to its simplicity and robustness [60,65,66,67]. Nonetheless, this model fails to consider the root water uptake compensation under water stress conditions, potentially leading to an underestimation of transpiration and an overestimation of drought [68,69,70]. To overcome this limitation, the transpiration estimation was derived from the Water Balance model for Winter Wheat (WBWW), employing an improved double crop coefficient model [71].
Field experiments highlight a notable discrepancy between drought stress level and drought impact on crop yield and quality [6,47,49]. While limited drought stress may confer benefits to winter wheat by promoting root development, excessive drought stress can adversely impact crop health and ultimately reduce yield [42,72,73]. This phenomenon underscores the necessity of investigating the relationship between drought evolution processes and its impact. Agricultural drought typically progresses through four distinct phases: latency, onset, development, and recovery phases [74]. The transition from the latency phase to the onset phase signifies the point at which drought begins to significantly impact agricultural production, marking a disaster that warrants serious attention. Therefore, the accurate and timely identification of these distinct phases of drought evolution, along with an assessment of their associated impacts, is essential for the effective monitoring of agricultural drought.
This study seeks to systematically monitor the evolution of drought and assess its overall impact on winter wheat in the HHH region on a daily basis, utilizing a novel transpiration drought index. This process-based index can effectively capture the intricate interactions among weather conditions, soil moisture content, crop resistance characteristics, and irrigation practices concerning drought evolution. We utilized the reduction rate between actual and potential transpiration as a measure of crop water status, enabling the identification both the duration and severity of drought events. Copulas were employed to analyze these two regional drought characteristics, leading to the development of a drought assessment index, with disaster grade thresholds established based on historical data. A comparative analysis of the drought monitoring capabilities of the WDAI and two widely utilized drought indices, namely the Crop Water Deficit Index (CWDI) and the Relative Soil Moisture Index (RSMI), further substantiating its effectiveness. We expect that this research will be able to enhance the understanding of drought mechanisms and aid in informed decision-making regarding drought prevention and the implementation of efficient irrigation strategies.
2. Materials and Methods
2.1. Study Aera
The HHH region is predominantly situated within the mid-latitude zone of the eastern monsoon climate region in China, which includes the Beijing, Tianjin, Hebei, Henan, Shandong, Anhui, and Jiangsu provinces (Figure 1). It lies within a warm temperate semi-humid climatic zone, characterized by an average annual air temperature that varies between 11 °C and 12 °C in the northern part, and between 14 °C and 15 °C in the southern part [26]. The annual accumulated temperature exceeding 0 °C ranges from 4100 °C to 5400 °C, thereby supporting the growth of the majority of winter wheat cultivars [75]. Due to the temperate monsoon climate characteristic of this region, the annual precipitation is relatively low and demonstrates notable spatial and temporal variability, with approximately 60% to 70% of the precipitation occurring during the summer months [76], making it highly sensitive to climate change [2]. The winter wheat planting area in the HHH region is derived from the 1 km phenological dataset encompassing three staple crops in China from 2000 to 2019 [77]. In this study, we divided the HHH region into five distinct sub-regions based on criteria such as topography, climatic conditions, winter wheat cultivars, and the continuity and independence of the areas. These sub-regions include the Beijing–Tianjin–Hebei (JJJ) planting area, the Shandong (SD) planting area, the Henan (HN) planting area, the Anhui (AH) planting area, and the Jiangsu (JS) planting area, as illustrated in Figure 1.

Figure 1.
The location of the Huang-Huai-Hai region in China and its agrometeorological stations and meteorological stations. The abbreviations JJJ, SD, HN, AH and JS represent the planting areas of Beijing–Tianjin–Hebei, Shandong, Henan, Anhui and Jiangsu, respectively.
Given the high spatial variability of winter wheat cultivars within the HHH region [33,35], the localized WBWW was employed to capture the essential characteristics of winter wheat cultivars across different sub-regions and environmental conditions. This localization process inherently reflects the variability in cultivars by incorporating regional data on soil, climate, and agricultural practices, ensuring that our findings are applicable to the HHH region. The model requires application initialization data and driving values specific to HHH, which will be detailed in the following section (Section 2.2, Data).
2.2. Data
2.2.1. Meteorological Data Driving the WBWW Model
The daily operations of the WBWW model require the input of meteorological data to drive its computations. The meteorological data utilized in this study was collected from a total of 579 meteorological stations located within the HHH region. The daily meteorological variables, including the maximum, minimum, and mean temperatures (°C); sunshine duration (h); relative humidity (%), measured at 2 m height; wind speed (m s−1), measured at 10 m height; atmospheric pressure (hPa); and precipitation (mm), were sourced from the China Meteorological Data Sharing Service System (https://data.cma.cn (accessed on 18 July 2024)) and cover the period from 2010 to 2022. Several missing data values were estimated using the inverse distance weight interpolation with data from nearby stations.
2.2.2. Parameters for WBWW Model Initialization
The soil moisture prior to the sowing of winter wheat is one of the critical initialization parameters for the WBWW model, as it determines the initial level of soil moisture within the model. Soil moisture observation data, spanning from 2010 to 2022, were collected from the daily soil moisture dataset derived from the automatic soil moisture observation stations from the China Meteorological Data Sharing Service System (https://data.cma.cn (accessed on 18 July 2024)). These data are linked to the meteorological stations described in Section 2.2.1. Soil moisture measurements were recorded at various depths, specifically 0.1 m, 0.2 m, 0.3 cm, 0.4 m, 0.5 m, 0.6 m, 0.8 m, and 1.0 m. Through this dataset, we can obtain pre-sowing soil moisture for model initialization. Additionally, we can estimate effective irrigation volume based on the sudden increase in soil moisture observed on days with no recorded precipitation [76].
Soil property data represent critical initialization parameters for the WBWW model, as they determine the fundamental hydro-physical parameters of the soil within the model. The physical soil property data utilized in this study were obtained from the soil properties dataset for land surface modeling of China [78] from National Tibetan Plateau/Third Pole Environment Data Center (https://data.tpdc.ac.cn/ (accessed on 24 July 2024)). This dataset is presented in a raster format with a spatial resolution of 30 arc seconds and encompasses eight distinct soil layers reaching a maximum depth of 2.3 m. It provides essential soil physical characteristics, including soil sand content (SA; %), soil clay content (CL; %), soil organic matter content (SOM; %), and soil bulk density (BD; g/cm3). Furthermore, soil dynamic parameters, such as soil saturated water content (; m3 m−3), field capacity (; m3 m−3), wilt point (; m3 m−3), and saturated hydraulic conductivity (; m d−1), can be derived through the use of the PTFs based on the aforementioned soil physical properties [79].
The phenological periods of winter wheat serve as another crucial initialization parameter within the WBWW model, playing a significant role in the variation in crop water requirements. Phenological observations of winter wheat were collected from 87 agro-meteorological stations located in the HHH region, covering the period from 2010 to 2022, through the China Meteorological Data Sharing Service System (https://data.cma.cn (accessed on 18 July 2024)). The inverse distance weighting method was used to extrapolate phenological stages regionally. Despite annual variations in the spatial distribution of winter wheat pixels due to climatic factors and relevant policies, the grid frameworks remained consistent throughout the study period.
2.2.3. Historical Drought Disaster Records
This study collected historical drought disaster data affecting winter wheat from 2010 to 2022, sourced from the Meteorological Disaster Management System of the China Meteorological Administration (intranet sites, http://10.1.64.146/disaster/index (accessed on 5 August 2024)), agro-meteorological stations, and the Yearbook of Meteorological Disasters in China (2012–2023). Those records detailed the timing, impacted areas, and severity of drought impacts. The Yearbook of Meteorological Disasters in China primarily focuses on regional droughts, albeit in a somewhat general manner. In contrast, the agro-meteorological stations offer detailed, ten-day data on droughts and agricultural practices, although the volume of data are relatively limited. The Meteorological Disaster Management System provides comprehensive drought records and associated field irrigation practices aimed at mitigation efforts. However, its records only commence only from the year 2010, resulting in a shorter temporal span when compared to other available data sources. The reliability of the drought disaster samples was ensured through a comparative analysis of data obtained from three distinct sources. The effective irrigation volume, derived from daily soil moisture measurements, was validated via irrigation records to obtain insights into irrigation practices [76]. This approach facilitated the compilation of five historical datasets concerning the impacts of drought on winter wheat, while also taking irrigation into consideration (Table 1). The grade of drought was classified into three categories, namely mild, moderate, and severe, according to the recorded impacts. To develop and validate a drought index, a dataset split of 80% for training and 20% for testing was employed, thus ensuring the index’s effectiveness in assessing the impacts of drought.

Table 1.
Information on disaster sample size and related drought grades on winter wheat caused by drought in five sample sets across different geographic planting areas.
2.2.4. Field Experiment and Transpiration Observations
This study employed the actual transpiration data measured by LI-6400 photosynthesis measurement system (LI-COR Biosciences Inc., Lincoln, NE, USA) during the drought-rehydration treatment control experiment at the Zhengzhou agro-meteorological station, conducted from October 2023 to May 2024, to assess the simulation accuracy of the WBWW model in actual transpiration. The experiment utilized two distinct water-sensitive winter wheat cultivars, namely “Zhengmai 1860” and “Luohan 22”, which are prevalent in the local agricultural landscape. “Zhengmai 1860” is a water-sensitive semi-winter variety, while “Luohan 22” is known for its drought resistance.
This experiment involved nine groups: one control (CK) group and eight drought treatment groups (Table 2). The drought treatments (T1 to T4) were applied during two growth stages: the regreening stage (P1) and the jointing stage (P2). T1 to T3 involved 20, 30, and 40 days of drought, respectively, followed by rehydration to 60% relative soil humidity. T4 was a continuous drought without rehydration. The CK group was grown in a conventional planting environment, while the treatment groups were in a covered field. Transpiration measurements for both the CK and P1 treatment groups were conducted on the following dates: 7 March, 14 March, 20 March, 29 March, 7 April, 12 April, 18 April, 24 April, and 7 May 2024. Transpiration measurements for both the P2 treatment groups were conducted on 20 March, 29 March, 7 April, 12 April, 18 April, 24 April, and 7 May 2024. Transpiration measurements were carried out on three leaves from three distinct plant species that exhibited relatively uniform growth patterns within the same group. These measurements were taken at a CO2 concentration of 400 μmol mol−1, utilizing a total of 15 distinct photon flux density levels, specifically: 2000, 1500, 1200, 1000, 800, 600, 400, 200, 100, 80, 60, 40, 20, 10 μmol m−2s−1, and 0. Notably, the P2-T2 treatment group was exposed to a precipitation event from the night of 13 April to noon on 14 April 2024, receiving a total of 17.5 mm of rain, which was considered an approximate rehydration. For the P2-T3 treatment group, there were significant discrepancies in the actual transpiration measurements taken on 7 May, leading to the exclusion of these data from the final analysis.
Table 2.
Experimental plan for rehydration of different treatment groups.
2.3. Development of a Process-Based Transpiration Drought Index
2.3.1. Defining and Characterizing Drought Events Through the Lens of Transpiration
Transpiration serves as a direct indicator of water status in crops, significantly contributing to the comprehension of the intricate relationship between crop health and drought conditions. In response to drought stress, the stomata conductance in the leaves of winter wheat typically decreases to alleviate the impacts of reduced water availability, leading to a decrease in transpiration rates [59]. Moreover, it is imperative to acknowledge that crop transpiration is influenced not only the soil moisture contents but also by a range of additional factors, including the specific crop variety, growth stage, and prevailing climatic conditions [50,58]. These responses highlight the intricate interplay between a crop water status and its capacity to adapt to adverse drought conditions. To enable a thorough assessment of drought stress that facilitates both spatial and temporal comparison, the reduction rate of actual and potential transpiration in winter wheat is utilized to quantify the relationship between crop water supply and demand. Consequently, the Winter Wheat Drought Stress Index (WDSI) was established:
where indicates the drought stress experienced by crops; is the potential crop transpiration (m d−1), which can be estimated using the dual crop coefficient model; and is the actual transpiration of crops while accounting for water stress, which can be obtain using the WBWW model. WDSI establishes a direct connection that facilitates the transition from soil water stress to crop drought stress and provides a relative representation of crop water status.
Run theory has been extensively employed to characterize drought events [80,81]. This study adopts the same approach to extract and analyze drought duration and severity. The methodology involves the following steps:
- (1)
- A drought event’s duration is defined as the continuous period of drought stress (WDSI > 0) or the time span from its initiation and termination of the drought event.
- (2)
- Drought events lasting three days or fewer are classified as non-drought events and are excluded from further analysis.
- (3)
- Consecutive drought events occurring within a one-day interval are merged into a single event. The total duration of the merged event is the sum of the individual event durations.
- (4)
- The severity of a drought event is quantified as the cumulative drought stress the initiation to the termination of this event.
2.3.2. Process-Based Drought Index Based on Bivariate Joint Distribution
Generally, the main focus of drought disasters is actually a specific geographical area, where the characteristics of drought tend to demonstrate a high degree of consistency [82]. Numerous studies have demonstrated the efficacy of copulas in analyzing drought characteristics [82,83,84,85]. This methodology can provide valuable insights into the joint behavior of these variables. Consequently, we employed a copula-based framework to conduct a regional analysis of drought characteristics.
In this study, we established five bivariate joint probability distribution models based on drought events identified by WDSI across five distinct winter wheat planting areas. The following sections detail the application of copulas in the regional bivariate analysis of agricultural drought characteristics.
(a) Univariate marginal distributions describe regional drought characteristics
In this study, we resorted to univariate marginal distributions to independently extract regional drought characteristics. Candidate univariate marginal distributions must meet three criteria: a lower bound of zero, right-skewed continuous distribution characteristics, and suitability for modeling hazard rates in natural phenomena. The distributions examined include the gamma distribution (GAM), exponential distribution (EXP), generalized gamma distribution (GGAM), Weibull distribution (WB), exponentiated Weibull distribution (EWB), beta prime distribution (BP), log-logistic distribution (FISK), Burr distribution (BUR), Pareto distribution (PAR), and lognormal distribution (LNORM). To identify the most suitable marginal distribution function, the Kolmogorov–Smirnov test (K-S test) is employed [86], with a p-value close to 1 indicating a good fit.
(b) Copula functions as a joint model for regional drought characteristics
Copulas, which link univariate marginal distributions to model dependency structures, are extensively applied in hydrology and meteorology [86,87,88]. Various copula families including the Archimedean copulas family (Ali–Mikhail–Haq copula, Frank copula, Clayton copula, Gumbel copula, and Joe copula), the elliptical copulas family (Student’s t-copula and Gaussian copula) and the extreme-value copulas family (Galambos copula, Gumbel–Hougaard copula, Husler–Reiss copula, and mixed-model copula) are identified as suitable for joint distribution modeling [89,90]. The best copula function is selected based on the Akaike Information Criterion (AIC) and Bayes Information Criterion (BIC) [86], with lower values indicating better fit.
(c) Joint exceedance probability and joint recurrence interval
The binary exceedance probability (p) refers to the probability of an event occurring when two random variables simultaneously exceed a given threshold, which can be expressed as follows:
where and are random variables; and are given thresholds, respectively; and represent the cumulative probabilities when the random variables and are less than the thresholds and and represents the joint cumulative probability calculated using the copula function. The joint recurrence interval () related to can be calculated as follows:
2.3.3. Construction of the Drought Index Utilizing Drought Characteristics and Their Joint Distribution
Previous research highlights a significant temporal gap between the occurrence of drought stress and the subsequent onset of drought disasters in crops [42,74]. Initial drought stress can be beneficial, promoting drought-resistant traits like enhanced root growth through physiological adaptations [72,73,91]. This phase is termed the latency phase, where no destructive effects are observed. However, if the accumulated stress surpasses the crop’s adaptive capacity, it can lead to damage, marking the transition from latency to onset of disaster. WDSI is effective in detecting drought stress but inadequate for quantifying the stages of drought evolution. Therefore, there is a need for process-based indices that reflect drought characteristics throughout its development, focusing on duration and severity [42,74,87,92]. This study constructs the Winter Wheat Drought Assessment Index (WDAI), utilizing the binary joint distribution of these two characteristics:
where is the joint exceedance probability as described in Equation (3), and are random variables representing the duration and severity of the drought event.
2.3.4. Establishment and Validation of Drought Grade Thresholds for WDAI
The identification of drought disaster events relies on the trigger threshold of a drought index. This threshold marks the transition from a latent phase to the actual onset of a drought disaster. The accuracy of this identification is measured by the recognition rate (IR) [42], defined as the ratio of accurately identified disaster samples to the total number of disasters:
where is the accurately identified number of disaster samples using WDAI, is the total number of disaster samples. A lower trigger threshold increases the number of identified droughts, and it also raises the risk of misclassifying non-disaster occurrences as drought. Our primary metric for determining the trigger threshold is to maximize the identification rate of disaster while minimizing the misclassification of non-disaster conditions.
The critical thresholds of mild–moderate drought, and moderate–severe drought for WDAI can be effectively determined using the Receiver Operating Characteristic (ROC) curve, supplemented by the Youden Index (JI) [93]. The ROC curve serves as a graphical representation that illustrates the diagnostic performance of binary classifiers. It is generated by plotting various pairs of true positive rate (TPR) values against false positive rate (FPR) values. The TPR denotes the ratio of correctly identified positive observations to the total number of actual positive observations, while the FPR reflects the ratio of incorrectly identified positive observations to the total number of actual negative observations:
For moderately critical thresholds, TP and FN are the numbers of correctly identified moderate and mild drought samples, while FP and TN are the numbers of incorrectly identified moderate and mild drought samples. Similarly, for severe critical thresholds, TP and FN are the numbers of correctly identified severe and moderate drought samples, while FP and TN are the numbers of inaccurately identified severe and moderate drought samples.
The area under the ROC curve (AUC) serves as a metric for assessing the efficacy of a classification model. AUC values range from 0 to 1, with higher values indicating better diagnostic capabilities. AUC evaluation criteria categorize models as ‘Fail’ (AUC < 0.6), ‘Poor’ (0.6 ≤ AUC < 0.7), ‘Fair’ (0.7 ≤ AUC < 0.8), ‘Good’ (0.8 ≤ AUC < 0.9), and ‘Excellent’ (0.9 ≤ AUC ≤ 1) [93].
The JI is an auxiliary indicator derived from the ROC curve, quantified by the maximum vertical distance from the curve to the positive diagonal, where AUC equals 0.5. This distance is the difference between TPR and FPR. The optimal cutoff point for distinguishing between mild–moderate and moderate–severe drought categories is identified by maximizing this difference across testing thresholds, indicating the point furthest from random chance and signifying critical thresholds for WDAI.
The validity of drought grade thresholds is based on “complete correspondence rate” (CCR) and “mainly correspondence rate” (MCR) [5]. The CCR measures exact matches between WDAI-monitored and actual drought grades, while the MCR allows for one-grade deviations. Given the potential inaccuracies in actual drought impact records stemming from subjective assessments, the MCR serves as a more permissive yet effective verification metric.
3. Results
3.1. Actual Transpiration of Winter Wheat
Before commencing any work, it was imperative to validate the effectiveness of the WBWW model in simulating actual transpiration to ensure that subsequent analyses produce meaningful insights. Therefore, this study conducted a comparison and analysis between the actual transpiration measured during a drought-rehydration treatment control experiment at the Zhengzhou agro-meteorological station and the model’s simulated values. Due to absence of soil moisture measurements collected before sowing across all ridges in the control experiments, the soil moisture observed in the CK group on the sowing day of winter wheat was utilized as an approximate substitute to initialize the WBWW model. While this method may introduce a minor degree of inaccuracy into the model’s simulation results, its impact on winter wheat following the regreening process is likely to be minimal [71].
The two selected varieties of winter wheat utilized in this experiment exhibited distinct characteristics: one demonstrates sensitivity to water, while the other exhibits strong drought tolerance. Following parameter calibration, the WBWW model effectively incorporated the average drought resistance traits of winter wheat under the local climatic conditions. Consequently, the observation values presented in Figure 2 correspond to the average transpiration rates observed for both winter wheat varieties under identical treatment conditions. Validation results indicated a high degree of consistency between the model’s simulated outcomes and the field observations of transpiration, as evidenced by the high consistency depicted in Figure 2. The overall determination coefficient (R2) across various treatments was calculated to be 0.7573. Furthermore, the model’s simulation results revealed its two important capabilities. First, it accurately captured the sudden increases in transpiration caused by irrigation and precipitation. Second, it successfully reflected the daily changes in transpiration due to variations in environmental factors. These findings further substantiated the suitability of the WBWW model for simulating growth dynamics of winter wheat in the HHH region. They also affirm model’s effectiveness in the subsequent development of drought assessment indices for winter wheat.

Figure 2.
Verification of simulated actual transpiration based on field measurements at Zhengzhou agro-meteorological station: (a) comparison of simulated and observed transpiration under different drought treatments and (b) comparison of simulated and observed transpiration in the control treatment group. (c) Scatter plots of simulated and observed transpiration under various treatments.
Figure 2 also illustrates a discrepancy between the observed and simulated transpiration rates of treatments P1-T1, P1-T2, and P1-T3 during the regreen to jointing stages of winter wheat. Conversely, the simulated transpiration of treatment P1-T3 and CK appears to be relatively consistent with the observed values. This discrepancy may be attributed to the models’ initialization, which utilized the pre-sowing soil moisture conditions of CK. The actual scenario likely involved notable discrepancies in pre-sowing soil moisture levels across the P1 treatments, with the exception of treatment P1-T3. In the early stages of winter wheat growth, soil moisture prior to sowing serves as a primary source of water supply, exerting a significant influence on the growth and development of the crop. Variations among different cultivars may further complicate these effects. During this stage, soil moisture is typically abundant, resulting in a stronger correlation between transpiration and crop growth. However, following the rapid growth stage, the absence of supplementary water renders soil moisture a critical factor in the influence of transpiration rates. This may lead to a diminished effect of pre-sowing soil moisture conditions [31,43,44,45]. Such dynamics could indicate the closer alignment of simulated results with the observations in those groups following the jointing stage. Additionally, during the regreening stage, the meteorological conditions for crop growth under treatments P1 and CK (which did not receive effective rainfall during the same period) were relatively comparable. Nonetheless, as indicated in Figure 2, there were still observable differences in transpiration measurements across the various treatments. These discrepancies further indicate that these differences may arise from the varying growth conditions of winter wheat. These analyses suggest that the model struggled to accurately capture the spatial heterogeneity present within this experimental field.
3.2. Construction of Joint Distributions and Analysis of Regional Drought Characteristics
The construction of joint probability distributions for analyzing regional drought characteristics using copulas is significantly influenced by the volume and the dispersion of data series [86,87,88]. Generally, drought data are collected as independent events with non-drought periods before and after, which may overlook short-term droughts within prolonged droughts. This can misrepresent duration and severity distributions, particularly in regions with limited sample sizes like AH and JS. To address this issue, this study subdivided continuous long-term droughts into multiple short-term, non-independent drought events, which enhance the modeling of their joint probability distributions [92]. Table 3 presented the results of the 10-fold cross-validation analysis that determined the optimal univariate marginal distribution for drought characteristics identified by WDSI across various geographical planting areas. The findings indicated that the GAM distribution best fitted duration in JJJ, AH, and JH, and severity in JJJ, SD, and JS. Conversely, the duration of drought in the planting areas of SD and HN, as well as the severity in AH, were better fitted by the WB distribution. Table 4 presents the 10-fold cross-validation for the selection of optimal copula functions across different geographical planting areas. The results suggest that the Gaussian copula was more suitable for modeling the binary joint distribution of drought duration and severity in the planting areas of JJJ, SD, and HN. In contrast, the Clayton copula was more appropriate for modeling the same relationships in the AH and JS regions.
Table 3.
The average p-value obtained from a 10-fold cross-validation of the K-S goodness-of-fit test for the univariate marginal distribution of drought event characteristics (DWDSI and SWDSI) in different geographical planting areas.
Table 4.
The average performance evaluation metrics from a 10-fold cross-validation for selection of copulas function at different geographical planting areas.
Figure 3 demonstrated significant regional variability in the duration and severity of agricultural droughts identified by the WDSI. As indicated by the consistent characteristics of return periods, both short-term, high-severity droughts and long-term, low-severity droughts can have comparable adverse impacts [42,92]. There appeared to be a strong correlation between the characteristics of drought with the local climatic conditions. In JJJ, droughts were both longer and more severe (Figure 3a), likely due to unfavorable precipitation and soil moisture during the winter wheat growing season. In SD and HN, drought severities were comparable; however, droughts in HN persisted for a longer period (Figure 3b,c). This disparity may be attributed to differences in water and thermal conditions between the two areas. SD experienced more severe but shorter droughts due to less favorable precipitation conditions. HN benefited from better precipitation conditions, which mitigated drought severity, despite facing higher evapotranspiration demands resulting from more favorable thermal conditions. AH and JS exhibited advantageous precipitation conditions, resulting in shorter and less severe droughts (Figure 3d,e). However, the higher evapotranspiration rates in AH could potentially intensify drought conditions. The observed spatial variations in drought characteristics highlighted the necessity for the tailored joint distribution model and customized drought grade thresholds for different winter wheat planting areas.
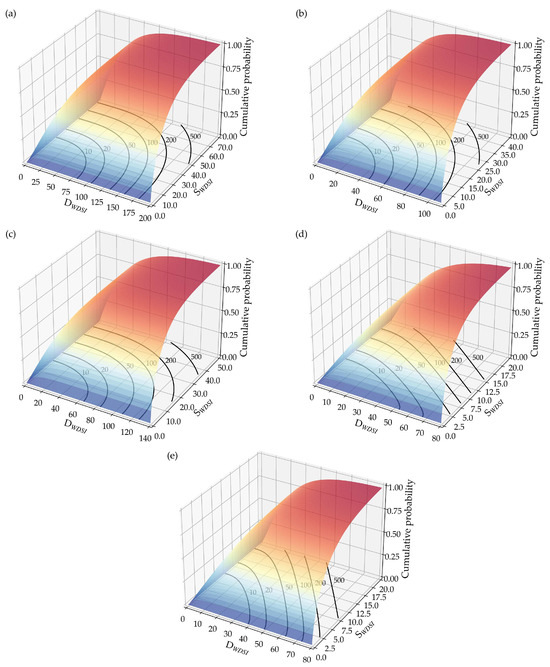
Figure 3.
Joint cumulative probability distributions and isolines of joint return periods of drought duration (DWDSI) and severity (SWDSI) identified by the Winter Wheat Drought Stress Index (WDSI) in the (a) Jing-Jin-Ji (JJJ), (b) Shandong (SD), (c) Henan (HN), (d) Anhui (AH), and (e) Jiangsu (JS) winter wheat planting aeras.
3.3. Establishment of Drought Grade Thresholds for WDAI in Assessing Drought Impact
3.3.1. Trigger Thresholds of Drought Disaster
The evolution of historical disasters in training set events can be analyzed through the construction of the daily WDAI series. As drought progressed, there was an increase in daily WDAI values, which correlated with both the duration and severity of the drought. By adjusting the triggering threshold for drought disasters by increments of 0.01, it was possible to identify the potential onset and recovery phases for each sample. The accurate and timely identification of a drought disaster suggests that the identified duration from onset to recovery should encompass actual recorded data. This requirement underscores the importance of ensuring that the identification of the disasters’ onset occurs no later than the actual onset time, as the recovery from drought is predominantly influenced by factors such as precipitation and irrigation conditions. Figure 4 illustrates that the values 0.24, 0.37, 0.36, 0.35, and 0.45 signify the critical transition points of the from values equal to 1 to those below 1 across five distinct planting areas. These identified values served as the optimal trigger thresholds for WDAI in subsequent analyses. It was evident that lower trigger thresholds tended to identify more disaster days. However, this heightened sensitivity to drought impact also resulted in the misclassification of unaffected days as drought-impacted. Overly sensitive trigger thresholds may impede effective strategies for the prevention and mitigation of drought disasters and adversely affect the economic returns of farmers. Moreover, they may lead to unnecessary expenditures and the inefficient utilization of water and energy resources [6,16,17].
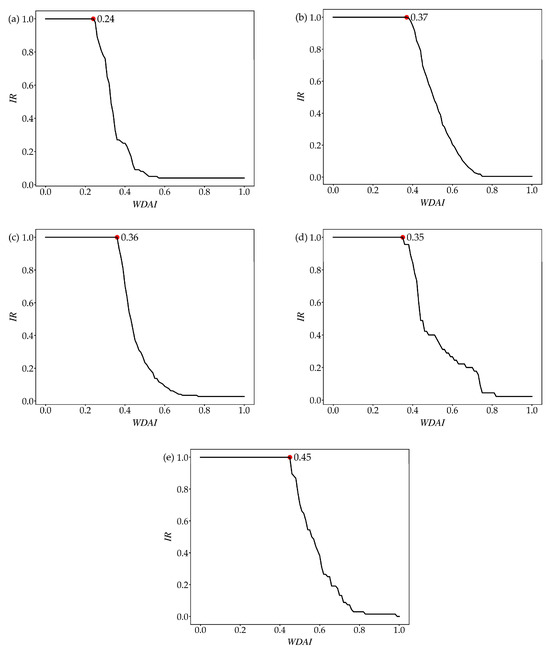
Figure 4.
The relationship between the identification rate (IR) of training disaster samples and the test trigger thresholds of the Winter Wheat Drought Assessment Index (WDAI) in the (a) Jing-Jin-Ji (JJJ), (b) Shandong (SD), (c) Henan (HN), (d) Anhui (AH), and (e) Jiangsu (JS) winter wheat planting aeras. The red dot represents the optimal trigger thresholds determined according to the criteria outlined in Section 2.3.4.
3.3.2. Critical Thresholds of Mild–Moderate and Moderate–Severe Drought
To determine the optimal critical thresholds for moderate and mild drought disasters, threshold tests were conducted using a step size of 0.01 on training disaster samples from five distinct planting areas. Subsequently, ROC curves were subsequently generated to assess the accuracy of these models (Figure 5). The lower and upper bounds of the test thresholds for each planting area were established based on previously determined trigger thresholds for the onset of drought disasters and a maximum value of 1, respectively. The results indicated that the classification models achieved AUC values of 0.86, 0.97, 0.87, 0.96, and 0.85 across the various planting areas, reflecting a classification accuracy categorized as ‘good’ or better. Notably, the AUC values for the classification models of the SD and AH exceeded 0.9, signifying an ‘excellent’ level of accuracy. The examination of the ROC curves revealed that elevated test thresholds enhanced the accuracy of identifying moderate drought conditions. However, this strategy resulted in the erroneous classification of certain moderate drought cases as mild ones, thereby leading to an underestimation of the impact of the disaster. In contrast, decreased test thresholds improve the accuracy of identifying mild droughts. However, this strategy similarly caused the misclassification of certain mild drought cases as moderate ones, resulting in the overestimation of disaster impacts. Both situations pose significant risks of erroneous decision-making, which may lead to unfavorable consequences. Optimal critical thresholds for mild and moderate drought were selected based on JI values, yielding thresholds of 0.72, 0.79, 0.79, 0.84, and 0.85, respectively. Similarly, the optimal critical thresholds for moderate and severe drought were established at 0.90, 0.95, 0.95, 0.97, and 0.98 (Figure 6). Overall, the classification model for moderate and severe droughts exhibited comparatively lower performance than the models for mild and moderate droughts across the five planting areas; however, the accuracy of these models still achieved a ‘good’ rating. This discrepancy may be attributed to the imbalance in sample sizes across varying grades and the range of test threshold values utilized in the models. Based on this analysis, we established the drought grade thresholds for WDAI tailored to different geographical planting areas (Table 5).
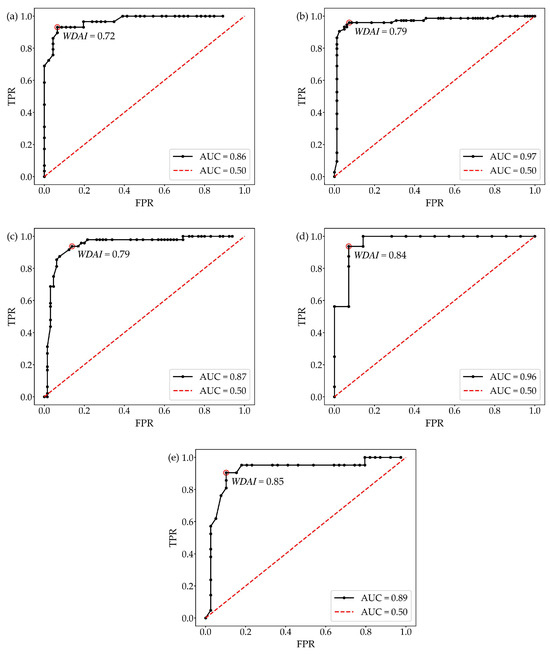
Figure 5.
Receiver Operating Characteristic (ROC) curve and test critical threshold for the classification of moderate and mild drought disasters in the (a) Jing-Jin-Ji (JJJ), (b) Shandong (SD), (c) Henan (HN), (d) Anhui (AH), and (e) Jiangsu (JS) winter wheat planting aeras. The black dots represent different test thresholds of the Winter Wheat Drought Assessment Index (WDAI), and the red circle represents the test threshold with the highest Youden Index (JI). The construction of ROC involves plotting various pairs of true positive rate (TPR) values against corresponding false positive rate (FPR) values. The black dotted line represents the model’s simulation. The red dashed line indicates the performance of a classifier that operates purely at random, which corresponds to an area under the ROC curve (AUC) of 0.5.
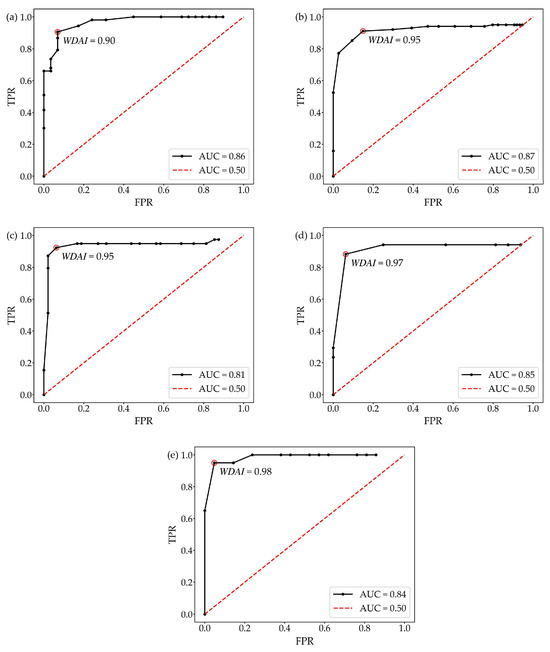
Figure 6.
Receiver Operating Characteristic (ROC) curve and test critical threshold for the classification of severe and moderate drought disasters in the (a) Jing-Jin-Ji (JJJ), (b) Shandong (SD), (c) Henan (HN), (d) Anhui (AH), and (e) Jiangsu (JS) winter wheat planting aeras. The black dots represent different test thresholds of the Winter Wheat Drought Assessment Index (WDAI), and the red circle represents the test threshold with the highest Youden Index (JI). The construction of ROC involves plotting various pairs of true positive rate (TPR) values against corresponding false positive rate (FPR) values. The black dotted line represents the model’s simulation. The red dashed line indicates the performance of a classifier that operates purely at random, which corresponds to an area under the ROC curve (AUC) of 0.5.
Table 5.
Drought grade thresholds of the Winter Wheat Drought Assessment Index (WDAI) in different geographical planting areas.
3.4. Validation for the Drought Grade Thresholds of WDAI
The drought characteristics of disaster samples in the testing set were analyzed and plotted within the established drought grade spaces of WDAI to validate their effectiveness (Figure 7). In general, the drought disaster identification results based on WDAI were basically consistent with the historical records of drought grades of winter wheat disaster samples. Overall, the results of drought disaster identification utilizing WDAI were largely in agreement with historical records regarding the drought grades of winter wheat disaster samples. Specifically, the testing of mild drought samples yielded an average CCR of 89.39% (JJJ: 14 of 14 samples; SD: 22 of 25 samples; HN: 12 of 15 samples; AH: 7 of 7 samples; JS: 4 of 5 samples) and an average MCR of 95.45% (JJJ: 14 of 14 samples; SD: 23 of 25 samples; HN: 14 of 15 samples; AH: 7 of 7 samples; JS: 5 of 5 samples). In terms of moderate drought samples, an average CCR of 81.97% (JJJ: 9 of 11 samples; SD: 16 of 20 samples; HN: 15 of 18 samples; AH: 2 of 2 samples; JS: 8 of 10 samples) and an average MCR of 100% (JJJ: 11 of 11 samples; SD: 20 of 20 samples; HN: 18 of 18 samples; AH: 2 of 2 samples; JS: 10 of 10 samples) were achieved. Lastly, for severe drought samples, an average CCR of 91.49% (JJJ: 9 of 10 samples; SD: 19 of 21 samples; HN: 7 of 8 samples; AH: 3 of 3 samples; JS: 5 of 5 samples) and an average MCR of 95.74% (JJJ: 10 of 10 samples; SD: 20 of 21 samples; HN: 7 of 8 samples; AH: 3 of 3 samples; JS: 5 of 5 samples) were achieved.
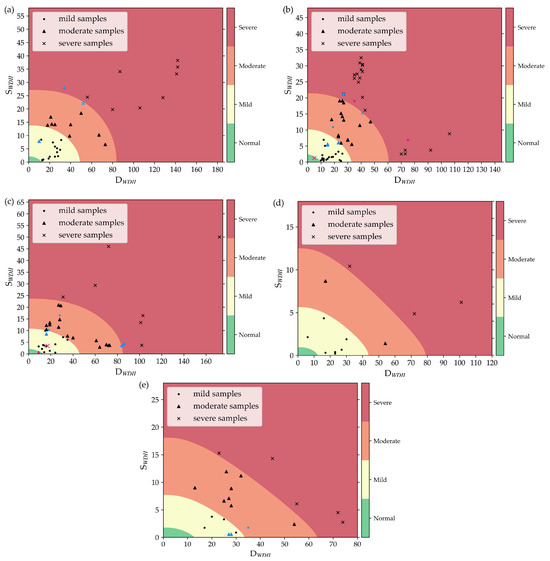
Figure 7.
Distribution of testing drought disaster samples in drought grade spaces for the Winter Wheat Drought Assessment Index (WDAI) constructed based on the duration (DWDSI) and severity (SWDSI) characteristics of drought events at (a) Jing-Jin-Ji (JJJ), (b) Shandong (SD), (c) Henan (HN), (d) Anhui (AH), and (e) Jiangsu (JS) winter wheat planting aeras. The black samples indicate ‘complete correspondence’, the blue samples indicate ‘mainly correspondence’, and the red samples indicate ‘completely incorrect’.
To further validate the effectiveness of WDAI, this study investigated a significant regional-scale drought disaster affecting winter wheat in the HHH region from mid-March to early May in 2011. This drought process was previously excluded from earlier analyses. According to the Yearbook of Meteorological Disasters in China (2012), the HHH region experienced a prolonged period of low precipitation from April to early May, leading to mild to moderate drought that adversely impacted the jointing and heading stages of winter wheat. Beneficial rainfall occurred between May 7th and 11th and alleviated the persistent drought. Figure 8 illustrated the spatial evolution of drought in the HHH region, as identified by the WDAI, under rain-fed conditions from 11 March to 10 May 2011. The analysis revealed that the drought grades identified by WDAI were generally more severe in the northern parts of the HHH region. This discrepancy may be attributed to the critical irrigation period for winter wheat during the jointing and heading stages [31,94]. Despite the absence of detailed irrigation data at the regional scale, farmers conducted spring irrigation due to extensive drought conditions in the autumns and winters of 2010 and 2011 (https://www.moa.gov.cn/ztzl/2011sxsc/sxdt/ (accessed on 25 October 2024)). Remote sensing drought indices revealed that winter wheat in the primary irrigation zones of the HHH region typically experienced the highest frequence of mild drought during the jointing to heading stages, while moderate to severe drought was prevalent in non-irrigated areas [26,95]. Comprehensive disaster records from the Meteorological Disaster Management System revealed that the drought disaster had become widespread by 20 March 2011, escalating to moderate to severe drought by May 2011 in regions without irrigation. Rainfall between May 6th and 11th mitigated or terminated drought disasters in most parts of the northern HHH region, including JJJ, SD, and HN, as illustrated in Figure 8. In contrast, regions such as AH and JS, which were experiencing mild drought conditions, did not receive any precipitation, thereby causing the drought to persist. Overall, the WDAI effectively captured regional drought conditions, providing robust evidence for its capacity to identify winter wheat drought in the HHH region.

Figure 8.
Spatial evolution of drought identified by the Winter Wheat Drought Assessment Index (WDAI) under rain-fed conditions for a reserved typical regional drought process of the Huang-Huai-Hai (HHH) region in 2011.
4. Discussion
4.1. Incorporating Soil Moisture and Crop Resistance Has Improved Drought Monitoring Capabilities
Soil moisture before sowing plays a vital role in the early development and yield of winter wheat, especially in regions characterized by limited precipitation and irrigation [57,94]. Under such conditions, pre-sowing soil moisture can account for as much as 40-50% of total evapotranspiration [96]. Therefore, integrating pre-sowing moisture into the evaluation process is imperative to avoid misinterpreting drought impacts, especially prior to the regreening stage. Additionally, the drought resistance of winter wheat is crucial influence the impact of drought and exhibits significant variability across different geographical locations and growth periods. In water-limited areas, drought-resistant varieties are vital for yield improvement, while in regions with adequate water, other traits such as resistance to lodging, diseases, and pests are prioritized [26,47]. Failure to adequately consider the variation among winter wheat varieties may result in an underestimation of their root growth potential and the availability of effective soil moisture, which could subsequently lead to an overestimation of the impact of drought disasters [45,47,91]. Additionally, shifts in the growth period can also induce changes in drought resistance, significantly affecting the supply and demand dynamics of winter wheat [20,32,41,42]. The development of the WDAI is grounded in a robust physical framework that comprehensively captures the complex intricacies of soil moisture, crop varieties, and growth stages on drought conditions in winter wheat. Furthermore, its employment of binary joint probability modeling provides a statistical perspective that connects drought evolution to the impact on winter wheat. In the subsequent analysis, we will demonstrate the advantages of WDAI by comparing it with commonly utilized crop evapotranspiration indices and soil moisture indices in the HHH region.
The Crop Water Deficit Index (CWDI) is a widely used agricultural drought index in the HHH region, effectively capturing the multifaceted influences of soil, vegetation, and meteorological elements on crop water deficiency [5,97]. Similarly, the Relative Soil Moisture Index (RSMI) is frequently employed in this area and demonstrates a strong correlation with winter wheat yields [98]. Importantly, RSMI is characterized by well-defined drought impact grade thresholds, which enhance its utility in regional drought assessments [99]. Here, we conducted a comparative analysis of the CWDI, RSMI, and WDAI to evaluate their effectiveness in monitoring winter wheat drought from autumn to winter during the 2010–2011 growing season under rain-fed conditions (Figure 9). WDAI identified the limited drought in late November, aligning closely with actual drought records. CWDI identified the onset of a regional drought disaster in the HHH region as early November. In contrast, the CWDI signaled the onset of a regional drought disaster in the HHH region as early November. This difference may be attributed to the influence of pre-sowing soil moisture, which mitigates the adverse impact of insufficient precipitation during the early growth stage of winter wheat and postpones the development of drought in crops [50,51]. The RSMI incorporated pre-sowing soil moisture and identified regional drought emerging in mid to late November. However, there is a tendency to overestimate both the spatial extent and magnitude of drought impacts when compared to recorded disaster impacts. This discrepancy may be attributed to the challenges encountered in determining the parameters and grade thresholds of RSMI, which are inherently connected to the intricate nature of diverse crop varieties and their specific growth conditions [72,73,91]. Following precipitation events in mid-December in the southern HHH region, all three indices indicated signs of recovery; however, the RSMI demonstrated a lower sensitivity to these relatively minor precipitation events during the early growth stage of winter wheat compared to the other two indices. In late December, the HHH region experienced a significant drought disaster, during which CWDI exhibited heightened sensitivity to the development of drought in the northern areas, resulting in an overestimation of its impact. Both RSMI and WDAI effectively identified regional drought conditions during this period, although the RSMI underestimated drought impacts in February and March of the subsequent year. This discrepancy may be attributed to the compensation mechanism of the root system, whereby the utilization of deeper soil moisture reduces the variations in shallower soil moisture (<0.5 m). The actual availability of water within the entire root zone of the crops may have been significantly depleted. By late February, extensive rainfall prompted these indices to indicate the cessation of drought conditions. It is important to note that CWDI exhibited heightened sensitivity to minor rainfall events, especially in specific areas of JJJ. In contrast, both the WDAI and RSMI demonstrated a more stable and gradual response to these changes in weather conditions. Compared to WDAI, the analysis of drought evolution conducted by RSMI revealed inconsistencies in its assessment of drought impacts across different regions, highlighting the ongoing necessity to refine its parameters and drought grade thresholds for winter wheat in the HHH region.
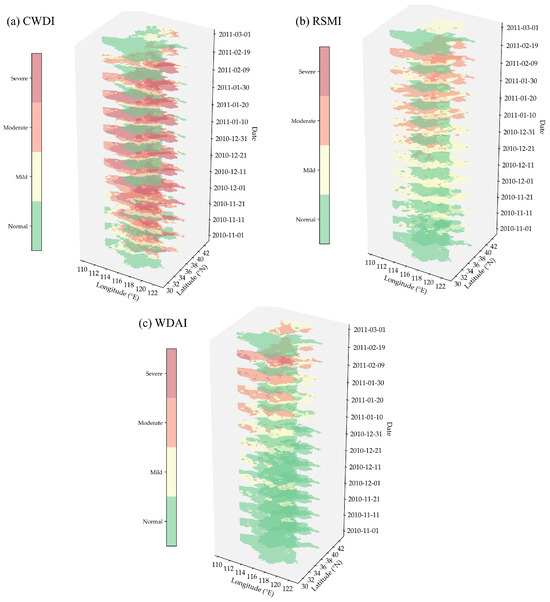
Figure 9.
Spatial evolution of autumn to winter drought identified by (a) the Crop Water Deficit Index (CWDI), (b) Relative Soil Moisture Index (RSMI), and (c) the Winter Wheat Drought Assessment Index (WDAI) under rain-fed conditions for a typical regional drought process of the Huang-Huai-Hai (HHH) region in 2010–2011.
In summary, this comparative analysis highlighted the enhanced effectiveness of the WDAI in monitoring early-stage drought impacts for winter wheat. This superiority was largely attributed to the incorporation of pre-sowing soil moisture alongside the drought resistance of the crops in drought assessment.
4.2. WDAI Provides Valuable Information for Irrigation
Considering the significant impact of irrigation on improving the effectiveness of agricultural drought monitoring [26,95], it is essential to investigate its association with drought conditions during the winter wheat growing season in the HHH region. Irrigation primarily occurs at several key stages: before sowing (I0), prior to overwintering (I1), during the regreening to jointing stage (I2), from jointing to heading stage (I3), and from flowering to milk stage (I4) [15,46,100]. Due to the limitations of the transpiration index, which can only be obtained following post-emergence, the analysis was confined to the frequency distribution observed on the day prior to the irrigation practices that occurred at various stages post-emergence (Figure 10). The findings suggested that the primary period of irrigation occurred in the spring, particularly during stages I2 to I4, with the highest frequency observed from the regreening to the jointing stages. These results align with previous research on the water use characteristics of winter wheat in the HHH region [47,94]. It was noteworthy that the overall irrigation frequency during stage I2 was significantly elevated, which could be attributed to the information collected from historical drought event samples. In this context, the primary objective of irrigation was to alleviate drought conditions; however, this approach might diverge from the intended goals of irrigation under normal meteorological conditions. Irrigation in I3 and I4 is generally more closely linked to growth status and soil moisture requirements, functioning as a regulatory mechanism for irrigation following the jointing stage [94,101]. This phenomenon partially elucidated the increased frequency of irrigation following the onset of mild drought conditions, as compared to non-disaster scenarios, in these phases. An alternative explanation may be that drought has already impacted the morphological development of winter wheat, yet the subsequent effects on yield remain limited and have not reached the onset of a drought disaster. Manual assessments may lead to the initiation of irrigation prior to the identification of disaster onset as identified by WDAI. This may suggest that the irrigation trigger threshold established by the WDAI is, in fact, lower than the trigger threshold of drought disasters. In summary, the WDAI can offer more nuanced and valuable insights for the execution of irrigation management strategies.

Figure 10.
Heat map of primary irrigation phases and associated drought grades on the day prior to irrigation time identified by the Winter Wheat Drought Assessment Index (WDAI). I1–I4 are the primary phases for irrigation of winter wheat in HHH region. I1 represents irrigation occurring before the overwintering stage, I2 represents irrigation occurring at regreening to jointing stage, I3 represents irrigation occurring at late stage of jointing to heading stage, and I4 represents irrigation occurring at flowering to milk stage. The larger and red circles indicate a higher frequency of occurrence, while smaller and purple circles signify a lower frequency of occurrence.
4.3. Limitations and Developments
The fundamental aspect of conducting daily drought monitoring for winter wheat utilizing WDAI involves the daily operation of the WBWW model. This process aims to generate simulated values for both actual transpiration and potential transpiration, as well as to identify the evolution of drought. The methodology for drought monitoring and assessment is theoretically adaptable to various regions with differing climatic and soil characteristics. Nevertheless, as each sub-model and parameter configuration within the monitoring system is specifically customized for the HHH region, the potential for broader applicability in other areas depends on the availability of pertinent data. Currently, even with the ongoing practical application in the HHH region, several significant challenges have arisen.
Specifically, the WBWW model employs soil moisture data obtained from field observations collected at automated monitoring stations, with the earliest recorded data dating back to 1 January 2010. The temporal availability of soil moisture data, coupled with the spatial heterogeneity of these measurements poses significant constraints on the application of WDAI for investigating historical and future climate scenario trends and patterns of drought variation in the HHH region [27,102]. In recent years, significant progress has been made in soil moisture modeling through the application of machine learning and deep learning techniques [31,103,104]. Data-driven models have demonstrated superior performance in soil moisture prediction. Further integrating machine learning or deep learning methodologies for soil moisture prediction in our developed drought monitoring framework can significantly expand the application scope of the WDAI and promote the advancement of an intelligent drought monitoring system.
In the context of climate change, the application of drought indices faces numerous challenges related to the monitoring, forecasting, and management of drought conditions. Climate change has the potential to alter the patterns of drought occurrence, duration, and severity [8,9,105]. For example, some regions may experience droughts that are both more frequent and more severe, while in other areas drought cycles may become increasingly unpredictable [14,19]. Such variability complicates the adaptation of existing drought indices to the evolving climatic conditions. Typically, drought indices rely on fixed algorithms, parameters, and thresholds; however, as climate change progresses, these established standards may no longer be applicable, potentially resulting in the misinterpretations of drought conditions. Recently, several non-stationary drought indices, such as the Nonstationary Standardized Precipitation Index (NSPI) [106], the Nonstationary Standardized Precipitation Evapotranspiration Index (NSPEI) [107], and the Nonstationary Standardized Precipitation Evapotranspiration Index and Crop Coefficient (NSPEI-kc) [108], have been introduced, showing improved performance in the context of climate change. Future research will focus on enhancing the monitoring capabilities of WDAI by implementing adjustments for its probability distribution parameters to account for non-stationarity.
5. Conclusions
In this study, we developed a novel process-based transpiration drought index (WDAI) for the daily monitoring and assessment of drought impacting winter wheat in the HHH region based on the WBWW model. Validation results of the model indicated a robust correlation (R2 = 0.7573) between the simulated transpiration values and the observed data from field experiments, thereby confirming the effectiveness of this approach.
Initially, we constructed WDSI to quantify drought stress and to determine both the duration and severity of drought in winter wheat. WDSI integrated the effects of atmospheric conditions, soil moisture, crop resistance, and irrigation practices on drought conditions. To capture the joint characteristics of drought duration and severity, we employed copulas and identified the most suitable binary joint distribution using the K-S test, AIC, and BIC metrics. These models revealed distinctive regional characteristics related to local climatic conditions and agricultural practices.
Subsequently, WDAI was developed from these joint distributions, taking into account the evolution process of drought. The IR metric and ROC curve method, supplemented by the JI metric, were used to establish drought grade thresholds based on training disaster samples. The validation of WDAI using testing samples demonstrated high accuracy, achieving an average CCR of 87.36% and an average MCR of 97.13%. Comparative analyses of WDAI against actual disaster records and widely used agricultural drought indices, including CWDI and RSMI, further corroborated its effectiveness.
The results of this study will significantly enhance the accuracy and timeliness of the daily dynamic monitoring of agricultural drought. This improvement can facilitate the timely formulation of effective drought prevention and mitigation strategies. Moreover, WDAI can serve as a crucial tool for advising farmers on irrigation practices, thereby minimizing water resource waste and ensuring the healthy growth of winter wheat.
Author Contributions
Q.M.: writing—original draft, writing—review and editing, software, methodology. Z.H.: writing—review and editing, conceptualization, methodology. M.L.: writing—review and editing, software, methodology, formal analysis. L.Z.: writing—review and editing, investigation. R.K.: investigation. F.Z.: investigation. Y.W.: validation. Y.H.: validation. All authors have read and agreed to the published version of the manuscript.
Funding
This study was supported by the National Key Research and Development Program of China (2022YFD2300202), the Key Innovative Team of Agricultural Meteorology of the China Meteorological Administration (CMA2024ZD02), and the Basic Research Fund of Chinese Academy of Meteorological Sciences (2024Z001). The authors are grateful to Henan Institute of Meteorological Sciences for providing field experiment data and transpiration observations in this paper. The authors would like to thank the editors and anonymous reviewers for their helpful and constructive comments to improve this manuscript.
Data Availability Statement
Data will be made available on request.
Conflicts of Interest
The authors declare that they have no known competing financial interests or personal relationships that could have appeared to influence the work reported in this paper.
References
- Huang, H.; Huang, J.; Li, X.; Zhuo, W.; Wu, Y.; Niu, Q.; Su, W.; Yuan, W. A dataset of winter wheat aboveground biomass in China during 2007–2015 based on data assimilation. Sci. Data 2022, 9, 200. [Google Scholar] [CrossRef]
- Wu, X.; Wang, P.; Huo, Z.; Wu, D.; Yang, J. Crop Drought Identification Index for winter wheat based on evapotranspiration in the Huang-Huai-Hai Plain, China. Agric. Ecosyst. Environ. 2018, 263, 18–30. [Google Scholar] [CrossRef]
- Wu, J.; Wang, N.; Xing, X.; Ma, X. Loss of Net primary production of seasonal winter wheat due to multiple drought types in the main Grain-Producing area of China. J. Hydrol. 2023, 625, 130093. [Google Scholar] [CrossRef]
- Ma, Q.; Li, Y.; Liu, F.; Feng, H.; Biswas, A.; Zhang, Q. SPEI and multi-threshold run theory based drought analysis using multi-source products in China. J. Hydrol. 2023, 616, 128737. [Google Scholar] [CrossRef]
- Zhang, Y.; Wang, P.; Chen, Y.; Yang, J.; Wu, D.; Ma, Y.; Huo, Z.; Liu, S. Daily dynamic thresholds of different agricultural drought grades for summer maize based on the Vegetation Water Index. J. Hydrol. 2023, 625, 130070. [Google Scholar] [CrossRef]
- Liu, J.; Si, Z.; Li, S.; Kader Mounkaila Hamani, A.; Zhang, Y.; Wu, L.; Gao, Y.; Duan, A. Variations in water sources used by winter wheat across distinct rainfall years in the North China Plain. J. Hydrol. 2023, 618, 129186. [Google Scholar] [CrossRef]
- Wang, C.; Ye, J.; Zhai, Y.; Kurexi, W.; Xing, D.; Feng, G.; Zhang, Q.; Zhang, Z. Dynamics of Moistube discharge, soil-water redistribution and wetting morphology in response to regulated working pressure heads. Agric. Water Manag. 2023, 282, 108285. [Google Scholar] [CrossRef]
- Yang, C.; Liu, C.; Liu, Y.; Gao, Y.; Xing, X.; Ma, X. Prediction of drought trigger thresholds for future winter wheat yield losses in China based on the DSSAT-CERES-Wheat model and Copula conditional probabilities. Agric. Water Manag. 2024, 299, 108881. [Google Scholar] [CrossRef]
- Yao, N.; Li, L.; Feng, P.; Feng, H.; Li Liu, D.; Liu, Y.; Jiang, K.; Hu, X.; Li, Y. Projections of drought characteristics in China based on a standardized precipitation and evapotranspiration index and multiple GCMs. Sci. Total Environ. 2020, 704, 135245. [Google Scholar] [CrossRef]
- Zhao, T.; Dai, A. Uncertainties in historical changes and future projections of drought. Part II: Model-simulated historical and future drought changes. Clim. Change 2017, 144, 535–548. [Google Scholar] [CrossRef]
- Wang, R.; Zhao, H.; Qi, Y.; Zhao, F.; Chen, F.; Ding, W.; Jiang, J.; Zhang, K.; Wang, H. Onset and severity thresholds of drought impacts on wheat. Agric. Water Manag. 2023, 281, 108259. [Google Scholar] [CrossRef]
- Xu, Y.; Zhang, X.; Hao, Z.; Hao, F.; Li, C. Projections of future meteorological droughts in China under CMIP6 from a three-dimensional perspective. Agric. Water Manag. 2021, 252, 106849. [Google Scholar] [CrossRef]
- Markonis, Y.; Kumar, R.; Hanel, M.; Rakovec, O.; Máca, P.; AghaKouchak, A. The rise of compound warm-season droughts in Europe. Sci. Adv. 2021, 7, eabb9668. [Google Scholar] [CrossRef]
- Zhou, S.; Zhang, Y.; Park Williams, A.; Gentine, P. Projected increases in intensity, frequency, and terrestrial carbon costs of compound drought and aridity events. Sci. Adv. 2019, 5, eaau5740. [Google Scholar] [CrossRef]
- Li, H.; Zheng, L.; Lei, Y.; Li, C.; Liu, Z.; Zhang, S. Estimation of water consumption and crop water productivity of winter wheat in North China Plain using remote sensing technology. Agric. Water Manag. 2008, 95, 1271–1278. [Google Scholar] [CrossRef]
- Pérez-Blanco, C.D.; Hrast-Essenfelder, A.; Perry, C. Irrigation Technology and Water Conservation: A Review of the Theory and Evidence. Rev. Environ. Econ. Policy 2020, 14, 216–239. [Google Scholar] [CrossRef]
- Cai, Y.; Yao, C.; Wu, P.; Zhang, L.; Zhu, D.; Chen, J.; Du, Y. Effectiveness of a subsurface irrigation system with ceramic emitters under low-pressure conditions. Agric. Water Manag. 2021, 243, 106390. [Google Scholar] [CrossRef]
- Zhang, Y.; Hao, Z.; Feng, S.; Zhang, X.; Xu, Y.; Hao, F. Agricultural drought prediction in China based on drought propagation and large-scale drivers. Agric. Water Manag. 2021, 255, 107028. [Google Scholar] [CrossRef]
- IPCC. Climate Change 2021—The Physical Science Basis: Working Group I Contribution to the Sixth Assessment Report of the Intergovernmental Panel on Climate Change; Cambridge University Press: Cambridge, UK, 2023. [Google Scholar]
- Wu, D.; Li, Z.; Zhu, Y.; Li, X.; Wu, Y.; Fang, S. A new agricultural drought index for monitoring the water stress of winter wheat. Agric. Water Manag. 2021, 244, 106599. [Google Scholar] [CrossRef]
- Song, C.; Yue, C.; Zhang, W.; Zhang, D.; Hong, Z.; Meng, L. A remote sensing-based method for drought monitoring using the similarity between drought eigenvectors. Int. J. Remote Sens. 2019, 40, 8838–8856. [Google Scholar] [CrossRef]
- Jiao, W.; Wang, L.; McCabe, M.F. Multi-sensor remote sensing for drought characterization: Current status, opportunities and a roadmap for the future. Remote Sens. Environ. 2021, 256, 112313. [Google Scholar] [CrossRef]
- Rouse, J.W.; Haas, R.H.; Schell, J.A.; Deering, D.W. Monitoring Vegetation Systems in the Great Plains with ERTS. NASA Spec. Publ. 1974, 351, 309. [Google Scholar]
- Gao, B.-C. NDWI—A normalized difference water index for remote sensing of vegetation liquid water from space. Remote Sens. Environ. 1996, 58, 257–266. [Google Scholar] [CrossRef]
- Jin, S.; Sader, S.A. Comparison of time series tasseled cap wetness and the normalized difference moisture index in detecting forest disturbances. Remote Sens. Environ. 2005, 94, 364–372. [Google Scholar] [CrossRef]
- Zhao, J.; Peng, H.; Yang, J.; Huang, R.; Huo, Z.; Ma, Y. Response of winter wheat to different drought levels based on Google Earth Engine in the Huang-Huai-Hai Region, China. Agric. Water Manag. 2024, 292, 108662. [Google Scholar] [CrossRef]
- Jin, N.; Shi, Y.; Niu, W.; He, L. Spatial and temporal patterns of agricultural drought in China during 1960–2020 characterized by use of the crop water deficit Abnormal Index. J. Hydrol. 2023, 627, 130454. [Google Scholar] [CrossRef]
- Smith, W.K.; Dannenberg, M.P.; Yan, D.; Herrmann, S.; Barnes, M.L.; Barron-Gafford, G.A.; Biederman, J.A.; Ferrenberg, S.; Fox, A.M.; Hudson, A.; et al. Remote sensing of dryland ecosystem structure and function: Progress, challenges, and opportunities. Remote Sens. Environ. 2019, 233, 111401. [Google Scholar] [CrossRef]
- Han, J.; Fang, S.; Mi, Q.; Wang, X.; Yu, Y.; Zhuo, W.; Peng, X. A time-continuous land surface temperature (LST) data fusion approach based on deep learning with microwave remote sensing and high-density ground truth observations. Sci. Total Environ. 2024, 914, 169992. [Google Scholar] [CrossRef]
- Lin, J.; Zhou, L.; Wu, J.; Han, X.; Zhao, B.; Chen, M.; Liu, L. Water stress significantly affects the diurnal variation of solar-induced chlorophyll fluorescence (SIF): A case study for winter wheat. Sci. Total Environ. 2024, 908, 168256. [Google Scholar] [CrossRef]
- Cheng, F.; Zhang, Z.; Zhuang, H.; Han, J.; Luo, Y.; Cao, J.; Zhang, L.; Zhang, J.; Xu, J.; Tao, F. ChinaCropSM1 km: A fine 1 km daily soil moisture dataset for dryland wheat and maize across China during 1993–2018. Earth Syst. Sci. Data 2023, 15, 395–409. [Google Scholar] [CrossRef]
- Zhou, L.; Lin, J.; Wu, J.; Du, R.; Chen, M.; Zhao, B.; Yang, R. Assessing the potential of red solar-induced chlorophyll fluorescence for drought monitoring in different growth stages of winter wheat. Ecol. Indic. 2024, 161, 111960. [Google Scholar] [CrossRef]
- Kannenberg, S.A.; Anderegg, W.R.L.; Barnes, M.L.; Dannenberg, M.P.; Knapp, A.K. Dominant role of soil moisture in mediating carbon and water fluxes in dryland ecosystems. Nat. Geosci. 2024, 17, 38–43. [Google Scholar] [CrossRef]
- Nguyen, T.H.; Langensiepen, M.; Gaiser, T.; Webber, H.; Ahrends, H.; Hueging, H.; Ewert, F. Responses of winter wheat and maize to varying soil moisture: From leaf to canopy. Agric. For. Meteorol. 2022, 314, 108803. [Google Scholar] [CrossRef]
- Yang, Z.; Tian, J.; Wang, Z.; Feng, K.; Ouyang, Z.; Zhang, L.; Yan, X. Coupled soil water stress and environmental effects on changing photosynthetic traits in wheat and maize. Agric. Water Manag. 2023, 282, 108246. [Google Scholar] [CrossRef]
- Hao, Z.; AghaKouchak, A.; Nakhjiri, N.; Farahmand, A. Global integrated drought monitoring and prediction system. Sci. Data 2014, 1, 140001. [Google Scholar] [CrossRef] [PubMed]
- Martínez-Fernández, J.; González-Zamora, A.; Sánchez, N.; Gumuzzio, A.; Herrero-Jiménez, C.M. Satellite soil moisture for agricultural drought monitoring: Assessment of the SMOS derived Soil Water Deficit Index. Remote Sens. Environ. 2016, 177, 277–286. [Google Scholar] [CrossRef]
- Hao, Z.; Singh, V.P.; Xia, Y. Seasonal Drought Prediction: Advances, Challenges, and Future Prospects. Rev. Geophys. 2018, 56, 108–141. [Google Scholar] [CrossRef]
- Liu, Y.; Liu, Y.; Wang, W. Inter-comparison of satellite-retrieved and Global Land Data Assimilation System-simulated soil moisture datasets for global drought analysis. Remote Sens. Environ. 2019, 220, 1–18. [Google Scholar] [CrossRef]
- Wu, J.; Gu, Y.; Sun, K.; Wang, N.; Shen, H.; Wang, Y.; Ma, X. Correlation of climate change and human activities with agricultural drought and its impact on the net primary production of winter wheat. J. Hydrol. 2023, 620, 129504. [Google Scholar] [CrossRef]
- Zhang, Y.; Wu, Z.; Singh, V.P.; He, H.; He, J.; Yin, H.; Zhang, Y. Coupled hydrology-crop growth model incorporating an improved evapotranspiration module. Agric. Water Manag. 2021, 246, 106691. [Google Scholar] [CrossRef]
- Huo, Z.; Mao, H.; Yang, J.; Wang, P.; Wu, D.; Ma, Y. Process-based evaluation indicators of grape drought and risk characteristics in the Bohai Rim Region, China. Theor. Appl. Climatol. 2022, 150, 1573–1585. [Google Scholar] [CrossRef]
- Zhang, X.; Pei, D.; Chen, S. Root growth and soil water utilization of winter wheat in the North China Plain. Hydrol. Process. 2004, 18, 2275–2287. [Google Scholar] [CrossRef]
- Liu, Z.; Ma, F.-y.; Hu, T.-x.; Zhao, K.-g.; Gao, T.-p.; Zhao, H.-x.; Ning, T.-y. Using stable isotopes to quantify water uptake from different soil layers and water use efficiency of wheat under long-term tillage and straw return practices. Agric. Water Manag. 2020, 229, 105933. [Google Scholar] [CrossRef]
- Huang, Z.; Zhang, X.; Ashton, R.W.; Hawkesford, M.J.; Whalley, W.R. Root phenotyping and root water uptake calculation using soil water contents measured in a winter wheat field. Agric. Water Manag. 2023, 290, 108607. [Google Scholar] [CrossRef]
- Li, H.; Li, L.; Liu, N.; Chen, S.; Shao, L.; Sekiya, N.; Zhang, X. Root efficiency and water use regulation relating to rooting depth of winter wheat. Agric. Water Manag. 2022, 269, 107710. [Google Scholar] [CrossRef]
- Li, L.; Li, H.; Liu, N.; Lu, Y.; Shao, L.; Chen, S.; Zhang, X. Water use characteristics and drought tolerant ability of different winter wheat cultivars assessed under whole growth circle and at seedling stage. Agric. Water Manag. 2024, 300, 108921. [Google Scholar] [CrossRef]
- Joiner, J.; Yoshida, Y.; Anderson, M.; Holmes, T.; Hain, C.; Reichle, R.; Koster, R.; Middleton, E.; Zeng, F.-W. Global relationships among traditional reflectance vegetation indices (NDVI and NDII), evapotranspiration (ET), and soil moisture variability on weekly timescales. Remote Sens. Environ. 2018, 219, 339–352. [Google Scholar] [CrossRef] [PubMed]
- Zhang, Y.; Wu, Z.; Singh, V.P.; Lin, Q.; Ning, S.; Zhou, Y.; Jin, J.; Zhou, R.; Ma, Q. Agricultural drought characteristics in a typical plain region considering irrigation, crop growth, and water demand impacts. Agric. Water Manag. 2023, 282, 108266. [Google Scholar] [CrossRef]
- Yang, B.; Wang, P.; You, D.; Liu, W. Coupling evapotranspiration partitioning with root water uptake to identify the water consumption characteristics of winter wheat: A case study in the North China Plain. Agric. For. Meteorol. 2018, 259, 296–304. [Google Scholar] [CrossRef]
- Cui, Y.; Jia, L. Estimation of evapotranspiration of “soil-vegetation” system with a scheme combining a dual-source model and satellite data assimilation. J. Hydrol. 2021, 603, 127145. [Google Scholar] [CrossRef]
- Wang, A.; Gao, X.; Zhou, Z.; Siddique, K.H.M.; Yang, H.; Wang, J.; Zhang, S.; Zhao, X. A novel index for vegetation drought assessment based on plant water metabolism and balance under vegetation restoration on the Loess Plateau. Sci. Total Environ. 2024, 918, 170549. [Google Scholar] [CrossRef]
- Tenreiro, T.R.; García-Vila, M.; Gómez, J.A.; Jimenez-Berni, J.A.; Fereres, E. Water modelling approaches and opportunities to simulate spatial water variations at crop field level. Agric. Water Manag. 2020, 240, 106254. [Google Scholar] [CrossRef]
- de Melo, M.L.A.; de Jong van Lier, Q. Revisiting the Feddes reduction function for modeling root water uptake and crop transpiration. J. Hydrol. 2021, 603, 126952. [Google Scholar] [CrossRef]
- Ajaz, A.; Taghvaeian, S.; Lollato, R.; Alderman, P.D.; Gowda, P.H. Gridded drought response assessment of winter wheat in Oklahoma using big data and AquaCrop-OS. Sci. Total Environ. 2025, 959, 178206. [Google Scholar] [CrossRef] [PubMed]
- Mansoor, S.; Chung, Y.S. Functional phenotyping: Understanding the dynamic response of plants to drought stress. Curr. Plant Biol. 2024, 38, 100331. [Google Scholar] [CrossRef]
- Dong, Z.; Zhang, X.; Li, J.; Zhang, C.; Wei, T.; Yang, Z.; Cai, T.; Zhang, P.; Ding, R.; Jia, Z. Photosynthetic characteristics and grain yield of winter wheat (Triticum aestivum L.) in response to fertilizer, precipitation, and soil water storage before sowing under the ridge and furrow system: A path analysis. Agric. For. Meteorol. 2019, 272–273, 12–19. [Google Scholar] [CrossRef]
- Celis, J.; Xiao, X.; Wagle, P.; Basara, J.; McCarthy, H.; Souza, L. A comparison of moderate and high spatial resolution satellite data for modeling gross primary production and transpiration of native prairie, alfalfa, and winter wheat. Agric. For. Meteorol. 2024, 344, 109797. [Google Scholar] [CrossRef]
- Ersi, C.; Sudu, B.; Song, Z.; Bao, Y.; Wei, S.; Zhang, J.; Tong, Z.; Liu, X.; Le, W.; Rina, S. The potential of NIRvP in estimating evapotranspiration. Remote Sens. Environ. 2024, 315, 114405. [Google Scholar] [CrossRef]
- Pereira, L.S.; Paredes, P.; Jovanovic, N. Soil water balance models for determining crop water and irrigation requirements and irrigation scheduling focusing on the FAO56 method and the dual Kc approach. Agric. Water Manag. 2020, 241, 106357. [Google Scholar] [CrossRef]
- Allen, R.G.; Pereira, L.S.; Raes, D.; Smith, M. Crop Evapotranspiration-Guidelines for Computing Crop Water Requirements-FAO Irrigation and Drainage Paper 56; FAO: Rome, Italy, 1998; Volume 300, p. D05109. [Google Scholar]
- Shuttleworth, W.J.; Wallace, J.S. Evaporation from sparse crops-an energy combination theory. Q. J. R. Meteorolog. Soc. 1985, 111, 839–855. [Google Scholar] [CrossRef]
- Ding, R.; Kang, S.; Li, F.; Zhang, Y.; Tong, L. Evapotranspiration measurement and estimation using modified Priestley–Taylor model in an irrigated maize field with mulching. Agric. For. Meteorol. 2013, 168, 140–148. [Google Scholar] [CrossRef]
- Priestley, C.H.B.; Taylor, R.J. On the Assessment of Surface Heat Flux and Evaporation Using Large-Scale Parameters. Mon. Weather Rev. 1972, 100, 81–92. [Google Scholar] [CrossRef]
- Kool, D.; Agam, N.; Lazarovitch, N.; Heitman, J.L.; Sauer, T.J.; Ben-Gal, A. A review of approaches for evapotranspiration partitioning. Agric. For. Meteorol. 2014, 184, 56–70. [Google Scholar] [CrossRef]
- Gong, X.; Liu, H.; Sun, J.; Gao, Y.; Zhang, H. Comparison of Shuttleworth-Wallace model and dual crop coefficient method for estimating evapotranspiration of tomato cultivated in a solar greenhouse. Agric. Water Manag. 2019, 217, 141–153. [Google Scholar] [CrossRef]
- Ramos, T.B.; Darouich, H.; Oliveira, A.R.; Farzamian, M.; Monteiro, T.; Castanheira, N.; Paz, A.; Gonçalves, M.C.; Pereira, L.S. Water use and soil water balance of Mediterranean tree crops assessed with the SIMDualKc model in orchards of southern Portugal. Agric. Water Manag. 2023, 279, 108209. [Google Scholar] [CrossRef]
- Li, K.Y.; De Jong, R.; Boisvert, J.B. An exponential root-water-uptake model with water stress compensation. J. Hydrol. 2001, 252, 189–204. [Google Scholar] [CrossRef]
- Peters, A. Modified conceptual model for compensated root water uptake—A simulation study. J. Hydrol. 2016, 534, 1–10. [Google Scholar] [CrossRef]
- Albasha, R.; Mailhol, J.-C.; Cheviron, B. Compensatory uptake functions in empirical macroscopic root water uptake models—Experimental and numerical analysis. Agric. Water Manag. 2015, 155, 22–39. [Google Scholar] [CrossRef]
- Mi, Q.; Li, M.; Huo, Z.; Zhang, L.; Kong, R.; Jiang, M.; Zhang, F. Simulating the Vertical Distribution of Soil Moisture for Winter Wheat Based on a Hydrodynamic-Processes-Driven Water Balance Model in the Huang-Huai-Hai Region, China. SSRN Preprint 2024. Available online: https://ssrn.com/abstract=4876023 (accessed on 15 November 2024).
- Ru, C.; Hu, X.; Chen, D.; Wang, W.; Zhen, J.; Song, T. Individual and combined effects of heat and drought and subsequent recovery on winter wheat (Triticum aestivum L.) photosynthesis, nitrogen metabolism, cell osmoregulation, and yield formation. Plant Physiol. Biochem. 2023, 196, 222–235. [Google Scholar] [CrossRef] [PubMed]
- Wang, L.; Liu, X.; Liu, X.; Bao, X.; Zhang, X.; Yin, B.; Wang, W.; Wang, Y.; Zhen, W. Effects of spring limited irrigation on grain yield and root characteristics of winter wheat in groundwater-overexploitation areas in the North China Plain. Agric. Water Manag. 2024, 294, 108729. [Google Scholar] [CrossRef]
- Zhang, X.; Chen, N.; Li, J.; Chen, Z.; Niyogi, D. Multi-sensor integrated framework and index for agricultural drought monitoring. Remote Sens. Environ. 2017, 188, 141–163. [Google Scholar] [CrossRef]
- Zhao, L.; Li, Q.; Zhang, Y.; Wang, H.; Du, X. Normalized NDVI valley area index (NNVAI)-based framework for quantitative and timely monitoring of winter wheat frost damage on the Huang-Huai-Hai Plain, China. Agric. Ecosyst. Environ. 2020, 292, 106793. [Google Scholar] [CrossRef]
- Wu, D.; Fang, S.; Li, X.; He, D.; Zhu, Y.; Yang, Z.; Xu, J.; Wu, Y. Spatial-temporal variation in irrigation water requirement for the winter wheat-summer maize rotation system since the 1980s on the North China Plain. Agric. Water Manag. 2019, 214, 78–86. [Google Scholar] [CrossRef]
- Luo, Y.; Zhang, Z.; Chen, Y.; Li, Z.; Tao, F. ChinaCropPhen1km: A high-resolution crop phenological dataset for three staple crops in China during 2000–2015 based on leaf area index (LAI) products. Earth Syst. Sci. Data 2020, 12, 197–214. [Google Scholar] [CrossRef]
- Shangguan, W.; Dai, Y.; Liu, B.; Zhu, A.; Duan, Q.; Wu, L.; Ji, D.; Ye, A.; Yuan, H.; Zhang, Q. A China data set of soil properties for land surface modeling. J. Adv. Model Earth. Syst. 2013, 5, 212–224. [Google Scholar] [CrossRef]
- Saxton, K.E.; Rawls, W.J. Soil water characteristic estimates by texture and organic matter for hydrologic solutions. Soil Sci. Soc. Am. J. 2006, 70, 1569–1578. [Google Scholar] [CrossRef]
- Wan, L.; Bento, V.A.; Qu, Y.; Qiu, J.; Song, H.; Zhang, R.; Wu, X.; Xu, F.; Lu, J.; Wang, Q. Drought characteristics and dominant factors across China: Insights from high-resolution daily SPEI dataset between 1979 and 2018. Sci. Total Environ. 2023, 901, 166362. [Google Scholar] [CrossRef]
- Chen, D.; Guo, Y.; Zhao, Y.; Zhang, J.; Liu, X.; Tong, Z.; Zhao, C. Dynamic evolution characteristics and hazard assessment of compound drought/waterlogging and low temperature events for maize. Sci. Total Environ. 2024, 946, 174427. [Google Scholar] [CrossRef]
- Zhao, Z.; Wang, H.; Yu, C.; Deng, C.; Liu, C.; Wu, Y.; Yan, J.; Wang, C. Changes in spatiotemporal drought characteristics over northeast China from 1960 to 2018 based on the modified nested Copula model. Sci. Total Environ. 2020, 739, 140328. [Google Scholar] [CrossRef] [PubMed]
- Mu, W.; Yu, F.; Xie, Y.; Liu, J.; Li, C.; Zhao, N. The Copula Function-Based Probability Characteristics Analysis on Seasonal Drought & Flood Combination Events on the North China Plain. Atmos 2014, 5, 847–869. [Google Scholar]
- Tosunoglu, F.; Can, I. Application of copulas for regional bivariate frequency analysis of meteorological droughts in Turkey. Nat. Hazard. 2016, 82, 1457–1477. [Google Scholar] [CrossRef]
- Amirataee, B.; Montaseri, M.; Rezaie, H. Regional analysis and derivation of copula-based drought Severity-Area-Frequency curve in Lake Urmia basin, Iran. J. Environ. Manag. 2018, 206, 134–144. [Google Scholar] [CrossRef] [PubMed]
- Zhang, Q.; Yu, X.; Qiu, R.; Liu, Z.; Yang, Z. Evolution, severity, and spatial extent of compound drought and heat events in north China based on copula model. Agric. Water Manag. 2022, 273, 107918. [Google Scholar] [CrossRef]
- Fang, L.; Yin, J.; Wang, Y.; Xu, J.; Wang, Y.; Wu, G.; Zeng, Z.; Zhang, X.; Zhang, J.; Meshyk, A. Machine learning and copula-based analysis of past changes in global droughts and socioeconomic exposures. J. Hydrol. 2024, 628, 130536. [Google Scholar] [CrossRef]
- Zhao, Q.; Zhang, X.; Li, C.; Xu, Y.; Fei, J. Compound ecological drought assessment of China using a Copula-based drought index. Ecol. Indic. 2024, 164, 112141. [Google Scholar] [CrossRef]
- Tawn, J.A. An extreme-value theory model for dependent observations. J. Hydrol. 1988, 101, 227–250. [Google Scholar] [CrossRef]
- Nelsen, R.B. An Introduction to Copulas; Springer: Berlin/Heidelberg, Germany, 2006. [Google Scholar]
- Ahluwalia, O.; Singh, P.C.; Bhatia, R. A review on drought stress in plants: Implications, mitigation and the role of plant growth promoting rhizobacteria. Resour. Environ. Sustain. 2021, 5, 100032. [Google Scholar] [CrossRef]
- Montaseri, M.; Amirataee, B.; Rezaie, H. New approach in bivariate drought duration and severity analysis. J. Hydrol. 2018, 559, 166–181. [Google Scholar] [CrossRef]
- Tang, J.; Wang, P.; Li, X.; Yang, J.; Wu, D.; Ma, Y.; Li, S.; Jin, Z.; Huo, Z. Disaster event-based spring frost damage identification indicator for tea plants and its applications over the region north of the Yangtze River, China. Ecol. Indic. 2023, 146, 109912. [Google Scholar] [CrossRef]
- Li, H.; Jia, B.; Wang, H.; Li, D.; Fang, Q.; He, J.; Li, R. Yield response of supplementary irrigation at the anthesis stage of winter wheat. Agric. Water Manag. 2023, 284, 108352. [Google Scholar] [CrossRef]
- Wu, B.; Ma, Z.; Yan, N. Agricultural drought mitigating indices derived from the changes in drought characteristics. Remote Sens. Environ. 2020, 244, 111813. [Google Scholar] [CrossRef]
- Zhang, X.; Zhang, X.; Liu, X.; Shao, L.; Sun, H.; Chen, S. Incorporating root distribution factor to evaluate soil water status for winter wheat. Agric. Water Manag. 2015, 153, 32–41. [Google Scholar] [CrossRef]
- Zhao, J.; Yang, J.; Huang, R.; Xie, H.; Qin, X.; Hu, Y. Estimating evapotranspiration and drought dynamics of winter wheat under climate change: A case study in Huang-Huai-Hai region, China. Sci. Total Environ. 2024, 949, 175114. [Google Scholar] [CrossRef] [PubMed]
- Wang, H.; Vicente-Serrano, S.M.; Tao, F.; Zhang, X.; Wang, P.; Zhang, C.; Chen, Y.; Zhu, D.; Kenawy, A.E. Monitoring winter wheat drought threat in Northern China using multiple climate-based drought indices and soil moisture during 2000–2013. Agric. For. Meteorol. 2016, 228–229, 1–12. [Google Scholar] [CrossRef]
- Lv, H.Q.; Zhang, Y.S.; Li, M.S.; Wang, J.L.; Zhang, S.J.; Lou, X.R.; Zhang, Y.H.; Wu, M.X. Grade of Agricultural Drought; General Administration of Quality Supervision, Inspection and Quarantine of the People’s Republic of China: Beijing, China, 2015.
- Huang, M.; Wang, C.; Qi, W.; Zhang, Z.; Xu, H. Modelling the integrated strategies of deficit irrigation, nitrogen fertilization, and biochar addition for winter wheat by AquaCrop based on a two-year field study. Field Crops Res. 2022, 282, 108510. [Google Scholar] [CrossRef]
- Xu, X.; Zhang, M.; Li, J.; Liu, Z.; Zhao, Z.; Zhang, Y.; Zhou, S.; Wang, Z. Improving water use efficiency and grain yield of winter wheat by optimizing irrigations in the North China Plain. Field Crops Res. 2018, 221, 219–227. [Google Scholar] [CrossRef]
- Togneri, R.; Felipe dos Santos, D.; Camponogara, G.; Nagano, H.; Custódio, G.; Prati, R.; Fernandes, S.; Kamienski, C. Soil moisture forecast for smart irrigation: The primetime for machine learning. Expert Syst. Appl. 2022, 207, 117653. [Google Scholar] [CrossRef]
- Karandish, F.; Šimůnek, J. A comparison of numerical and machine-learning modeling of soil water content with limited input data. J. Hydrol. 2016, 543, 892–909. [Google Scholar] [CrossRef]
- Zeng, J.; Yuan, X.; Ji, P. The important role of reliable land surface model simulation in high-resolution multi-source soil moisture data fusion by machine learning. J. Hydrol. 2024, 630, 130700. [Google Scholar] [CrossRef]
- Barnard, D.M.; Germino, M.J.; Bradford, J.B.; O’Connor, R.C.; Andrews, C.M.; Shriver, R.K. Are drought indices and climate data good indicators of ecologically relevant soil moisture dynamics in drylands? Ecol. Indic. 2021, 133, 108379. [Google Scholar] [CrossRef]
- Li, J.Z.; Wang, Y.X.; Li, S.F.; Hu, R. A Nonstationary Standardized Precipitation Index incorporating climate indices as covariates. J. Geophys. Res. Atmos. 2015, 120, 12,082–12,095. [Google Scholar] [CrossRef]
- Sun, P.; Ge, C.; Yao, R.; Bian, Y.; Yang, H.; Zhang, Q.; Xu, C.-Y.; Singh, V.P. Development of a nonstationary Standardized Precipitation Evapotranspiration Index (NSPEI) and its application across China. Atmos. Res. 2024, 300, 107256. [Google Scholar] [CrossRef]
- Chen, W.; Yao, R.; Sun, P.; Zhang, Q.; Singh, V.P.; Sun, S.; AghaKouchak, A.; Ge, C.; Yang, H. Drought Risk Assessment of Winter Wheat at Different Growth Stages in Huang-Huai-Hai Plain Based on Nonstationary Standardized Precipitation Evapotranspiration Index and Crop Coefficient. Remote Sens. 2024, 16, 1625. [Google Scholar] [CrossRef]
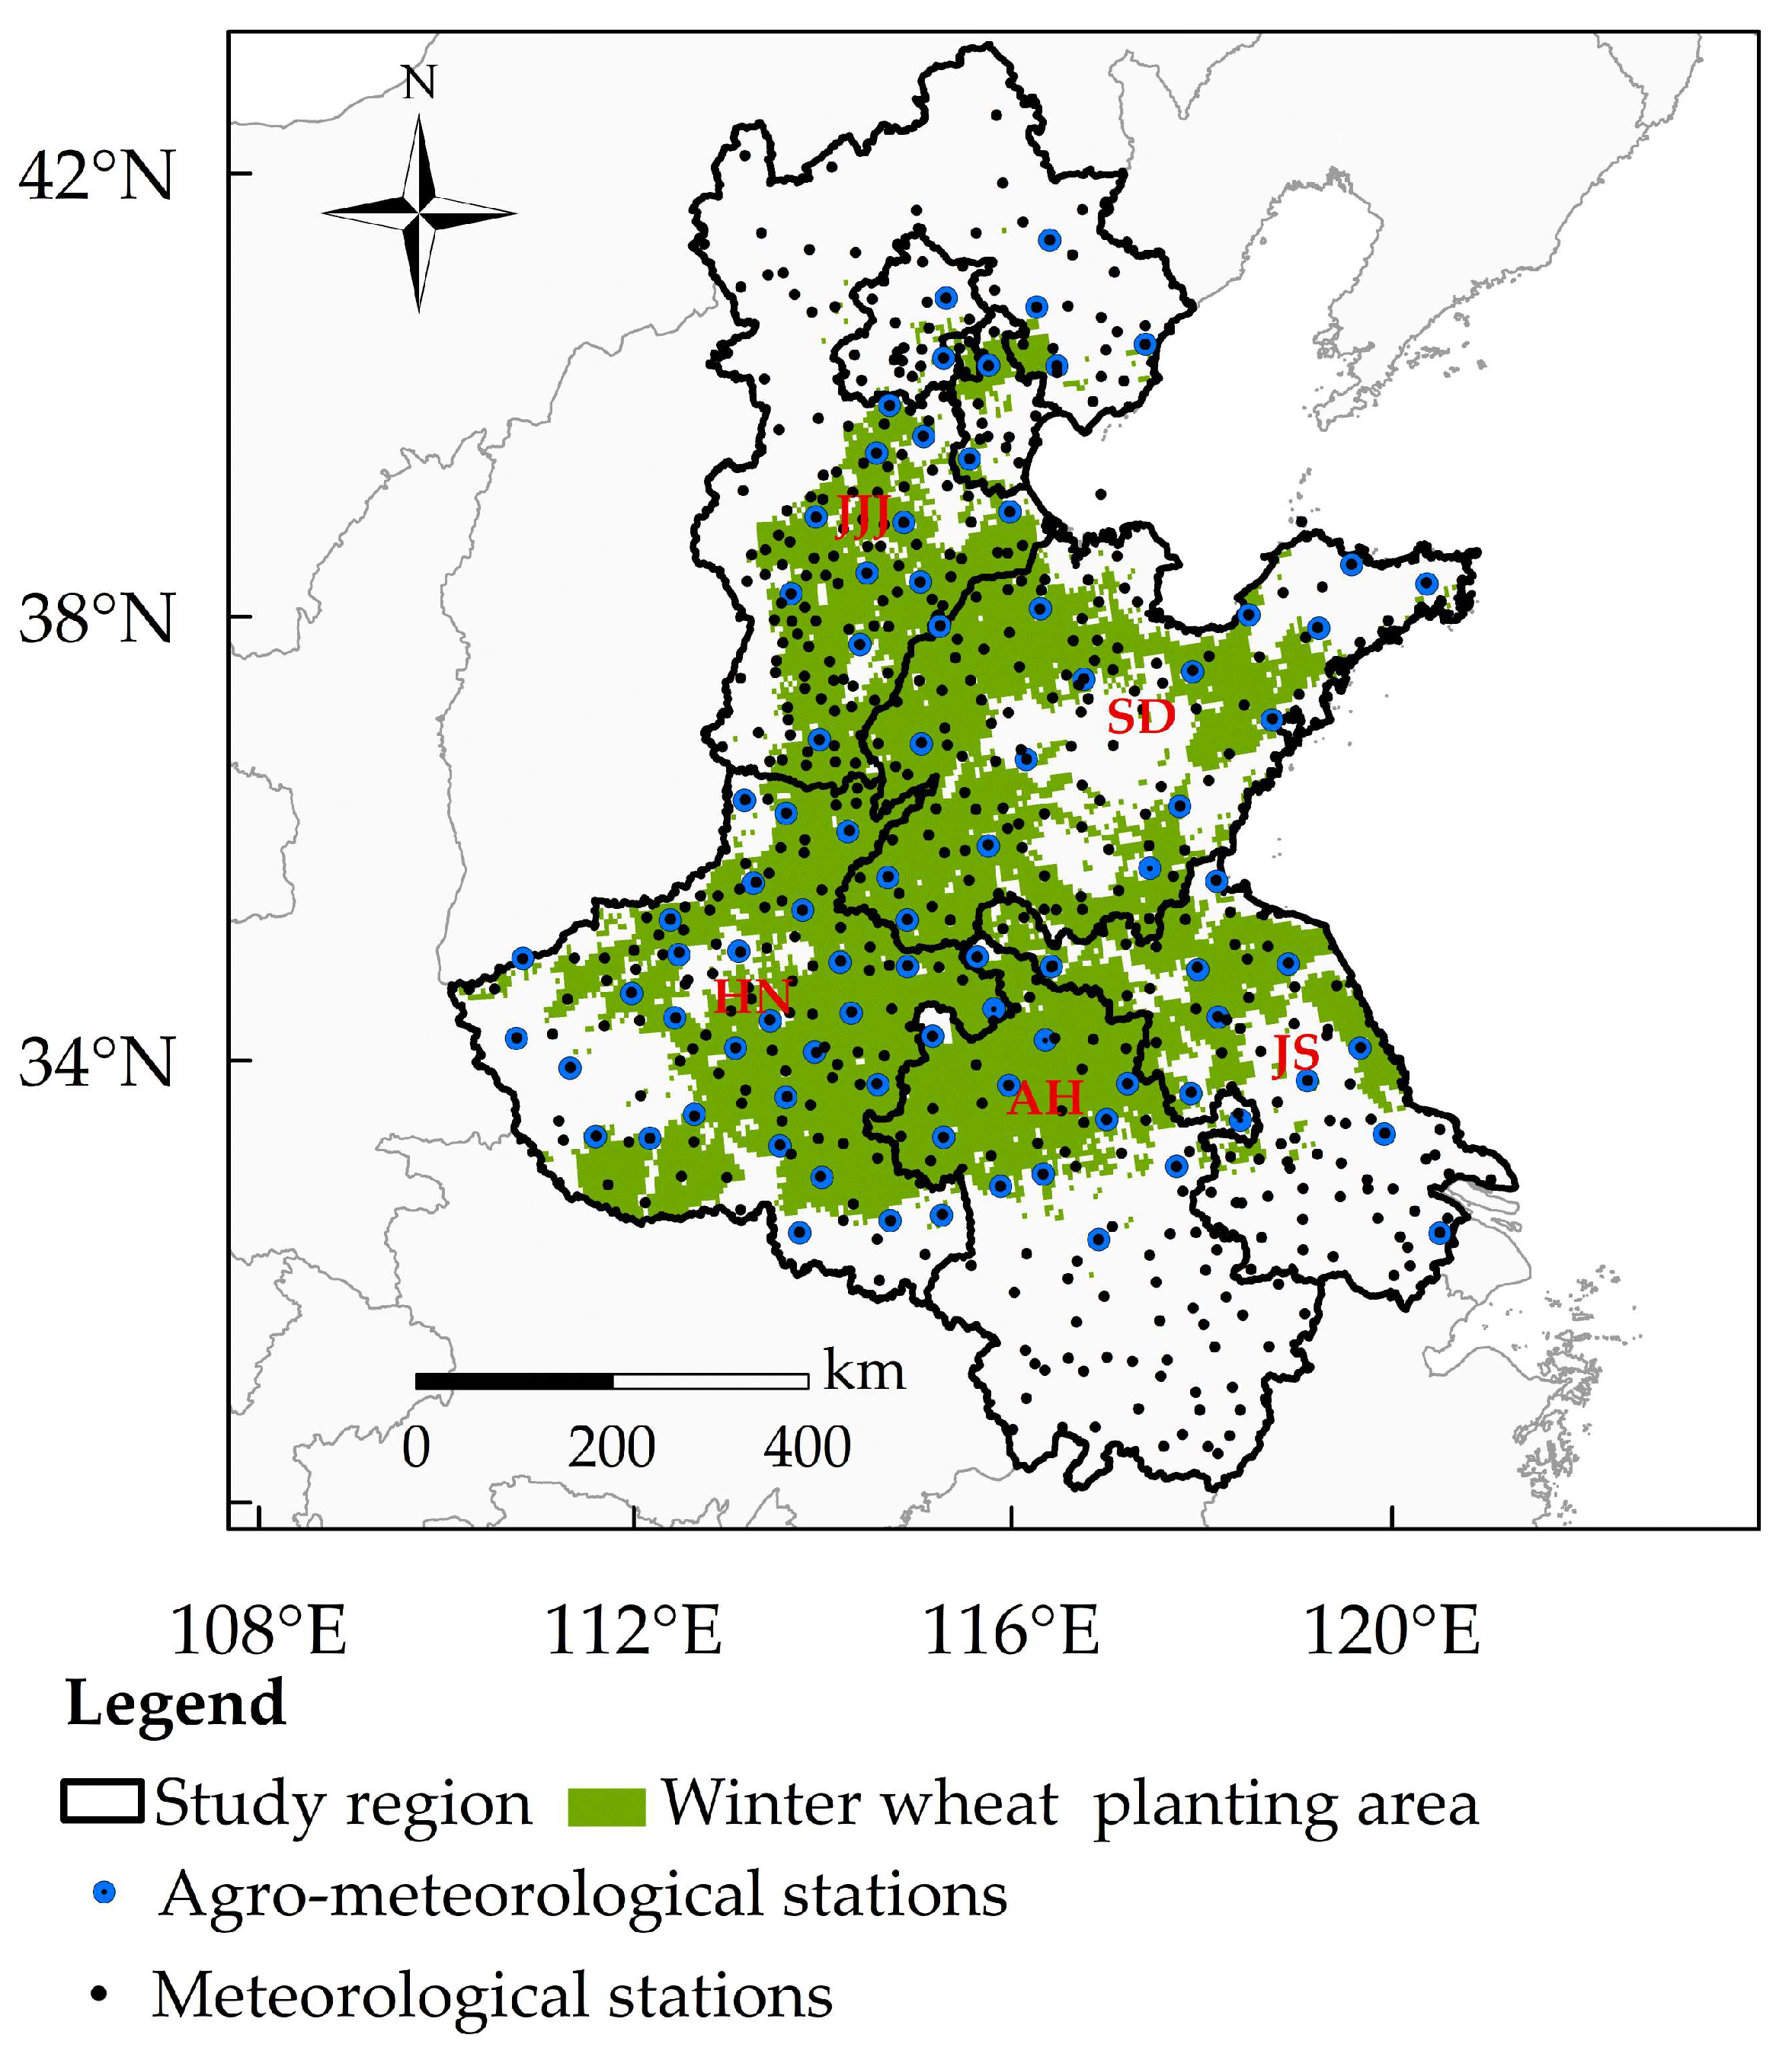
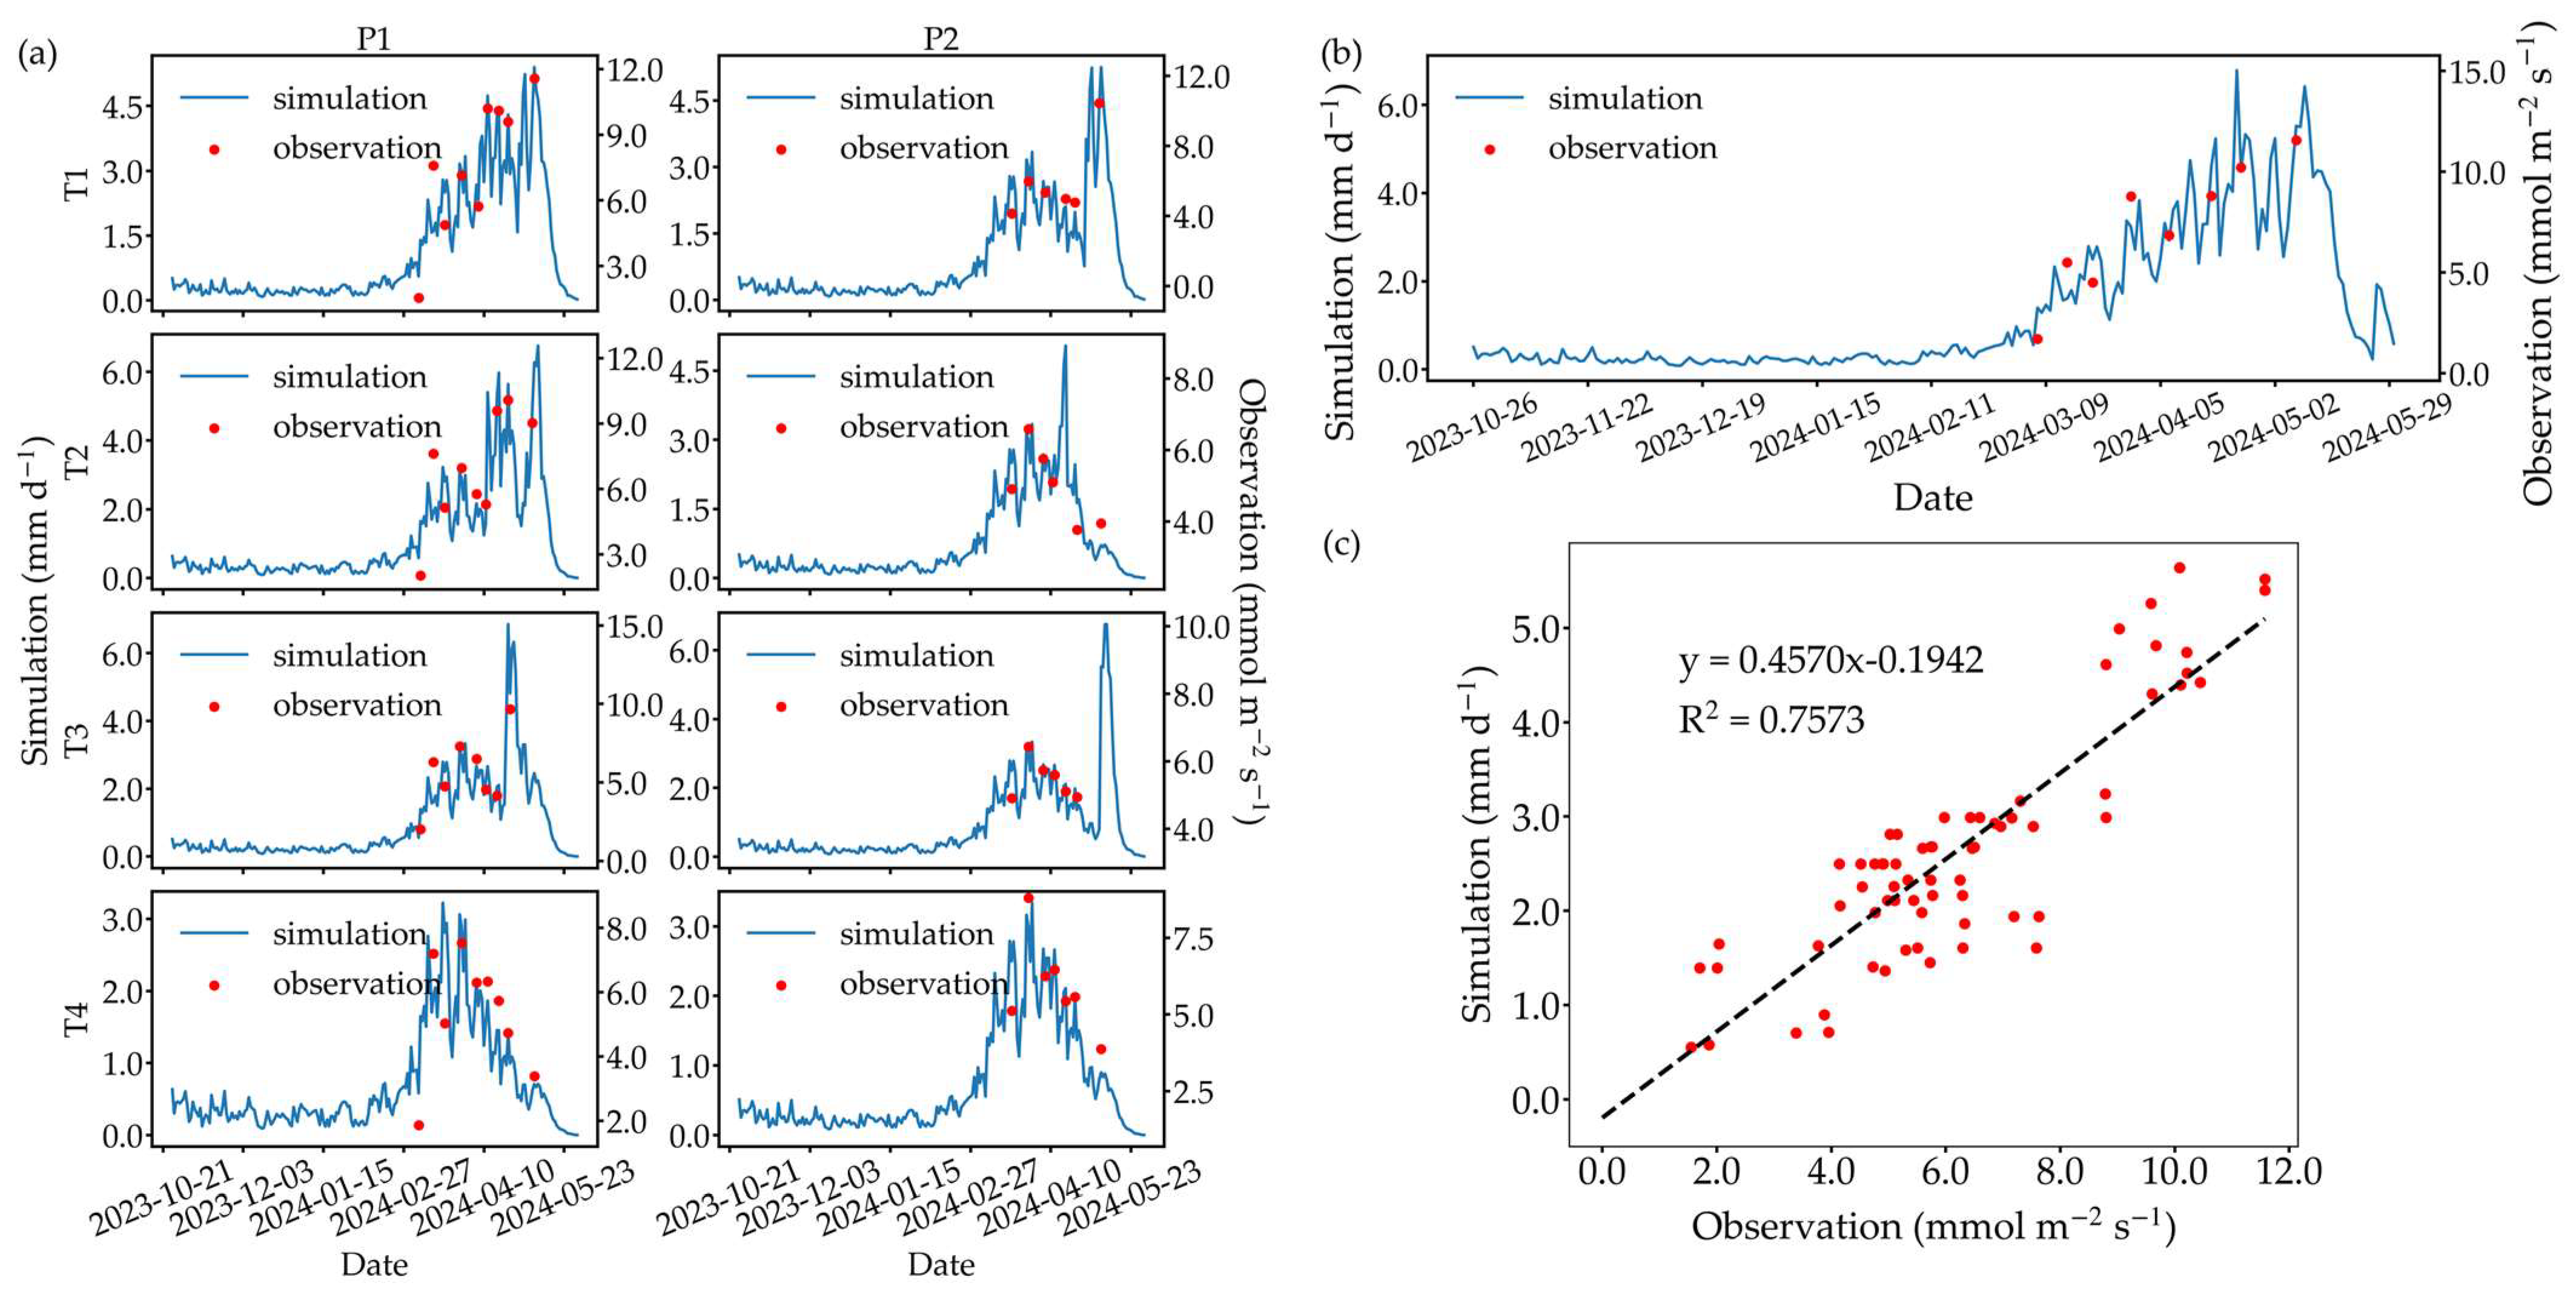


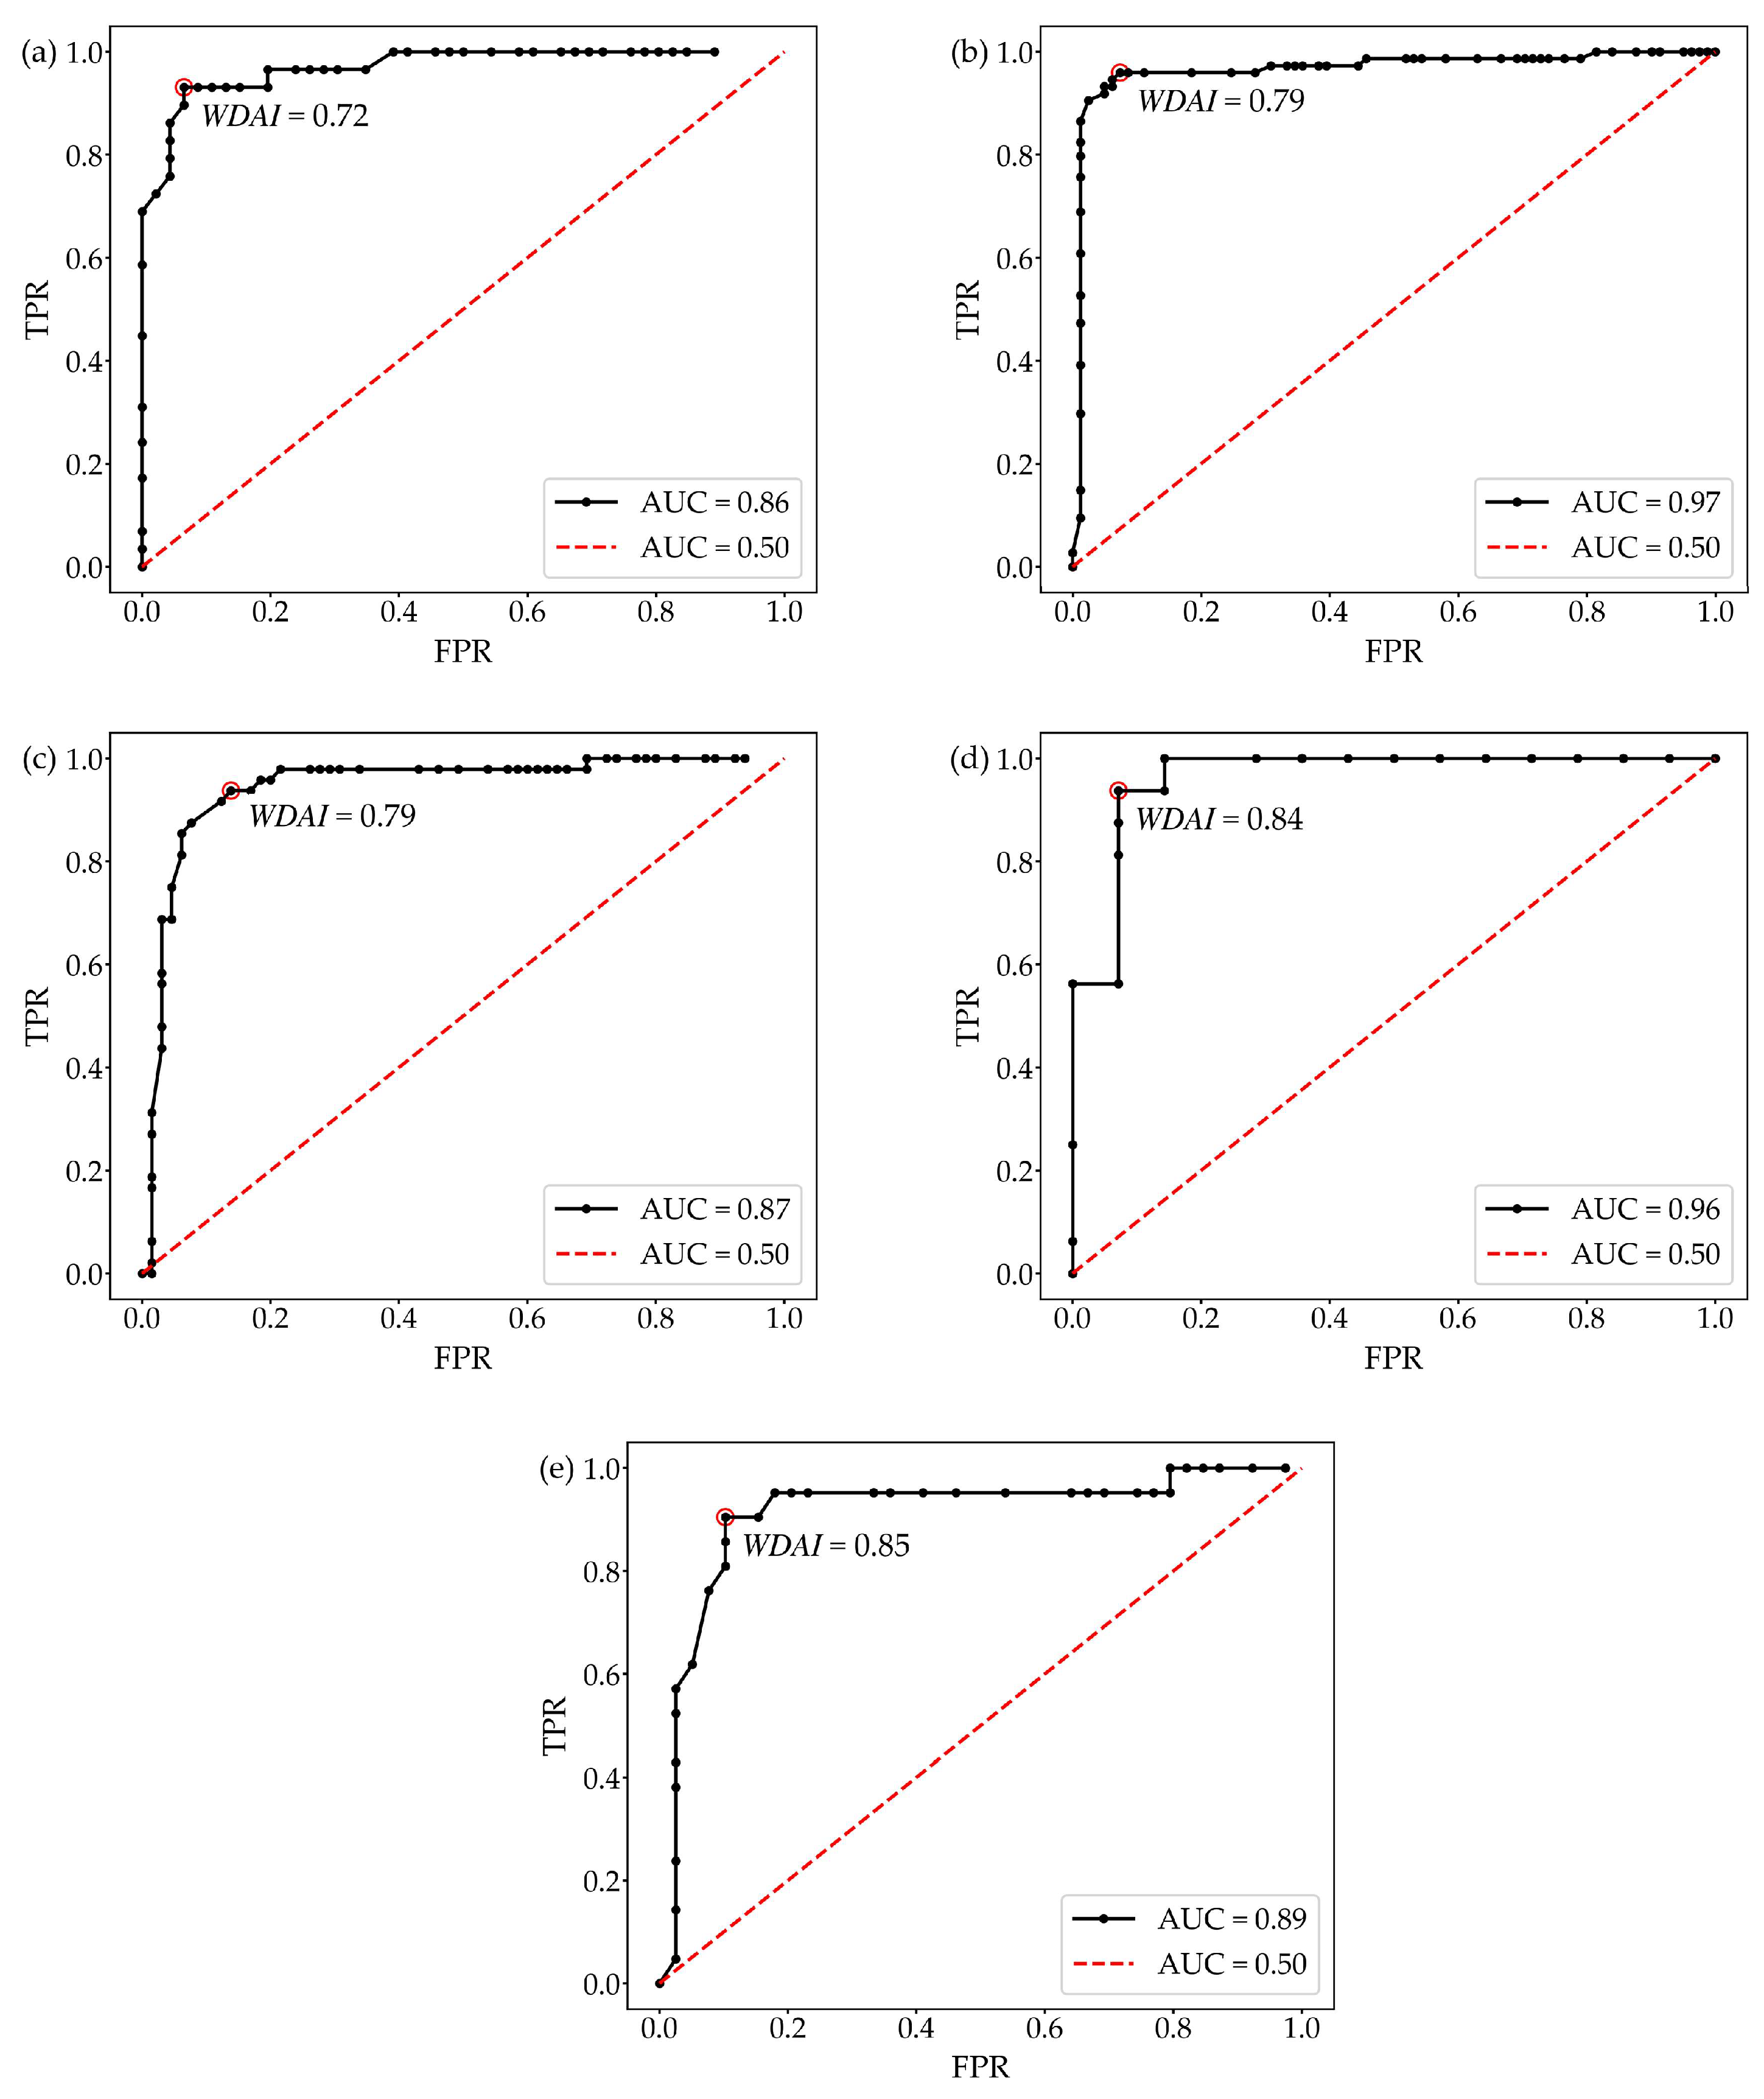
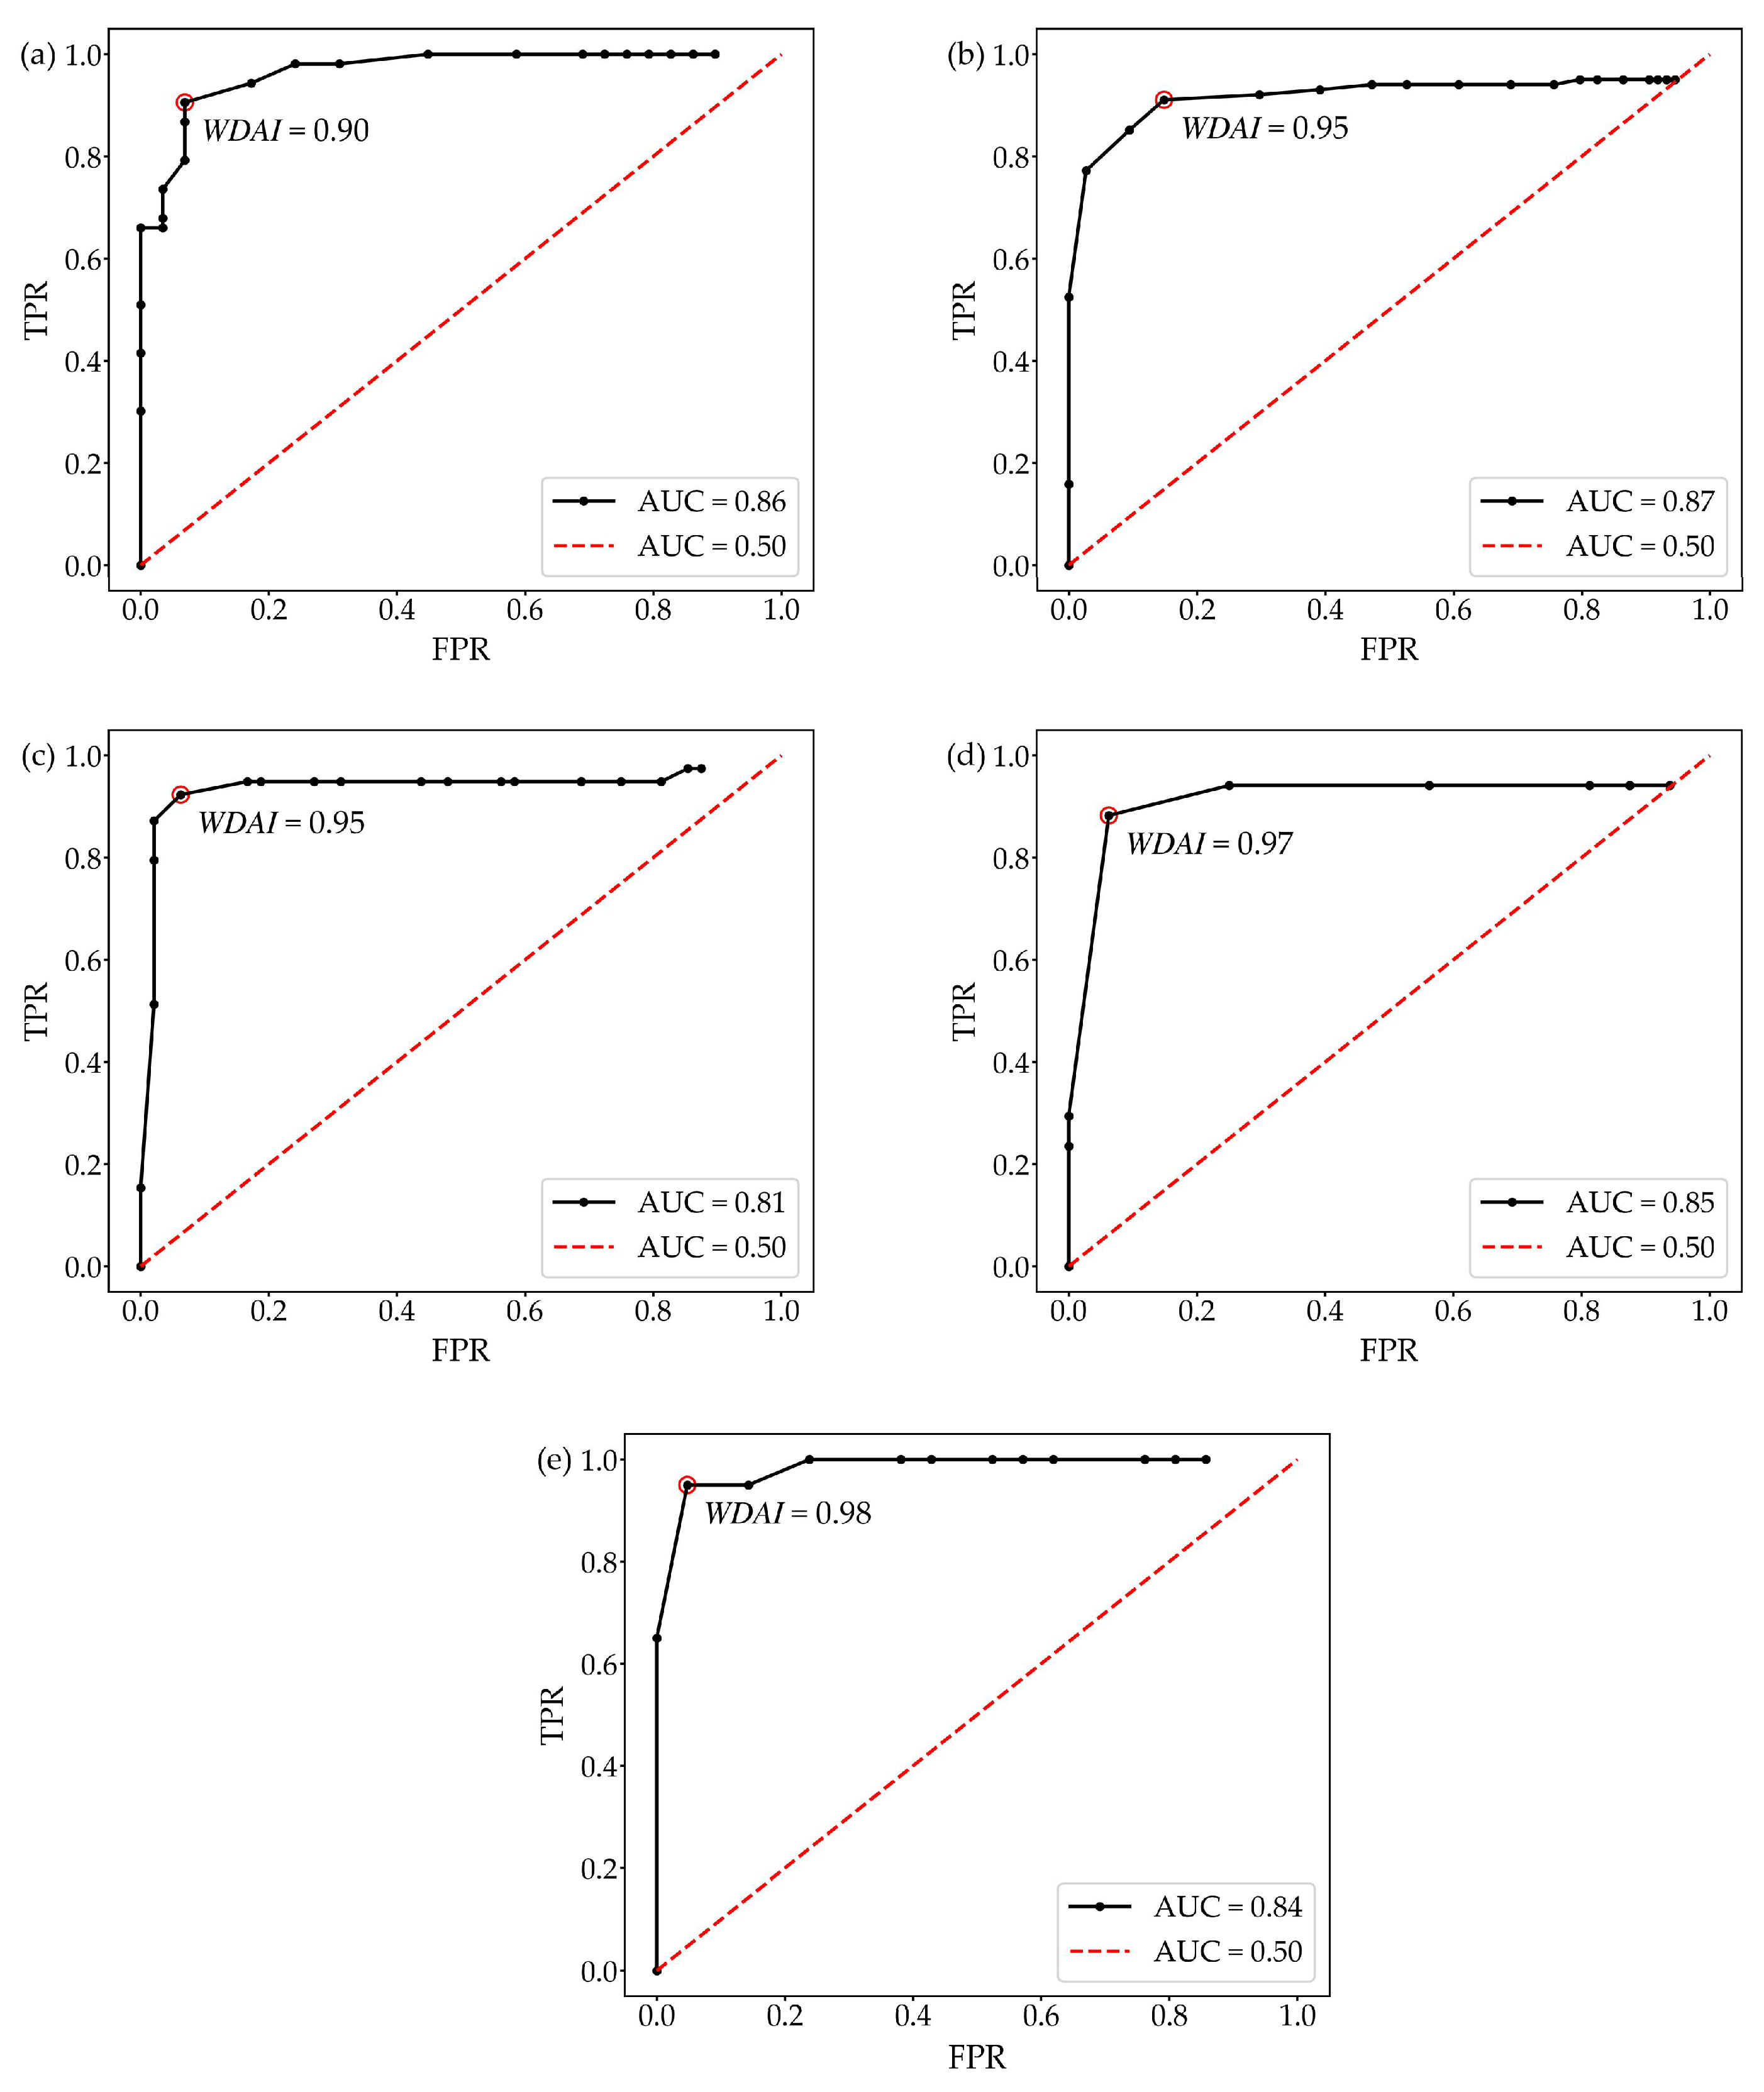
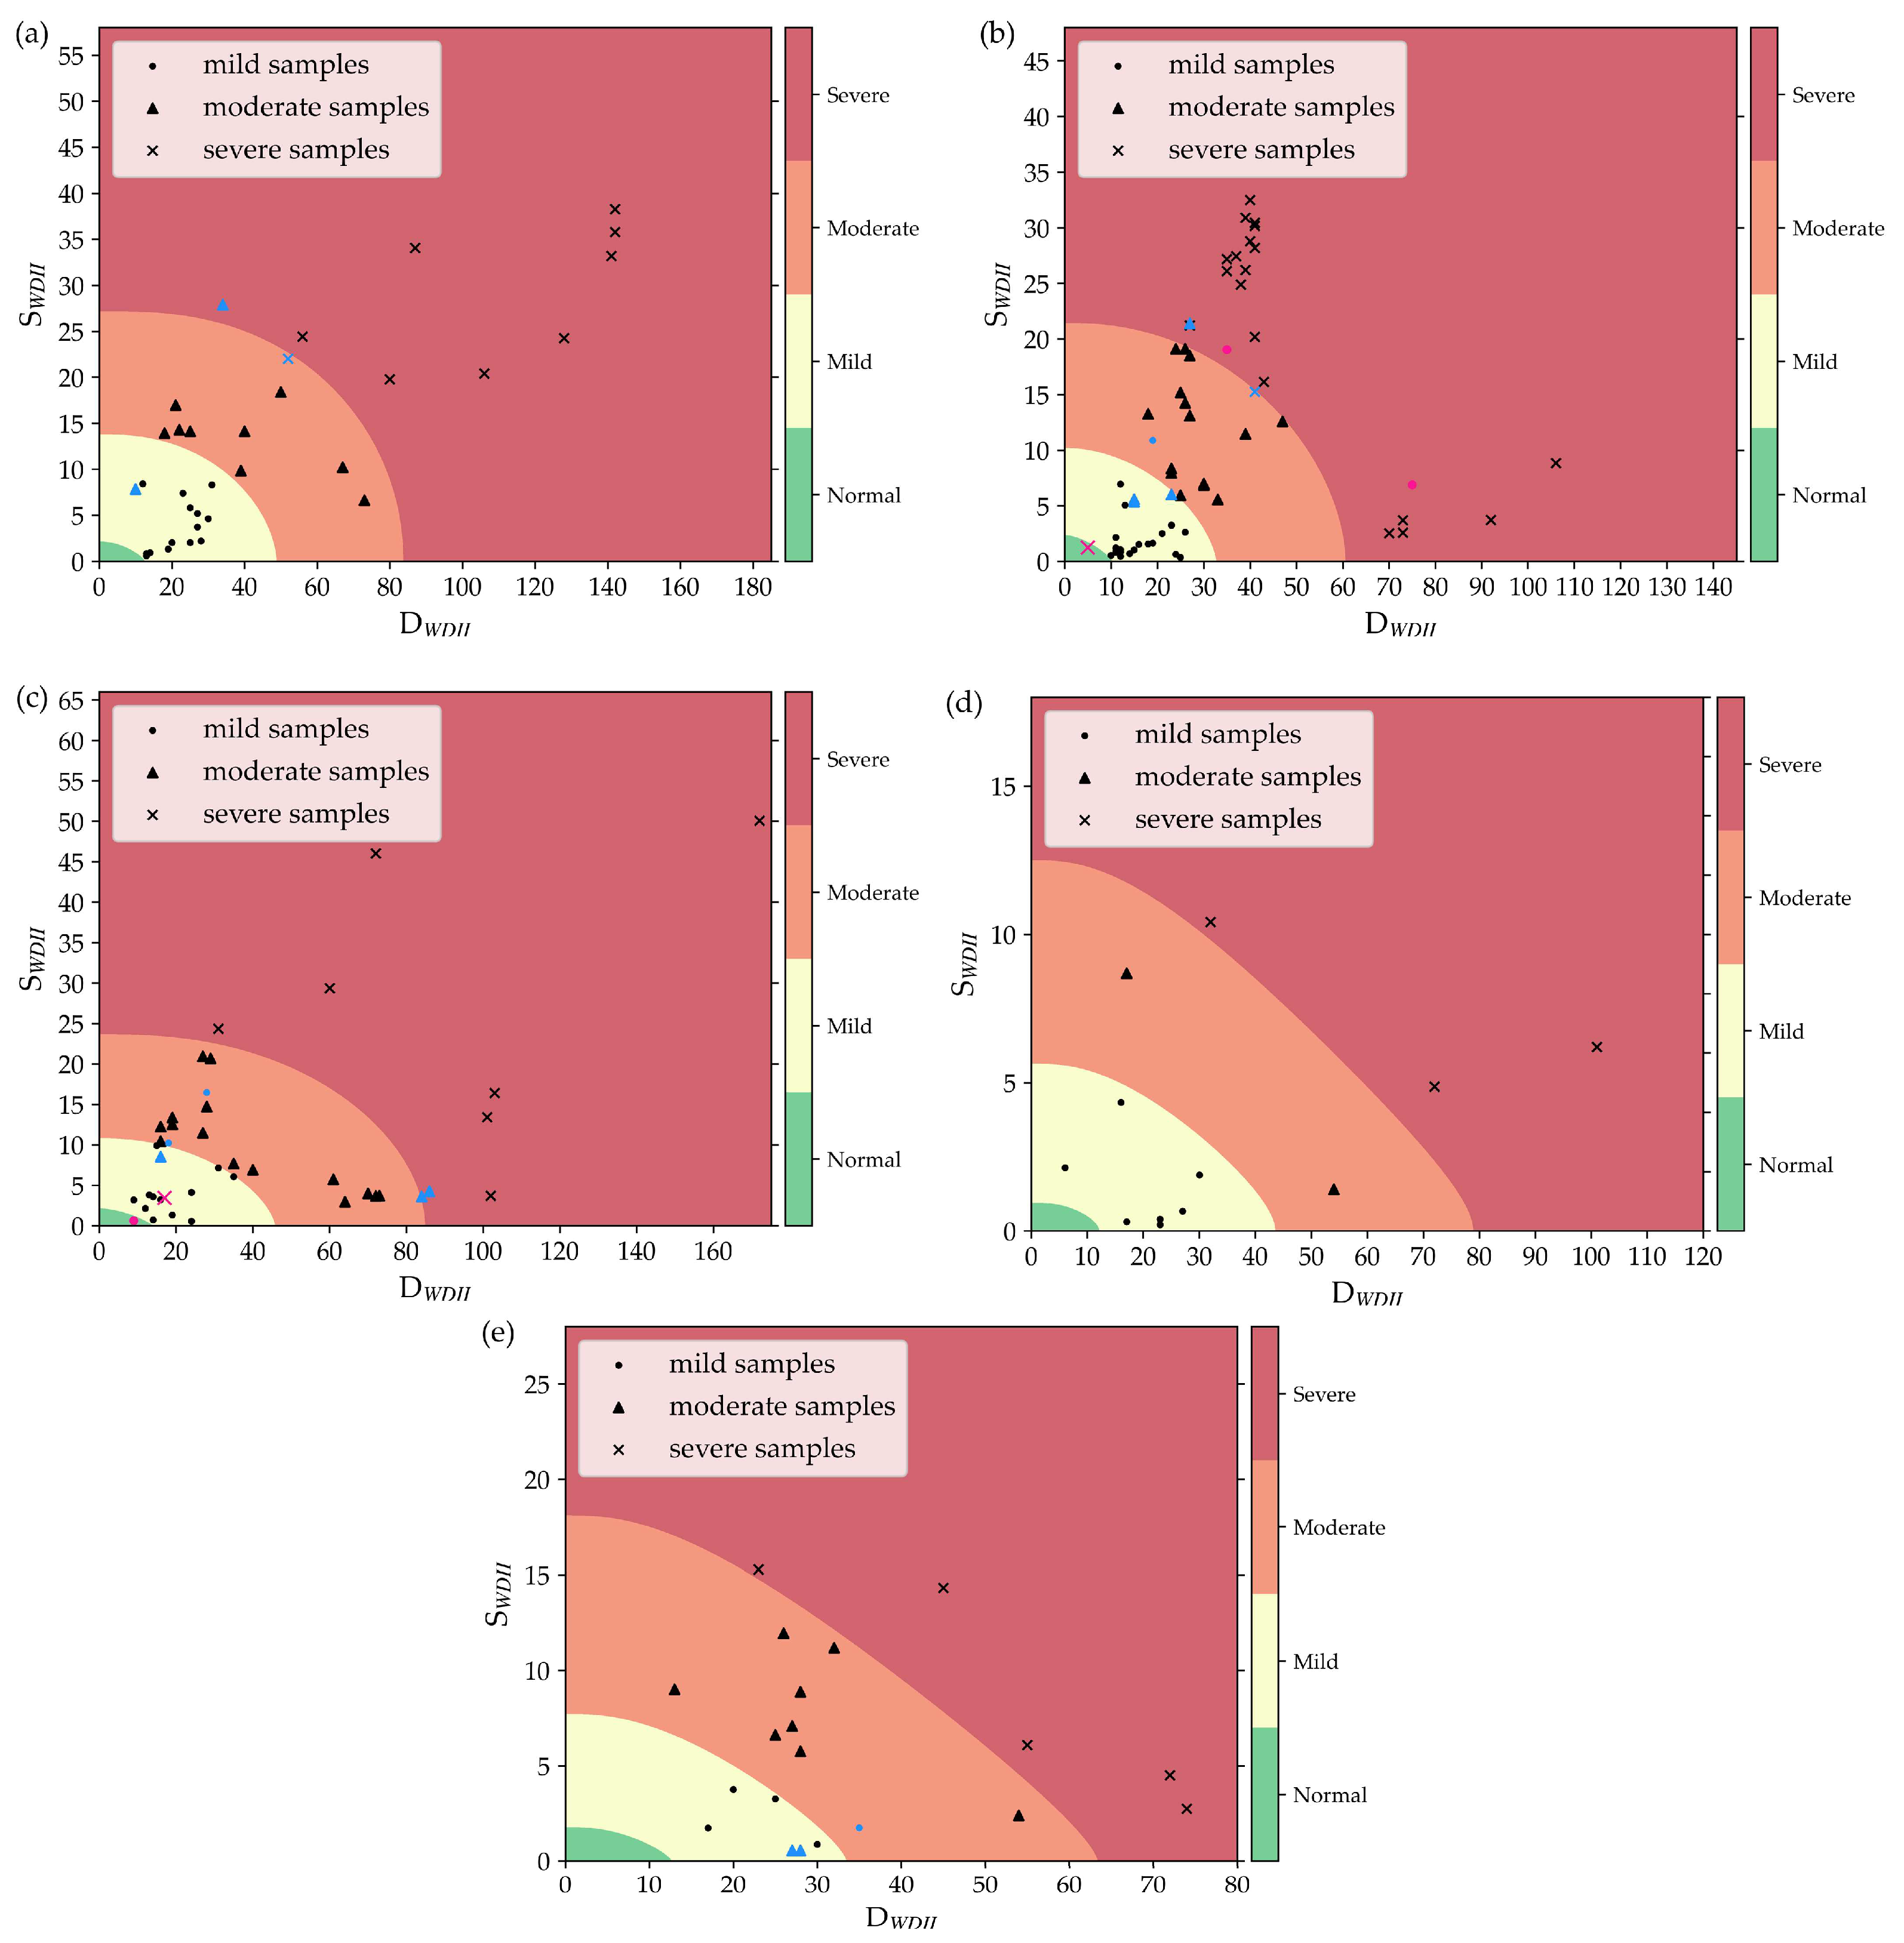
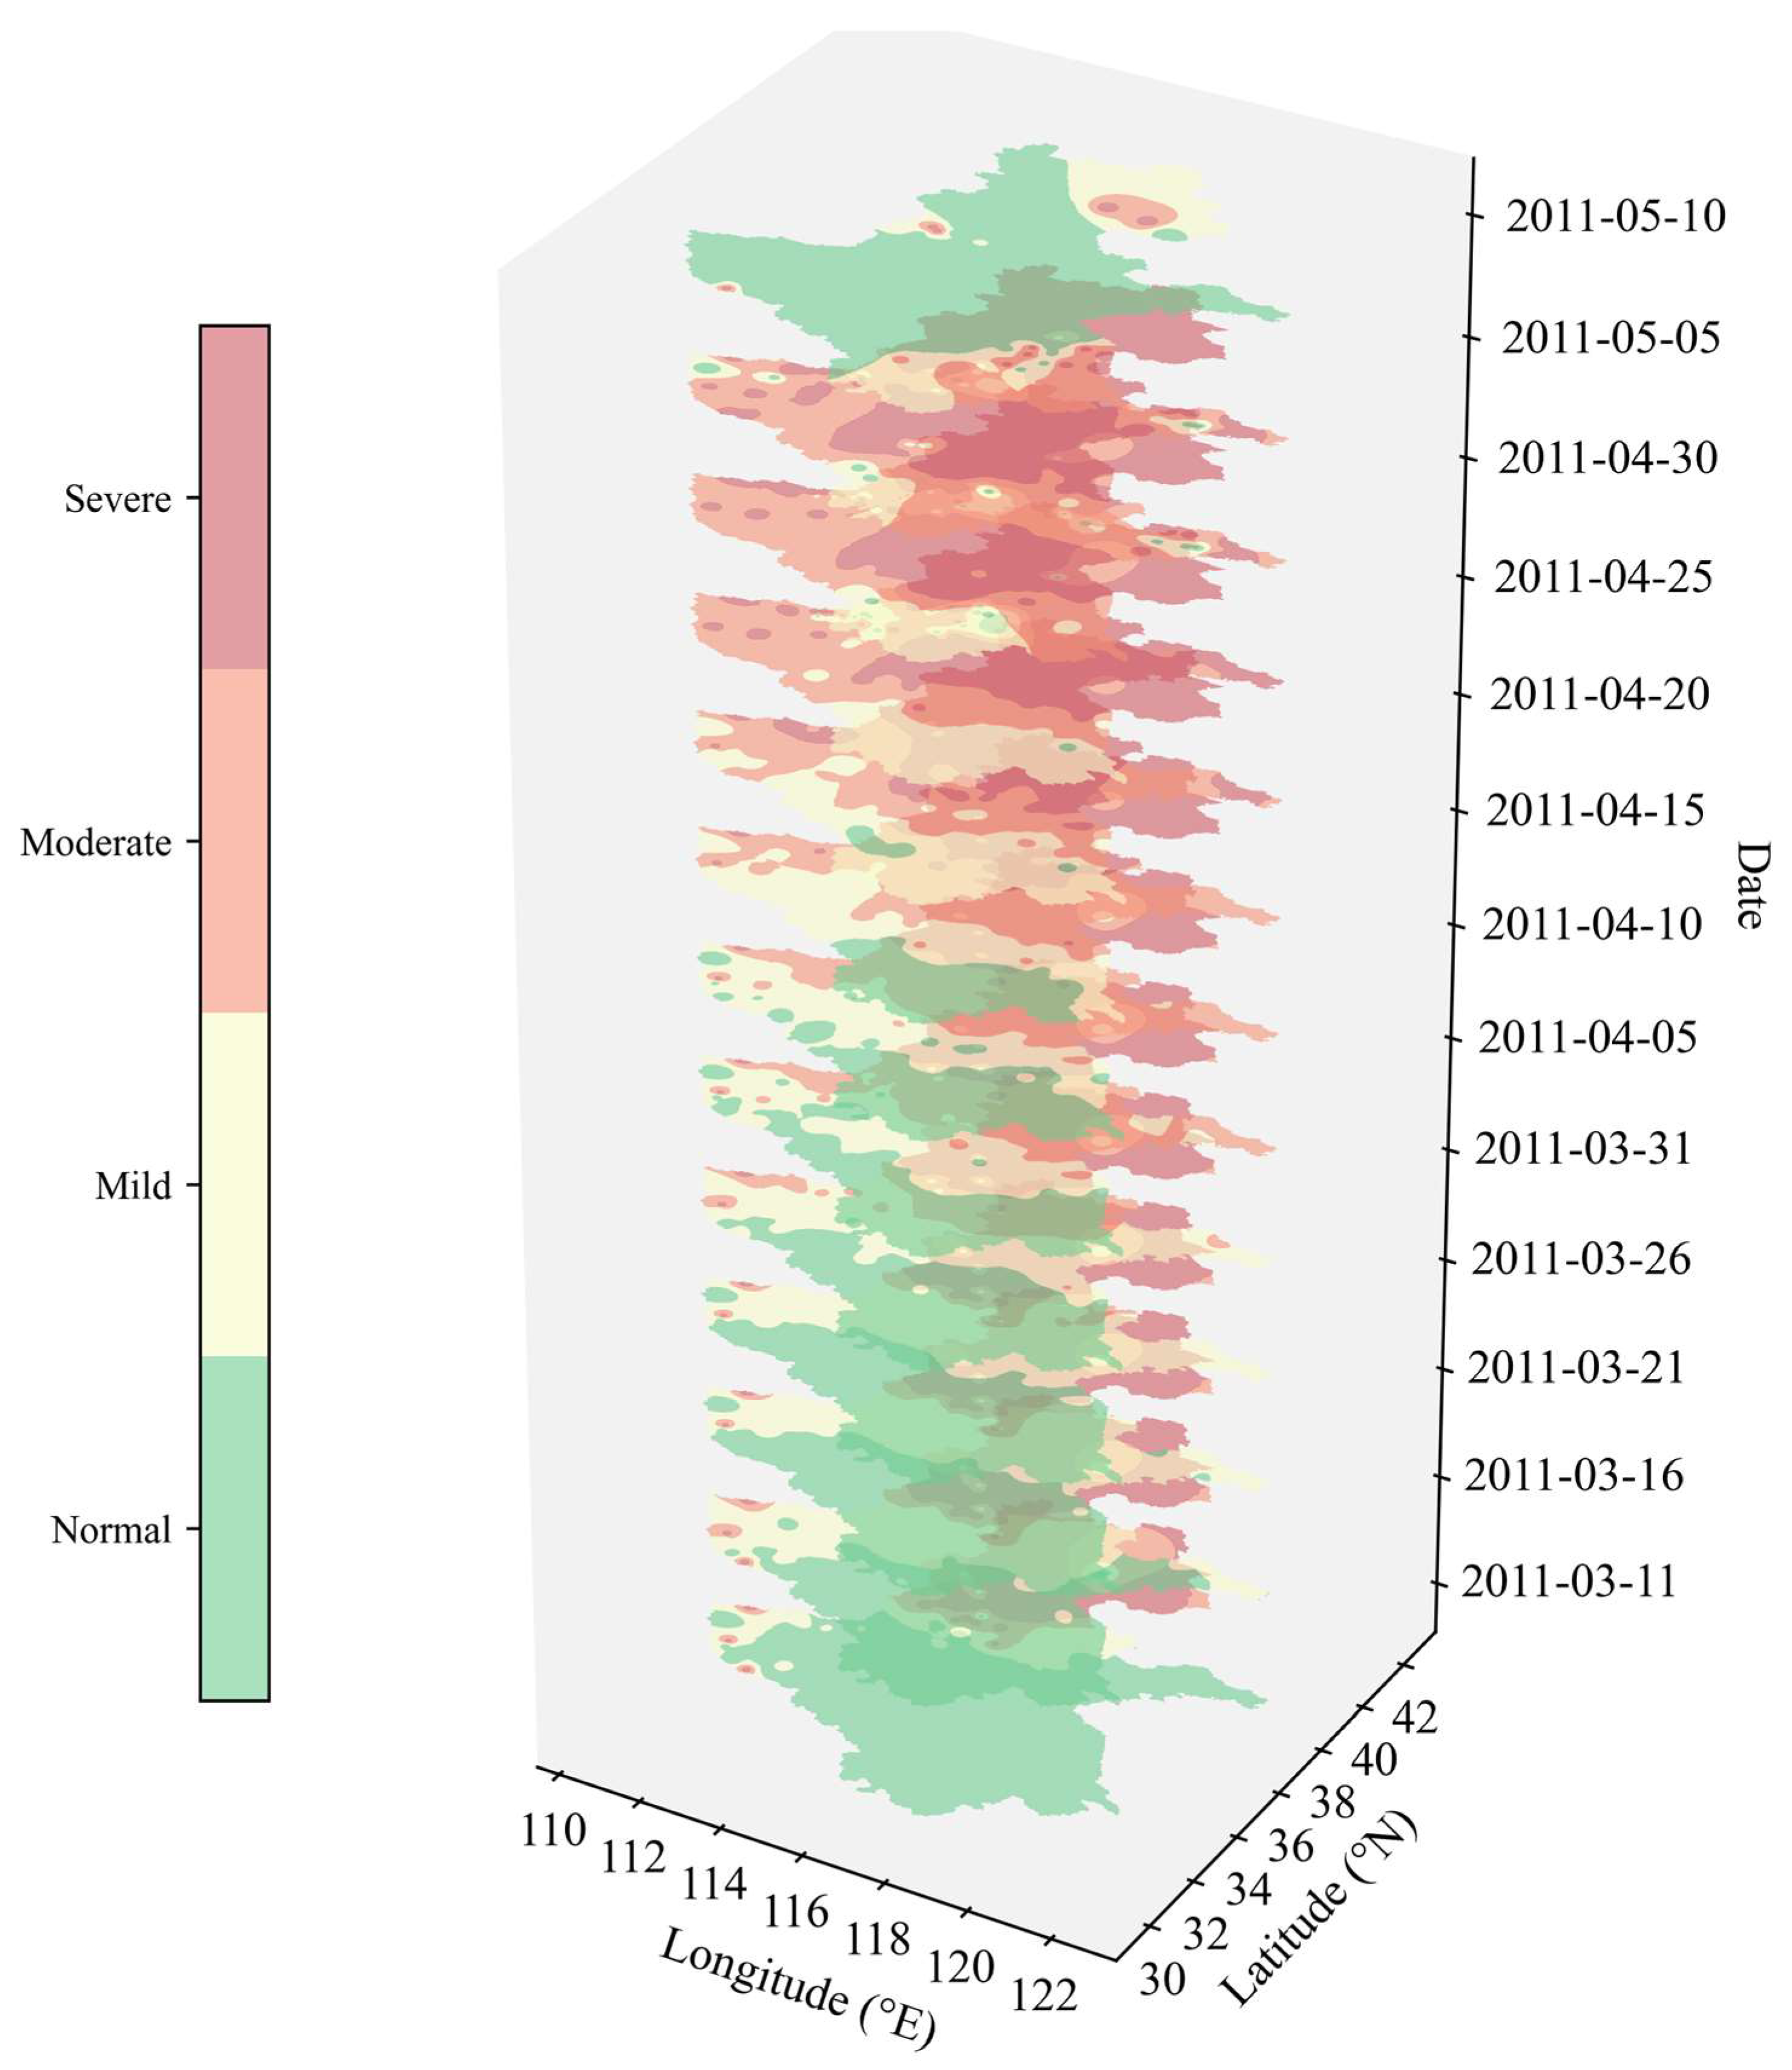
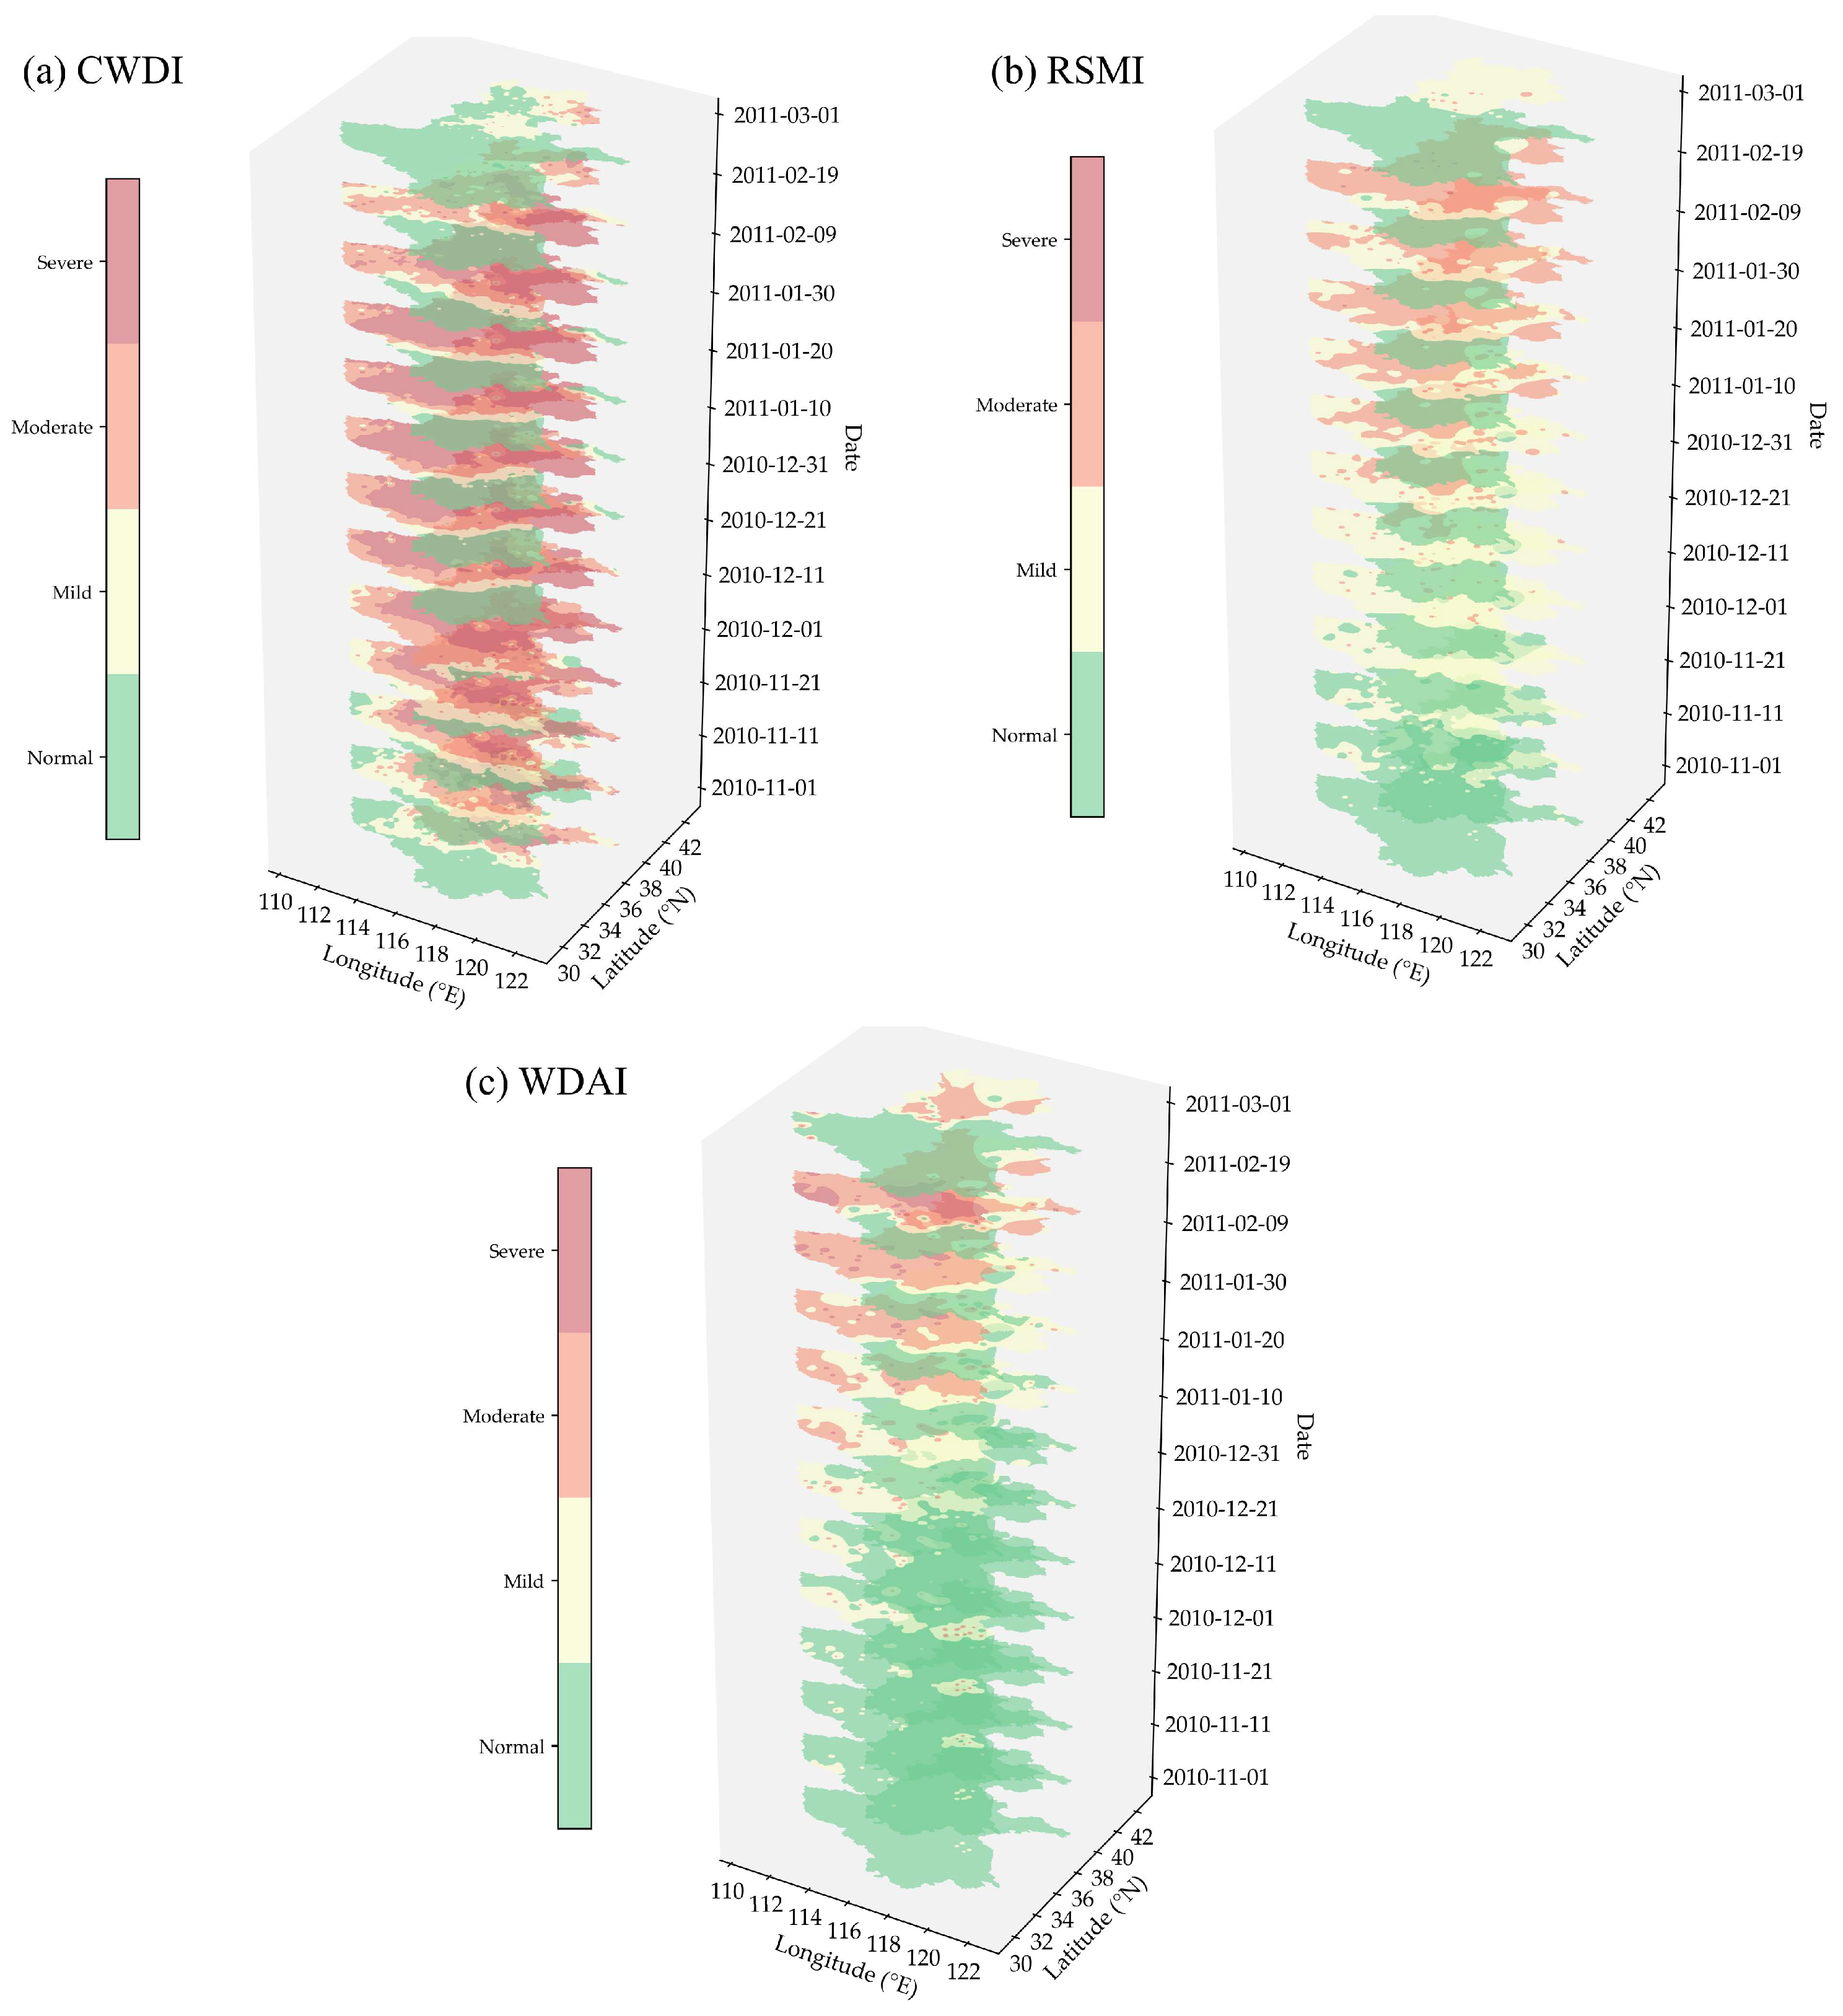
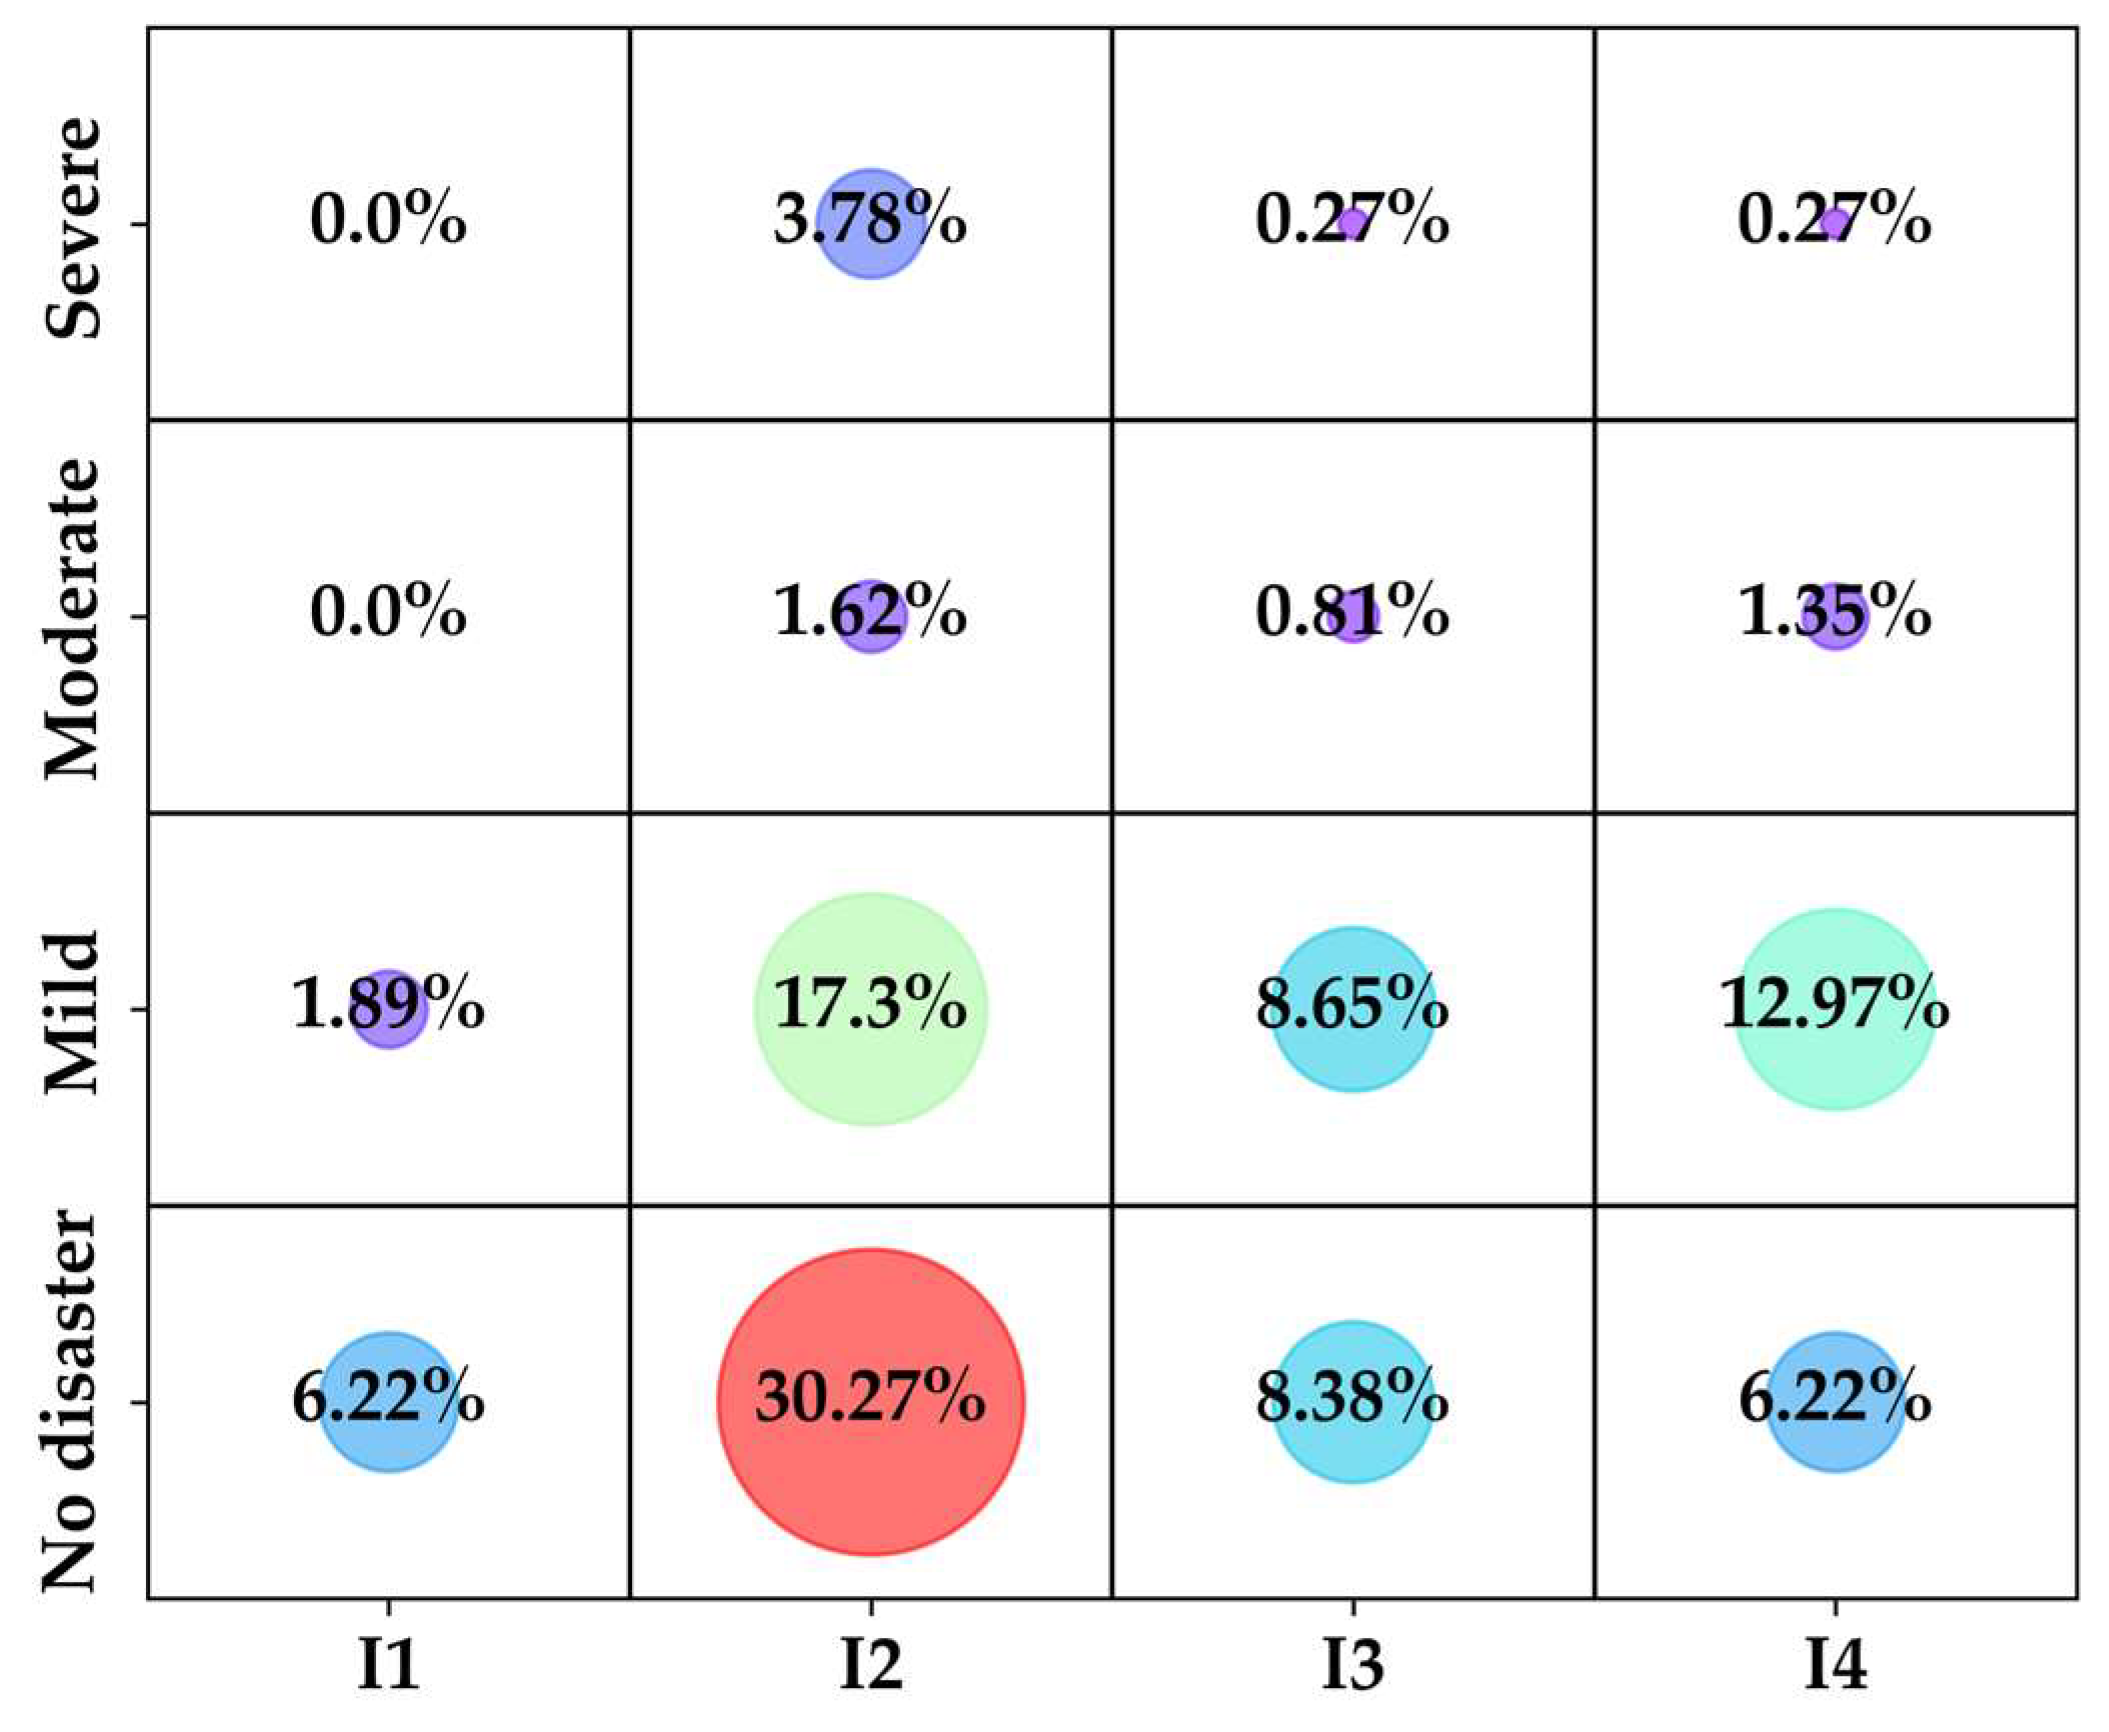
Disclaimer/Publisher’s Note: The statements, opinions and data contained in all publications are solely those of the individual author(s) and contributor(s) and not of MDPI and/or the editor(s). MDPI and/or the editor(s) disclaim responsibility for any injury to people or property resulting from any ideas, methods, instructions or products referred to in the content. |
© 2025 by the authors. Licensee MDPI, Basel, Switzerland. This article is an open access article distributed under the terms and conditions of the Creative Commons Attribution (CC BY) license (https://creativecommons.org/licenses/by/4.0/).