Article

A Decision Support System for Irrigation Scheduling Using a Reduced-Size Pan

by
Georgios Nikolaou
1,*,
Damianos Neocleous
2,
Efstathios Evangelides
3 and
Evangelini Kitta
1
1
Department of Agriculture Crop Production and Rural Environment, School of Agricultural Sciences, University of Thessaly, Fytokou Str., 38446 Volos, Greece
2
Department of Natural Resources and Environment, Agricultural Research Institute, Ministry of Agriculture, Nicosia 1516, Cyprus
3
Department of Agriculture, Ministry of Agriculture, P.O. Box 24402, Nicosia 1705, Cyprus
*
Author to whom correspondence should be addressed.
Agronomy 2025, 15(4), 848; https://doi.org/10.3390/agronomy15040848 (registering DOI)
Submission received: 27 February 2025 / Revised: 23 March 2025 / Accepted: 27 March 2025 / Published: 28 March 2025
(This article belongs to the Special Issue Smart Farming Technologies for Sustainable Agriculture—2nd Edition)

Abstract

:
An automatic, weight-based, small 20 cm diameter pan was used for real-time calculations of evaporation and precipitation in a semiarid environment. The water evaporated from the evaporimeter (EP) was found to be a significant predictor of evapotranspiration (ETO; r2 = 0.84), which was calculated with the Penman–Monteith (P-M) equation by retrieving climatic data from a weather station. The results revealed seasonal variations of the pan coefficient (KP; dimensionless), with a mean value estimated at 0.84 (±0.16). Validation of ETO measurements using a calibrated regression model (ETO = 0.831*EP + 0.025), against the P-M equation indicated a high correlation coefficient (r2 = 0.99, slope of the regression line of 0.9). The present paper evaluates and discusses the potential of using a reduced-size pan for real-time monitoring of water evaporation and precipitation, proposing an open-source irrigation decision support system.

1. Introduction

Climatic change is expected in the coming years to cause an increase in drought severity [1]. In arid and semiarid regions, water scarcity is one of the main challenges and likely the most important limiting factor for agricultural growth. Recently, there has been a growing focus among researchers on integrating green energy technologies to increase energy efficiency and promote sustainability in the agricultural sector. However, the decision to pursue a climate-neutral economy is a strategic choice that should be made by every country to meet environmental objectives, improve society, and ensure a sustainable future for all. Therefore, the development of a framework of tools aimed at improving water productivity (i.e., product yield per unit volume of water consumed by the crop) can make a valuable contribution to alleviating this problem [2]. Unfortunately, the lack of access to open access irrigation scheduling decision support tools may limit the ability of smallholder farmers to manage irrigation water efficiently for sustainable crop production [3].
The FAO Penman–Monteith (P-M) energy balance equation, which is based on climatic measurements, is recommended as the standard method for defining and computing the atmospheric evaporative demand (potential evapotranspiration, ΕΤO) [4,5]. However, in developing countries, the necessary meteorological data are often lacking, which limits the application of this method [6]. In this context, simpler empirical equations considering limited climatic data or apparatuses that do not require complex recording equipment have been used for ETO estimation.
The United States Class A evaporation pan is a large, open, circular container filled with water (120.7 cm in diameter and 25.4 cm deep) [7,8]. It provides a measurement of the integrated effect of all climatic conditions (i.e., solar radiation, air temperature, air humidity, and wind speed) on the open water surface. In the absence of rain, the amount of water evaporated (EP) during a period (mm day−1) corresponds to the decrease in water depth inside the container. Pans have proven their practical value and have been successfully used over the years to estimate ETO by multiplying water loss (EP; mm) by empirical pan coefficients (a conversion factor called the pan coefficient, KP) (i.e., ETO = KP*EP). KP values, however, are site-specific and affected by the pan material. Typical KP values can be found in the literature [9]. Weighable pans have also been used for meteorological purposes, although often with a rather free conception of the exposure requirements. Smaller devices with good estimates of water evaporation, such as portable evaporimeters, cans, or reduced-sized 20 cm diameter pans, are also suggested as alternatives to the large size of Class A pans [8,10].
ETO is fundamental in agricultural science for proper irrigation scheduling. It is considered the main component in calculating crop water needs, i.e., crop evapotranspiration (ETC). Especially in arid and semiarid regions, the need for water management at the farm level is highly important because of low rainfall [11]. Indeed, farming productivity is restricted to drought-resistant species, as rainfall varies from year to year, and its occurrence is unpredictable. Under these conditions, the optimum yield of crops can be obtained only under a full irrigation program. In this context, the ETC for the main irrigated crops, as in the case of Mediterranean countries, is estimated to be between 300 and 2300 mm during the irrigation period [12]. In fine-textured soils with high water storage and a conservative climate (with little day-to-day variation), evaporation estimates over a two-week period or longer will often suffice. In contrast, detailed research on water transfer in the soil–plant–atmosphere continuum and on the reactions of plants to water stress may require measurements of evapotranspiration over shorter intervals, such as on the basis of a few minutes, especially in soilless cropping systems. Systematic irrigation scheduling, which uses the relationship of ETO to ETC (i.e., ETC = KC*ETO; crop coefficient, KC), provides a means whereby scientific knowledge on irrigation can be transferred to commercially irrigated farms [13]. However, the exact measurement of water evaporation is considered a scientific endeavor. Progress in ETO research has permitted the development of procedures that are well suited for practical use in irrigation scheduling. Indeed, climatic variability between regions is the main factor affecting ETo within the same crop species [14].
Over the past few years, computational intelligence has gained importance in monitoring prevailing climatic conditions for irrigation scheduling [11,15,16]. The use of electronics in agriculture has demonstrated its utility for diverse uses, with opportunities for saving energy and water inputs [17]. Appropriate irrigation schedules in water-scarce areas can maintain long-term agricultural sustainability as opposed to irrigation practices, which are based on the personal perspective of the farmer [11,18].
Considering the above, the objective of this study is to establish a relationship between the amount of water evaporated from a small evaporimeter and that calculated via the Penman–Monteith equation. The size of the pan and the quick response time to water variations could be favorable compared to other methods of calculating water needs at the farm level, considering climatic heterogeneity. An open-access irrigation scheduling decision support system using an electronic-based, weighable, small evaporimeter is described.

2. Materials and Methods

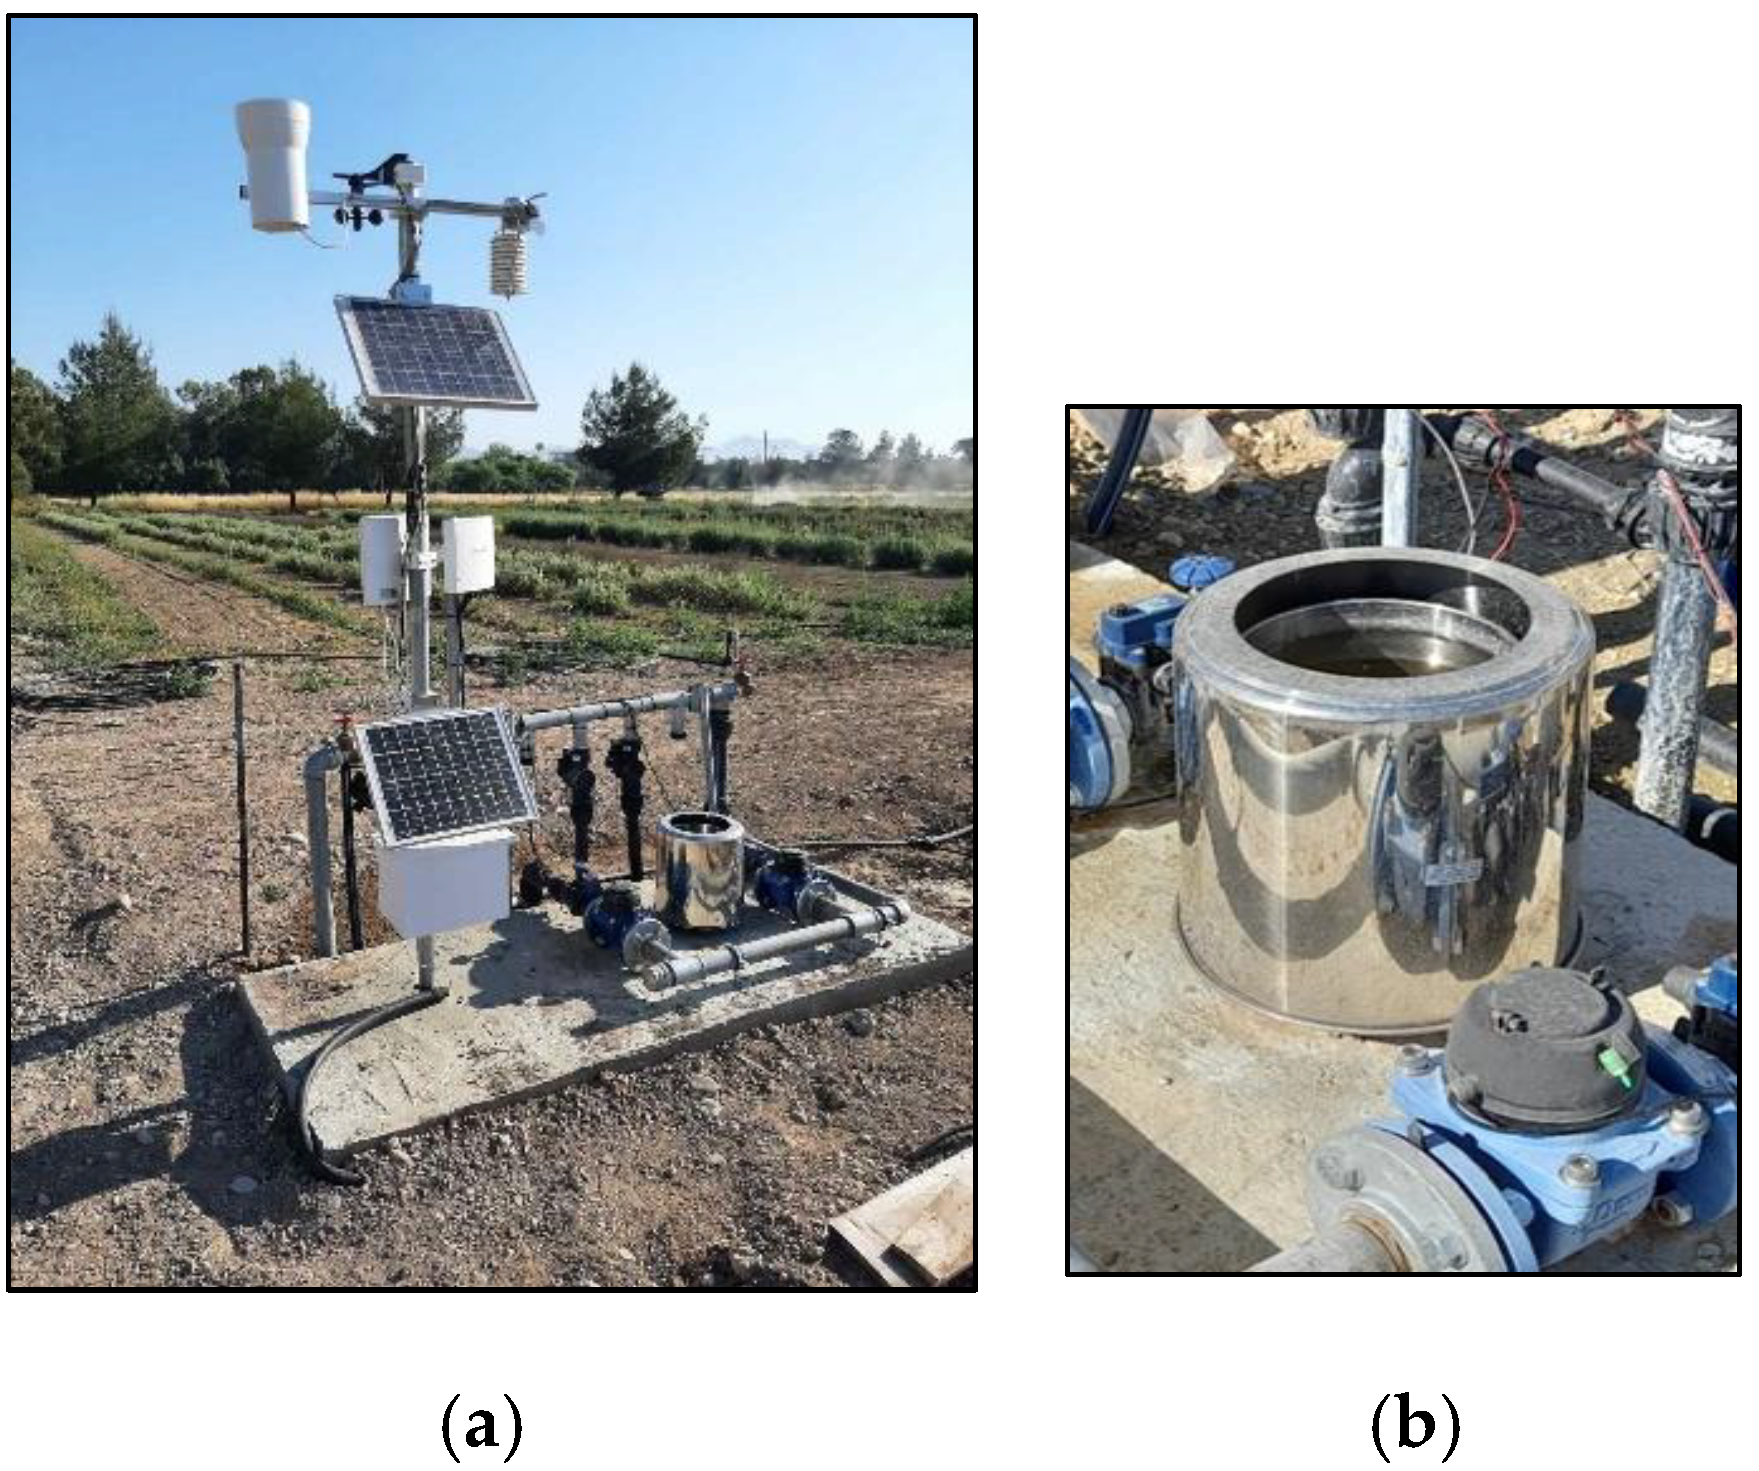
2.1. Study Site and Equipment

A telemetric weather station and a reduced-size 20 cm diameter pan evaporimeter (D20) (Figure 1) were installed near a growing area of aromatic crops in the southern part of Cyprus (Figure 1b; lat. 35°08′8.70 N, long. 33°24′9.60 E, altitude 165 m.s.l). The study site location is characterized by a typical Mediterranean climate with a rainy season (November–March; annual rainfall approximately 320 mm) and a long dry season (April–October) [19]. The average annual sunshine duration is about 3332 h [20].
The automatic pan (i.e., RS-EVA-N01-2; Shandong Renke Control Technology Co., Ltd.; Jinan City; Shandong; China) was installed above the ground next to the weather station (Figure 1), following the manufacturer’s instructions. The evaporimeter adopted the principle of pressure measurement, which measures the weight change of the liquid through the weighing principle based on a compression load cell. The evaporimeter adopts the standard Modbus-RTU protocol 485 signal output (measurement accuracy ±1%, response time < 1 s) connected to an electronic recording device of the weather station (MeteoSense 4.0; Netsens; Calenzano; Florence; Italy). A photovoltaic panel is used to supply a voltage of 10–30 VDC. Cell readings were taken by a digital data logger every 3 min and transferred to Netsens LiveData platform (data cloud platform; IoT system; https://www.netsens.it/en/app-livedata, accessed on 26 March 2025) with the use of a SIM card. The pan consisted of a double-layer 304-stainless steel structure that effectively shielded against external interference, ensuring more accurate measurement results. Water is added to the inner cylinder, which is 20 cm in height and 20 cm in diameter. The pan is filled to 5 cm below the rim (reference level) to be used as a ground automatic weight-recording rain gauge. The pan is manually refilled whenever the water level, as indicated by the gauge, drops by more than 2.5 cm from the reference level. Every week, the water was changed to eliminate extreme turbidity.
Evaporation was calculated at the same time every 24 h (24:00) as the depth of the water and converted to millimeters in height (Equation (1)) on the basis of the 3-minute time interval data. In the case of rain, the same equation was used to calculate the water weight gained (mm d−1):
E P = W w B A = g r   d 1 c m 2   = m l   d 1 c m 2 = c m 3   d 1   c m 2   10 1 = c m     d 1   10 = m m   d 1
where EP is the measured evaporation water level of the previous 24 h (mm d−1), WW is the water weight (gr d−1) and BA is the bottom area (cm2).
Weather data of air temperature, rain, relative humidity, wind speed, and solar radiation were recorded at the station mounted on a pole at a height of 2 m near the pan. The station consisted of a wind sensor (PS-0058-AD; 1–67 m s−1, accuracy 5%; direction 0–360°, accuracy 7°), a rain gauge (PS-0093-BM tipping bucket gauge made of ABS; resolution 0.2 mm), a solar radiation sensor (PS-0085-FFa; 0–1800 W m−2; accuracy 5%), a thermo-hydrometer for air temperature (−25 to +85 °C; accuracy 0.5 °C), and a thermo-hydrometer for air humidity (PS-0090-JG; 0–100 % RH; accuracy 3%). A solar panel was used as a source of power integrated with a storage battery. Climatic data were forwarded in real-time to the Netsens LiveData platform (data cloud platform; IoT system) with the use of a SIM card. Climatic data were recorded at 30-second intervals and averaged on an hourly basis.

2.2. Theoretical Background of Irrigation Scheduling

The irrigation dose (ID; the amount of water applied to the crop; mm) and irrigation application duration (IAD, minutes) can be estimated ex ante for any irrigation scheme, considering the soil characteristics and specific features of the irrigation system. The irrigation frequency (IF; the timing of irrigation application; days) is then calculated by dividing the irrigation dose (ID) by the crop evapotranspiration (ETC) (Equation (2)) following the single crop coefficient approach (Equation (3)) [9,18]:
F = I D E T C
E T C = K C   E T O = K C K P E P
where ID is the irrigation dose (mm), ETC is the crop evapotranspiration rate (mm d−1), KC is a crop coefficient (dimensionless), ETO is a reference crop evapotranspiration rate (mm d−1), KP is a pan coefficient (dimensionless), and EP is the pan evaporation (mm d−1).
A model consisting of a simple linear regression between the daily EP (measured) and ETO (estimated via the Penman–Monteith equation by retrieving climatic data from the weather station) may be applied to replace the ETO with daily observations of water evaporated from the pan. Equation (2) can then be rewritten follows:
I F = I D E T C   = I D K C E T O = I D K C f   ( E P ) = m m m m   d 1 = d a y s
where f (EP) is a regression model (i.e., the relationship between potential evapotranspiration (ETO) based on the P-M as a dependent variable and the water evaporation rate from the evaporimeter as a predictor (EP); ETO = f (EP); mm d−1).
Notably, the effective precipitation (Pe, mm) should be considered in the ID calculation following [21].

2.3. Data Acquisition and Statistical Analysis

A 365-day climatic measurement period was conducted throughout 2023. The calibration and validation processes between the EP and ETO were performed in two stages. First, regression analysis was conducted by retrieving data over several months (January –June and September–December), considering the effects of seasonality on the water evaporation rate. The model was subsequently validated during a high evaporative demand period (July and August). The use of a pan evaporimeter as an automatic weighing rain gauge was also evaluated during the winter period.
The data were analyzed, and mean comparisons were tested using the Statistical Package for the Social Sciences (IBM Corp. Release 2011) in IBM SPSS Statistics for Windows, Version 20.0. Armonk, NY, USA: IBM Corp.

3. Results and Discussion

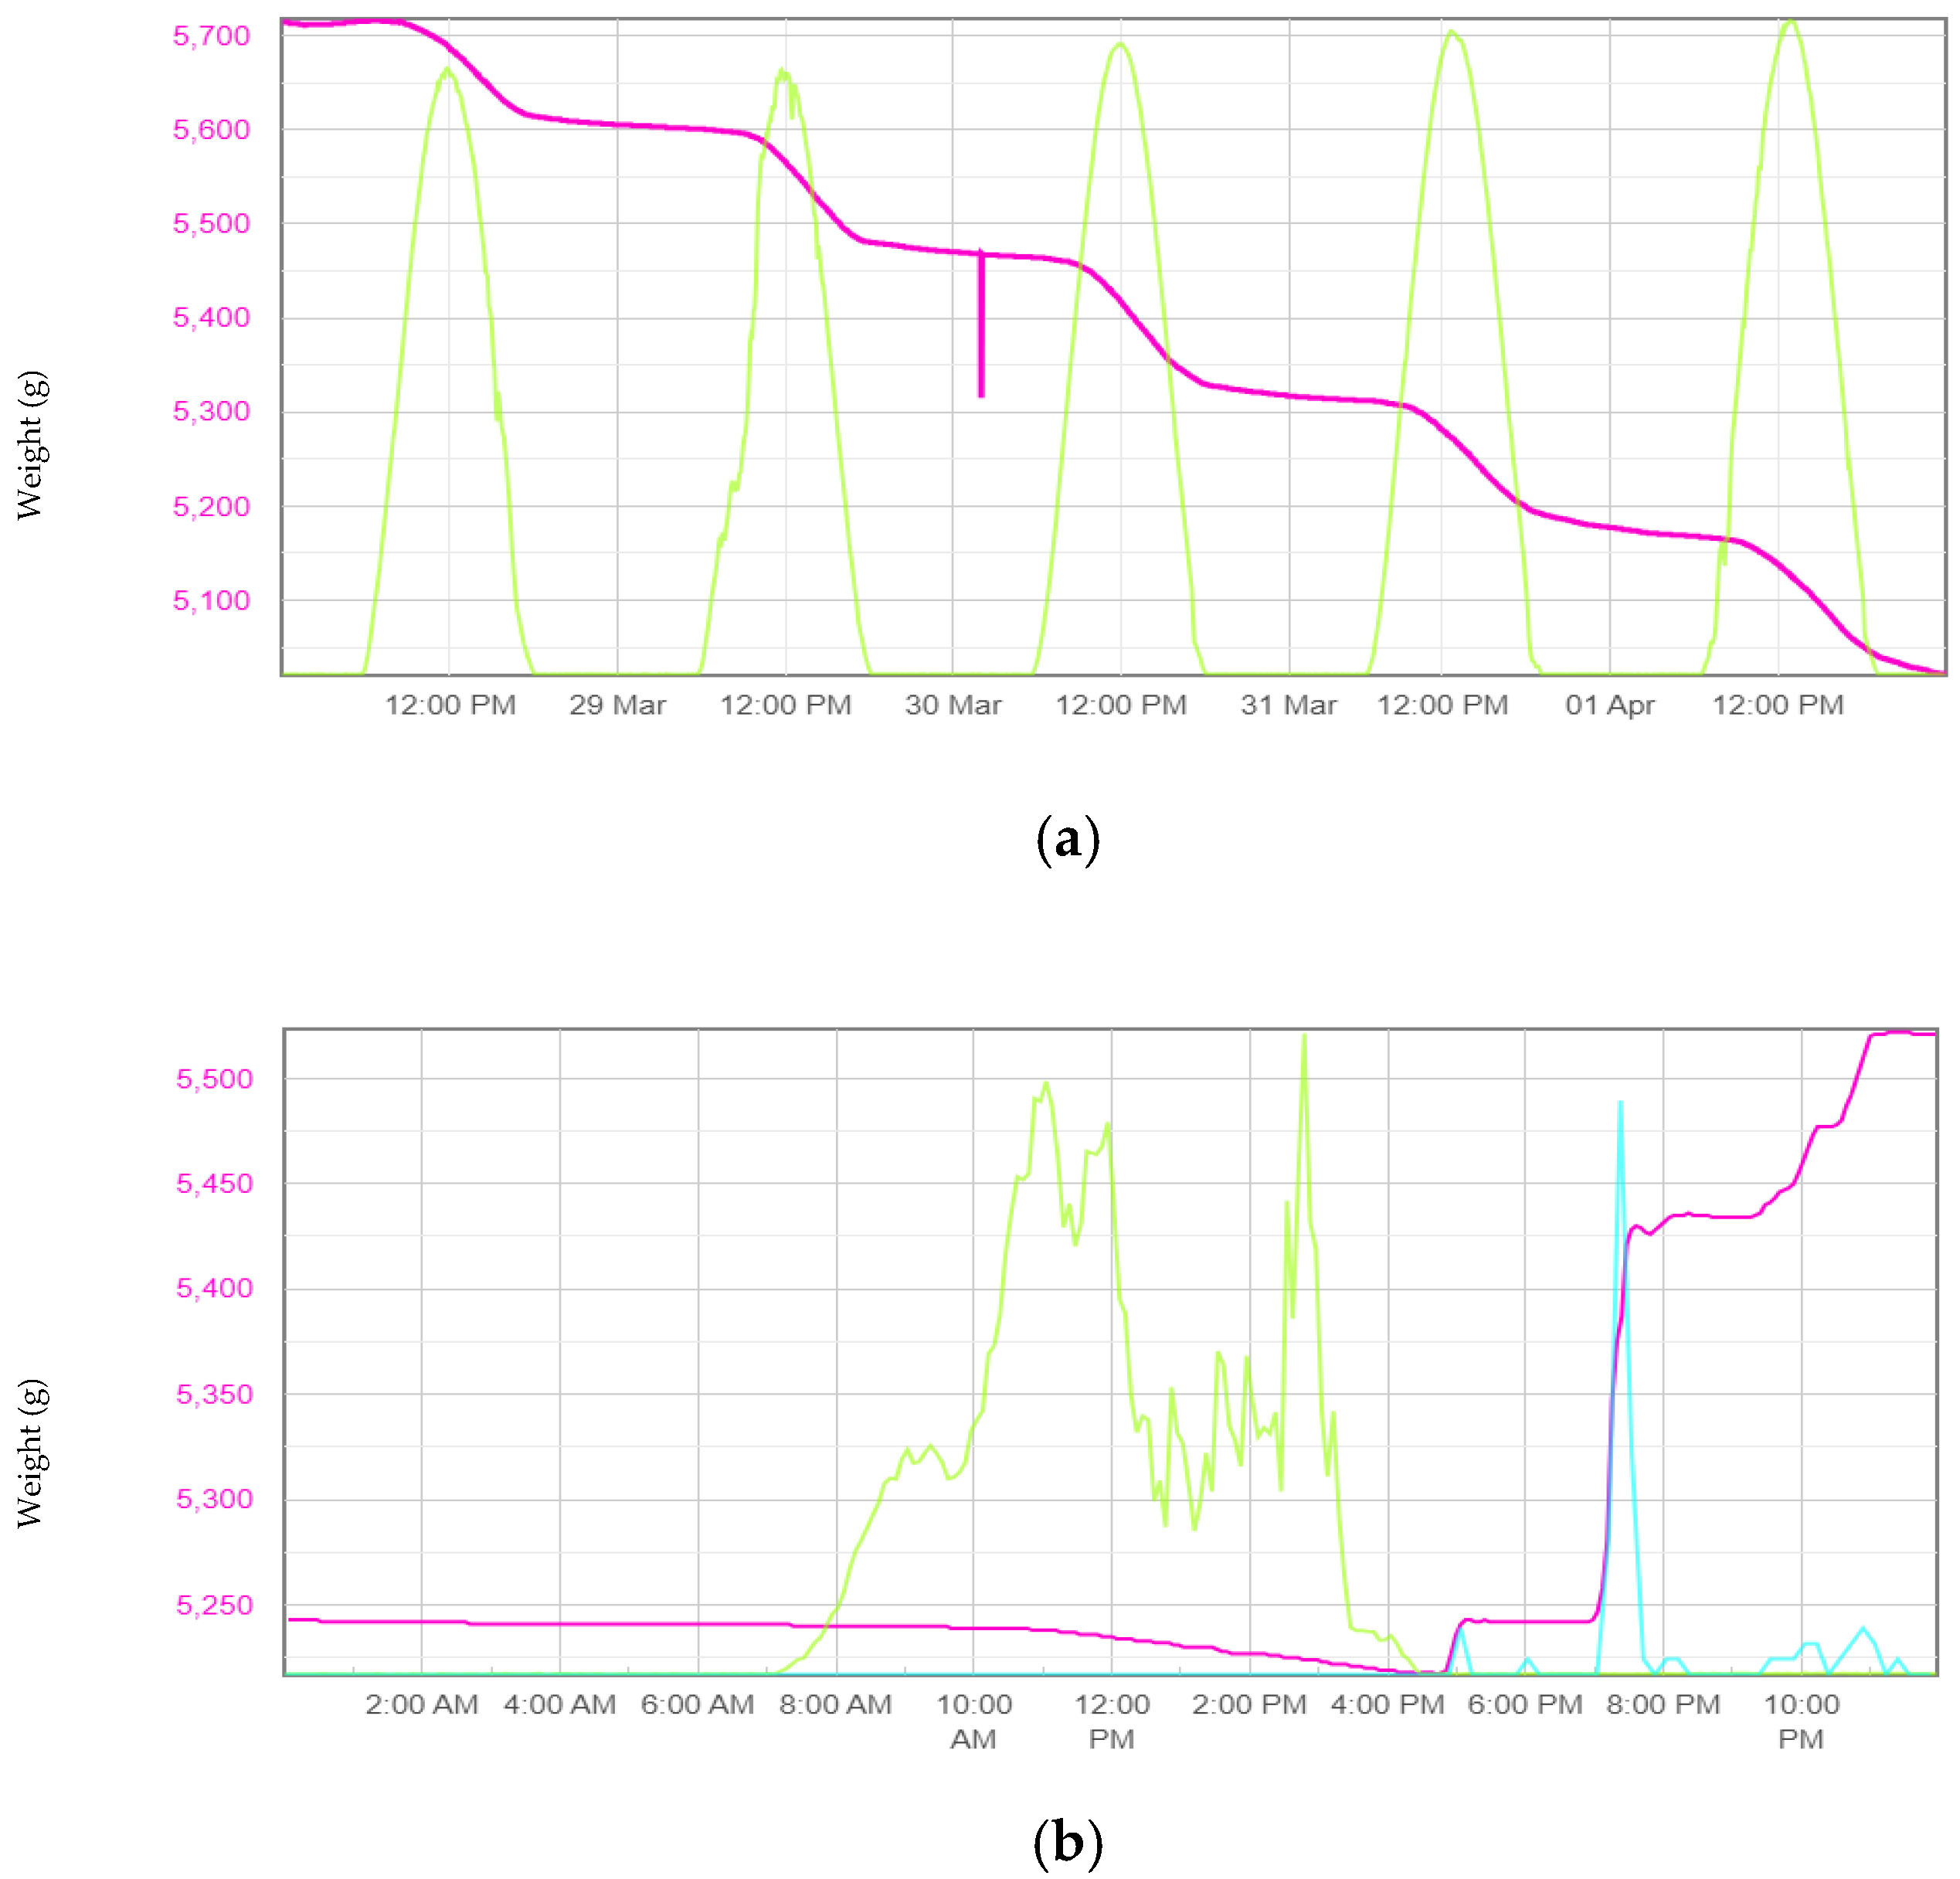
3.1. Pan Evaporation and Climatic Conditions

Figure 2a shows the variation patterns of water weight (purple line; g) and solar radiation (green line; W m−2) over a five-day period for the reduced-sized pan. There is a daily decreasing trend in water weight due to evaporation. The blue line in Figure 2b indicates precipitation within a single day. The evaporimeter gained weight (shown by the purple line) during rainfall. Since the pulse recording signal of the pan values was set to a 3-minute time step, the evaporimeter, which functions as an automatic weighing rain gauge, responded immediately and accurately to rainfall with positive water weight values.
Table 1 summarizes the mean monthly values of several climatic conditions during the experimental period. It also shows the potential evapotranspiration (ETO) as calculated with the Penman–Monteith equation, the pan evaporation (EP), and the calculated pan coefficient value (KP). As expected, seasonality affects ETO and EP, with lower values observed during the winter period because of lower solar radiation. The mean daily pan evaporation (EP) for the measurement period was 3.61 (±1.95) mm, i.e., 16.34% higher than the calculated evapotranspiration (ETO) based on the P-M model (3.02 ± 1.70 mm; Table 1).
The maximum pan evaporation in July was 6.99 mm (EP) and 5.94 mm (ETo). The mean daily precipitation for 19 observations (rainy days during the winter season) using a pan as a rain gauge (PR) was 1.32 (±0.46) mm, and from the weather station (i.e., rain gauge; tipping bucket gauge) (SR) 1.25 (±0.16) mm. The maximum daily precipitation recorded was 15.25 mm (PR) and 16.50 mm (SR).
The mean daily pan coefficient (KP; dimensionless) value as the ratio of ETO (P-M model) to EP (ETO = KP*EP, FAO) was estimated at 0.84 (±0.16), with a minimum of 0.64 in October and a maximum of 0.96 in May. The KP values reported in this study agreed with the findings of [8], who reported that the KP values of small pans ranged between 0.84 and 1.06. In another case, the KP of small-pan sensitivity to weather conditions in China was evaluated considering a network of 767 climatic stations, and it was found to vary from 0.29 to 0.91 [22] For the classical standard pan evaporimeter (120.7 cm in diameter), the estimated KP value under semiarid climatic conditions was 0.82 [23]. It is therefore recommended that, due to the sensitivity of the KP to different weather variables and the different pan materials and geometry, the KP values always deviate from the ideal value of 1 and should in any case be properly locally calibrated [24].

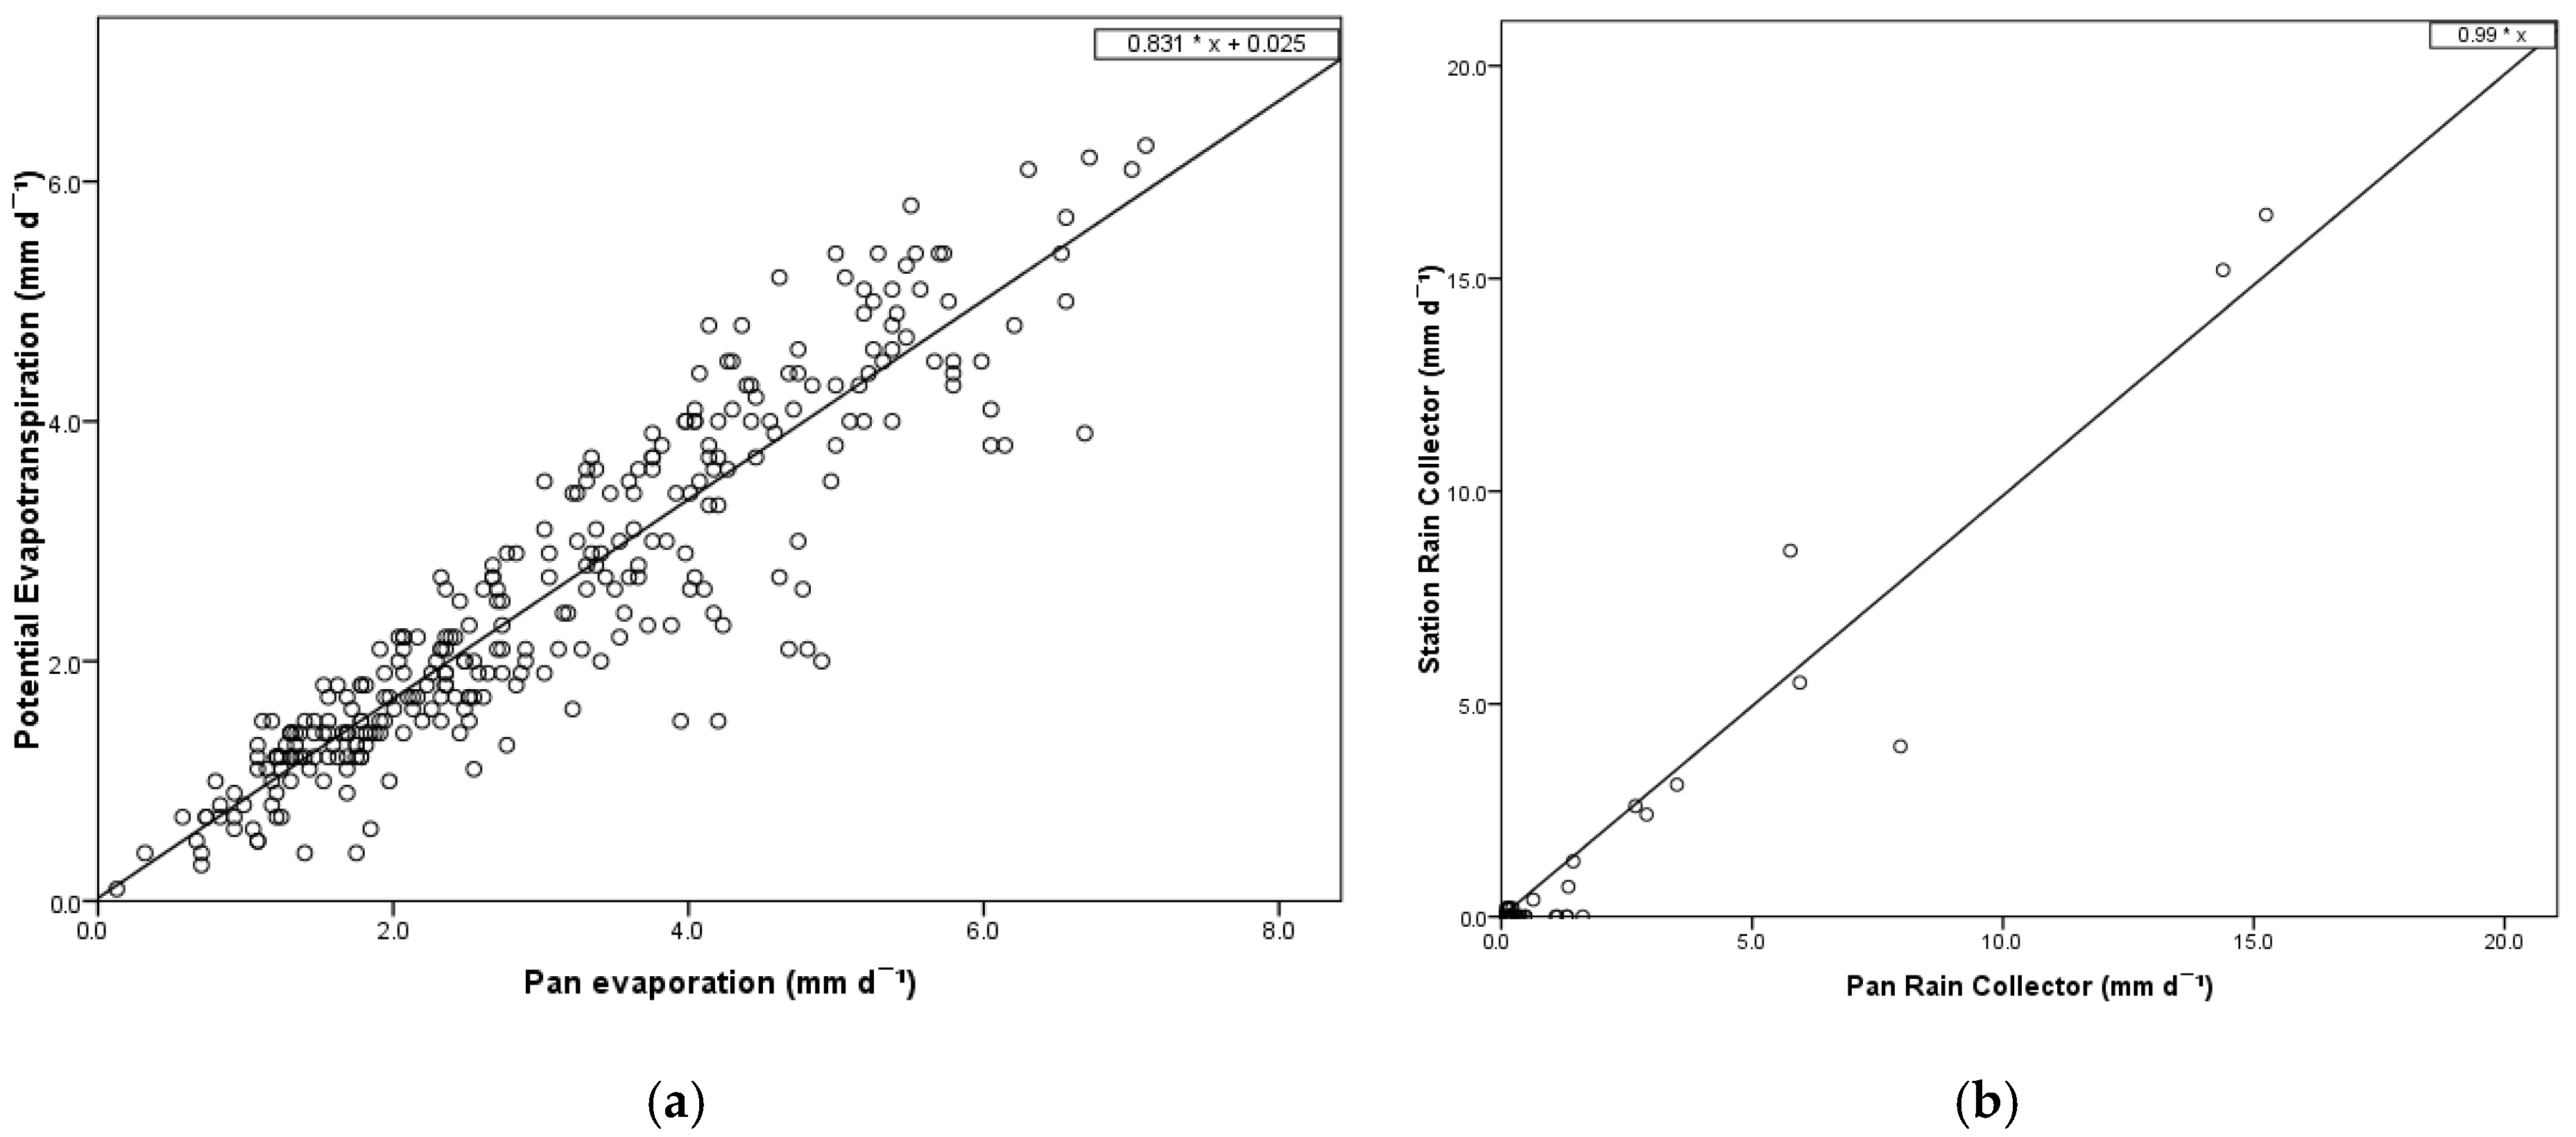
3.2. Model Calibration and Validation

A linear regression analysis was developed considering mean daily pan evaporation (EP) as the predictor and potential evapotranspiration (ETO) based on P-M as the dependent variable (Figure 3a). For a number of observations (n = 303), EP was a significant predictor of (ETO), with a coefficient of determination of r2 = 0.84 and a slope of the regression line (i.e., beta value) of 0.92.
The use of a pan evaporimeter as an automatic weighing rain gauge was also evaluated. Considering the pan rain gauge as a predictor (PR) and the station tipping bucket gauge (SR) as a dependent variable, a relationship was established for 19 observations during the rainy season. PR was a significant predictor of the SR, with r2 = 0.94 and a beta value of 0.97 (Figure 3b).
The ETO calculated based on the linear regression model (ETO = 0.831*EP + 0.025) was tested during a high evaporative demand period (July and August) to attempt validation. The amount of water evaporated from pan EP was used for ETOC (calculated potential evapotranspiration) and compared with the ETOM (measured potential evapotranspiration) from the weather station, with satisfactory results (Figure 4).
The results show that the ETOC could significantly predict ETOM (r2 = 0.99) with a slope of the regression line of 0.9. The mean ETOM was 5.344 (±0.10) mm and the mean ETOC was 5.342 (±0.12) mm. The mean air temperature during the validation period was 30 °C, i.e., 42.7% higher than the mean air temperature during the calibration period (17.2 °C). Similarly, the mean maximum solar radiation value was 808 W m−2, which was also 22% greater (630 W m−2) than in the calibration period, ensuring that the following model can be used under a wide range of climatic conditions:
E T C = f   E P ,   K C 0.831 E P   + 0.025
Therefore, the frequency of irrigation could be triggered by rewriting Equation (4) as follows (Equation (6)):
I F = I D E T C   = I D K C 0.831 E P     + 0.025 = d a y s
Until now, pans have been used mainly as water evaporation apparatuses. A second objective of the study was to show that a reduced-sized evaporimeter (D20) could also be used as an automatic weight-recording rain gauge. It appears that allowing the water to drop 2.5 cm below the reference water level was sufficient to prevent excessive water from splashing during precipitation. In another study, tipping bucket gauges noticeably underestimated rainfall during heavy rain and windy conditions [24]. In a number of hydrological applications, such as rainfall–runoff models, basin water balance, and flood forecasts, monitoring rainfall using ground sensors is therefore preferable [25].
Under semiarid conditions during the irrigation period, there may be only a few rainy days. In another case, the variation in precipitation at three different locations under a semiarid Mediterranean climate was evaluated. As the results show, during the irrigation period (i.e., April to October), the cumulative rainfall over two to three consecutive days was less than 75 mm, which is the upper limit of the water depth in the evaporimeter [18]. Our results suggest that the evaporimeter could also be used as a rain gauge, thereby postponing an irrigation event or readjusting the irrigation dose in a multiscale irrigation scheduling modeling system.

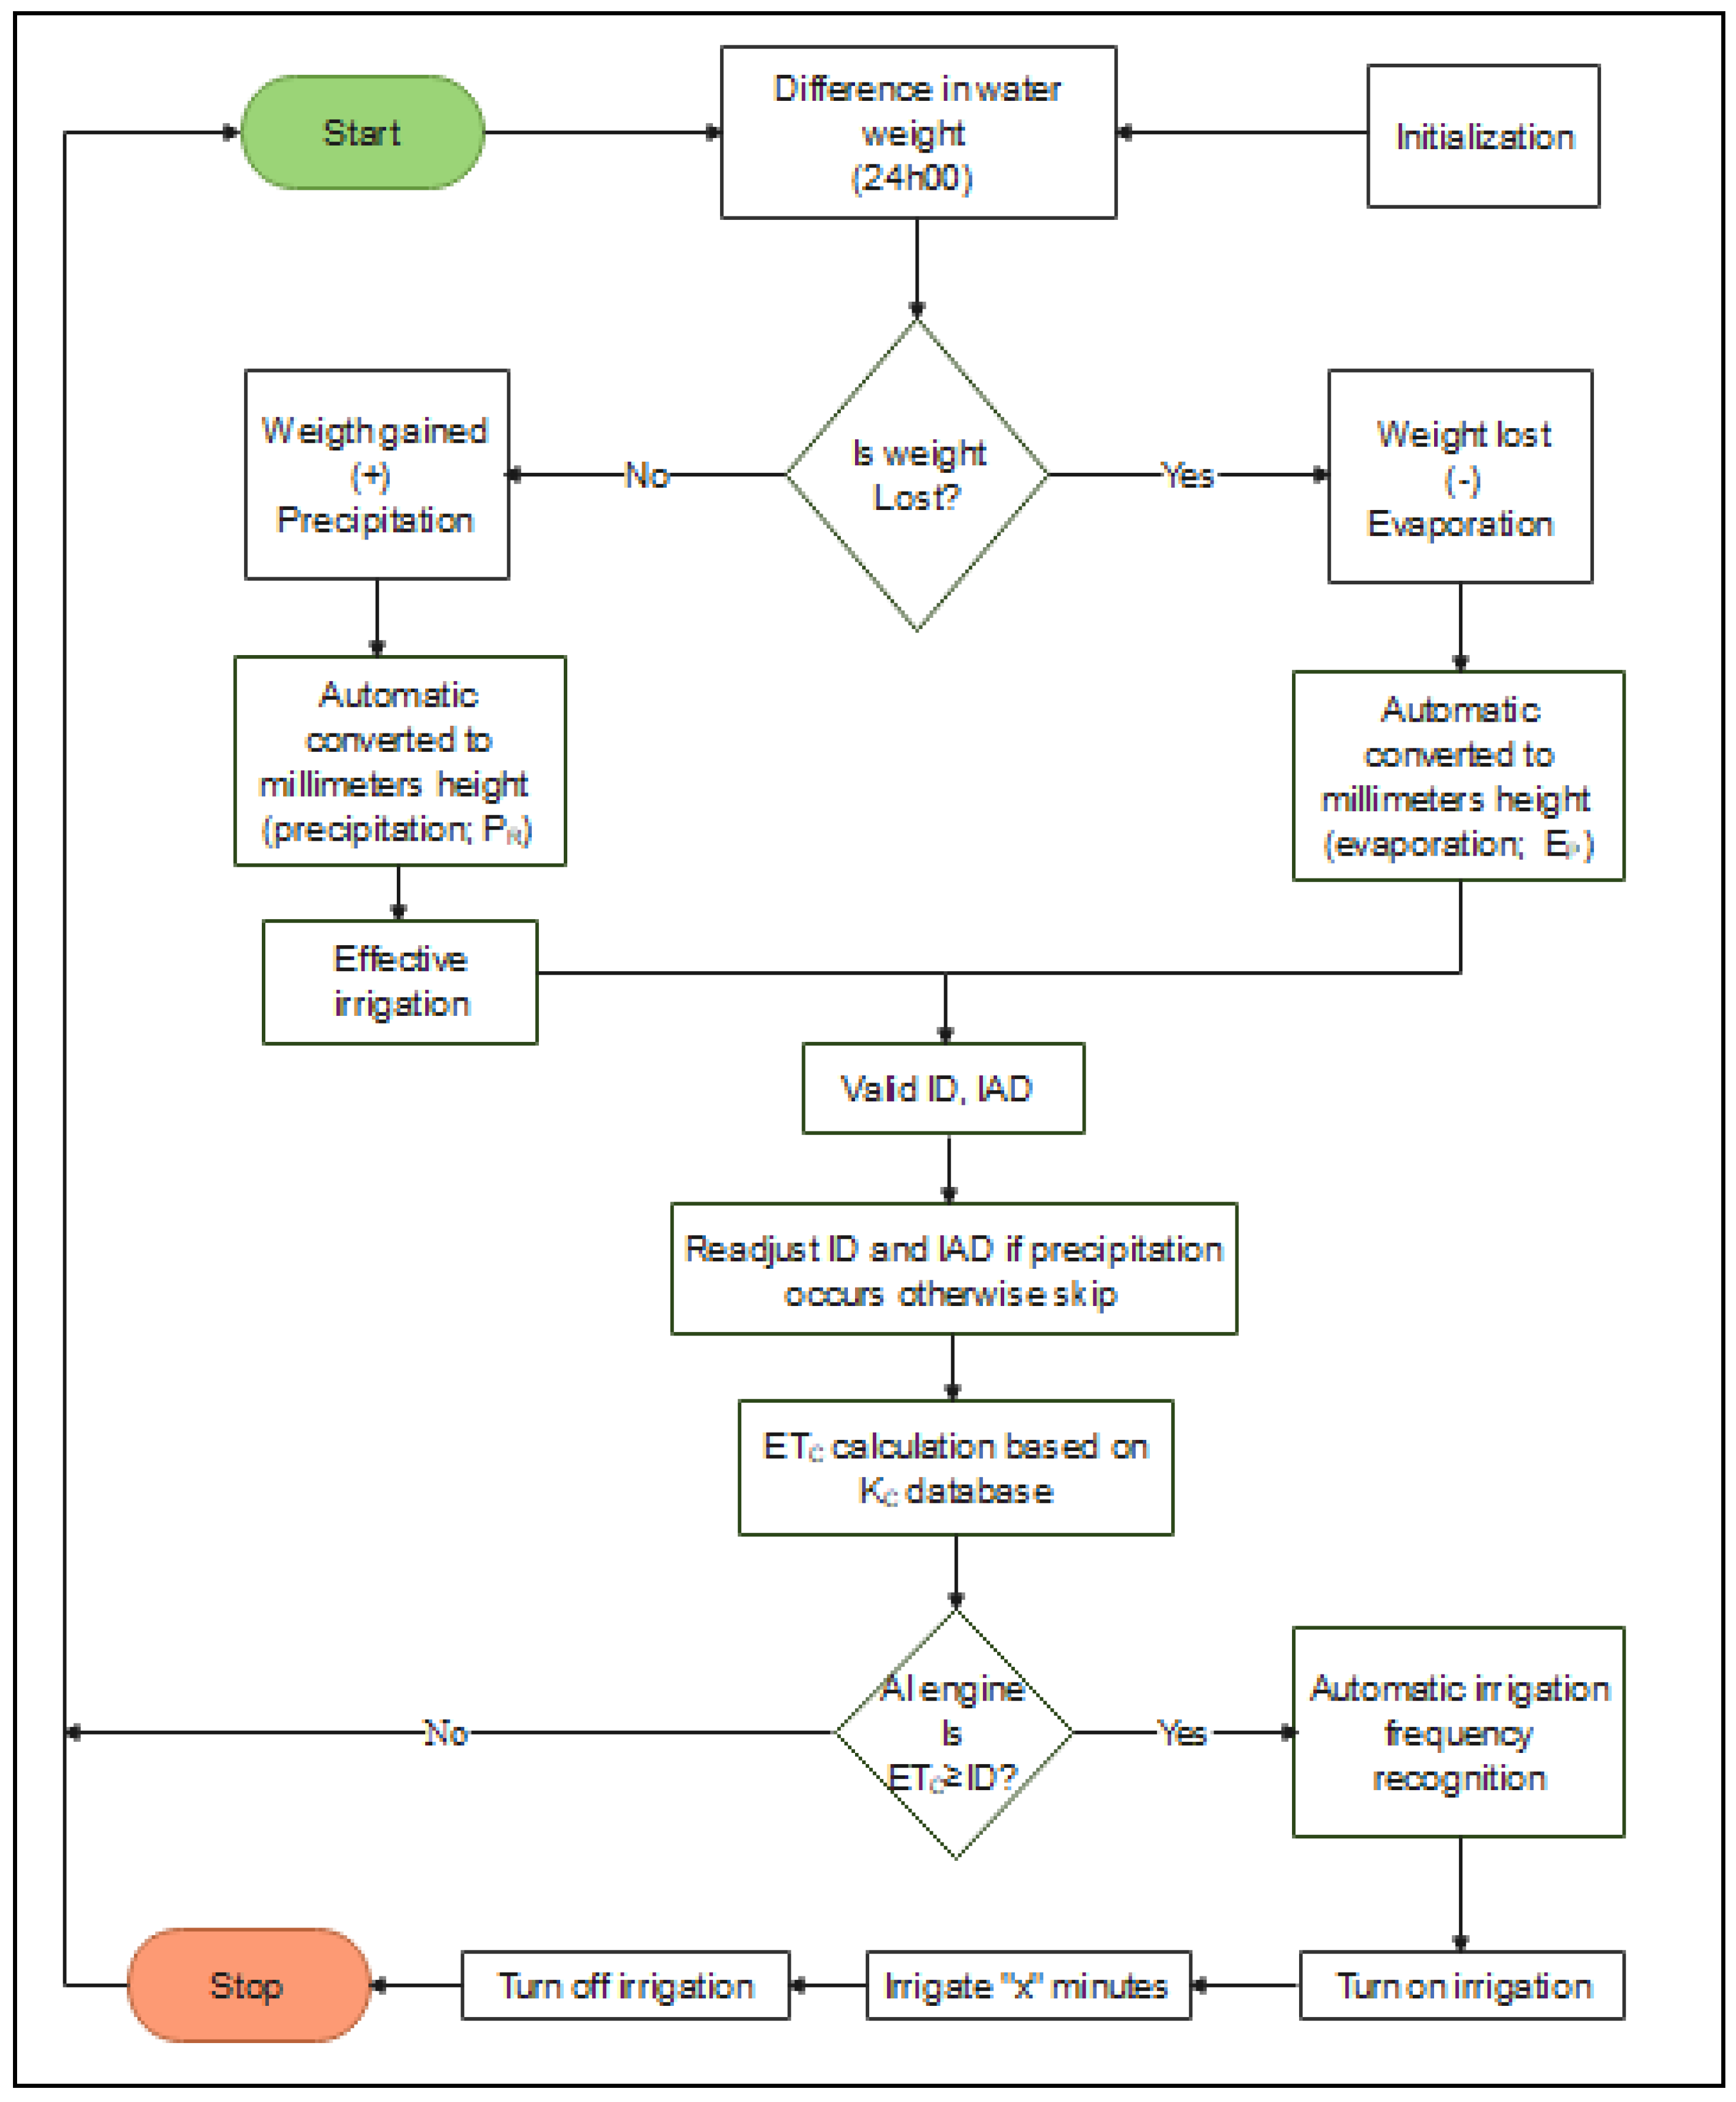
3.3. Irrigation Scheduling Decision Support Tool

The irrigation scheduling decision tree process defines common mandatory requirements applicable to the design of a feedback irrigation scheduling support system, including the way ex post controls are conducted on the basis of evaporimeter input variables (i.e., evaporation and rainfall) (Figure 5). The first level of the algorithm is intended to calculate the daily difference in water weight at a fixed time interval (i.e., at 24:00). The classification algorithm should be programmable, so that the state of an input variable (i.e., data wrangling) can be characterized either as a positive value (i.e., water added due to rain; “NO, +”) or a negative value (i.e., water lost due to evaporation; “YES, −”). The water weight difference is then converted to millimeters of water height considering Equation (1). In the case of rain (+), the value should be readjusted to account for effective precipitation [21].
The second level of the procedure considers two types of input, namely, the irrigation dose (ID; mm) and the irrigation application duration (IAD; minutes). Those values should be manually set in the software program as constant factors (for perennial crops) or periodically readjusted, mainly for annual crops, accounting for root and vegetative crop growth. In the case of rain, a subtraction of the effective precipitation from the ID set limit is needed to decrease the IAD; otherwise, this step is skipped.
In the third-level KC input database, values are needed for the ETC calculation (Equation (3)). The value of KC has the ability to determine the actual ETC precisely [14]; therefore, we recommend using locally calibrated values. For the ETO calculation estimation, the proposed linear regression developed between ETO and EP (supervised learning) should be used.
The final step of the procedure is the calculation of the irrigation frequency (Equation (6)). If the calculated daily ETC value is lower than the programmable ID value, then the algorithm should run the decision tree again from the first level. If the calculated accumulated ETC value since the last irrigation is equal to or greater than the ID value, then irrigation valves are set according to the preset time. After an “x” irrigation time, the irrigation stops to follow the same AI procedure for the next irrigation cycle.
To our knowledge, this is the first time that a small evaporimeter (D20 cm) has been proposed for irrigation scheduling based on multiscale modelling systems, although climatic variables are considered the most commonly used environmental data for artificial intelligence water strategies [16]. In another case, an irrigation scheduling approach was triggered on the basis of the hydraulic signaling of a reduced-size pan for open field and greenhouse crops [26]. Overall, [25] highlights the importance of measuring rainfall using ground sensors.
Although the calibration and validation methods for water evaporation and rainfall were based on a limited time series (one year of climatic data), the purpose of the current study was to propose a feedback irrigation scheduling support system based on the dual use of an evaporimeter.

4. Conclusions

In this work, we defined the relationship between evaporation from an automatic, weight-based, small 20 cm diameter pan and potential evapotranspiration calculated by the Penman–Monteith equation. We then described how to develop an open-source smart irrigation scheduling decision support system that considers water evaporation and rainfall, particularly for semiarid environments. The framework is designed to customize watering schedules and run times, thus maximizing water efficiency during the irrigation period, which is usually limited between April and October. This paper discusses the results of evaporimeter calibration as both an evaporative water monitor and an automatic weighing rain gauge. The primary focus of this research was the evaporimeter as an irrigation scheduling device aimed at water saving in water-scarce regions.

Author Contributions

Conceptualization, G.N. and D.N.; methodology, G.N. and E.K.; validation, G.N. and E.K.; investigation, G.N. and D.N.; writing—original draft preparation, G.N., E.E., D.N., and E.K.; writing—review and editing, G.N.; supervision, G.N. and D.N. All authors have read and agreed to the published version of the manuscript.

Funding

This research received no external funding.

Data Availability Statement

Data available on request from the authors.

Conflicts of Interest

The authors declare no conflicts of interest.

References

  1. Seker, M.; Gumus, V. Projection of Temperature and Precipitation in the Mediterranean Region through Multi-Model Ensemble from CMIP6. Atmos. Res. 2022, 280, 106440. [Google Scholar] [CrossRef]
  2. Nikolaou, G.; Neocleous, D.; Christou, A.; Kitta, E.; Katsoulas, N. Implementing Sustainable Irrigation in Water-Scarce Regions under the Impact of Climate Change. Agronomy 2020, 10, 1120. [Google Scholar] [CrossRef]
  3. Martey, E.; Etwire, P.M.; Adombilla, R.; Abebrese, S.O. Information Constraint and Farmers’ Willingness to Pay for an Irrigation Scheduling Tool. Agric. Water Manag. 2023, 276, 108043. [Google Scholar] [CrossRef]
  4. Boso, A.C.M.R.; Campos, F.S.; Pai, A.D. Calibrated Models to Estimate Referensce Evapotranspiration, for the City of Botucatu/Sp, in Relation to the Weighing Lysimeter. Model. Earth Syst. Environ. 2024, 10, 6599–6612. [Google Scholar] [CrossRef]
  5. Sharma, D.N.; Tare, V. Assessment of Irrigation Requirement and Scheduling under Canal Command Area of Upper Ganga Canal Using CropWat Model. Model. Earth Syst. Environ. 2022, 8, 1863–1873. [Google Scholar] [CrossRef]
  6. Zereg, S.; Belouz, K. Prediction of Reference Evapotranspiration in Northwestern Africa with Limited Data Using Factorial and SVM Regressions. Model. Earth Syst. Environ. 2022, 8, 5129–5142. [Google Scholar] [CrossRef]
  7. World Meteorological Organization. Guide to Meteorological Instruments and Methods of Observation. In World Meteorological Organization Volume 8 of Organisation Météorologique Mondiale Issue 8 of WMO (Series) WMO No. 8; World Meteorological Organization: Geneva, Switzerland, 1983. [Google Scholar]
  8. Awe, G.O.; Akomolafe, T.N.; Umam, J.; Ayuba, M.B. Efficiency of Small Pan Evaporimeter in Monitoring Evapotranspiration under Poly-Covered House and Open-Field Conditions in a Hot, Tropical Region of Nigeria. J. Hydrol. Reg. Stud. 2020, 32, 100735. [Google Scholar] [CrossRef]
  9. Allen, R.G.; Pereira, L.S.; Raes, D.; Smith, M. FAO Irrigation and Drainage Paper No. 56—Crop Evapotranspiration; Food and Agriculture Organization of the United Nations: Rome, Italy, 1998. [Google Scholar]
  10. Liu, H.J.; Cohen, S.; Tanny, J.; Lemcoff, J.H.; Huang, G.H. Estimation of Banana (Musa sp.) Plant Transpiration Using a Standard 20 cm Pan in a Greenhouse. Irrig. Drain. Syst. 2008, 22, 311–323. [Google Scholar] [CrossRef]
  11. Patel, P.; Patel, Y.; Patel, U.; Patel, V.; Patel, N.; Oza, P.; Patel, U. Towards Automating Irrigation: A Fuzzy Logic-Based Water Irrigation System Using IoT and Deep Learning. Model. Earth Syst. Environ. 2022, 8, 5235–5250. [Google Scholar] [CrossRef]
  12. Dalias, P.; Christou, A.; Neocleous, D. Adjustment of Irrigation Schedules as a Strategy to Mitigate Climate Change Impacts on Agriculture in Cyprus. Agriculture 2019, 9, 4. [Google Scholar] [CrossRef]
  13. Kumar, N.; Shankar, V.; Poddar, A. Investigating the Effect of Limited Climatic Data on Evapotranspiration-Based Numerical Modeling of Soil Moisture Dynamics in the Unsaturated Root Zone: A Case Study for Potato Crop. Model. Earth Syst. Environ. 2020, 6, 2433–2449. [Google Scholar] [CrossRef]
  14. Saggi, M.K.; Jain, S. A Survey Towards Decision Support System on Smart Irrigation Scheduling Using Machine Learning Approaches. Arch. Comput. Methods Eng. 2022, 29, 4455–4478. [Google Scholar] [CrossRef] [PubMed]
  15. Bencini, L.; Di, D.; Collodi, G.; Manes, A.; Manes, G. Wireless Sensor Networks for On-Field Agricultural Management Process. In Wireless Sensor Networks: Application-Centric Design; IntechOpen: Rijeka, Croatia, 2010. [Google Scholar] [CrossRef]
  16. Alvim, S.J.T.; Guimarães, C.M.; de Sousa, E.F.; Garcia, R.F.; Marciano, C.R. Application of Artificial Intelligence for Irrigation Management: A Systematic Review. Eng. Agrícola 2022, 42, e20210159. [Google Scholar] [CrossRef]
  17. Singh, A.K.; Singh, A.K.; Bhardwaj, A.K.; Verma, C.L.; Mishra, V.K.; Arora, S.; Sharma, N.; Ojha, R.P. Automation in Scheduling Irrigation: A Review of Concepts and Latest Recommendations in Technology. J. Nat. Resour. Conserv. Manag. 2021, 2, 47–56. [Google Scholar] [CrossRef]
  18. Nikolaou, G.; Neocleous, D.; Manes, A.; Kitta, E. Calibration and Validation of Solar Radiation-Based Equations to Estimate Crop Evapotranspiration in a Semi-Arid Climate. Int. J. Biometeorol. 2024, 68, 1–15. [Google Scholar] [CrossRef] [PubMed]
  19. Jacovides, C.P.; Assimakopoulos, V.D.; Tymvios, F.S. Measured on the Island of CyprusSolar Global UV (280–380 nm) Radiation and Its Relationship with Solar Global Radiation. Energy 2006, 31, 2728–2738. [Google Scholar] [CrossRef]
  20. Pashiardis, S.; Sa, K.; Pelengaris, A. Characteristics of Photosynthetic Active Radiation (PAR) Through Statistical Analysis at Larnaca, Cyprus. SM J. Biom. Biostat. 2017, 2, 1–16. [Google Scholar]
  21. Zhang, Y.; Guo, L.; Liang, C.; Zhao, L.; Wang, J.; Zhan, C.; Jiang, S. Encounter Risk Analysis of Crop Water Requirements and Effective Precipitation Based on the Copula Method in the Hilly Area of Southwest China. Agric. Water Manag. 2022, 266, 107571. [Google Scholar] [CrossRef]
  22. Wang, K.; Liu, X.; Tian, W.; Li, Y.; Liang, K.; Liu, C.; Li, Y.; Yang, X. Pan Coefficient Sensitivity to Environment Variables Across China. J. Hydrol. 2019, 572, 582–591. [Google Scholar] [CrossRef]
  23. Sahin, U.; Kuslu, Y.; Tunc, T.; Kiziloglu, F.M. Determining Crop and Pan Coefficients for Cauliflower and Red Cabbage Crops Under Cool Season Semiarid Climatic Conditions. Agric. Sci. China 2009, 8, 167–171. [Google Scholar] [CrossRef]
  24. Duchon, C.E.; Biddle, C.J. Undercatch of Tipping-Bucket Gauges in High Rain Rate Events. Adv. Geosci. 2010, 25, 11–15. [Google Scholar] [CrossRef]
  25. Dervos, N.A.; Baltas, E.A. Development of Experimental Low-Cost Rain Gauges and Their Evaluation During a High Intensity Storm Event. Environ. Process. 2024, 11, 6. [Google Scholar] [CrossRef]
  26. Zeng, C.Z.; Bie, Z.L.; Yuan, B.Z. Determination of Optimum Irrigation Water Amount for Drip-Irrigated Muskmelon (Cucumis Melo L.) in Plastic Greenhouse. Agric. Water Manag. 2009, 96, 595–602. [Google Scholar] [CrossRef]
Figure 1. A telemetric weather station (a) and a reduced-size 20 cm diameter pan evaporimeter (b).
Agronomy 15 00848 g001
Figure 2. Water weight (g) (variation patterns (purple line) during a five-day measurement period (a) and within a day (b); solar radiation values are indicated by a green line color, and precipitation is indicated by a blue color.
Agronomy 15 00848 g002
Figure 3. Potential evapotranspiration (ETO; mm d−1) vs. pan evaporation (EP; mm d−1) (a); pan precipitation (PR; mm d−1) vs. rain collector (SR; mm d−1) (b).
Agronomy 15 00848 g003
Figure 4. Calculated potential evapotranspiration ETOC (mm d−1) based on the proposed model vs. potential evapotranspiration measured ETOM (mm d−1).
Agronomy 15 00848 g004
Figure 5. Irrigation scheduling decision tree process; irrigation dose, (ID); irrigation application duration, (IAD), ETC, crop evapotranspiration; KC, crop coefficient.
Agronomy 15 00848 g005
Table 1. Monthly mean daily climatic conditions, potential evapotranspiration (ETO; mm d−1), pan evapotranspiration (EP; mm d−1), and pan coefficient value (Kp; dimensionless). The values in parentheses represent the standard error (±).
MonthTRHRSRHSRWWmETOEPKP
110 (1.3)78 (6.7)1.52 (4.0)425 (81.4)6.420.82 (0.6)3.08 (1.18)1.16 (0.35)1.32 (0.39)0.88 (0.17)
28 (2.8)72 (6.7)1.32 (3.4)556 (136.2)7.210.68 (0.26)2.96 (0.74)1.51 (0.56)1.67 (0.55)0.90 (0.19)
313 (1.7)71 (8.6)1.77 (4.8)697 (89.5)8.480.88 (0.32)3.15 (0.83)2.17 (0.70)2.31 (0.83)0.95 (0.10)
416 (2.1)65 (6.0)1.49 (5.6)809 (96.6)9.731.01 (0.32)3.50 (0.73)3.09 (0.96)3.30 (1.02)0.94 (0.14)
521 (2.0)63 (11.5)0.83 (2.9)887 (58.7)10.741.15 (0.41)3.79 (1.33)3.96 (1.04)4.17 (1.15)0.96 (0.12)
625 (2.2)59 (10.7)0.15 (0.8)861 (73.6)11.671.10 (0.21)3.34 (0.56)4.73 (1.00)5.13 (1.16)0.92 (0.08)
731 (2.4)45 (16.3)0.01 (0.1)835 (17.8)11.971.14 (0.15)3.20 (0.49)5.94 (0.68)6.99 (1.24)0.86 (0.07)
829 (1.0)65 (6.3)0.3 (1.6)781 (31.2)10.681.01 (0.11)2.99 (0.49)4.75 (0.54)5.80 (0.74)0.82 (0.07)
927 (0.9)58 (8.9)0.01 (0.1)703 (59.2)9.530.87 (0.18)3.01 (0.60)3.93 (0.53)4.94 (0.77)0.80 (0.13)
1022 (1.0)64 (7.8)0.18 (0.4)531 (84.3)7.940.65 (0.18)2.91 (0.83)2.22 (0.52)3.49 (0.86)0.64 (0.13)
1117 (3.5)71 (6.2)0.35 (1.0)459 (60.1)6.630.72 (0.38)2.91 (0.74)1.63 (0.37)2.46 (0.60)0.67 (0.11)
1213 (1.5)78 (4.9)1.05 (3.4)369 (68.0)6.130.55 (0.31)2.57 (1.08)1.08 (0.33)1.49 (0.35)0.73 (0.18)
AVG20 (7.5)66 (12.5)0.75 (3.0)660 (191.9)8.940.88 (0.37)3.12 (0.89)3.02 (1.70)3.61 (1.95)0.84 (0.16)
T, air temperature (°C; mean daily values); RH, air relative humidity (%; mean daily values); R; rain (mm; mean daily values); SR, solar radiation (W m−2; mean maximum values); HSR, hours of solar radiation (h); W, wind velocity (km h−1 mean daily values), and Wm, wind velocity (km h−1 maximum daily values).
Disclaimer/Publisher’s Note: The statements, opinions and data contained in all publications are solely those of the individual author(s) and contributor(s) and not of MDPI and/or the editor(s). MDPI and/or the editor(s) disclaim responsibility for any injury to people or property resulting from any ideas, methods, instructions or products referred to in the content.

