Article

Quantitative Trait Locus Mapping for Rapid Visco Analyzer Parameters in Wheat (Triticum aestivum L.)

1
Institute of Food Crops, Jiangsu Academy of Agricultural Sciences, Nanjing 210014, China
2
College of Life Science and Food Engineering, Huaiyin Institute of Technology, Huaian 223003, China
3
Department of Agronomy, College of Agriculture and Biotechnology, Zhejiang University, Hangzhou 310058, China
*
Authors to whom correspondence should be addressed.
Agronomy 2025, 15(4), 790; https://doi.org/10.3390/agronomy15040790
Submission received: 9 February 2025 / Revised: 21 March 2025 / Accepted: 22 March 2025 / Published: 24 March 2025
(This article belongs to the Section Crop Breeding and Genetics)

Abstract

:
The pasting properties of starch measured using the rapid visco analyzer (RVA) have important effects on the quality of wheat flour as well as flour-based foods. To identify quantitative trait loci (QTLs) for RVA parameters, a doubled-haploid population of 194 lines was used for linkage mapping in this study. A total of 39 QTLs with an LOD value ≥ 3.0 were detected across three years for six RVA parameters on 17 of the 21 chromosomes of common wheat (4A, 4B, 6B, and 7A were not considered). Among these QTLs, two QTLs for peak viscosity on 2A and 6A, two QTLs for trough viscosity on 2A and 6A, one QTL for breakdown on 5D, and two QTLs for setback on 5A and 7B were identified as the stable major QTLs detected in two or more environments, with phenotypic variation explanation exceeding 10%. Seven pleiotropic QTLs on 2A, 3D, 5A, 5B, 6A, 6D, and 7B were identified simultaneously with two or more RVA parameters. Molecular markers closely linked to the QTLs can be used to select the desired pasting property traits and provide assistance in breeding to improve wheat quality.

1. Introduction

Wheat (Triticum aestivum L.) is one of the major food crops in China, accounting for over 20% of the total annual domestic grain production [1]. In recent years, the Chinese wheat market has been paying increasing attention to wheat grain quality [2]. As the main component in wheat grain (accounting for about 65–80% of the dry weight), starch largely affects the quality of wheat flour as well as flour-based products, especially in Chinese-style steamed and boiled foods, such as steamed buns, noodles, and boiled dumplings [3,4,5,6]. A number of starch properties traits are used as indicators to evaluate the quality of wheat or the final products. Among them, the pasting properties measured using the rapid visco analyzer (RVA) are important physiochemical properties of starch, reflecting the gelatinization process that occurs upon heating [7].
The RVA typically records seven parameters: peak viscosity (PV), trough viscosity (TV), breakdown (BD), final viscosity (FV), setback (SB), peak time (PeT), and pasting temperature (PT). A significant correlation exists between the RVA parameters and the quality of wheat-based food [8]. For example, PV is positively correlated with the score of noodles, and wheat flour with a higher viscosity produces higher quality noodles [9]. Steamed bread with the right amount of stickiness, good chewiness, and a high score was produced using flour with a relatively lower viscosity; moreover, flour with a PV and TV ranging from 2200 to 3700 cP and 1400 to 2400 cP, respectively, is considered suitable for steamed bread [10].
In breeding, the detection of quality traits was resource-intensive and difficult during the early efforts to generate breeding materials [11]. While marker-assisted selection (MAS) is effective in selecting quality traits, identifying gene loci for target traits is the first step in breeding improvement [12,13]. Up to now, quantitative trait loci (QTLs) for RVA parameters have been identified on all chromosomes in common wheat through linkage and association mapping [14,15,16,17]. Two Kompetitive Allele-Specific PCR (KASP) markers for BD on chromosome 7A and one KASP marker for PT on 7B have been developed and employed in MAS [15]. There are a number of enzymes involved in the biosynthesis of starch such as starch synthase and starch-branching and -debranching enzymes. Each enzyme has a few variant isoforms, and these enzymes are encoded by genes with multiple family members or alleles that play different roles in the composition and structure of grain starch and thereby affect the gelatinization characteristics of starch. A few QTLs for RVA parameters were found to be close to the starch synthase gene in some studies. For instance, the markers associated with PV, PT, and BD are close to TaSBEIIa-2B, TaSBEIIa-2A, and TaSBEI-7B, respectively, while the marker associated with BD and PV overlaps with TaISA1-7A, a QTL for BD, FV, TV, SB, and PV is near to TaSSII-7A, and a locus associated with six RVA parameters is close to TaSBEI-7A [14].
The RVA parameters are typical quantitative traits controlled by multiple genes and influenced by the environment [18]. In this study, a doubled-haploid (DH) population was used to identify QTLs controlling RVA parameters under different environments, which will potentially be utilized in common wheat breeding programs. The results could provide assistance for further improving wheat grain quality.

2. Materials and Methods

2.1. Plant Materials

A doubled-haploid (DH) population composed of 194 DH lines derived from a wheat cross between H20 and H132 was used in this study [19]. The 194 DH lines and 2 parents were cultivated in Nanjing, Jiangsu Province, China, during the growing season (early November to late May of the following year) in 2021–2022, 2022–2023, and 2023–2024, utilizing a completely randomized block design with three replicates for each season. Each material was sown in single-row plots with 60 seeds per row. The space between the rows and the row length were 0.25 m and 1.6 m, respectively. Field water and fertilizer management was conducted following standard practices for field production.

2.2. Measurement of RVA Parameters

An RVA (RVA-3D, Newport Scientific, Narrabeen, Australia) was used in this study to measure RVA parameters according to the AACC method 76–21. First, 3.5 g of grain flour for each DH line and two parents was weighed into an RVA canister, followed by the addition of 25 g of distilled water. The “STD1” procedure was chosen, and the program was as follows: the sample was maintained at 50 °C for 60 s, heated from 50 °C to 95 °C at a rate of 1 °C/5 s, maintained at 95 °C for 150 s, cooled to 50 °C at a rate of 1 °C/5 s, and then maintained at 50 °C for 120 s.

2.3. RVA Analysis

Descriptive statistical analysis, Pearson correlation analysis, and frequency distribution of the RVA parameters were conducted using SPSS software v21.0 [20].

2.4. QTL Analysis

The DH population was genotyped using DArTseq by Diversity Arrays Technology (DArT) Pty. Ltd. (Canberra, Australia). After deleting markers with more than 10% missing data, a total of 2518 polymorphic markers were used for genetic map construction using JoinMap [21]. The software MapQTL 6.0 was used for QTL analysis following the procedure described by Fan et al. [22]. The QTLs were firstly analyzed by interval mapping (IM), then the closest marker at each putative QTL identified using interval mapping was selected as a cofactor, and the selected markers were used as genetic background controls in the approximate multiple QTL model (MQM). The percentage of variance explained by each QTL (R2) was obtained using restricted MQM mapping implemented with MapQTL6.0. A LOD value ≥ 3.0 was used as a threshold to determine whether a QTL existed or not, and QTLs detected in two or more environments were set as stable QTLs.

3. Results

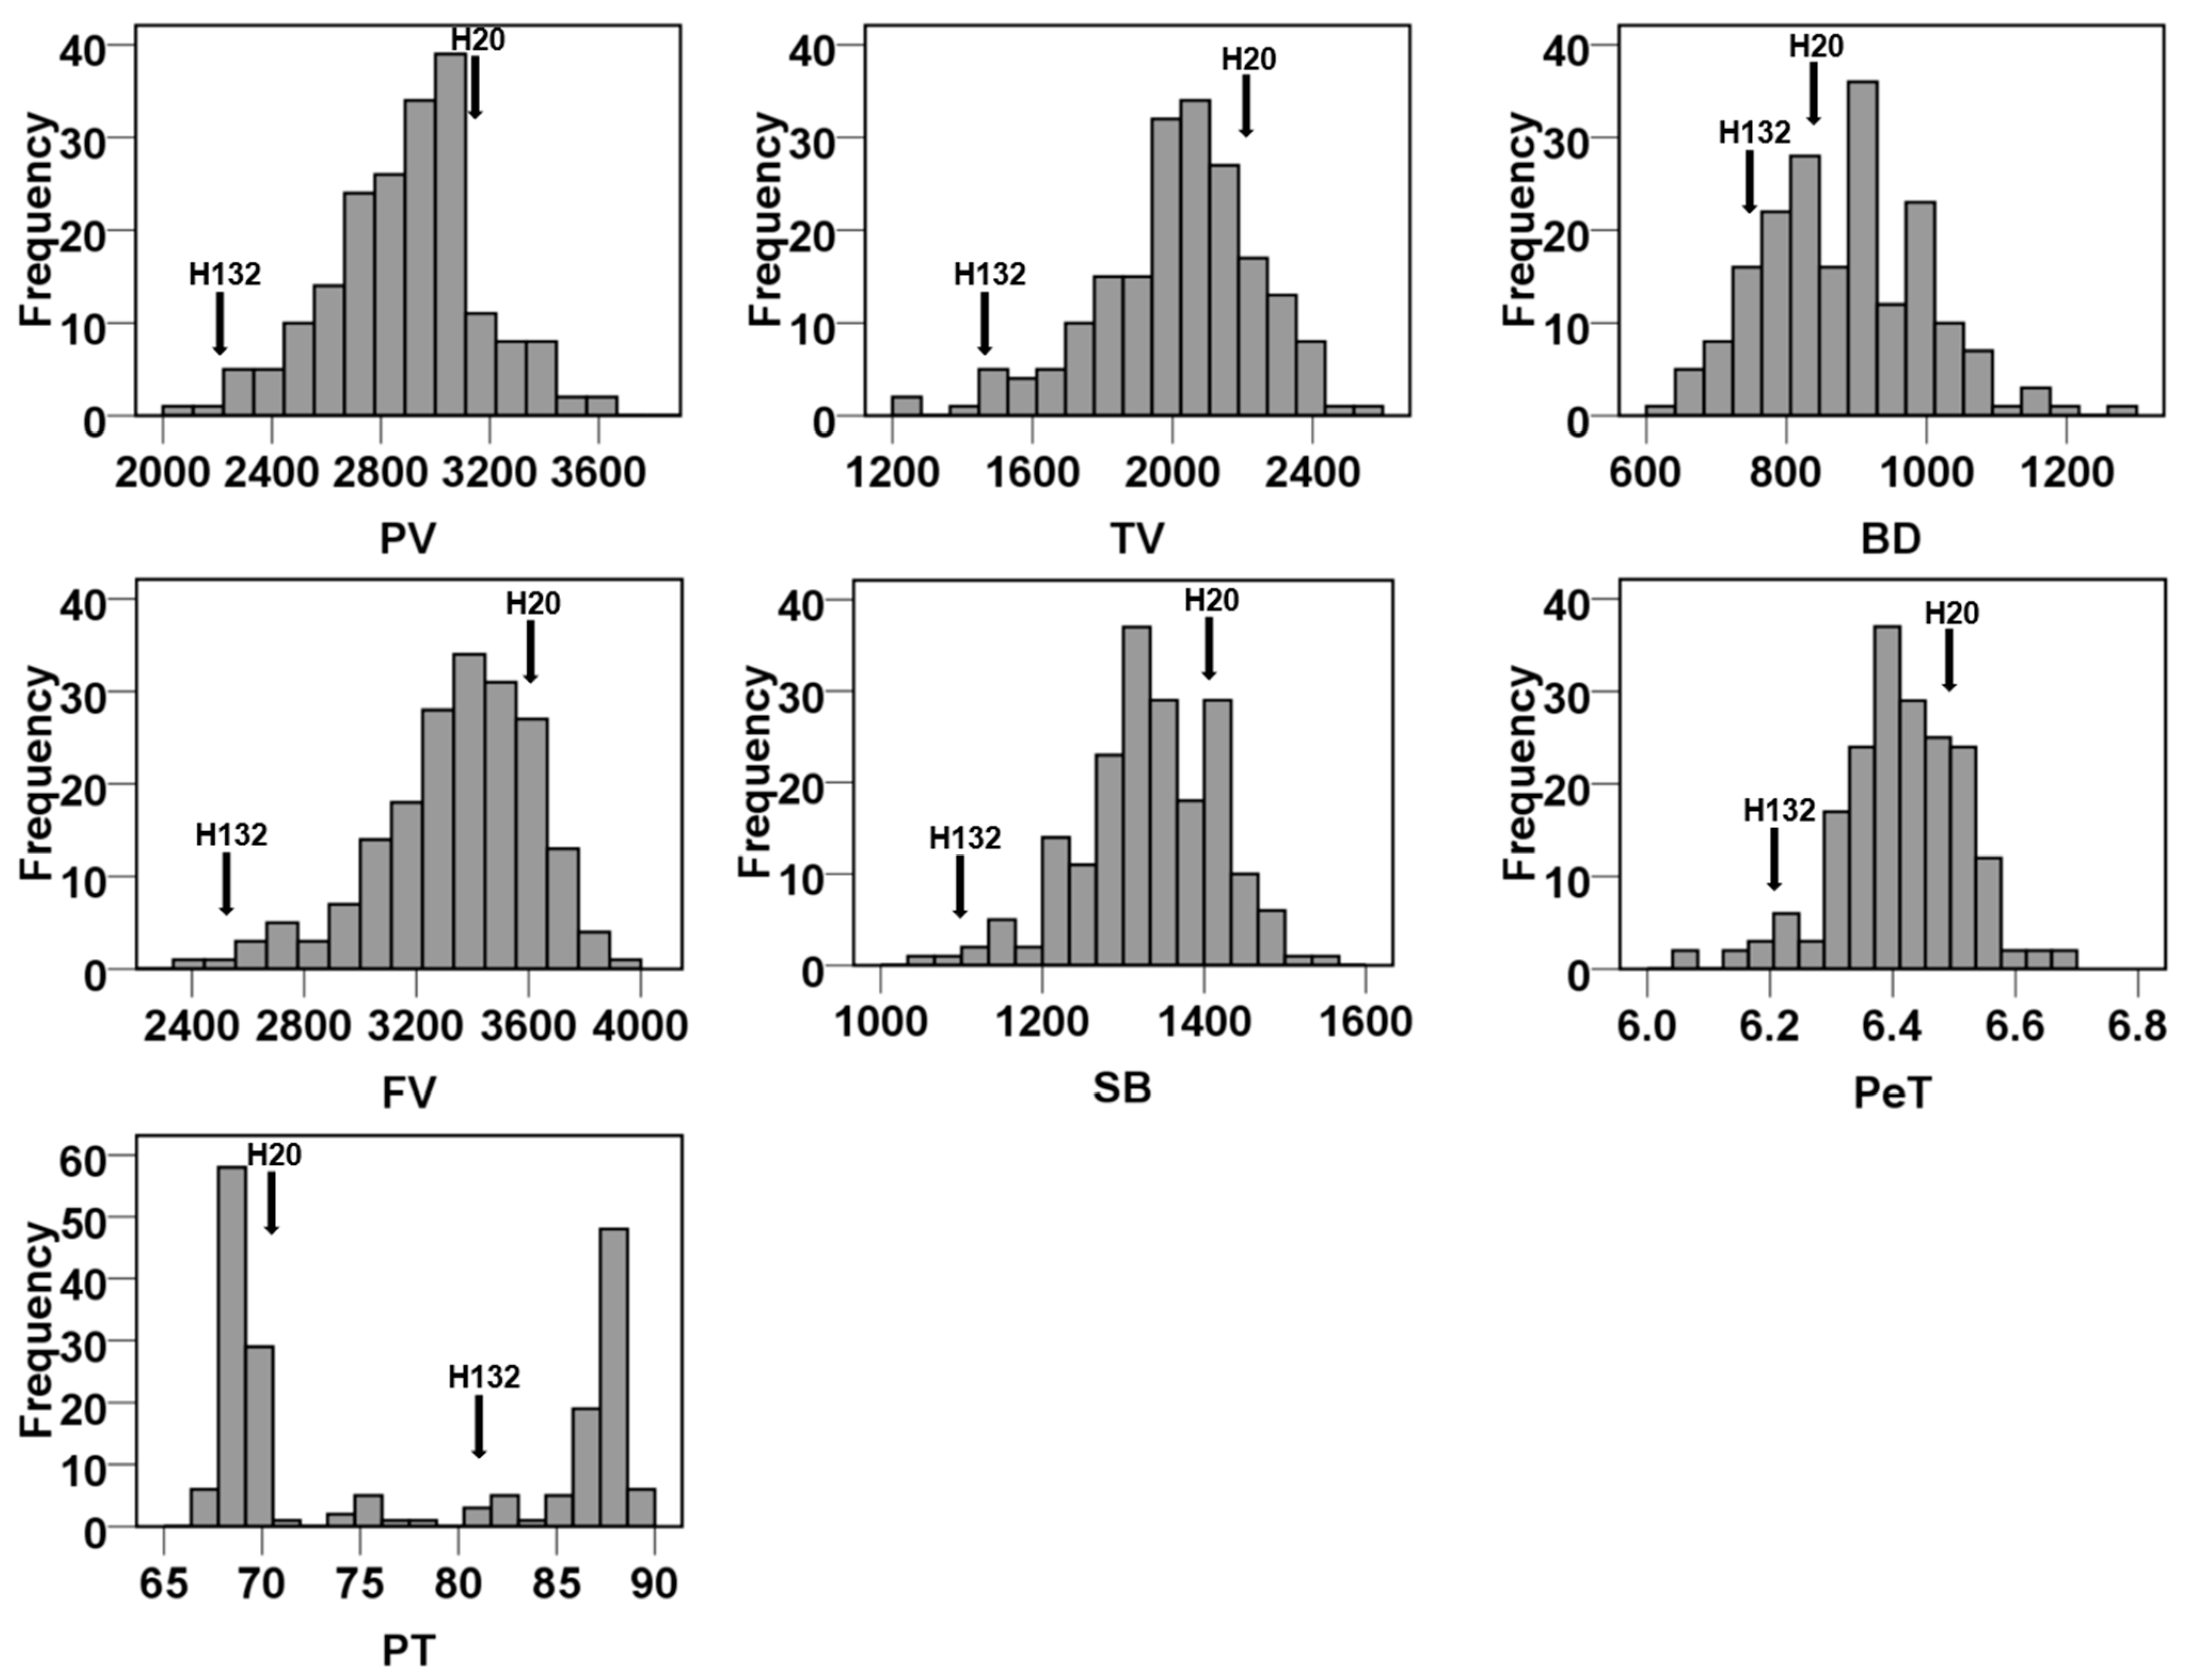
3.1. Variation Analysis of RVA Parameters

Seven RVA parameters including peak viscosity (PV), trough viscosity (TV), breakdown (BD), final viscosity (FV), setback (SB), peak time (PeT), and pasting temperature (PT) were measured in two parents and 194 DH lines under three environments in 2021, 2022, and 2023. The two parents H20 and H132 exhibited the relatively largest differences almost in all of the seven RVA parameters except BD and PeT (Table 1). The averages of PV, TV, BD, FV, SB, PeT, and PT under three environments in the DH population were 2895.3, 2015.1, 880.2, 3346.5, 1333.0, 6.4, and 77.5, respectively. The coefficient of variation (CV) of PV, TV, BD, FV, SB, PeT, and PT under three environments in the DH population were 9.6%, 11.5%, 13.1%, 8.3%, 6.3%, 1.7%, and 11.6%, respectively, among which the CV of PeT was the smallest, and the CV of BD was the largest (Table 1). The frequency distribution of the average value of the RVA parameters in the DH population is shown in Figure 1, and the frequency distribution of the value in each year is shown in Figure S1. Six RVA parameters (PT was not considered) in the DH population showed continuous variation (Figure 1 and Figure S1). Furthermore, the absolute values of skewness and kurtosis of PV, TV, BD, FV, SB, and PeT were less than 1.0, but not for PT (Table 1).

3.2. Correlation Analsysis Between RVA Parameters

The results of the correlation analysis between the RVA parameters showed that there were no significant correlations between TV and PT, BD and SB, BD and PeT, or FV and PT. Nevertheless, significant correlations were observed among all other RVA traits (Table 2). Among them, significant positive correlations were observed among the RVA parameters except for SB and PT, which showed a highly significant negative correlation. Furthermore, the correlations between the three parameters PV, TV, and FV were extremely high, with correlation coefficients exceeding 0.8.

3.3. QTL Mapping for the RVA Parameters

There were four QTLs associated with PV, distributed on the chromosomes 2A, 2D, 5A, and 6A, and the phenotypic variation explained by individual QTLs ranged from 6.7% to 15.3%. Among them, two stable and major QTLs, q.PV.2A and q.PV.6A, controlling PV were detected, with phenotypic variation explanation of 13.2% and 11.0%, respectively (Figure S2, Table 3). In total, six QTLs controlling TV were identified on chromosomes 2A, 3D, 5B, 6A, 6D, and 7B, respectively. A comparison with the QTLs identified for PV revealed that the stable major QTLs q.TV.2A and q.TV.6A were located at similar positions to those of q.PV.2A and q.PV.6A on chromosomes 2A and 6A. The two stable and major QTLs q.TV.2A and q.TV.6A contributed by 11.5% and 11.4% to the phenotypic variance, respectively (Figure S2, Table 3). Ten significant QTLs were identified for BD on chromosomes 2A, 2D, 3A, 4D, 5A, 5B, 5D, 6D, and 7B. The major one on 5D, q.BD.5D, determined 10.5% of phenotypic variation. The other one, q.BD.2A, was located close to q.PV.2A and q.TV.2A, accounting for 4.8% of phenotypic variation on average. However, q.BD.2A could only be detected in the year 2022, and its average contribution was calculated (Figure S2, Table 3). A total of ten significant QTLs were identified for FV, determining a phenotypic variation ranging from 5.8% to 11.1%. However, no stable QTLs for FV were detected (Figure S2, Table 3). Four significant QTLs were identified for SB on chromosomes 1A, 5A, 6A, and 7B, determining a phenotypic variation ranging from 6.0% to 17.5%. Among them, the two stable and major QTLs q.SB.5A and q.SB.7B could be detected, accounting for 11.4% and 11.8% of phenotypic variation, respectively (Figure S2, Table 3). Five significant QTLs were identified for PeT on chromosomes 1B, 3D, 6A, and 7D, determining a phenotypic variation ranging from 6.7% to 12.4%. The major one q.PeT.3D could only be detected in 2021, accounting, on average, for 12.4% of phenotypic variation (Figure S2, Table 3).
Seven pleiotropic QTLs were identified on chromosomes 2A, 3D, 5A, 5B, 6A, 6D, and 7B simultaneously with two or more RVA parameters (Table 4). Among them, q.RVA.2A, q.RVA.5A, and q.RVA.6A were significantly associated with four RVA parameters, and q.RVA.7B was significantly associated with three RVA parameters. The remaining three pleiotropic QTLs were significantly associated with only two RVA parameters. Furthermore, q.RVA.2A and q.RVA.6A were detected in three environments, while the other five pleiotropic QTLs (q.RVA.3D, q.RVA.5A, q.RVA.5B, q.RVA.6D, and q.RVA.7B) were detected in one or two environments.

4. Discussion

Studying genetic diversity is of great significance for the improvement of certain traits [23,24]. In this study, significant phenotype variations linked to RVA parameters were found in the DH population (Table 1). All of the RVA parameters, except for PT, were approximately continuously distributed, which indicated that RVA parameters have polygenic inheritance features (Figure 1). In summary, this population exhibited rich genetic variation and high levels of intraspecific inheritance, which make it ideal for QTL mapping. In addition, except for four weak correlations, the other correlations between the RVA parameters reached significance (Table 2), which is consistent with previous studies [14,15,16,17]. This result indicates that these RVA parameters may be simultaneously associated with some QTLs.
In the last two decades, the use of the RVA has been extended to the breeding and varietal selection of cereals and other starchy foods [7]. In breeding for quality traits, identifying and developing molecular markers for marker-assisted breeding is an effective approach, considering that the detection of quality traits was resource-intensive and difficult during the early efforts to generate breeding materials [11,14]. A marker–trait association (MTA) study established the relationship between genetic variation within the genome and specific phenotypes, ultimately detecting loci that support corresponding traits [15]. The identification of QTLs for RVA parameters in wheat has been reported in several previous studies. QTLs for seven RVA parameters were identified on all 21 chromosomes through linkage and association mapping [14,15,16,17,25,26,27,28,29,30]. In this study, a total of 39 QTLs with an LOD value ≥ 3.0 were detected across three years for six RVA parameters (except for PT) on 17 of the 21 chromosomes of common wheat (except for 4A, 4B, 6B, and 7A). Among the 39 QTLs, many were not stable, as they were identified only in one environment. This is due to the fact that the RVA parameters correspond to quantitative traits that are simultaneously affected by environmental factors [7]. Stable QTLs with large genetic effects are valuable for breeding [11]. In this study, two QTLs for PV, two QTLs for TV, one QTL for BD, and two QTLs for SB were identified on chromosomes 2A and 6A, 2A and 6A, 5D, 5A and 7B, respectively, as the stable major QTLs detected in two or more environments, with phenotypic variation explanations exceeding 10% (Table 3). Among these stable major QTLs, two QTLs identified for TV on 2A and 6A were at the same as or a similar location to that of the QTLs for PV. This could be due to the extremely significant correlation between PV and TV, with a correlation coefficient exceeding 0.9 (Table 2). In addition, identifying novel and stable major QTLs is also the aim of QTL mapping [11]. In this study, q.PV.2A, q.TV.6A, q.BD.5D, q.SB.5A, and q.SB.7B were not reported before and will be helpful for further molecular breeding in wheat. No stable QTLs for FV as well as PeT were detected (Table 3), and this could be due to the great effect of the environment on FV and PeT. QTL mapping was not performed for PT in this study, because the distribution of this trait is not normal. Furthermore, seven pleiotropic QTLs on 2A, 3D, 5A, 5B, 6A, 6D, and 7B were identified simultaneously with two or more RVA parameters. In particular, q.RVA.2A, q.RVA.5A, and q.RVA.6A were associated with four RVA parameters and accounted for the major phenotypic variation. This result once again validates the high correlation among various RVA parameters at the QTL level, which is beneficial for simultaneously improving multiple correlated traits in breeding and provides relevant information for the aggregation of multiple traits. In previous studies, a few QTLs for RVA parameters were close to the starch synthase genes [14,15,16]. In this study, q.RVA.2A was associated with PV, TV, BD, and FV on chromosome 2A at the genetic position of 102.89–114.33 cM and a phenotypic variation explanation of 9.2–16.4%, while the physical position of q.RVA.2A was 404.92–574.75 Mb. In this interval, at 504.33 Mb, the wheat starch branching enzyme IIa gene (TaSBEIIa) is located. This result is consistent with a previous study and with the effects of starch synthase genes on starch pasting properties [14].

5. Conclusions

Overall, a total of 39 QTLs for six RVA parameters on 17 chromosomes were identified across three years, explaining 4.7–17.5% of wheat phenotypic variation in this study. Among these QTLs, two loci for PV, two loci for TV, one locus for BD, and two loci for SB were identified on chromosomes 2A and 6A, 2A and 6A, 5D, 5A, and 7B, respectively, as the stable and major QTLs detected in two or more environments, with phenotypic variation being over 10%. In addition, seven pleiotropic QTLs on chromosomes 2A, 3D, 5A, 5B, 6A, 6D, and 7B were identified simultaneously with two or more RVA parameters. Improved pasting properties of wheat can be achieved by pyramiding the QTLs using closely linked markers. These results offer valuable insights for enhancing wheat quality through genetic improvement.

Supplementary Materials

The following supporting information can be downloaded at https://www.mdpi.com/article/10.3390/agronomy15040790/s1, Figure S1: The frequency distribution of the RVA parameters in the DH population across three years. Figure S2: QTL mapping for six RVA parameters in the DH population.

Author Contributions

Conceptualization, F.C. and P.Z.; methodology, X.F. and F.C.; software, K.X.; validation, K.X. and F.C.; formal analysis, X.F., J.Z. and K.X.; investigation, X.F. and J.Z.; data curation, X.F., J.Z. and F.C.; writing—original draft preparation, X.F.; writing—review and editing, F.C. and P.Z.; supervision, F.C. and P.Z.; project administration, F.C. and P.Z.; funding acquisition, X.F. and P.Z. All authors have read and agreed to the published version of the manuscript.

Funding

This research was funded by the National Natural Science Foundation of China (32201858), the Jiangsu Provincial Key Research and Development Program (BE2021375), and the Seed Industry Revitalization Project of Jiangsu Province (JBGS (2021) 047).

Data Availability Statement

The original contributions presented in this study are included in the article/Supplementary Material. Further inquiries can be directed to the corresponding authors.

Acknowledgments

The authors gratefully acknowledge Juan Zhu from Yangzhou University, who helped us in data analysis.

Conflicts of Interest

The authors declare no conflicts of interest.

Abbreviations

The following abbreviations are used in this manuscript:
RVARapid visco analyzer
QTLQuantitative trait loci
PVPeak viscosity
TVTrough viscosity
BDBreakdown
FVFinal viscosity
SBSetback
PeTPeak time
PTPasting temperature

References

  1. Mao, H.D.; Jiang, C.; Tang, C.L.; Nie, X.J.; Du, L.Y.; Liu, Y.L.; Cheng, P.; Wu, Y.F.; Liu, H.Q.; Kang, Z.S.; et al. Wheat adaptation to environmental stresses under climate change: Molecular basis and genetic improvement. Mol. Plant 2023, 16, 1564–1589. [Google Scholar] [PubMed]
  2. He, Z.; Zhuang, Q.; Cheng, S.; Yu, Z.; Zhao, Z.; Liu, X. Wheat production and technology improvement in China. J. Agric. 2018, 8, 107–114. [Google Scholar]
  3. Zhang, Y.; Ye, Y.; Liu, J.; Xiao, Y.; Sun, Q.; He, Z. The relationship between Chinese raw dumpling quality and flour characteristics of Shandong winter wheat cultivars. Agric. Sci. China 2011, 10, 1792–1800. [Google Scholar]
  4. Vijayendra, S.V.N.; Sreedhar, R. Production of buns, the bakery-based snack food, with reduced refined wheat flour content: Recent developments. J. Food Sci. Technol. 2023, 60, 2907–2915. [Google Scholar]
  5. Goesaert, H.; Brijs, K.; Veraverbeke, W.S.; Courtin, C.M.; Gebruers, K.; Delcour, J.A. Wheat flour constituents: How they impact bread quality, and how to impact their functionality. Trends Food Sci. Technol. 2005, 16, 12–30. [Google Scholar]
  6. Ma, H.L.; Yang, Y.H.; Zhao, J.R.; Huang, X.L.; Yang, H.K.; Zheng, T.; Fan, G.Q. Relationship between the baking quality of wheat (Triticum aestivum L.) and the protein composition and structure after shading. Food Chem. 2024, 441, 138392. [Google Scholar] [PubMed]
  7. Cozzolino, D. The use of the rapid visco analyser (RVA) in breeding and selection of cereals. J. Cereal Sci. 2016, 70, 282–290. [Google Scholar]
  8. Zhang, Q.; Wang, F.; Hao, L.; Wang, S.; Zao, J.; Zhang, T. Research and analysis on the gelatinization characteristics of different types of wheat flour. Modern Flour Indus. 2013, 27, 26–31. [Google Scholar]
  9. Peng, Y.C.; Zhao, Y.; Yu, Z.T.; Zeng, J.B.; Xu, D.G.; Dong, J.; Ma, W.J. Wheat quality formation and its regulatory mechanisms. Front. Plant Sci. 2022, 13, 834654. [Google Scholar]
  10. Ma, M.M.; Li, Y.C.; Xue, C.; Xiong, W.; Peng, Z.P.; Han, X.; Ju, H.; He, Y. Current situation and key parameters for improving wheat quality in China. Front. Plant Sci. 2021, 12, 638525. [Google Scholar]
  11. Battenfield, S.D.; Sheridan, J.L.; Silva, L.D.C.E.; Miclaus, K.J.; Dreisigacker, S.; Wolfinger, R.D.; Peña, R.J.; Singh, R.P.; Jackson, E.W.; Fritz, A.K.; et al. Breeding-assisted genomics: Applying meta-GWAS for milling and baking quality in CIMMYT wheat breeding program. PLoS ONE 2018, 13, e0204757. [Google Scholar]
  12. Rasheed, A.; Wen, W.E.; Gao, F.M.; Zhai, S.N.; Jin, H.; Liu, J.D.; Guo, Q.; Zhang, Y.J.; Dreisigacker, S.; Xia, X.C.; et al. Development and validation of KASP assays for genes underpinning key economic traits in bread wheat. Theor. Appl. Genet. 2016, 129, 1843–1860. [Google Scholar]
  13. Zhang, N.; Tang, L.; Li, S.G.; Gao, M.J.; Wang, S.S.; Chen, D.Y.; Zhao, Y.C.; Zheng, R.Q.; Soleymaniniya, A.; Zhang, L.; et al. Integration of multi-omics data accelerates molecular analysis of common wheat traits. Nat. Commun. 2025, 16, 2200. [Google Scholar]
  14. Ullah, R.; Yin, M.; Li, S.; Israr, Y.; Wu, Z.; Wang, X.; Yu, J.; Li, B.; Ni, Z.; Liang, R. Genome-wide association study identifies loci and candidate genes for RVA parameters in wheat (Triticum aestivum L.). Front. Plant Sci. 2024, 15, 1421924. [Google Scholar]
  15. Tian, Y.S.; Liu, P.P.; Zhang, X.; Liu, Y.C.; Kong, D.Z.; Nie, Y.B.; Xu, H.J.; Han, X.N.; Sang, W.; Li, W.H. Genome-wide association study and KASP marker development for starch quality traits in wheat. Plant Genome 2024, 17, e20514. [Google Scholar] [PubMed]
  16. Deng, Z.Y.; Tian, J.C.; Chen, F.; Li, W.J.; Zheng, F.F.; Chen, J.S.; Shi, C.L.; Sun, C.L.; Wang, S.Y.; Zhang, Y.X. Genetic dissection on wheat flour quality traits in two related populations. Euphytica 2015, 203, 221–235. [Google Scholar]
  17. Jin, H.; Wen, W.; Liu, J.D.; Zhai, S.N.; Zhang, Y.; Yan, J.; Liu, Z.Y.; Xia, X.C.; He, Z.H. Genome-wide QTL mapping for wheat processing quality parameters in a Gaocheng 8901/Zhoumai 16 recombinant inbred line population. Front. Plant Sci. 2016, 7, 1032. [Google Scholar]
  18. Zhang, Y.; Wu, Y.; Xiao, Y.; Yan, J. QTL mapping for milling, gluten quality, and flour pasting properties in a recombinant inbred line population derived from a Chinese soft×hard wheat cross. Crop Pasture Sci. 2009, 60, 587–597. [Google Scholar]
  19. Niu, Y.A.; Chen, T.X.; Zhao, C.C.; Guo, C.; Zhou, M.X. Identification of QTL for stem traits in wheat (Triticum aestivum L.). Front. Plant Sci. 2022, 13, 962253. [Google Scholar]
  20. Hong, Y.; Zhang, M.N.; Zhu, J.; Zhang, Y.H.; Lv, C.; Guo, B.J.; Wang, F.F.; Xu, R.G. Genome-wide association studies reveal novel loci for grain size in two-rowed barley (Hordeum vulgare L.). Theor. Appl. Genet. 2024, 137, 58. [Google Scholar]
  21. Zhu, J.; Zhou, H.; Fan, Y.; Guo, Y.; Zhang, M.N.; Shabala, S.; Zhao, C.C.; Lv, C.; Guo, B.J.; Wang, F.F.; et al. HvNCX, a prime candidate gene for the novel qualitative locus qS7.1 associated with salinity tolerance in barley. Theor. Appl. Genet. 2023, 136, 9. [Google Scholar] [PubMed]
  22. Fan, Y.; Shabala, S.; Ma, Y.L.; Xu, R.G.; Zhou, M.X. Using QTL mapping to investigate the relationships between abiotic stress tolerance (drought and salinity) and agronomic and physiological traits. BMC Genom. 2015, 16, 43. [Google Scholar]
  23. Mourad, A.M.I.; Belamkar, V.; Baenziger, P.S. Molecular genetic analysis of spring wheat core collection using genetic diversity, population structure, and linkage disequilibrium. BMC Genom. 2020, 21, 434–456. [Google Scholar]
  24. Matus, I.A.; Hayes, P.M. Genetic diversity in three groups of barley germplasm assessed by simple sequence repeats. Genome 2002, 45, 1095–1106. [Google Scholar]
  25. Batey, I.L.; Hayden, M.J.; Cai, S.; Sharp, P.J.; Cornish, G.B.; Morell, M.K.; Appels, R. Genetic mapping of commercially significant starch characteristics in wheat crosses. Aust. J. Agric. Res. 2001, 52, 1287–1296. [Google Scholar]
  26. Ram, S.; Sharma, I. Allelic diversity in granule bound starch synthase genes in Indian wheats and their relationship with starch pasting properties. Cereal Res. Commun. 2013, 41, 141–149. [Google Scholar]
  27. Wu, Y.P.; Zhang, Y.L.; Xiao, Y.G.; Yan, J.; He, Z.H. QTL mapping for important quality traits in common wheat. Sci. Agric. Sin. 2008, 41, 331–339. [Google Scholar]
  28. Deng, Z.; Chen, F.; Hu, S.; Han, Q.; Chen, J.; Sun, C.; Zhang, S.; Wang, S.; Song, X.; Tian, J. Inheritance and QTL analysis of flour falling number using recombinant inbred lines derived from strong gluten wheat ‘Gaocheng 8901’ and waxy wheat ‘Nuomai 1’. Aust. J. Crop Sci. 2014, 8, 468–474. [Google Scholar]
  29. Zhao, L.; Zhang, K.; Liu, B.; Tian, J. Detection of quantitative trait loci for paste viscosity characteristics based on the doubled haploid progeny from a cross between two Chinese wheat varieties. Can. J. Plant Sci. 2009, 89, 837–844. [Google Scholar] [CrossRef]
  30. McCartney, C.A.; Somers, D.J.; Lukow, O.M.; Ames, N.P.; Noll, J.S.; Cloutier, S.; Humphreys, D.G.; McCallum, B.D. QTL analysis of quality traits in the spring wheat cross RL4452 × ‘AC Domain’. Plant Breed. 2006, 125, 565–575. [Google Scholar] [CrossRef]
Figure 1. The frequency distribution of the RVA parameters in the DH population.
Agronomy 15 00790 g001
Table 1. Descriptive statistical results for the RVA parameters of the two parents and the DH population.
RVA
Parameters
H20H132Min.Max.MeanStandard DeviationCV
(%)
SkewnessKurtosis
PV/cP3098.2 2172.7 2078.3 3650.0 2895.3 278.5 9.6 −0.2 0.3
TV/cP2212.0 1373.3 1248.3 2579.0 2015.1 232.5 11.5 −0.6 0.6
BD/cP886.2 799.3 628.0 1277.3 880.2 115.4 13.1 0.4 0.2
FV/cP3613.3 2475.7 2361.0 3895.0 3346.5 278.7 8.3 −0.8 0.8
SB/cP1401.3 1102.3 1059.3 1549.7 1333.0 84.3 6.3 −0.5 0.5
PeT/min6.56.2 6.0 6.7 6.4 0.1 1.7 −0.4 0.8
PT/°C69.5 80.2 66.9 89.7 77.5 9.0 11.6 0.2 −1.9
Table 2. Correlation analysis between the RVA parameters in the DH population.
RVA
Parameters
PVTVBDFVSBPeTPT
PV1
TV0.913 **1
BD0.573 **0.290 **1
FV0.873 **0.960 **0.173 *1
SB0.574 **0.619 **0.1390.796 **1
PeT0.605 **0.775 **−0.0990.682 **0.222 **1
PT0.236 **0.0940.380 **−0.011−0.217 **0.263 **1
Note: * and ** indicated significant at 5% level (p < 0.05) and 1% level (p < 0.01), respectively.
Table 3. QTLs for RVA parameters in the DH population.
TraitYearQTLChr.Pos. (cM)LocusLODExpl. (%)Additive
PV2021 q.PV.2A2A107.50 D555767557.2 15.0 126.31
q.PV.5A5A73.16 30213023.4 6.7 85.65
q.PV.6A6A101.82 D73518883.5 6.9 −88.04
2022 q.PV.2A2A107.27 D14012404.2 9.2 105.34
q.PV.2D2D325.53 D22744613.2 6.9 −103.85
q.PV.6A6A105.51 39550244.0 8.7 −103.27
2023 q.PV.2A2A110.68 D10940476.3 12.6 95.38
q.PV.6A6A106.08 D18628247.5 15.3 104.95
Averageq.PV.2A2A107.50 D555767556.6 13.2 101.14
q.PV.6A6A106.08 D18628245.6 11.0 92.51
TV2021 q.TV.2A2A107.50 D555767557.9 16.4 115.57
q.TV.6A6A101.82 D73518883.3 6.4 −73.56
q.TV.7B7B152.75 D39548774.7 9.4 87.13
2023 q.TV.2A2A107.27 D14012407.6 12.4 80.80
q.TV.3D3D253.58 D12585295.4 8.7 68.08
q.TV.5B5B65.50 D49918523.0 4.7 −49.67
q.TV.6A6A106.08 D18628248.3 13.7 84.62
q.TV.6D6D135.12 D53257713.0 4.7 50.22
Averageq.TV.2A2A100.44 D12528425.7 11.5 79.08
q.TV.6A6A105.51 39550245.5 11.4 −79.59
BD2021 q.BD.3A13A118.59 11477125.8 10.0 38.66
q.BD.5A5A73.59 73375113.4 5.7 29.45
q.BD.5D5D26.26 D10870408.5 15.1 −47.17
q.BD.6D6D149.80D30275383.15.127.35
q.BD.7B7B140.38 D33852314.8 8.1 −34.15
2022 q.BD.2A2A114.33 D73313015.3 9.7 45.53
q.BD.2D2D149.35 D49930994.6 8.3 −41.70
q.BD.5D5D27.56 D73522806.1 11.3 −49.76
2023 q.BD.2D2D152.56 D49915323.5 5.2 −26.47
q.BD.3A23A271.46D49934023.34.825.17
q.BD.4D4D73.73 D53288494.5 6.7 −29.30
q.BD.5B5B244.23 30647275.9 8.9 34.03
q.BD.5D5D26.26 D10870408.4 13.1 −41.21
Averageq.BD.2A2A115.01 30644743.1 4.8 25.78
q.BD.2D2D152.56 D49915323.6 5.6 −28.28
q.BD.4D4D45.98 D11025643.1 4.9 −26.19
q.BD.5B5B244.23 30647274.6 7.4 31.77
q.BD.5D5D26.26 D10870405.8 10.5 −36.45
FV2021 q.FV.2A2A102.89 D119132333.5 6.6 88.79
q.FV.2B2B240.41D40037603.26.0−85.68
q.FV.5A5A73.16 30213023.8 7.3 95.02
q.FV.7B17B152.75 D39548775.7 11.1 116.09
2023 q.FV.3B3B217.73 D11614233.7 7.1 69.70
q.FV.3D3D252.46 D49094113.8 7.2 70.08
q.FV.5B5B65.69D73335893.15.8−62.46
q.FV.6A6A106.08 D18628243.6 6.8 67.56
Averageq.FV.1D1D166.38 D49100143.3 6.5 −71.52
q.FV.5A5A73.16 30213025.0 10.2 91.26
q.FV.7B27B65.61 D23032654.1 8.1 79.54
SB2021 q.SB.5A5A77.82 D44081488.2 17.5 44.94
q.SB.7B7B31.92 10820044.3 8.7 31.27
2022 q.SB.1A1A112.35 D45395774.6 10.6 −35.36
q.SB.7B7B35.08 D22752294.3 9.9 33.93
2023 q.SB.5A5A77.36 D30233773.9 7.7 21.71
q.SB.6A6A117.05 30647453.1 6.0 −19.19
q.SB.7B7B26.21 22581375.8 11.8 26.58
Averageq.SB.5A5A75.87 D30221435.7 11.4 28.74
q.SB.7B7B31.92 10820045.9 11.8 29.02
PeT2021 q.PeT.3D3D76.71 D47335454.6 10.8 0.04
q.PeT.6A16A48.10D11042483.17.2−0.03
2023 q.PeT.1B1B199.23 D39443913.6 8.7 −0.03
Averageq.PeT.3D3D76.71 D47335456.3 12.4 0.04
q.PeT.6A26A104.26 D44059973.6 6.7 −0.03
q.PeT.7D7D195.33 D9949064.1 7.9 0.03
Table 4. Pleiotropic QTLs identified simultaneously with two or more RVA parameters.
QTLChr.Pos. (cM)RVA Parameters (Year)Expl. (%)
q.RVA.2A2A102.89–114.33PV (2021, 2022, 2023), TV (2021, 2023), BD (2022), FV (2021)9.2–16.4
q.RVA.3D3D252.46–253.58TV (2023), FV (2023)7.2–8.7
q.RVA.5A5A73.16–77.36PV (2021), BD (2021), FV (2021), SB (2021, 2023)5.7–17.5
q.RVA.5B5B65.50–65.69TV (2023), FV (2023)4.7–5.8
q.RVA.6A6A101.82–117.05PV (2021, 2022, 2023), TV (2021, 2023), FV (2023), SB (2023)6.4–15.3
q.RVA.6D6D135.12–149.80TV (2023), BD (2021)4.7–5.1
q.RVA.7B7B140.38–152.75TV (2021), BD (2021), FV (2021)8.1–11.1
Disclaimer/Publisher’s Note: The statements, opinions and data contained in all publications are solely those of the individual author(s) and contributor(s) and not of MDPI and/or the editor(s). MDPI and/or the editor(s) disclaim responsibility for any injury to people or property resulting from any ideas, methods, instructions or products referred to in the content.

