Article

Increasing Contribution of Microbial Residue Carbon to Soil Organic Carbon Accumulation in Degraded Grasslands

1
State Key Laboratory of Ecological Safety and Sustainable Development in Arid Lands, Xinjiang Institute of Ecology and Geography, Chinese Academy of Sciences, Urumqi 830011, China
2
Research Center for Ecology and Environment of Central Asia, Chinese Academy of Sciences, Urumqi 830011, China
3
University of Chinese Academy of Sciences, Beijing 100049, China
4
College of Ecology and Environment, Xinjiang University, Urumqi 830017, China
5
Bayinbuluke Grassland Ecosystem Research Station, Xinjiang Institute of Ecology and Geography, Chinese Academy of Sciences, Urumqi 830011, China
*
Author to whom correspondence should be addressed.
Agronomy 2025, 15(4), 810; https://doi.org/10.3390/agronomy15040810
Submission received: 9 February 2025 / Revised: 23 March 2025 / Accepted: 24 March 2025 / Published: 25 March 2025
(This article belongs to the Special Issue Soil Carbon Sequestration for Mitigating Climate Change in Grasslands)

Abstract

:
Grassland degradation driven by overgrazing, invasive species, and climate change profoundly affects the dynamics and stability of soil organic carbon (SOC), yet the molecular mechanisms underlying these changes remain unclear. This study investigated the molecular composition and origins of SOC across different degradation stages—native grassland (NG), weed-dominated grassland (WG), and invasive grassland (IG) dominated by Pedicularis kansuensis—in the Bayinbuluke alpine region of China. Soil samples from three depth intervals (0–10 cm, 10–20 cm, and 20–30 cm) were analyzed using gas chromatography-mass spectrometry (GC-MS) to quantify biomarkers, including free lipids, ester-bound lipids, lignin phenols, and amino sugars. Principal component analysis (PCA) was applied to assess the overall variation in SOC composition. Compared to NG, plant-derived long-chain lipids and lignin phenols in WG and IG surface soils increased by 44–90% and 68–76% (p < 0.05), respectively, while cutin content increased by 96% and 150%. However, suberin content in IG decreased by 58% across all layers (p < 0.05). Microbial-derived carbon (MRC), including bacterial and fungal residues, increased significantly in the surface layer of degraded soils (IG > WG > NG), with MRC contributions to SOC also rising markedly in the subsurface layers (10–30 cm). PCA revealed a distinct separation of SOC components along the PC1 axis, highlighting the substantial impact of degradation on SOC composition and sources. These findings emphasize the role of vegetation shifts in SOC transformation and provide insights for grassland management and restoration strategies.

1. Introduction

Grassland ecosystems are a critical component of the terrestrial carbon cycle, playing a significant role in maintaining global carbon balance, providing ecosystem services, and mitigating climate change [1,2]. However, although livestock numbers are declining in many countries and grazing is increasingly being abandoned [3,4], grasslands worldwide still face varying degrees of degradation due to climate change, improper land use, and historical overgrazing [5]. Grassland degradation exhibits notable regional differences [6], with common forms of degradation including reduced vegetation cover and decreased biodiversity [5]. Specifically, in pasture ecosystems, overgrazing significantly alters vegetation community structure, primarily facilitating grassland weed encroachment and the invasion of alien species [7,8,9]. Weed-dominated grasslands are typically characterized by the replacement of forage grasses with less palatable weed species resulting in significant declines in productivity and vegetation cover. Invasive grasslands, on the other hand, are defined by the spread of non-native species, which alter the original community structure and dominate the ecosystem [10]. Changes in vegetation community structure lead to imbalanced inputs of plant litter, which consists of chemical components such as lignin, cellulose, and soluble sugars, negatively affecting the accumulation and stability of soil organic carbon (SOC) in degraded grasslands [11]. However, current research has mainly focused on the reduction of vegetation cover and productivity of grassland degradation [6,12], the impact of different types of grassland community degradation on SOC sequestration mechanisms remains insufficiently understood, underscoring the need for further investigation.
SOC is distributed carbon between particulate organic matter (POM) and mineral-associated organic matter (MAOM), with only a small fraction (1–2%) existing as dissolved organic matter [13,14]. The process of grassland degradation affects the distribution and dynamic changes in organic carbon within these components. For instance, reductions in plant cover and productivity may lead to SOC loss by exacerbating soil erosion and decreasing soil organic matter (SOM) inputs [15]. Additionally, organic matter (OM) mineralization and humification of organic matter are key processes that affect SOC dynamics. Mineralization converts OM to inorganic matter and releases CO2, but SOM mineralization rates in degraded grasslands are generally lower than in undegraded grasslands due to reduced vegetation cover and microbial activity [16]. In contrast, humification converts organic residues into stable humus substances that contribute to long-term carbon sequestration. However, grassland degradation may result in reduced humification efficiency, as decreased plant diversity and changes in soil physicochemical properties such as pH, clay content, and cation exchange capacity impair the process [17,18].
SOM biomarker analysis offers a robust approach to characterizing molecular compositions (e.g., lipids, lignin, phenols, and amino sugars) and elucidating the origins and degradation pathways of SOC [19]. Previous studies have demonstrated that SOC accumulation is closely linked to the accumulation of both plant- and microbe-derived carbon [20]. In grasslands, the composition of plant- and microbe-derived carbon varies with vegetation change. Plant-derived carbon including lignin, cellulose, and long-chain lipids (carbon chain length > C20), primarily originates from aboveground plant litter, root exudates, and belowground biomass [21]. On the other hand, microbial-derived carbon consists of compounds from cell walls and extracellular products, such as peptidoglycans, melanin, and extracellular polysaccharides, which are resistant to degradation due to their interactions with soil minerals [21]. Significant differences have been observed in the distribution of plant-derived carbon (e.g., lignin phenols) and microbe-derived carbon (e.g., amino sugars) in soils [22]. Higher concentrations of amino sugars have been associated with increased SOC levels, highlighting the critical role of microbial turnover in SOC accumulation [20]. Changes in vegetation induced by grassland community degradation may regulate the molecular composition of SOM and the structure of the microbial community. This regulation potentially alters the relative contributions of plant- and microbe-derived residues to SOC.
Although previous studies have explored the dynamic changes in SOC within degraded grassland communities, research on the molecular characteristics of SOC composition changes remains limited [13,23]. In recent years, the importance of SOC changes at the molecular level has been increasingly recognized [24,25]. To fill this gap, this study aims to: (1) Analyze variations in carbon and nitrogen concentrations, as well as C:N stoichiometry, across different degraded grassland communities (including weed-dominated grasslands and Pedicularis kansuensis-invaded grasslands) at varying soil depths (0–30 cm). (2) Utilize multiple biomarkers-including free lipids, bound lipids, lignin phenols, and amino sugars—to investigate the molecular characteristics of SOC and the accumulation status of each component. (3) Elucidate the effects of community degradation on SOC composition and its source mechanisms. The findings highlight the molecular-scale effects of SOC under grassland degradation, contributing to a deeper understanding of carbon cycling mechanisms in degraded grasslands and providing a scientific basis for grassland degradation management and ecological restoration.

2. Materials and Methods

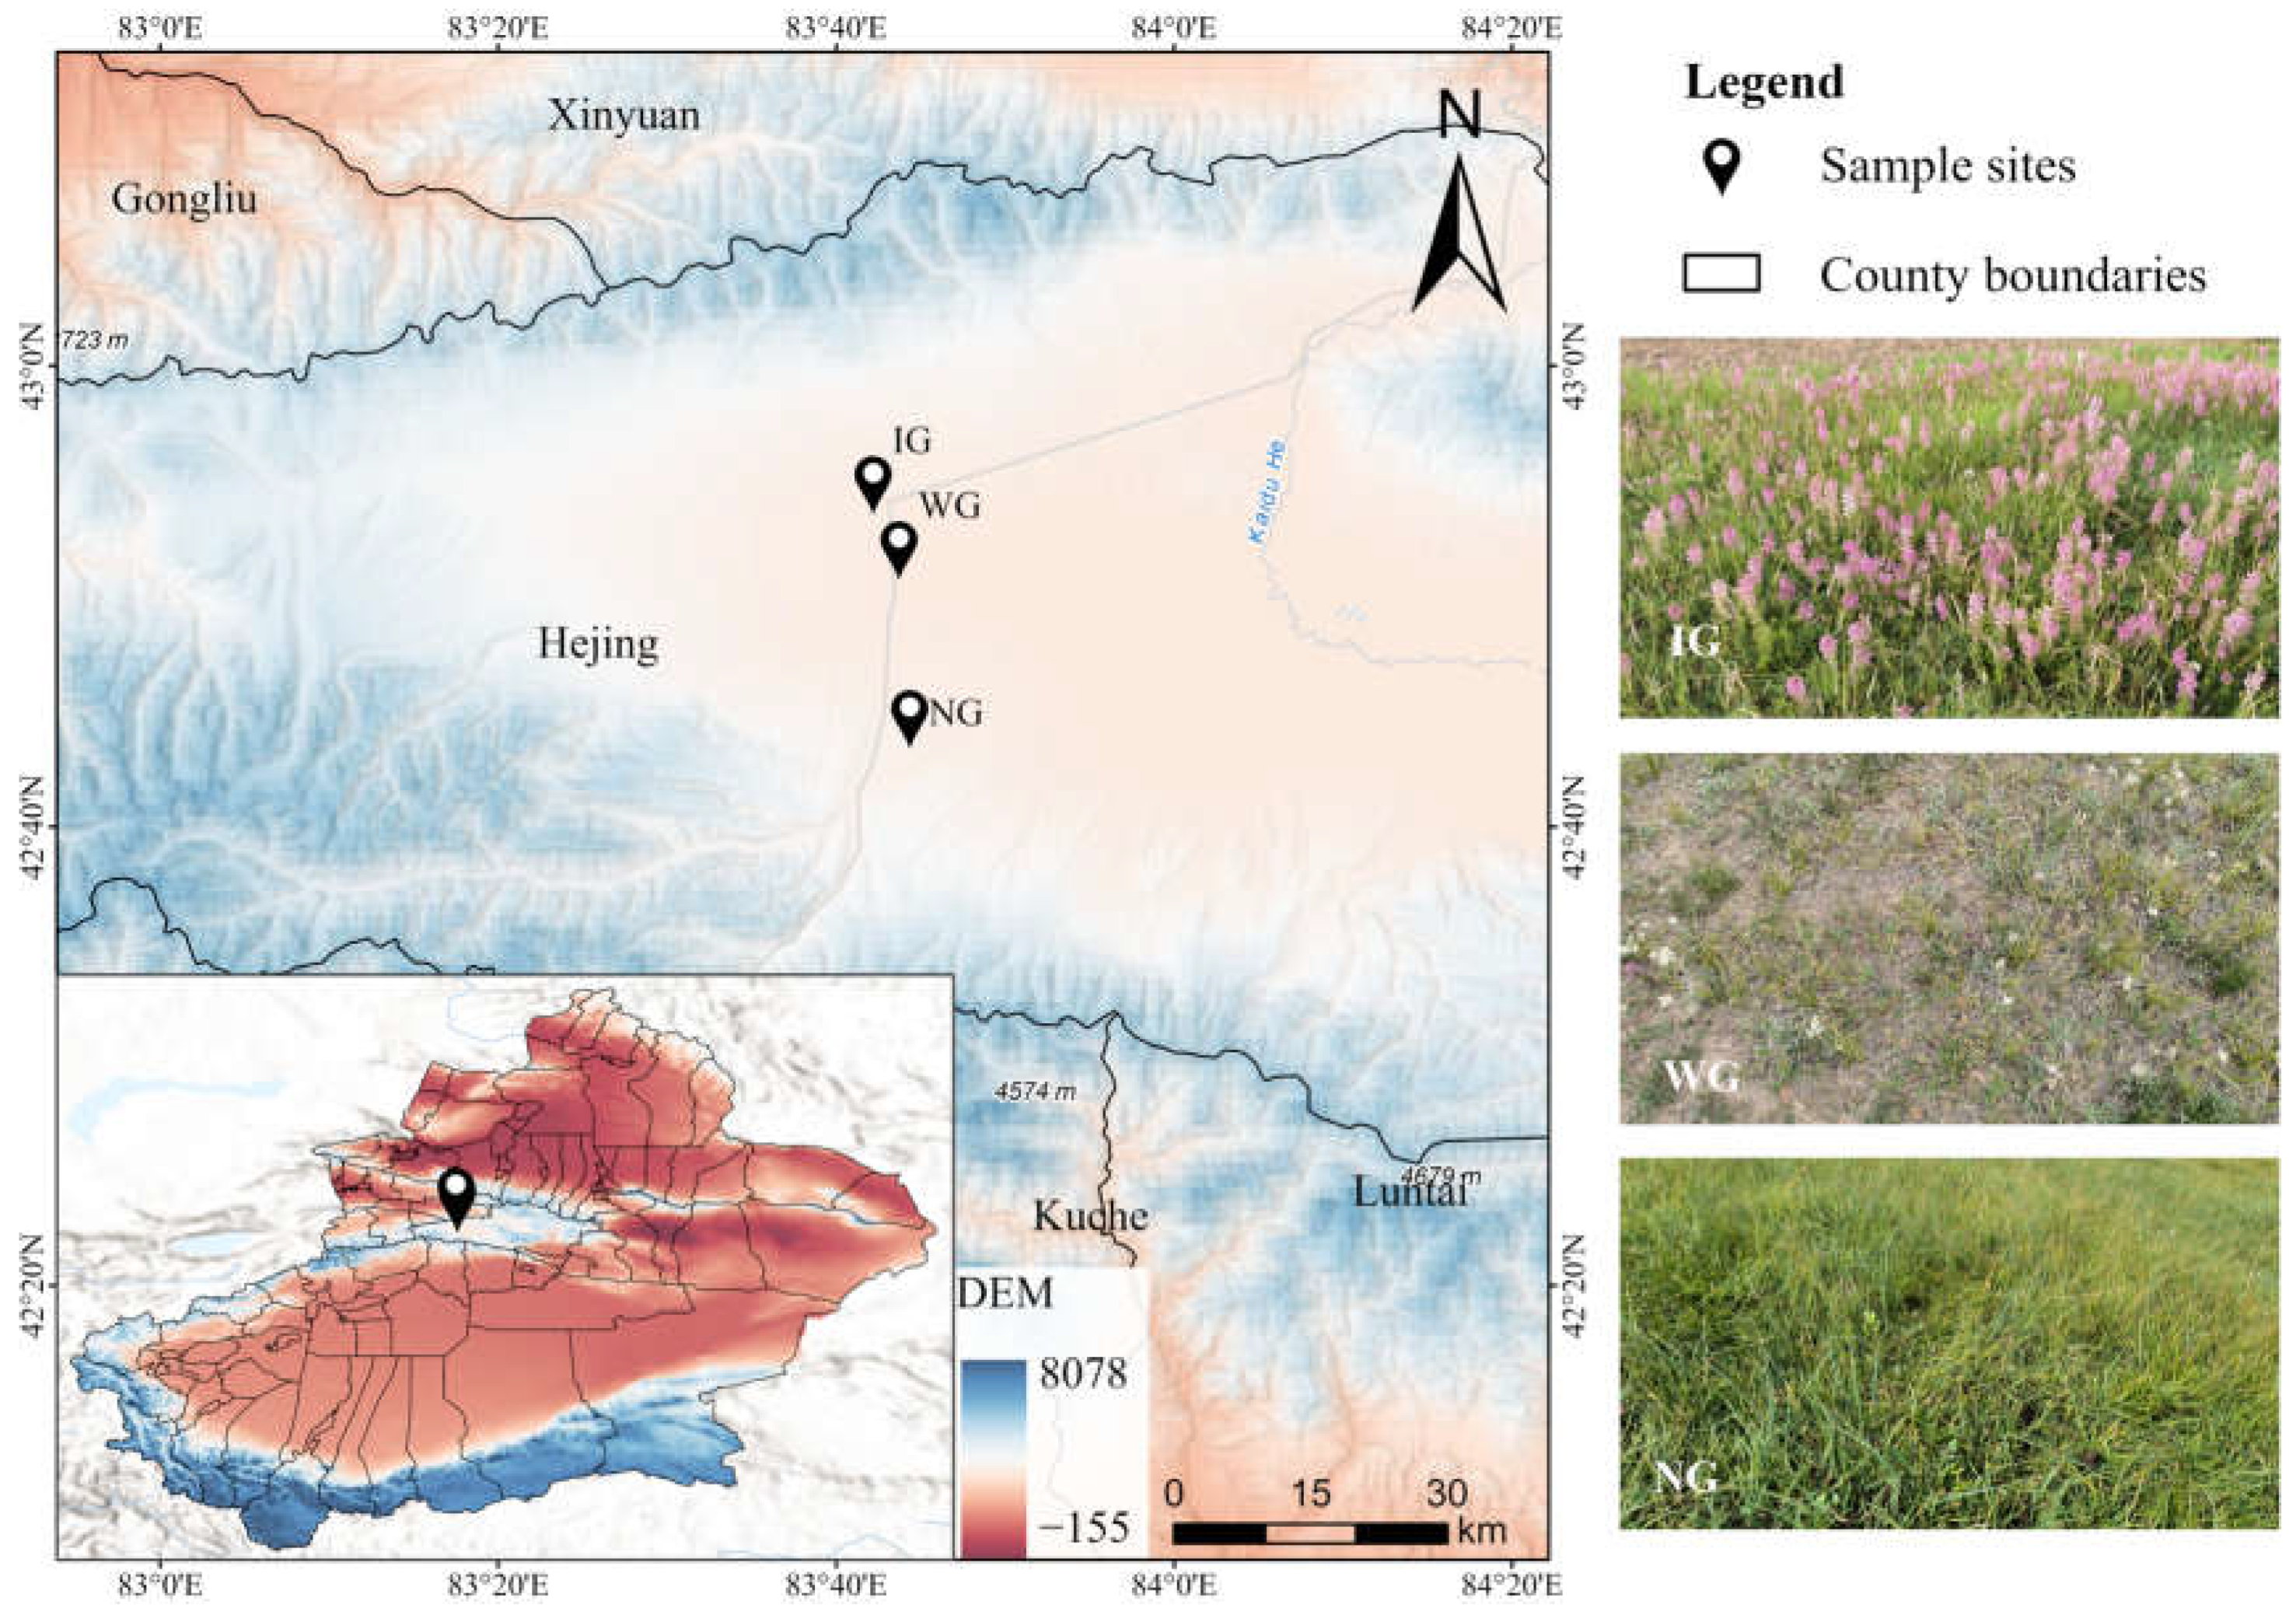
2.1. Study Sites and Soil Collection

The study was conducted in the alpine grassland near the Bayinbuluke Grassland Ecosystem Research Station of the Chinese Academy of Sciences (Figure 1). The region experiences a typical cold-temperate climate, with a mean annual temperature of −4.2 °C, an average temperature of 11.1 °C in July, and an extreme minimum temperature of −49.6 °C. Historical climate data over the past two decades indicate a warming trend, particularly in minimum temperatures, which have increased significantly since 2010. The mean annual precipitation is 280.5 mm, exhibiting substantial interannual variability without a distinct increasing or decreasing trend (Figure S1). The annual evapotranspiration reaches 1132.4 mm, and the snow cover period lasts approximately 150–180 days [26]. The soil type of the study area is Calcisols according to FAO classification [27] with the texture of silty clay loam in the USDA soil taxonomy. The region serves as an essential seasonal pasture for local herders, experiencing long-term extensive and uneven grazing, which has contributed to varying degrees of grassland degradation and distinct vegetation communities.
To better understand the preservation status of organic carbon in degraded grassland communities, we selected three representative grassland types: native grassland (NG), weed-dominated grassland (WG), and invasive grassland (IG). NG was chosen from a fenced area with minimal grazing disturbance, maintaining a relatively stable vegetation composition dominated by Stipa spp. and Festuca ovina. These species have developed root systems and higher aboveground biomass (AGB) (Table S2), and long-term monitoring data (2000–2024) indicated that NDVI values at NG were consistently higher than those at the other two sites and relatively stable (Figure S1). During the past decade, the SOC in surface (0–10 cm) layer showed an increasing trend, while the deeper layers (10–30 cm) showed slight fluctuations (Figure S3). WG was selected from areas outside the fence that have experienced chronic overgrazing. The vegetation in WG is characterized by reduced plant height, lower biomass, and a higher proportion of weeds, including L. leontopodioides, Carex spp., and Stipa spp. The SOC dynamics in WG show an initial increase in the 0–10 cm soil layer between 2010 and 2020, followed by a subsequent decline. In deeper soil layers, SOC content has exhibited a continuous decreasing trend over time (Table S3). IG represents areas heavily degraded by grazing and subsequently invaded by Pedicularis kansuensis. This species, which has spread extensively since 2000, forms dominant communities due to its long flowering period, high seed production, and competitive reproductive traits. As a result, native grasses such as Stipa spp. and Festuca ovina have been gradually replaced, leading to a reduction in plant diversity [25,28]. NDVI values for IG have shown minor fluctuations but remained lower than those of NG. SOC content in IG exhibits a recovery trend after 2020 at the surface layer (Table S3). More background information about the sampling points in detail is provided in Supplementary Materials.
Field survey and sample collection were conducted in July 2023. In three types of grasslands, three 1 × 1 m replicate quadrats were randomly established within each grassland type, with each quadrat spaced more than 25 m apart. Within each quadrat, the aboveground plant community was surveyed, and root distribution was recorded. After carefully removing the surface organic layer, soil samples were collected from three depths: 0–10, 10–20, and 20–30 cm, resulting in a total of 81 subsamples. Samples from the same depth within each quadrat were composited, yielding 27 composite samples, which were then placed in ice packs and transported to the laboratory. During sample processing, visible plant debris and gravel were first removed, followed by sieving through a 2 mm mesh. The samples were then freeze-dried for subsequent analysis.

2.2. Soil Physicochemical Property Analysis

The soil physicochemical properties were analyzed including soil texture, bulk density (BD), total nitrogen (TN), total phosphorus (TP), and pH. Detailed measurement methods are provided in the Supplementary Materials. The SOC content was measured using a total organic carbon (TOC) analyzer (envio TOC cube, Elementar, Frankfurt, Germany). All the results are summarized in Table S4.

2.3. Biomarker Analysis

Ultrasonic extraction was employed to extract free lipids from soil [19]. The extraction primarily included n-alkanes, n-alkanoic acids, n-alkanols, and phytosterols. An alkaline hydrolysis method was employed to extract ester-bound lipids, mainly including suberin-derived compounds (e.g., ω-hydroxy acids and dioic acids) and cutin-derived compounds (e.g., C14-18 hydroxy acids and epoxy acids) [29]. Lignin-derived monomers, i.e., lignin phenols, were obtained through CuO oxidation [30], including vanillyl, syringyl, and cinnamyl compounds. Amino sugars were separated by hydrochloric acid hydrolysis [31], including glucosamine (GluN), galactosamine (GalN), muramic acid (MurN), and mannosamine (ManN). GC-MS (Shimadzu, Kyoto, Japan) analysis was performed using a GC model 2030 coupled with an MS model QP2020NX.
Data were collected and processed using GC/MS analysis software LabSolutions 10.0. To identify organic compounds in the samples, retention times and mass spectra were compared with reference compounds provided in the National Institute of Standards and Technology (NIST, 2023 edition [32]) mass spectral library. Concentrations were determined by comparing the peak areas of individual extractable compounds with those of their standard compounds in the total ion current, followed by normalization to the mass of soil extracted. Detailed extraction procedures and quantification methods are provided in the Supplementary Materials.

2.4. Biomarker Proxy

To evaluate the sources and degradation of SOM in different grasslands, several molecular proxies were employed. Plant-derived biomarkers primarily include long-chain free lipids (carbon chain length ≥ C20) and phytosterols. Alkaline hydrolysis yields cutin and suberin, which represent lipid components derived from plant leaves and roots, respectively. Microbial-derived compounds mainly consist of short-chain free lipids (carbon chain length < C20) and amino sugars (Table S5). For free lipids, we used the average chain length of alkane (ACLal), the average chain length of alkanoic (ACLac), as well as the odd-over-even predominance (OEP) and even-over-odd predominance (EOP) to evaluate the carbon chain properties of the lipid fraction [30]. The ω-C16/ΣC16 and ω-C18/ΣC18 ratios were utilized to evaluate the degradation of cutin in ester-bound lipids, while an escalation in degradation led to an increase in these parameters [29]. Lignin phenol is considered a major fraction of plant-derived compounds [33]. The acid/aldehyde (Ad/Al) ratio of lignin phenol monomers V and S was used to represent the degradation status of lignin phenols, with the ratio increasing continuously with the oxidation of lignin [34].
Microbial necromass carbon (MRC) content, including both bacterial and fungal necromass carbon, was calculated using the following formulas [35]:
Bacterial   MRC g   kg 1 = MurA   ×   45
Fungal   MRC g   kg 1 = ( mmol Glun-2   ×   mmol   MurA )   ×   179.17   ×   9
where 45 is the conversion factor from MurA to bacterial necromass carbon. The fungal necromass carbon is calculated by subtracting bacterial GluN from total GluN, assuming a 2:1 ratio of GluN to MurA in bacterial cells. The molecular weight of GluN is 179.17, and 9 is the conversion factor from fungal GluN to fungal necromass carbon [36].

2.5. Statistical Analysis

The data are presented as the mean ± standard deviation (n = 3). One-way analysis of variance (ANOVA) and Fisher’s least significant difference (LSD) test were used to evaluate differences in SOM component characteristics between different grasslands or soil depths. Tukey’s HSD multiple comparison test was further performed to assess statistically significant differences, with differences or correlations considered significant at p < 0.05. Principal component analysis (PCA) was employed to assess differences in the molecular characteristics of SOC (composition, sources, degradation) among soils from different grasslands (Origin 2021, Northampton, MA, USA).

3. Results

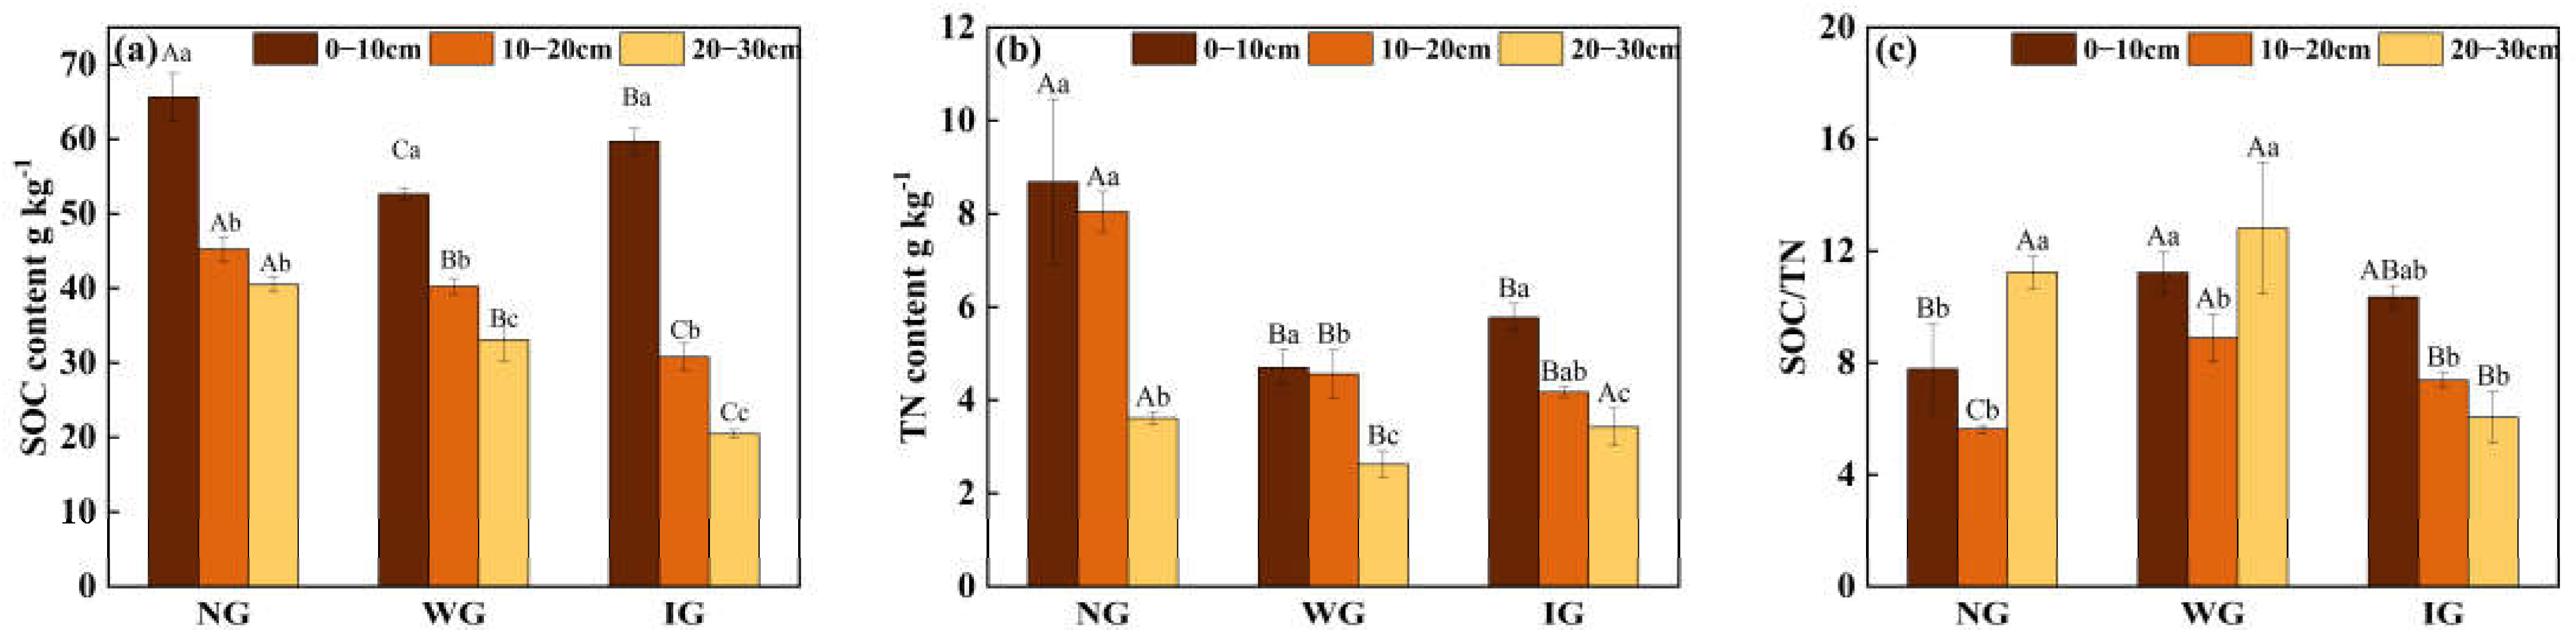
3.1. SOC and TN in Soil Profiles

At all sampling sites, the content of both SOC and TN significantly decreased with depth (Figure 2). Specifically, in the surface layer (0–10 cm), the SOC content in WG and IG soils was 19.7% and 9.0% lower than that in NG soils (Figure 2a), respectively. A similar downward trend was observed in deeper soil layers (>10 cm). Furthermore, the TN content in WG and IG soils was significantly lower than that in NG soils (Figure 2b), particularly in the 20–30 cm soil layer, where TN concentrations in WG and IG were significantly reduced by 27% and 5%, respectively (p < 0.05). The SOC/TN ratio showed distinct variations with depth (Figure 2c). In the 0–10 cm layer, the SOC/TN ratio in IG soils was significantly higher than in NG and WG soils. However, in the 20–30 cm layer, the ratio in IG soils was significantly lower than in the NG and WG soils by 46% and 53%, respectively (p < 0.05).

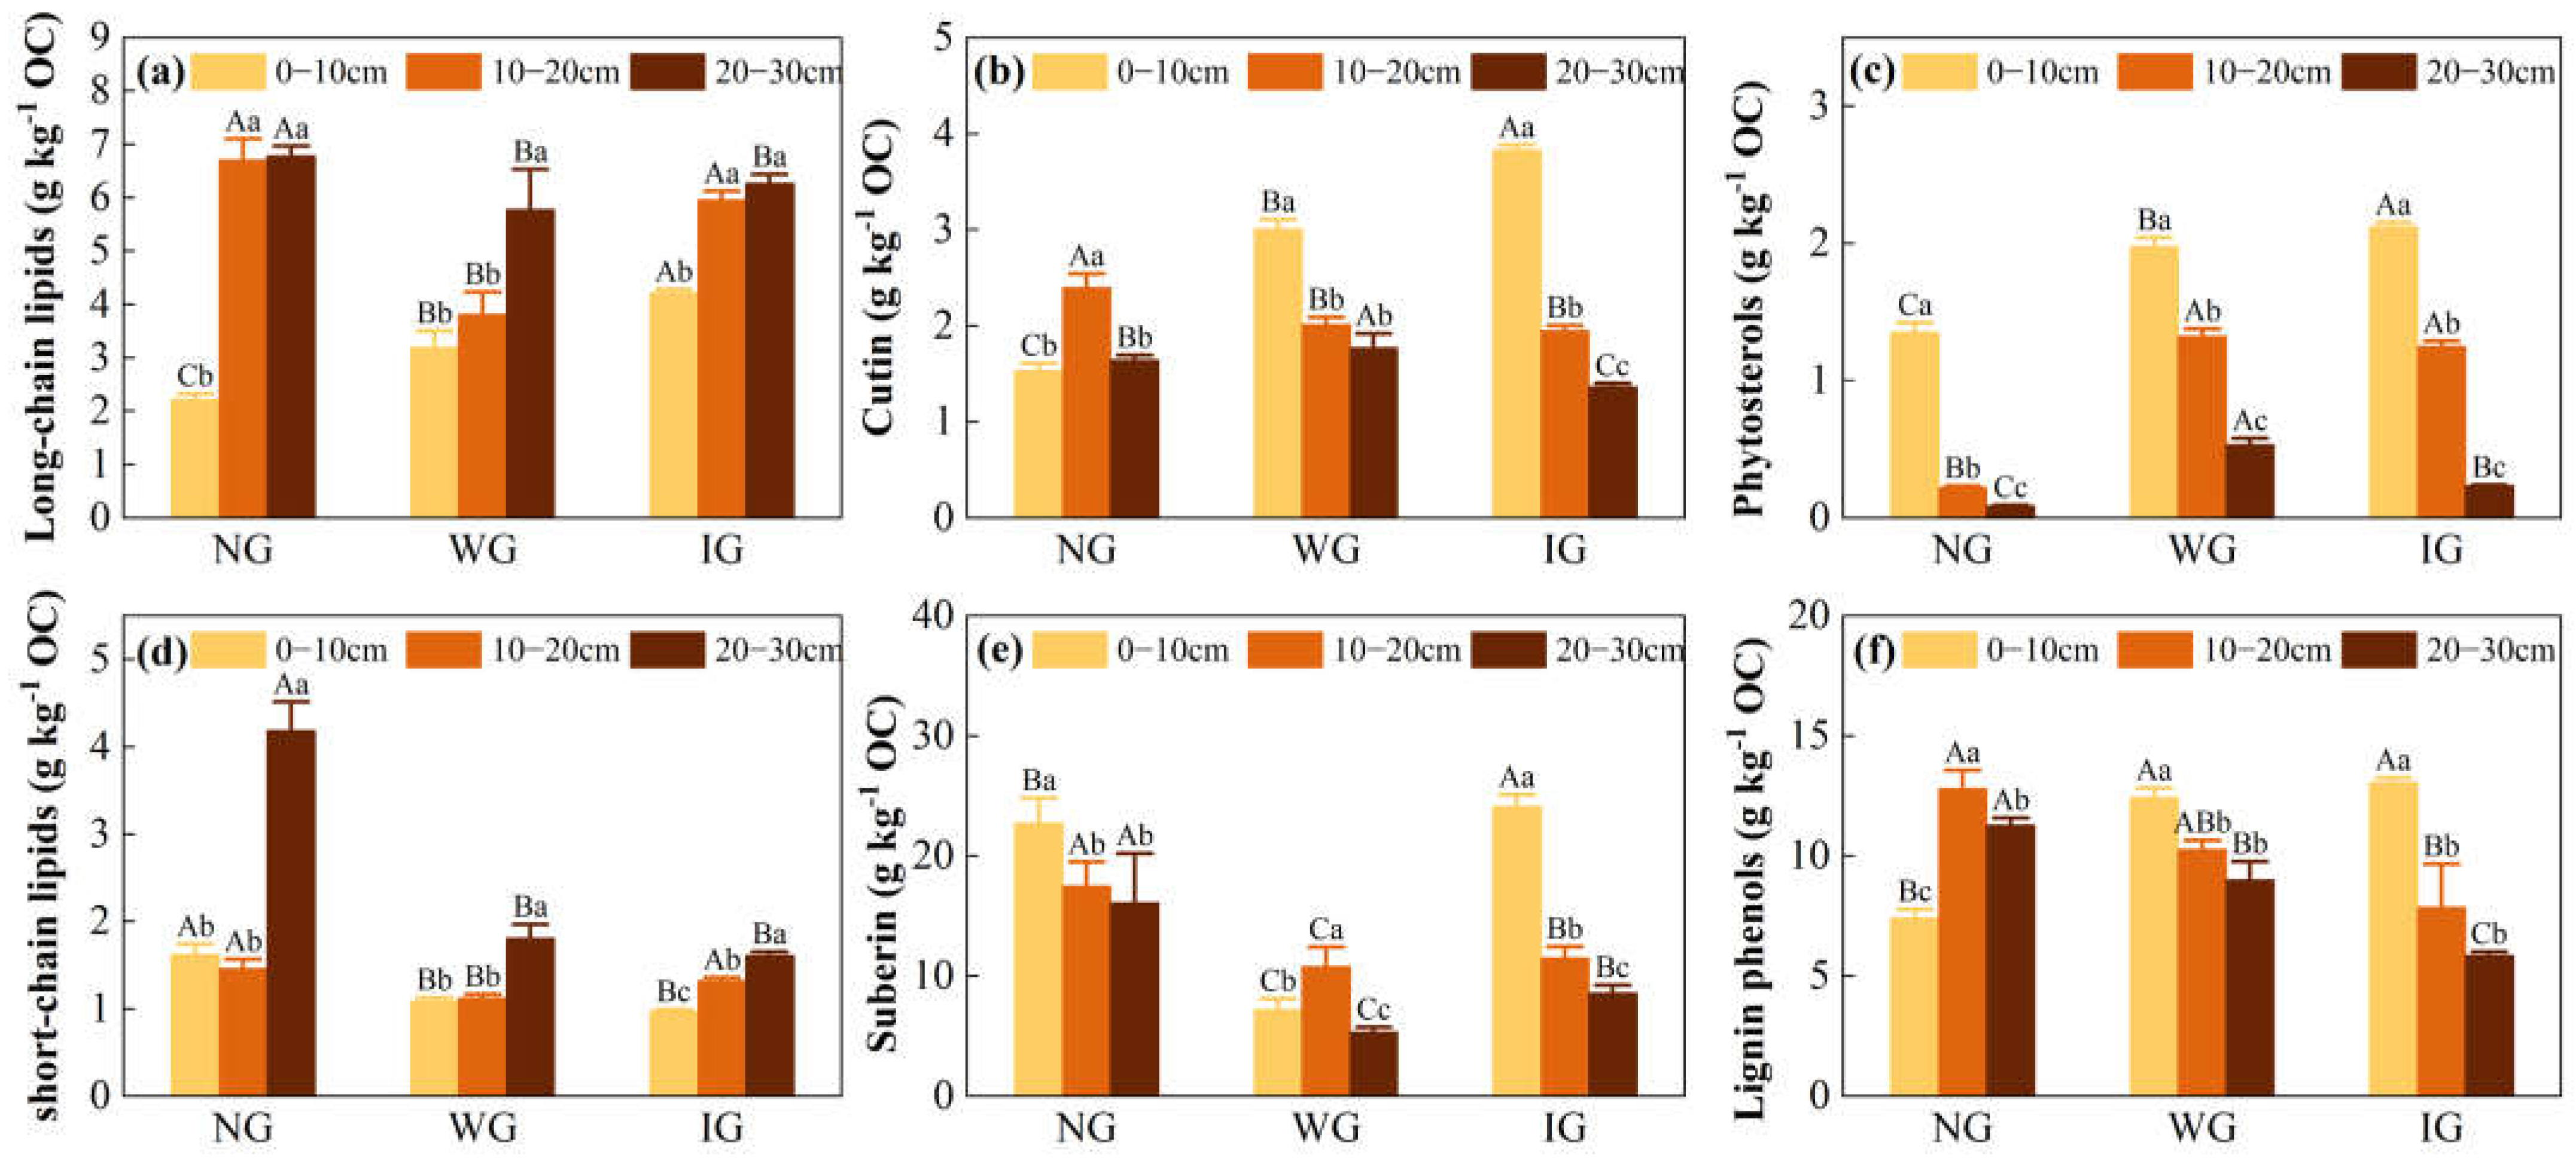
3.2. Abundance and Degradation Parameters of Biomarkers

Compared to NG, the content of long-chain lipids in the topsoil (0–10 cm) of WG and IG were significantly higher, increasing by 44% and 90%, respectively (p < 0.05, Figure 3a). In contrast, in the 20–30 cm soil layer, the content of short-chain lipids in WG and IG were significantly lower by 56% and 61%, respectively (p < 0.05, Figure 3d). Furthermore, phytosterols in WG and IG were significantly higher than in NG across all soil layers, with their content showing a decreasing trend as soil depth increased (Figure 3c). Several molecular parameters, including ACLac, ACLal, OEP, and EOP, were used to assess the source and degradation status of the free lipids (Figure S2). In all soil layers, the contents of ACLac, ACLal, and OEP in WG and IG were significantly higher than in NG, with ACLal decreasing with soil depth, opposite to the trend observed in NG (Figure S2). Additionally, the EOP in NG decreased with increasing soil depth (from 17.06 to 4.76), being significantly higher than in WG and IG in the surface layer (p < 0.05).
In the surface layer, the content of cutin in WG and IG increased significantly by 96% and 150%, respectively, while in the 10–20 cm layer, the content of cutin decreased significantly in both WG and IG (p < 0.05, Figure 3b). Compared to NG, the content of suberin-derived lipids in WG was significantly lower by 58% in all soil layers, while suberin in IG soils was significantly higher in the surface layer by 6% (p < 0.05, Figure 3e). Additionally, the cutin/suberin ratio in WG increased approximately five-fold in the surface layer, and both ω-C16/ΣC16 and ω-C18/ΣC18 ratios in IG were higher than those in NG and WG across all soil layers (Figure S3). In the surface layer, lignin phenols in IG and WG increased by 68% and 76%, respectively, compared to NG (p < 0.05, Figure 3f). However, in the 10–30 cm layers, lignin phenols in IG and WG significantly decreased, with average reductions of 29% and 34%, respectively (Figure 3f). The lignin oxidation ratios, expressed as (Ad/Al)V and (Ad/Al)S, were similar across different soil depths. In all layers, the (Ad/Al) ratios in IG and WG were significantly higher than in NG (Figure S4).

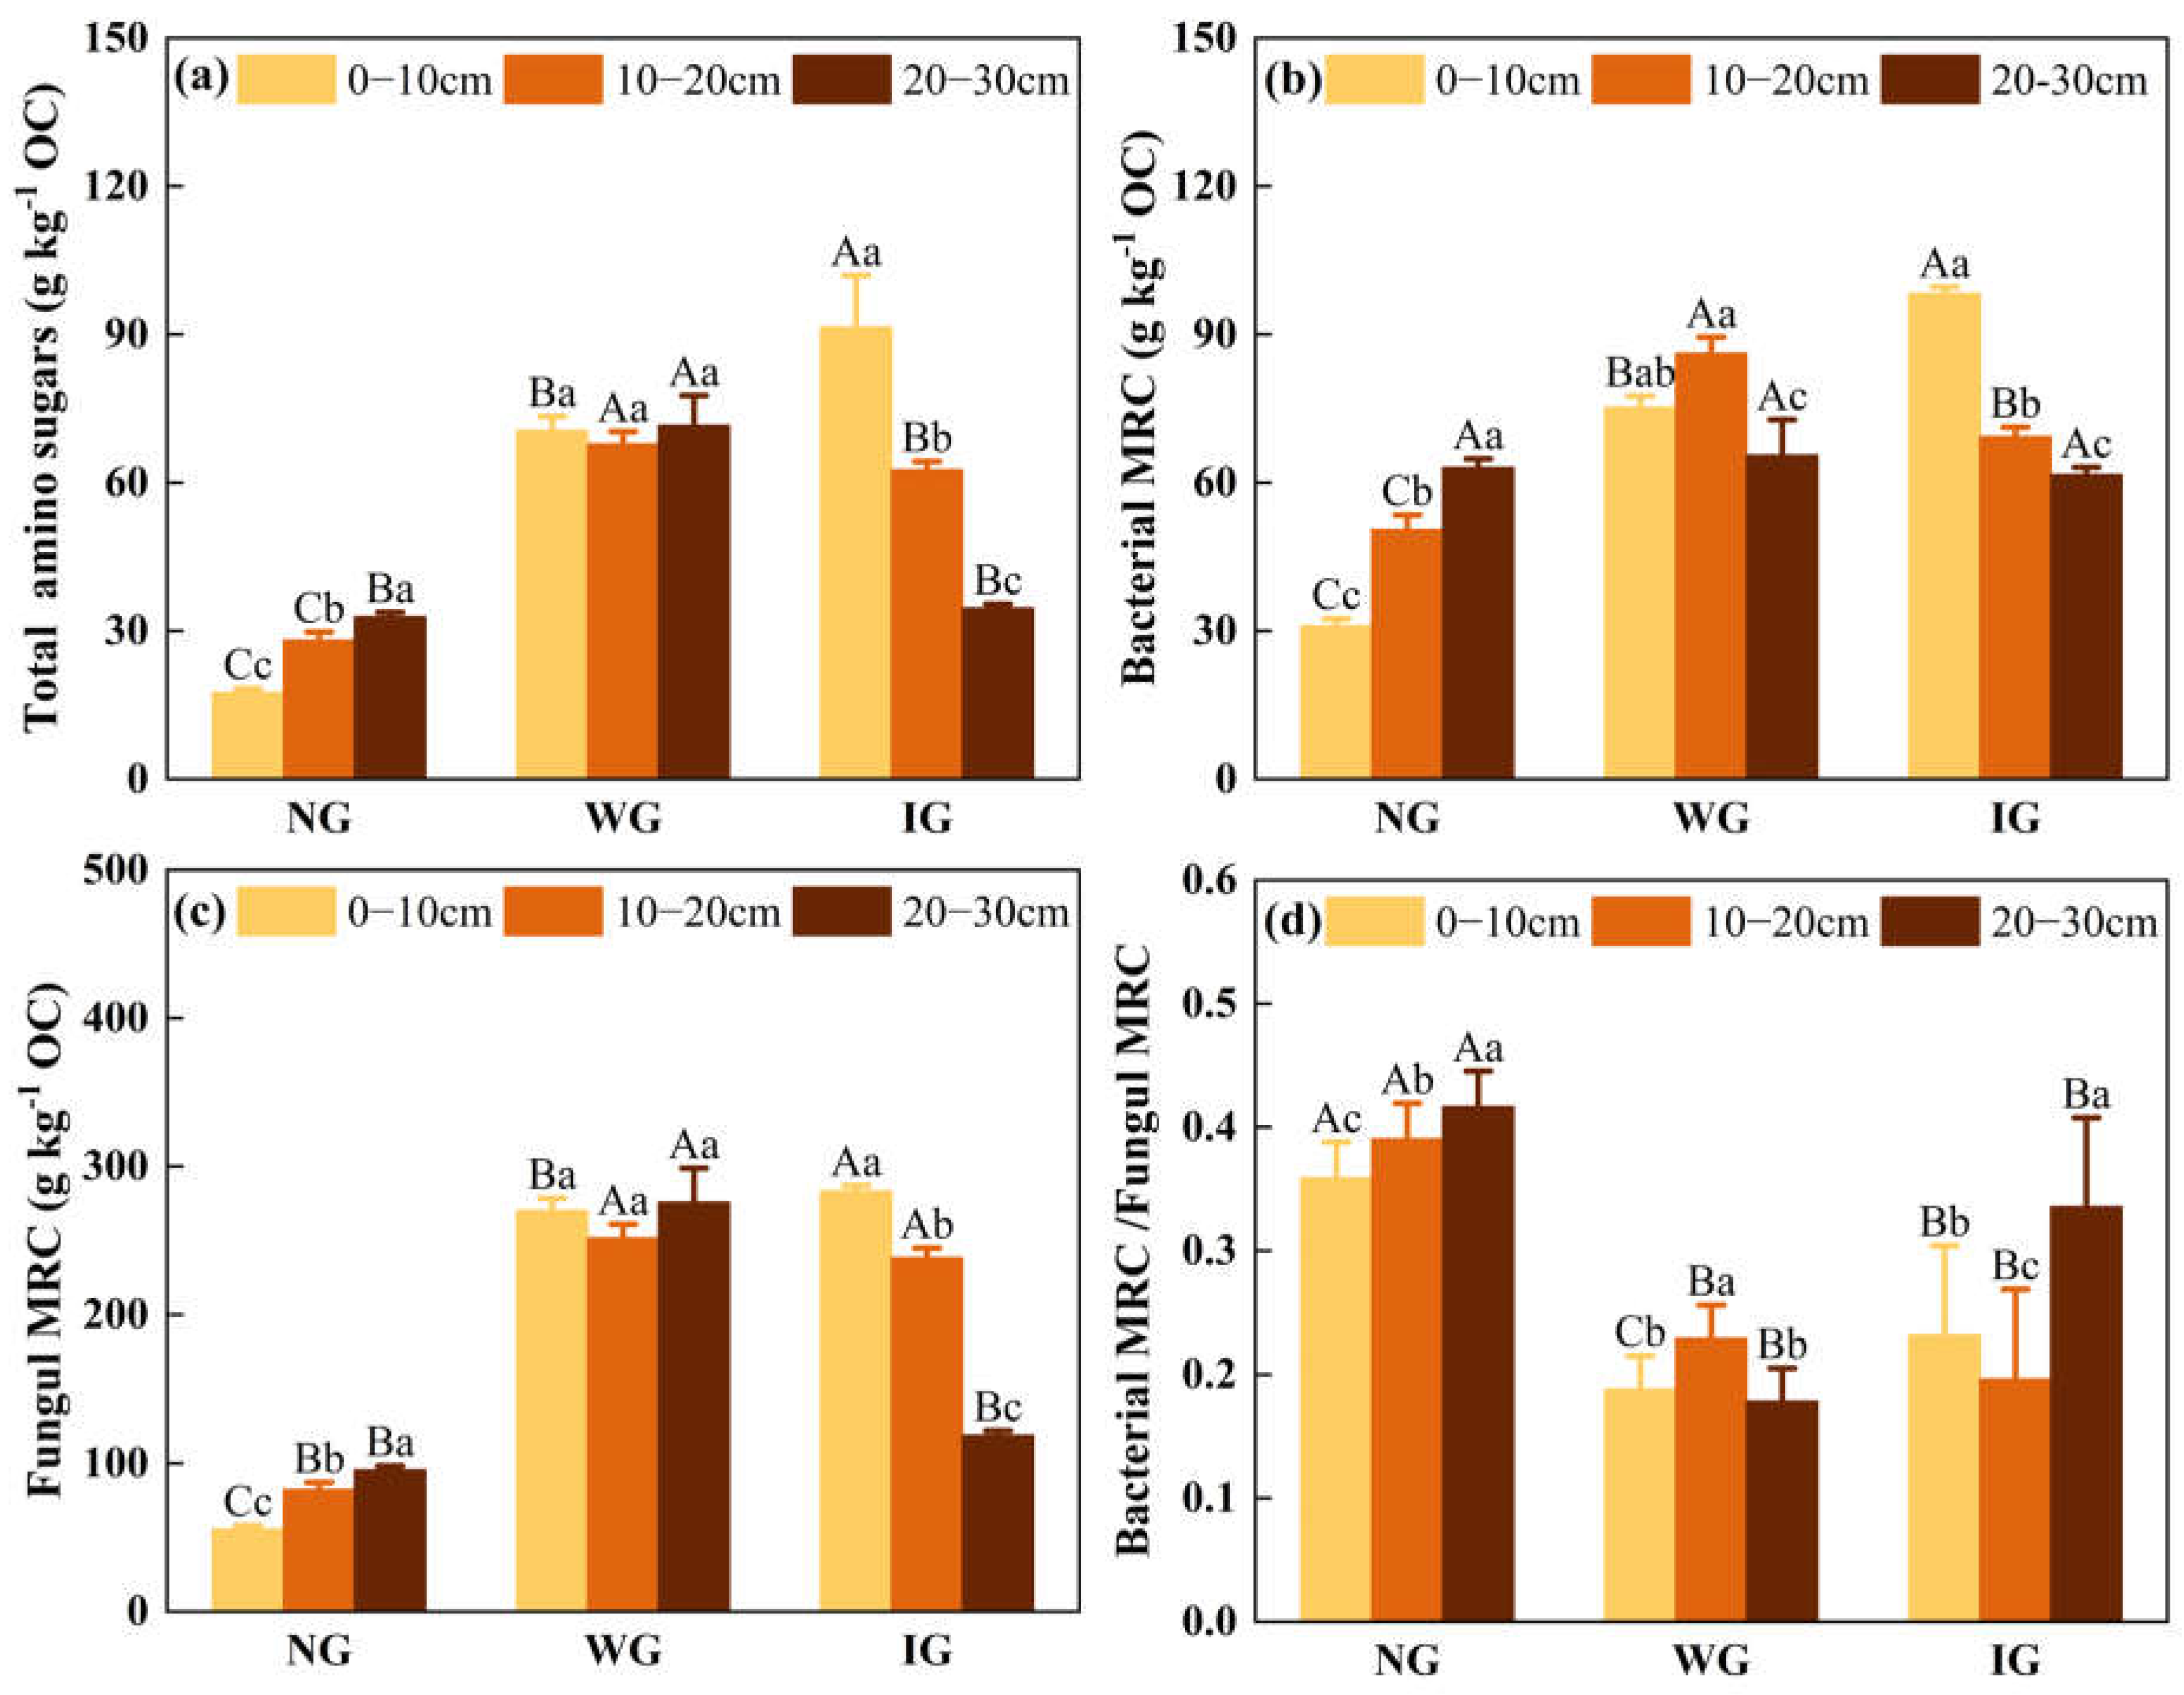
3.3. Bacterial and Fungal Residual Carbon

The contents of amino sugars and microbial residual carbon (MRC) showed significant variations in soil depth among different grassland types (Figure 4). Specifically, in NG soil, the contents of amino sugars and MRC increased with soil depth, while in IG soil, both showed a significant decline with increasing depth (p < 0.05, Figure 4). Compared to NG, the amino sugar content in WG was significantly higher across all soil layers, with increases ranging from 117% to 303% (p < 0.05). In IG soil, amino sugar content significantly increased mainly in the 0–20 cm soil layers, with no significant increase in the 20–30 cm layer. In the surface layer, the amino sugar content followed the order: IG > WG > NG (Figure 4a). The trends of fungal and bacterial MRC were similar to that of amino sugars, showing comparable patterns of change in both WG and IG. However, in the 20–30 cm layer, no significant differences were observed in bacterial MRC among the three grassland types (Figure 4b). Additionally, across all soil layers, the fungal-to-bacterial MRC ratio in WG and IG was significantly lower than in NG, decreasing by 41–57% and 19–49%, respectively (p < 0.05, Figure 4d).

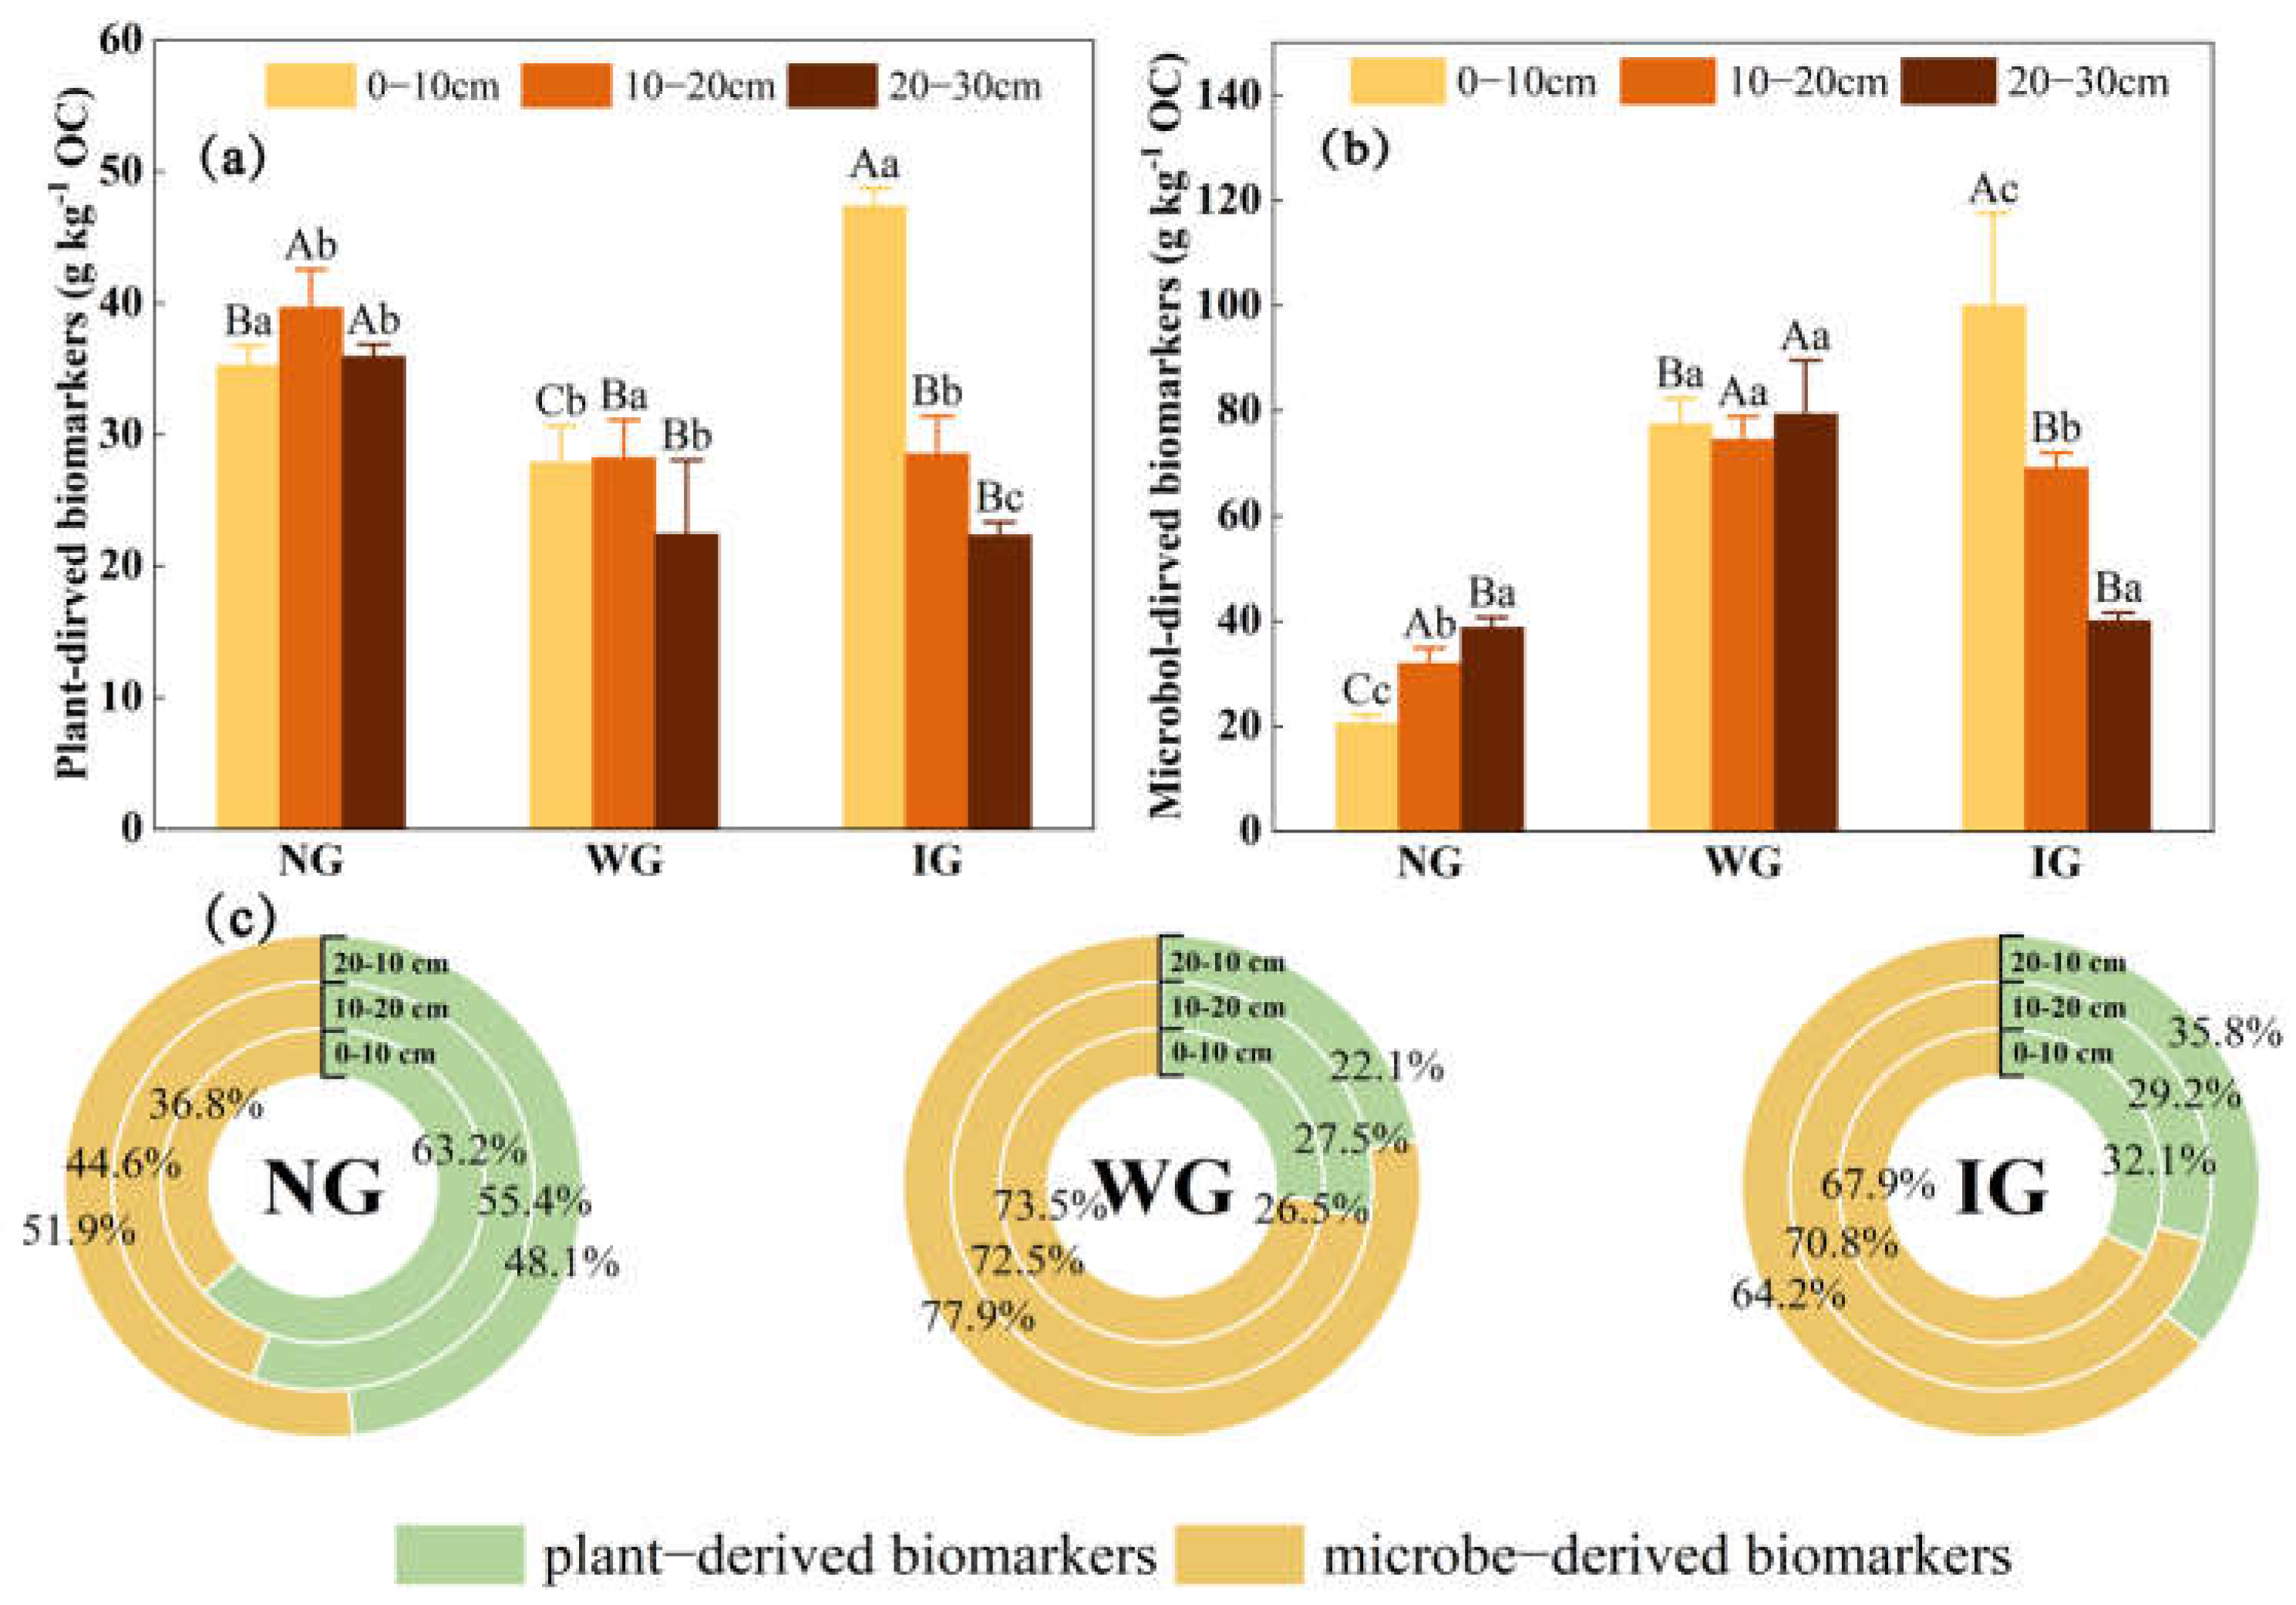
3.4. Plant- and Microbe-Derived Biomarkers

The distribution of plant-derived biomarkers (e.g., long-chain lipids, cutin, suberin, lignin phenols) and microbial-derived biomarkers (e.g., short-chain lipids, amino sugars) across the three types of grasslands is illustrated in Figure 5. Compared to NG, plant-derived biomarkers in WG decreased by an average of 29% across three soil layers, while microbe-derived biomarkers increased by an average of 171% (p < 0.05). In the surface layer of IG, both plant- and microbe-derived biomarkers significantly increased by 43% and 386%, respectively (p < 0.05). In the 10–30 cm layers, the trends in WG were similar. Overall, plant-derived biomarkers had a higher relative proportion in NG, whereas microbe-derived biomarkers increased in relative abundance in WG and IG (Figure 5c).
To further assess changes in SOM status at different depths across grassland types, principal component analysis (PCA) was employed. The PCA results explained 77.8% of the total variance, with PC1 accounting for 60.9% of the variation, effectively distinguishing NG soil samples from the 0–30 cm layer (Figure 6a). Specifically, the 0–30 cm layer of soil in NG is on the negative half-axis of PC1, while the soils in IG and WG are mainly concentrated on the positive half-axis of PC1, and the 0–10 cm layers of NG and WG are separated by PC2 on the positive half axis. Additionally, PC2 separated the 20–30 cm layer of all three grassland types and the 10–20 cm layer of PG soils. On PC1, cutin/suberin and bacterial/fungal markers showed strong negative loadings, indicating their strong negative contribution to this axis. In contrast, VSC, bacterial MRC, fungal MRC, as well as (Ad/Al)S, (Ad/Al)V, and ACLal had high positive loadings on PC1, reflecting their significant positive contribution.

4. Discussion

4.1. Changes in Lipids and Lignin Phenols Under Grassland Community Degradation

In the surface layer of WG and IG soil, the concentration of long-chain aliphatic lipids significantly increased (Figure 3a), with an elevation in ACLal and ACLac, as well as a significant reduction in short-chain lipids (Figure 3d and Figure S1). This suggests that in degraded grassland communities, long-chain aliphatic lipids (e.g., long-chain n-alkanes and long-chain fatty acids) exhibit better preservation potential [37]. Additionally, the increase in OEP and decrease in EOP (Figure S2) indicate a higher proportion of odd-carbon-chain compounds in degraded communities dominated by weeds and P. kansuensis invasion. Odd-carbon-chain compounds, such as long-chain alkanes and long-chain fatty acids, are typically derived from plant waxes, and this shift may be closely linked to the increased plant wax contributions in degraded grassland communities [38].
Compared to NG, the surface soils of WG and IG showed significant increases in cutin-derived compounds and phytosterols (Figure 3b,c), and this selective preservation of the cyclic structures of sterols is in agreement with [19], reflecting an enhanced accumulation of aboveground plant-derived compounds. This may be related to changes in plant community structure and biochemical composition [39,40]. Specifically, although the AGB in IG soil was lower than that in NG (Table S2), the rapid proliferation of the invasive P. kansuensis contributed substantial inputs of species-specific litter. This led to the accumulation of recalcitrant aromatic compounds in the surface soil. In the 10–20 cm soil layer, the content of cutin-derived compounds in WG and IG decreased (Figure 3b), suggesting that these compounds primarily accumulate in the surface soil, with a reduction in deeper layers compared to NG. Suberin-derived lipids dominated in the 0–30 cm layer of NG and the surface layer of IG (Figure 3e), while in WG, the suberin-derived lipids decreased and the cutin/suberin ratio increased (Figure 3e and Figure S2), possibly due to a reduced supply of root residues and exudates in the weed-dominated community [41]. In IG soil, the ω-C16/ΣC16 and ω-C18/ΣC18 ratios in the topsoil (0–10 cm) and deeper (20–30 cm) soil layers increased (Figure S3), indicating that P. kansuensis invasion enhanced the degradation of cutin in deeper layers [42]. This may be due to changes in the rhizosphere microbial community caused by the invasive plant, which affected the degradation processes of these compounds [43]. Additionally, a study on long-term Polygonum cuspidatum-invaded grasslands found that plant invasions altered litter input quality and soil clay particle content, which regulated microbial degradation [11].
We observed that the (Ad/Al)V and (Ad/Al)S ratios increased in the surface soils of WG and IG (Figure S4), indicating an intensified oxidation of lignin [44], the overall contribution of lignin phenols to surface SOC exhibited an increasing trend (Figure 3). The distribution of lignin in soil results from the combined effects of input and decomposition processes [45]. The accumulation of lignin in the surface soils of IG and WG may primarily be related to differences in plant litter input [46]. As a key structural component of plant tissues, lignin content in litter can be influenced by the replacement of dominant plant species in degraded communities, such as the increased proportions of L. leontopodioides and P. kansuensis (Table S2), which may contribute higher lignin inputs to surface soils [47]. In the 10–20 cm and 20–30 cm soil layers, the elevated Ad/Al ratios in IG and WG (Figure S4) suggest enhanced degradation of syringyl and vanillyl monomers in the deeper soils of degraded grasslands. This could be associated with the disruption of soil aggregate structures and reduced protective capacity of organo-mineral complexes in these communities [45,48].

4.2. Changes in Microbial Residues Under Grassland Community Degradation

Compared to NG, the contents of amino sugars, bacterial MRC, and fungal MRC significantly increased in the surface and 10–20 cm soil layers of WG and IG grasslands (Figure 4a–c). This phenomenon may be attributed to alterations in microbial activity following shifts in plant community structure. In WG, prolonged grazing led to reduced community productivity and lower plant diversity (Table S2), a factor likely enhancing microbial carbon use efficiency and contributing to increased microbial residue carbon accumulation [49,50]. In recent years, the invasion of P. kansuensis provided abundant litter resources in IG (Figure S1 and Table S2), offering sufficient carbon inputs to support microbial growth and subsequently enriching microbial residues [51]. The reduced bacterial/fungal MRC ratio in WG and IG (Figure 4d) indicates a decline in bacterial residue carbon relative to fungal residue carbon. This shift may result from the diminished physical protection of bacterial residue by soil microaggregates and clay minerals in degraded grasslands [52], in contrast, fungal cell walls (chitin and melanin) decompose at a relatively slower rate [53,54]. This trend aligns with findings from the Yunwu Mountain Nature Reserve on the Loess Plateau, where fungal residues exhibited more pronounced accumulation in degraded communities [54].

4.3. Contributions of Plant and Microbial Residue Carbon to SOC Under Grassland Community Degradation

Grassland community degradation significantly altered the molecular composition and sources of SOC across soil depths (Figure 5), beyond merely affecting the concentration of SOC. Compared to NG, WG and IG showed significantly reduced content of SOC and TN (Figure 2). However, biomarker analyses indicated a decreased contribution of plant residue carbon and an increased relative contribution of microbial residue carbon to SOC (Figure 3 and Figure 4). This shift may be attributed to several factors: (1) The decline in SOC in degraded grasslands might be linked to the accelerated decomposition of “other carbon” components—non-plant and non-microbial residue carbon such as amino acids, proteins, and monosaccharides, although lignin phenols and amino sugars have been validated as reliable indicators of plant and microbial residue carbon emerging evidence suggests that “other carbon” also plays a crucial role in SOC accumulation [23,24,55], Zhang et al. (2024) further proposed that these “other carbon” components primarily originate from root exudates of living plants [49]. (2) Microbe-derived carbon tends to be more stable and persistent than plant-derived carbon [56]. In degraded grasslands, the reduction in plant residue carbon, coupled with an increase in the C/N ratio (Figure 1 and Figure 5), likely reflects shifts in microbial community activity influenced by both soil conditions and vegetation dynamics. These changes promote the transformation of plant-derived SOM into microbial residues, thereby enhancing microbial contributions to SOC.
The contributions of plant- and microbial-derived residues to SOC vary by soil depth due to differing dominant factors. In surface soils, SOC accumulation is primarily influenced by aboveground plant productivity [24]. In WG soil, prolonged grazing reduced plant productivity and residue inputs, leading to a significantly lower plant contribution to SOC. Conversely, in IG soil, P. kansuensis invasion boosted plant productivity, providing abundant carbon inputs for microbial growth and increasing microbial residue contributions to SOC. In sublayers (>10 cm), SOC accumulation is mainly driven by root inputs and the differential degradation of plant and microbial residues [30,57]. Degraded grasslands exhibited restricted root growth in deeper layers, reducing direct plant contributions to SOC. Additionally, changes in soil conditions (Table S4), for instance, pH, BD, clay content, etc., likely enhanced microbial metabolic activity [15,58], leading to decreased accumulation of stable plant residues like suberin and lignin phenols. This trend was observed in both WG and IG, which may be related to the increased stocking intensity over the past decade (Figure S1). However, the specific mechanisms might depend on soil structural changes and nutrient limitations, requiring further investigation.
Overall, grassland community degradation indirectly affects the contributions of plant and microbial residues to SOC by altering plant community structure and soil environmental characteristics. These changes regulate the key molecular components of SOM, including lipids, lignin phenols, and amino sugars, exacerbating SOC losses, particularly in sublayer soils.

5. Conclusions

In summary, the surface soils of WG and IG exhibited significantly lower concentrations of SOC and TN compared to NG, along with notable variations in the SOC/TN ratio. Biomarkers indicate that the degradation of plant communities alters the composition and sources of SOC. For plant-derived biomarkers, long-chain lipids and phytosterols showed greater accumulation in the surface soils of WG and IG, while the abundance of suberin significantly decreased in WG, compared to NG. Microbe-derived biomarkers, together with bacterial and fungal MRC, significantly increased in degraded grasslands, especially in IG, where MRC significantly contributed to SOC in the surface layer. Regarding PCA, it further confirmed that grassland degradation influences the molecular composition and degradation state of organic carbon at different soil depths. These findings suggest that grassland degradation, dominated by invasive species and weeding, alters the contribution ratio of plant-derived and microbial components in SOC, while microbe-derived carbon, due to its greater resistance to degradation and enhanced mineral-binding capacity, plays a crucial role in stabilizing SOC in degraded grasslands. The results highlight the differential responses of plant- and microbe-derived carbon to SOC accumulation during vegetation community degradation. Future research should focus on quantifying the accumulation processes of different SOC components to better understand the mechanisms underlying the rapid loss of carbon in degraded grasslands and the role of microbial dynamics in soil stabilization.

Supplementary Materials

The following supporting information can be downloaded at: https://www.mdpi.com/article/10.3390/agronomy15040810/s1; Table S1: Main grazing species and numbers in the bayinbuluke study area; Table S2 Historical plant community characteristics for different types of degraded grasslands; Table S3: Historical changes in soc data for different types of degraded grasslands (2010~2024). Table S4: Basic soil properties and concentration of in the 0–10, 10–20, and 20–30 cm soil layers under native grassland (NG), weedy grassland (WG), and invasive grassland (IG); Table S5: The soil biomarker compounds identified from biomarker analysis across all soil layers; Figure S1: Historical change data of the study area over the past 20 years; Figure S2: The parameters of free lipids at depths in the 0–10, 10–20, and 20–30 cm soil layers across three types of grassland; Figure S3: The parameters of bound lipids at four depths in the 0–10, 10–20, and 20–30 cm soil layers across three types of grassland; Figure S4: Degradation parameters of lignin phenols in the 0–10, 10–20, and 20–30 cm soil layers across three types of grassland.

Author Contributions

Conceptualization, J.M.; methodology and designed the experiment, W.Z.; formal analysis, conducted the experiment, W.Z. and H.L.; investigation, X.M. and L.F.; writing—original draft preparation, W.Z.; visualization, W.Z. and G.W.; writing—review and editing, J.M.; supervision, Y.L. and J.M. funding: J.M. All authors have read and agreed to the published version of the manuscript.

Funding

This research was supported by the National Natural Science Foundation of China (42077327) and the Third Xinjiang Scientific Expedition Program (2021xjkk0603).

Data Availability Statement

The original contributions presented in the study are included in the article material; further inquiries can be directed to the corresponding authors.

Acknowledgments

We thank the funding support from the National Natural Science Foundation of China and the Third Xinjiang Scientific Expedition Program of the Ministry of Science and Technology of China. The authors of this paper would like to thank the Bayinbuluke Grassland Ecosystem Research Station and the Chinese Academy of Sciences for their support during the fieldwork. We gratefully acknowledge the three reviewers and editors for their meticulous review and insightful critiques, which have greatly enhanced the rigor and clarity of this work.

Conflicts of Interest

The authors declare no conflicts of interest.

References

  1. Cimatti, M.; Chaplin-Kramer, R.; Di Marco, M. The Role of High-Biodiversity Regions in Preserving Nature’s Contributions to People. Nat. Sustain. 2023, 6, 1385–1393. [Google Scholar] [CrossRef]
  2. Lyons, K.G.; Török, P.; Hermann, J.-M.; Kiehl, K.; Kirmer, A.; Kollmann, J.; Overbeck, G.E.; Tischew, S.; Allen, E.B.; Bakker, J.D.; et al. Challenges and Opportunities for Grassland Restoration: A Global Perspective of Best Practices in the Era of Climate Change. Glob. Ecol. Conserv. 2023, 46, e02612. [Google Scholar] [CrossRef]
  3. Renwick, A.; Jansson, T.; Verburg, P.H.; Revoredo-Giha, C.; Britz, W.; Gocht, A.; McCracken, D. Policy Reform and Agricultural Land Abandonment in the EU. Land Use Policy 2013, 30, 446–457. [Google Scholar] [CrossRef]
  4. Plieninger, T.; Hui, C.; Gaertner, M.; Huntsinger, L. The Impact of Land Abandonment on Species Richness and Abundance in the Mediterranean Basin: A Meta-Analysis. PLoS ONE 2014, 9, e98355. [Google Scholar] [CrossRef]
  5. Bardgett, R.D.; Bullock, J.M.; Lavorel, S.; Manning, P.; Schaffner, U.; Ostle, N.; Chomel, M.; Durigan, G.; Fry, E.L.; Johnson, D.; et al. Combatting Global Grassland Degradation. Nat. Rev. Earth Environ. 2021, 2, 720–735. [Google Scholar] [CrossRef]
  6. Zhang, M.; Sun, J.; Wang, Y.; Li, Y.; Duo, J. State-of-the-Art and Challenges in Global Grassland Degradation Studies. Geogr. Sustain. 2024, 6, 100229. [Google Scholar] [CrossRef]
  7. Rhodes, A.C.; Rutledge, J.; DuPont, B.; Plowes, R.M.; Gilbert, L.E. Targeted Grazing of an Invasive Grass Improves Outcomes for Native Plant Communities and Wildlife Habitat. Rangel. Ecol. Manag. 2021, 75, 41–50. [Google Scholar] [CrossRef]
  8. Zheng, X.; Chen, C.; Dai, X.; Lang, L.; Li, X.; Chen, J.; Wang, R.; Cai, W.; Gao, Y. Toxic Nonpreferred Species Accelerate the Natural Restoration of Plant Productivity and Diversity in Degraded Grasslands. Sci. Total Environ. 2024, 935, 173391. [Google Scholar] [CrossRef]
  9. Costa, D.P.D.; Araujo, A.S.F.; Pereira, A.P.D.A.; Mendes, L.W.; França, R.F.D.; Silva, T.D.G.E.D.; Oliveira, J.B.D.; Araujo, J.S.; Duda, G.P.; Menezes, R.S.C.; et al. Forest-to-Pasture Conversion Modifies the Soil Bacterial Community in Brazilian Dry Forest Caatinga. Sci. Total Environ. 2022, 810, 151943. [Google Scholar] [CrossRef]
  10. DiTomaso, J.M. Invasive Weeds in Rangelands: Species, Impacts, and Management. Weed Sci. 2000, 48, 255–265. [Google Scholar] [CrossRef]
  11. Tamura, M.; Tharayil, N. Plant Litter Chemistry and Microbial Priming Regulate the Accrual, Composition and Stability of Soil Carbon in Invaded Ecosystems. New Phytol. 2014, 203, 110–124. [Google Scholar] [CrossRef] [PubMed]
  12. Lyu, X.; Li, X.; Dang, D.; Dou, H.; Xuan, X.; Liu, S.; Li, M.; Gong, J. A New Method for Grassland Degradation Monitoring by Vegetation Species Composition Using Hyperspectral Remote Sensing. Ecol. Indic. 2020, 114, 106310. [Google Scholar] [CrossRef]
  13. Bai, Y.; Cotrufo, M.F. Grassland Soil Carbon Sequestration: Current Understanding, Challenges, and Solutions. Science 2022, 377, 603–608. [Google Scholar] [CrossRef] [PubMed]
  14. Lavallee, J.M.; Soong, J.L.; Cotrufo, M.F. Conceptualizing Soil Organic Matter into Particulate and Mineral-Associated Forms to Address Global Change in the 21st Century. Glob. Change Biol. 2020, 26, 261–273. [Google Scholar] [CrossRef]
  15. Sun, H.; Liu, J.; Wu, J.; Hu, H.; Chen, Q.; Fang, H.; Tao, K. Effects of Alpine Grassland Degradation on Soil Microbial Community Structure and Metabolic Activity in the Qinghai-Tibet Plateau. Appl. Soil Ecol. 2024, 200, 105458. [Google Scholar] [CrossRef]
  16. Bai, Y.; Ma, L.; Degen, A.A.; Rafiq, M.K.; Kuzyakov, Y.; Zhao, J.; Zhang, R.; Zhang, T.; Wang, W.; Li, X.; et al. Long-term Active Restoration of Extremely Degraded Alpine Grassland Accelerated Turnover and Increased Stability of Soil Carbon. Glob. Change Biol. 2020, 26, 7217–7228. [Google Scholar] [CrossRef]
  17. Häring, V.; Fischer, H.; Cadisch, G.; Stahr, K. Implication of Erosion on the Assessment of Decomposition and Humification of Soil Organic Carbon after Land Use Change in Tropical Agricultural Systems. Soil Biol. Biochem. 2013, 65, 158–167. [Google Scholar] [CrossRef]
  18. Ashraf, M.N.; Hu, C.; Xu, X.; Aziz, T.; Wu, L.; Waqas, M.A.; Farooq, M.; Hu, X.; Zhang, W.; Xu, M. Long-Term Manure Application Increased Soil Organic Carbon and Nitrogen Mineralization through Accumulation of Unprotected and Physically Protected Carbon Fractions. Pedosphere 2023, 33, 343–354. [Google Scholar] [CrossRef]
  19. Otto, A.; Shunthirasingham, C.; Simpson, M.J. A Comparison of Plant and Microbial Biomarkers in Grassland Soils from the Prairie Ecozone of Canada. Org. Geochem. 2005, 36, 425–448. [Google Scholar] [CrossRef]
  20. Ma, T.; Zhu, S.; Wang, Z.; Chen, D.; Dai, G.; Feng, B.; Su, X.; Hu, H.; Li, K.; Han, W.; et al. Divergent Accumulation of Microbial Necromass and Plant Lignin Components in Grassland Soils. Nat. Commun. 2018, 9, 3480. [Google Scholar] [CrossRef]
  21. Shen, X.; Yang, F.; Xiao, C.; Zhou, Y. Increased Contribution of Root Exudates to Soil Carbon Input during Grassland Degradation. Soil Biol. Biochem. 2020, 146, 107817. [Google Scholar] [CrossRef]
  22. Tang, Q.; Li, W.; Dai, W.; Wang, J.; Zhang, F.; Daniell, T.J.; Cheng, Y.; Wang, S.; Yin, W.; Wang, X. Patterns and Determinants of Microbial- and Plant-Derived Carbon Contributions to Soil Organic Carbon in Tea Plantation Chronosequence. Plant Soil 2024, 505, 811–825. [Google Scholar] [CrossRef]
  23. Angst, G.; Mueller, K.E.; Nierop, K.G.J.; Simpson, M.J. Plant- or Microbial-Derived? A Review on the Molecular Composition of Stabilized Soil Organic Matter. Soil Biol. Biochem. 2021, 156, 108189. [Google Scholar] [CrossRef]
  24. Chen, X.; Ni, X.; Zheng, G.; Hu, M.; Chen, H.Y.H. Changes in Plant Lignin Components and Microbial Necromass Matter with Subtropical Forest Restoration. Geoderma 2024, 445, 116875. [Google Scholar] [CrossRef]
  25. Zhang, Z.; Kaye, J.P.; Bradley, B.A.; Amsili, J.P.; Suseela, V. Cover Crop Functional Types Differentially Alter the Content and Composition of Soil Organic Carbon in Particulate and Mineral-associated Fractions. Glob. Change Biol. 2022, 28, 5831–5848. [Google Scholar]
  26. Wang, W.; Tang, J.; Zhang, N.; Wang, Y.; Xu, X.; Zhang, A. Spatiotemporal Pattern of Invasive Pedicularis in the Bayinbuluke Land, China, during 2019–2021: An Analysis Based on PlanetScope and Sentinel-2 Data. Remote Sens. 2023, 15, 4383. [Google Scholar] [CrossRef]
  27. Kou, Y.; Li, J.; Wang, Y.; Li, C.; Tu, B.; Yao, M.; Li, X. Scale-Dependent Key Drivers Controlling Methane Oxidation Potential in Chinese Grassland Soils. Soil Biol. Biochem. 2017, 111, 104–114. [Google Scholar]
  28. Hu, J.; Li, K.; Deng, C.; Gong, Y.; Liu, Y.; Wang, L. Seed Germination Ecology of Semiparasitic Weed Pedicularis Kansuensis in Alpine Grasslands. Plants 2022, 11, 1777. [Google Scholar] [CrossRef]
  29. Otto, A.; Simpson, M.J. Sources and Composition of Hydrolysable Aliphatic Lipids and Phenols in Soils from Western Canada. Org. Geochem. 2006, 37, 385–407. [Google Scholar] [CrossRef]
  30. Jin, X.; Wang, L.; Zhang, J.; Fang, Y.; Wang, X.; Xiaoyang, D.; Ma, L.; Li, H.; Zhang, L.; Liu, Y.; et al. Two Decades of No Tillage Divergently Accumulate Plant Lignin and Microbial Necromass in the Top and Sublayers. Soil Tillage Res. 2024, 244, 106211. [Google Scholar] [CrossRef]
  31. Zhang, X.; Amelung, W. Gas Chromatographic Determination of Muramic Acid, Glucosamine, Mannosamine, and Galactosamine in Soils. Soil Biol. Biochem. 1996, 28, 1201–1206. [Google Scholar] [CrossRef]
  32. NIST23; NIST Standard Reference Database 1A. NIST: Gaithersburg, MA, USA, 2014.
  33. Crow, S.E.; Lajtha, K.; Filley, T.R.; Swanston, C.W.; Bowden, R.D.; Caldwell, B.A. Sources of Plant-Derived Carbon and Stability of Organic Matter in Soil: Implications for Global Change. Glob. Change Biol. 2009, 15, 2003–2019. [Google Scholar] [CrossRef]
  34. Dai, G.; Zhu, S.; Cai, Y.; Zhu, E.; Jia, Y.; Ji, C.; Tang, Z.; Fang, J.; Feng, X. Plant-Derived Lipids Play a Crucial Role in Forest Soil Carbon Accumulation. Soil Biol. Biochem. 2022, 168, 108645. [Google Scholar]
  35. Li, T.; Cheng, H.; Li, Y.; Mou, Z.; Zhu, X.; Wu, W.; Zhang, J.; Kuang, L.; Wang, J.; Hui, D.; et al. Divergent Accumulation of Amino Sugars and Lignins Mediated by Soil Functional Carbon Pools under Tropical Forest Conversion. Sci. Total Environ. 2023, 881, 163204. [Google Scholar] [CrossRef]
  36. Engelking, B.; Flessa, H.; Joergensen, R.G. Shifts in Amino Sugar and Ergosterol Contents after Addition of Sucrose and Cellulose to Soil. Soil Biol. Biochem. 2007, 39, 2111–2118. [Google Scholar] [CrossRef]
  37. Karimi Nezhad, M.T.; Šamonil, P.; Daněk, P.; Jaroš, J.; Hájek, M.; Hájková, P.; Jabinski, S.; Meador, T.B.; Roleček, J. Lipid Biomarkers and Stable Isotopes Uncover Paleovegetation Changes in Extremely Species-Rich Forest-Steppe Ecosystems, Central Europe. Environ. Res. 2024, 259, 119564. [Google Scholar] [CrossRef]
  38. Li, X.; Anderson, B.J.; Vogeler, I.; Schwendenmann, L. Long-Chain n-Alkane and n-Fatty Acid Characteristics in Plants and Soil—Potential to Separate Plant Growth Forms, Primary and Secondary Grasslands? Sci. Total Environ. 2018, 645, 1567–1578. [Google Scholar] [CrossRef]
  39. Man, M.; Gregorich, E.G.; Beare, M.H.; Ellert, B.H.; Simpson, M.J. Distinct Dynamics of Plant- and Microbial-Derived Soil Organic Matter in Relation to Varying Climate and Soil Properties in Temperate Agroecosystems. Geochim. Cosmochim. Acta 2023, 361, 276–287. [Google Scholar] [CrossRef]
  40. Spielvogel, S.; Prietzel, J.; Leide, J.; Riedel, M.; Zemke, J.; Kögel-Knabner, I. Distribution of Cutin and Suberin Biomarkers under Forest Trees with Different Root Systems. Plant Soil 2014, 381, 95–110. [Google Scholar] [CrossRef]
  41. Afifi, M.; Swanton, C. Early Physiological Mechanisms of Weed Competition. Weed Sci. 2012, 60, 542–551. [Google Scholar] [CrossRef]
  42. Feng, X.; Simpson, A.J.; Wilson, K.P.; Dudley Williams, D.; Simpson, M.J. Increased Cuticular Carbon Sequestration and Lignin Oxidation in Response to Soil Warming. Nat. Geosci. 2008, 1, 836–839. [Google Scholar] [CrossRef]
  43. Li, J.; He, J.-Z.; Liu, M.; Yan, Z.-Q.; Xu, X.-L.; Kuzyakov, Y. Invasive Plant Competitivity Is Mediated by Nitrogen Use Strategies and Rhizosphere Microbiome. Soil Biol. Biochem. 2024, 192, 109361. [Google Scholar] [CrossRef]
  44. Liu, X.; Bol, R.; An, T.; Liu, Y.; Xu, Y.; Li, S.; Wang, J. Divergent Accumulation of Microbial Necromass and Plant Lignin Phenol Induced by Adding Maize Straw to Fertilized Soils. Soil Tillage Res. 2024, 243, 106177. [Google Scholar] [CrossRef]
  45. Zou, Z.; Ma, L.; Wang, X.; Chen, R.; Jones, D.L.; Bol, R.; Wu, D.; Du, Z. Decadal Application of Mineral Fertilizers Alters the Molecular Composition and Origins of Organic Matter in Particulate and Mineral-Associated Fractions. Soil Biol. Biochem. 2023, 182, 109042. [Google Scholar] [CrossRef]
  46. Sanaullah, M.; Rumpel, C.; Charrier, X.; Chabbi, A. How Does Drought Stress Influence the Decomposition of Plant Litter with Contrasting Quality in a Grassland Ecosystem? Plant Soil 2012, 352, 277–288. [Google Scholar] [CrossRef]
  47. Zhu, S.; Dai, G.; Ma, T.; Chen, L.; Chen, D.; Lü, X.; Wang, X.; Zhu, J.; Zhang, Y.; Bai, Y.; et al. Distribution of Lignin Phenols in Comparison with Plant-Derived Lipids in the Alpine versus Temperate Grassland Soils. Plant Soil 2019, 439, 325–338. [Google Scholar] [CrossRef]
  48. Gao, Q.; Ma, L.; Fang, Y.; Zhang, A.; Li, G.; Wang, J.; Wu, D.; Wu, W.; Du, Z. Conservation Tillage for 17 Years Alters the Molecular Composition of Organic Matter in Soil Profile. Sci. Total Environ. 2021, 762, 143116. [Google Scholar] [CrossRef]
  49. Zhang, X.; Zhang, F.; Yuan, Z.-Q.; Li, F.-M. Alfalfa-Livestock System Promotes the Accumulation of Soil Organic Carbon in a Semi-Arid Marginal Land. Agric. Ecosyst. Environ. 2024, 375, 109200. [Google Scholar] [CrossRef]
  50. Prommer, J.; Walker, T.W.N.; Wanek, W.; Braun, J.; Zezula, D.; Hu, Y.; Hofhansl, F.; Richter, A. Increased Microbial Growth, Biomass, and Turnover Drive Soil Organic Carbon Accumulation at Higher Plant Diversity. Glob. Change Biol. 2020, 26, 669–681. [Google Scholar] [CrossRef]
  51. Ottoy, S.; Van Meerbeek, K.; Sindayihebura, A.; Hermy, M.; Van Orshoven, J. Assessing Top- and Subsoil Organic Carbon Stocks of Low-Input High-Diversity Systems Using Soil and Vegetation Characteristics. Sci. Total Environ. 2017, 589, 153–164. [Google Scholar] [CrossRef]
  52. Almagro, M.; Ruiz-Navarro, A.; Díaz-Pereira, E.; Albaladejo, J.; Martínez-Mena, M. Plant Residue Chemical Quality Modulates the Soil Microbial Response Related to Decomposition and Soil Organic Carbon and Nitrogen Stabilization in a Rainfed Mediterranean Agroecosystem. Soil Biol. Biochem. 2021, 156, 108198. [Google Scholar] [CrossRef]
  53. Xue, Z.; Qu, T.; Li, X.; Chen, Q.; Zhou, Z.; Wang, B.; Lv, X. Different Contributing Processes in Bacterial vs. Fungal Necromass Affect Soil Carbon Fractions during Plant Residue Transformation. Plant Soil 2024, 494, 301–319. [Google Scholar] [CrossRef]
  54. Yang, Y.; Dou, Y.; Wang, B.; Wang, Y.; Liang, C.; An, S.; Soromotin, A.; Kuzyakov, Y. Increasing Contribution of Microbial Residues to Soil Organic Carbon in Grassland Restoration Chronosequence. Soil Biol. Biochem. 2022, 170, 108688. [Google Scholar] [CrossRef]
  55. Wang, B.; An, S.; Liang, C.; Liu, Y.; Kuzyakov, Y. Microbial Necromass as the Source of Soil Organic Carbon in Global Ecosystems. Soil Biol. Biochem. 2021, 162, 108422. [Google Scholar] [CrossRef]
  56. Sokol, N.W.; Kuebbing, S.E.; Karlsen-Ayala, E.; Bradford, M.A. Evidence for the Primacy of Living Root Inputs, Not Root or Shoot Litter, in Forming Soil Organic Carbon. New Phytol. 2019, 221, 233–246. [Google Scholar] [CrossRef]
  57. Šarūnaitė, L.; Arlauskienė, A.; Jablonskytė-Raščė, D. Effect of Plant Edges Strips on the Conservation Soil Properties in Modern Farming Field. PLoS ONE 2024, 19, e0299104. [Google Scholar] [CrossRef]
  58. Liao, J.; Dou, Y.; Yang, X.; An, S. Soil Microbial Community and Their Functional Genes during Grassland Restoration. J. Environ. Manag. 2023, 325, 116488. [Google Scholar] [CrossRef]
Figure 1. Sampling sites in the study area.
Agronomy 15 00810 g001
Figure 2. Concentrations of soil organic carbon (SOC) (a) and total nitrogen (TN) (b), and the ratio of SOC to TN (c) in the 0–10, 10–20, and 20–30 cm soil layers under native grassland (NG), weed-dominated grassland (WG) and invasive grassland (IG). Values are presented as mean ± standard error (n = 3). Uppercase letters indicate significant differences between the grassland types, while lowercase letters denote significant differences at p < 0.05 across different depths within the three grassland types.
Agronomy 15 00810 g002
Figure 3. Contents of long-chain lipids (a), cutin (b), phytosterols (c), short-chain lipids (d), suberin (e), and lignin phenols (f) in the 0–10, 10–20, and 20–30 cm soil layers across three types of grasslands: native grassland (NG), weed-dominated grassland (WG), and invasive grassland (IG). Each bar represents the mean ± SD (n = 3). Uppercase letters indicate significant differences between the grassland types, while lowercase letters denote significant differences at p < 0.05 across different depths within the three grassland types.
Agronomy 15 00810 g003
Figure 4. Contents of amino sugars (a), bacterial MRC (b), fungal MRC (c), and the ratio of bacterial MRC and fungal MRC (d) in the 0–10, 10–20, and 20–30 cm soil layers across three types of grasslands. Each bar represents the mean ± SD (n = 3). Uppercase letters indicate significant differences between the grassland types, while lowercase letters denote significant differences at p < 0.05 across different depths within the three grassland types.
Agronomy 15 00810 g004
Figure 5. Contents of plant-derived biomarkers (sum of long-chain lipids, cutin, suberin, lignin) (a), microbe-derived biomarkers (sum of short-chain lipids, amino sugars) (b), the ratio of the two components to the total extracted components in the 0–10, 10–20, and 20–30 cm soil layers across three types of grassland (c). Each bar represents the mean ± SD (n = 3). Uppercase letters indicate significant differences between the grassland types, while lowercase letters denote significant differences at p < 0.05 across different depths within the three grassland types.
Agronomy 15 00810 g005
Figure 6. Principal component analysis (PCA) for the relationships between grassland types, soil depth and plant- and microbe-derived compounds. The distribution differences among grassland types across various soil depths (a), the loading contributions of specific compounds, and related degradation proxies (b). ACLal: Average chain length of n-alkanes; ACLac: Average chain length of n-alkanoic acids; OEP: Odd-over-even predominance of n-alkanes; EOP: Even-over-odd predominance of n-alkanoic acids; ω-C16/ΣC16: ω-hydroxy-alkanoic acids relative to all hydrolyzable C16 aliphatic lipids; and ω-C18/ΣC18: ω-hydroxy-alkanoic acids relative to all hydrolyzable C18 aliphatic lipids; VSC: Total lignin phenols. (Ad/Al)S: Acid-to-aldehyde ratio of syringyl monomer; (Ad/Al)V: Acid-to-aldehyde ratio of vanillyl monomer.
Agronomy 15 00810 g006
Disclaimer/Publisher’s Note: The statements, opinions and data contained in all publications are solely those of the individual author(s) and contributor(s) and not of MDPI and/or the editor(s). MDPI and/or the editor(s) disclaim responsibility for any injury to people or property resulting from any ideas, methods, instructions or products referred to in the content.

