Article

Inversion Study of Maize Leaf Physiological Information Under Light–Temperature Stress Using Visible–Near Infrared Spectroscopy

1
College of Engineering and Technology, Jilin Agricultural University, Changchun 130118, China
2
College of Horticulture, Jilin Agricultural University, Changchun 130118, China
*
Author to whom correspondence should be addressed.
Agronomy 2025, 15(4), 828; https://doi.org/10.3390/agronomy15040828
Submission received: 10 March 2025 / Revised: 26 March 2025 / Accepted: 26 March 2025 / Published: 27 March 2025
(This article belongs to the Section Precision and Digital Agriculture)

Abstract

:
Light and temperature are important environmental factors for maize growth. Appropriate light and temperature conditions can enhance the net photosynthetic rate of maize leaves, which in turn promotes high-quality and high-yield maize production. This study focuses on maize during the seedling stage and investigates the response patterns of maize leaf net photosynthetic rate, relative chlorophyll content (SPAD value), and visible–near-infrared spectral data under eight light–temperature stress conditions. Spectrally sensitive bands and characteristic wavelengths were extracted, and six different combinations of spectral preprocessing and modeling methods were used to establish inversion models for SPAD and net photosynthetic rate, respectively. Six different spectral preprocessing and modeling combination methods were employed to establish inversion models for the SPAD values and net photosynthetic rate of maize leaves. The research results use the correlation coefficients Rc and Rp, as well as the root mean square errors RMSEC and RMSEP, from the training and validation sets as evaluation metrics for the maize leaf physiological information inversion models. The optimal spectral combination method for the SPAD value inversion model of maize leaves was identified as PLS-MSC-SG, with an Rc value of 0.996 and an Rp value of 0.9743. The optimal combination method for the net photosynthetic rate inversion model was PLS-SNV-SG, with corresponding Rc and Rp values of 0.9848 and 0.9743, respectively. The results deepen the understanding of maize photosynthetic spectral physiological responses to light–temperature environments and provide important guidance for the precise management of maize growth conditions.

1. Introduction

As one of China’s main staple crops, corn plays a vital role in ensuring national food security, with both its yield and quality being of great importance. According to data from the National Bureau of Statistics, in 2024 [1], the planting area of corn in China reached 44.74 million hectares, and corn output reached a record 294.92 million tons, an increase of 2.1% compared to the previous year. Light is a necessary condition for photosynthesis in crops. Insufficient or excessive light can adversely affect photosynthesis, chlorophyll content, and plant growth, thus impacting the yield and quality of food crops. Research by Chen Guangling [2] showed that as light intensity decreases soybean plants exhibit thinner stems, taller plant height, and shorter root length. Cheng Yajiao’s study [3] found that weak light conditions hinder the absorption of nutrients by the above-ground and below-ground parts of soybean plants, obstructing the transport of photosynthetic products to the above-ground parts and negatively affecting root growth and development. Gao Zhiying and others [4] found that after subjecting corn to weak light treatment the growth and development of corn were inhibited, and low nitrogen treatments were more beneficial for corn dry matter accumulation than medium or high nitrogen treatments. Temperature directly affects plant growth, development, and metabolic processes [5], with different plants having varying temperature tolerance ranges. Both excessively high and low temperatures can affect plant growth rates, photosynthetic efficiency, and yield [6]. Li Xiaofan’s research [7] indicated that combined high-temperature and drought stress at different growth stages negatively affected summer corn, with the greatest impact occurring during the tasseling period. Moreover, the combined stress had a more significant effect than single stresses, leading to decreases in leaf area, chlorophyll content, photosynthetic performance, and yield. Research by Shao Jingyi et al. [8] showed that summer corn exposed to high-temperature, drought, and combined stress exhibited abnormal stem growth, weakened photosynthesis, reduced dry matter accumulation, and a significant decline in yield. Compared with high-temperature or drought stress alone, combined high-temperature and drought stress had a more pronounced negative effect on both the yield and the microscopic structure of corn stems. Newiton [9] found that an increase in temperature leads to changes in the properties of cereal proteins, mainly due to the reduced solubility and inactivation of lipase, as well as the decrease in lutein content. Although relevant scholars have studied the effects of light and temperature on maize physiological growth, most of the research focuses on comparative studies under specific light and temperature conditions. The impact of combined light and temperature stress on maize during the seedling stage has not been precisely explored. Therefore, studying the effects of various temperature and light conditions on maize physiological information is of great significance for precise management and control of maize growth conditions, and it is crucial for promoting crop growth, improving yield, and enhancing quality.
Visible–near-infrared (VIS–NIR) spectroscopy, due to its non-destructive, rapid, and accuracy advantages, has been applied in various fields [10]. Xiao-Gang Jiang [11] and others collected a large amount of spectral data from apples of different sizes using an online near-infrared spectroscopy detection device and established a mathematical model reflecting the relationship between apple diameter and sugar content. The results showed that the model built after optimizing the general model significantly improved prediction accuracy, reducing the prediction error, with the correlation coefficient (Rp) rising from 0.805 to 0.943, and the root mean square error of prediction (RMSEP) decreasing from 0.778 to 0.480. Yu-Jie Lu [12] combined near-infrared spectroscopy technology with extreme learning machine (ELM) algorithms to successfully construct a novel model for classifying wheat grain insect infestation, which could quickly and accurately identify wheat insect infections. Visible–near-infrared hyperspectral imaging technology in conjunction with MSC + CARS + PLSR optimal algorithms was used to achieve accurate prediction of pH values in silage corn feed [13]. Hyperspectral technology was used to invert the physiological information of soybeans, determining that MSC + FD + S-G + PLS and SNV + SD + S-G + PLS methods could be used to predict the chlorophyll content and net photosynthetic rate of soybean leaves, respectively [14]. Combined with HETTA [15] and other near-infrared spectroscopy technologies, the feed quality, morphology and agronomic traits were analyzed using a partial least-squares regression (partial least squares regression, PLSR) model. The dual-channel common spectral method was proposed by Liang Xin [16]; taking the apple soluble solid content as the object, he built a dual-channel platform to optimize the spectral signal acquisition parameters, collected spectral data through a dual-channel and single-channel, and conducted PLSR modeling after pre-processing and feature extraction. The results show that the specific combination in the double-channel method achieves good results in different bands, and there are corresponding good results in the single-channel method. Jia-Cong Li and others [17] used visible–near-infrared hyperspectral imaging technology to accurately detect ash content in wheat flour, establishing prediction models based on partial least squares regression (PLSR) and deep extreme learning machine (DELM) for wheat flour ash content. The study proved that standard normal variate (SNV) is the best spectral preprocessing method.
This study, based on visible–near-infrared spectroscopy technology, conducted single-factor and light–temperature dual-factor stress experiments under eight light–temperature stress environments, non-destructively obtaining the physiological parameters and corresponding spectral data of maize seedlings. The research explored the response patterns of maize leaf physiological parameters and spectral characteristics to light–temperature stress, extracted spectral sensitive bands, and established an inversion model for leaf physiological parameters using visible–near-infrared spectroscopy. The aim is to more effectively monitor crop environmental stress and provide theoretical support for the sustainable development of high-yield and high-quality maize.

2. Materials and Methods

2.1. Experimental Materials and Methods

The experiment was conducted in a sunlight greenhouse at Jilin University (44°50′ N, 125°18′ E, with an elevation of 150 m). The maize seed variety used was Zhengdan 958, and the plants were grown using the potting method. During the experiment, seeds that were full and of uniform size were selected for planting. These seeds were placed in peat-based seedling substrates that had been pre-soaked in water, ensuring an appropriate moisture level to promote germination. Once the maize seedlings emerged and grew to the two-leaf one-heart stage, they were transplanted. The pots used in the experiment were plastic pots with dimensions of 50 × 20 × 15 (cm3), and the soil was a mixture of granular compound fertilizer and nutrient soil. Only one maize seedling was transplanted into each pot. After transplantation, standard water and fertilizer management practices were implemented to ensure good soil aeration and moderate moisture levels. The soil for leafy vegetable growth has an organic matter content of 12.44 g/kg, total nitrogen content of 0.625 g/kg, available phosphorus of 0.005 g/kg, and available potassium of 0.17 g/kg. Once the plants reached the five-leaf one-heart stage, they were transferred to an artificial intelligence climate chamber for subsequent experimental research.
The maize seedling photothermal experiment consists of both single-factor experiments and photothermal coupling two-factor experiments, with maize plants grown naturally in the greenhouse as the control group (CK). The light intensity was set to 10,000 lux, and the average daily temperature was maintained around 20 °C. A total of eight photothermal experimental environments were set for the treatment groups, numbered A1 to A8. In the ecosystem, light intensity and temperature are the key environmental factors that affect plant growth, distribution and community structure. Light temperature stress simulated by a light intensity and temperature system is of great ecological significance. Low light intensity, such as 4400 lux, is similar to the light level in understory or shady environment [18]. Under this condition, plant photosynthesis is limited, so, to adapt to the low-light environment, plants tend to increase their leaf area and reduce leaf thickness to capture more light energy, and, at the same time, change their photosynthetic pigment composition, and improve the relative content of chlorophyll b to enhance the absorption of blue purple light, where the survival of ecosystem survival and community vertical layered structure has an important role. High light intensity, such as at 22,000 lux, simulates the open habitat with direct light, beyond the many light saturation points of plants, causes photoinhibition, affects the photosynthetic efficiency and growth and development of plants, and then affects the distribution and competition of plant species in the ecosystem.
From the perspective of agricultural production, light and temperature stress conditions are closely related to the yield and quality of crops. At the intensity of 4400 lux, some light-loving crops, such as corn and cotton, may reduce the accumulation of photosynthesis products due to insufficient light, affecting plant growth and fruit development, and ultimately reduce the yield [19]. For some vegetable crops such as tomatoes, suitable light intensity range can promote photosynthesis and dry matter accumulation and improve sugar content and the taste quality of fruit; but for some crops sensitive to light intensity, light oxidative damage may affect crop health. High-temperature stress will accelerate the fertility process of crops, shorten the growth period, lead to insufficient grain filling, and reduce the grain weight and yield of grain crops. In the heading and filling period of rice, too high of a temperature will enhance the respiration of rice, consume excessive photosynthates, affect the activity of enzymes, hinder starch synthesis and reduce rice quality. Low-temperature stress may lead to cold or freezing damage to crops, affect the fluidity and stability of the cell membrane, destroy the cell structure, block the growth of crops, and even lead to the death of plants in serious cases.
The single-factor light intensity conditions in this experiment were mainly focused on weak light, with light intensity stress set at 4400 lux and 22,000 lux for the light intensity factor, and 8800 lux [20] for the temperature stress factor. For the photothermal coupling experiment, the light intensities were set to 12,000 lux and 22,000 lux, with light stress durations of 24 h and 48 h. Since the high-temperature stress threshold for maize during the seedling to tasseling stage is 33 °C [21], a temperature of 34 °C was set as the high-temperature condition for the experiment. The conditions for each group are shown in Table 1. Each control group and treatment group consisted of 12 maize plants as experimental samples, and the humidity conditions [22] were uniformly set to 60%.

2.2. Experiment Data Collection and Processing

The experiment was conducted from 9:00 to 13:00 on clear, cloudless days. Spectral data and photosynthetic physiological information of maize seedlings were collected synchronously. The measurement sites were the same locations on the fully expanded third and fourth leaves of the maize plants. Spectral data were measured using a field spectrometer (Field Spec Hand Held 2, Analytical Spectral Devices, Longmont, CO, USA), with a measurement range of 325–1075 nm, a sampling interval of 1.4 nm, and a resolution of 3 nm @ 700 nm. The spectrometer probe tip at the blade surface was pointed to ensure stable coupling between the light source and the sample and to reduce external optical interference. During the operation, attention was paid to the contact angle and pressure between the probe and the blade surface to avoid damage to the blade and ensure the accuracy of measurement. The middle position of the leaves was preferentially selected to avoid the veins. Here, the leaf structure is relatively uniform and less affected by the veins, which can better represent the overall spectral characteristics of the leaves. To improve the reliability of the measurement results, the measurement can also be deployed in multiple parts of the blade. To ensure that the surface light is uniform and improve the accuracy, the same sample measurements were used.
Net photosynthetic rate (Pn, μmol·m−2·s−1) was measured with a photosynthesis meter (LI-6400XT, LI-COR, Lincoln, NE, USA), and chlorophyll content (SPAD value) was determined using a chlorophyll meter (SPAD-502, KONICA MINOLTA, Chiyoda, Japan). In each measurement, the leaf chamber should be fully open to expand the leaves naturally and avoid the leaf veins. The leaves should be smoothly clamped at the center of the mesophyll of the leaf veins. When the parameters are basically stable, the measurement data should be saved with the key being to obtain the observation index of photosynthetic physiological information of the leaves.
All data were averaged from three repeated measurements, and data processing and analysis were conducted using AvaSoft 7.8, Origin 9.0, and SPSS 26.0.

3. Results and Discussion

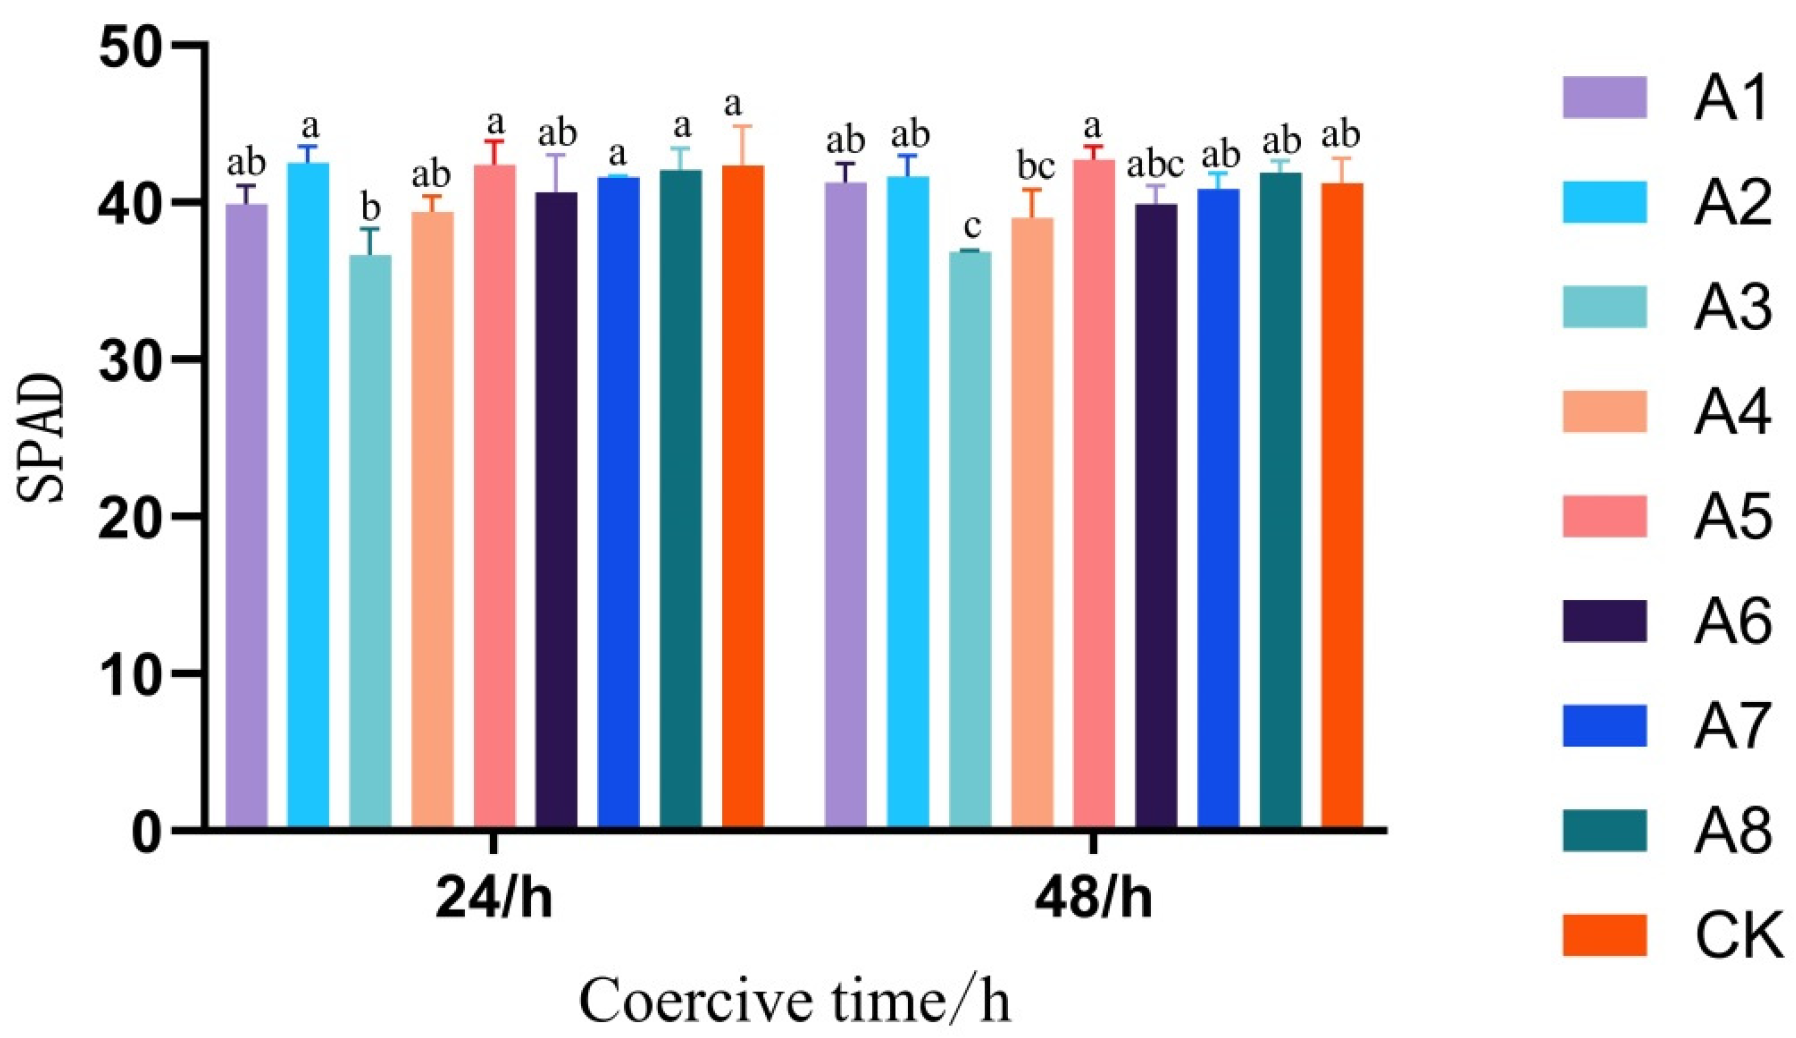
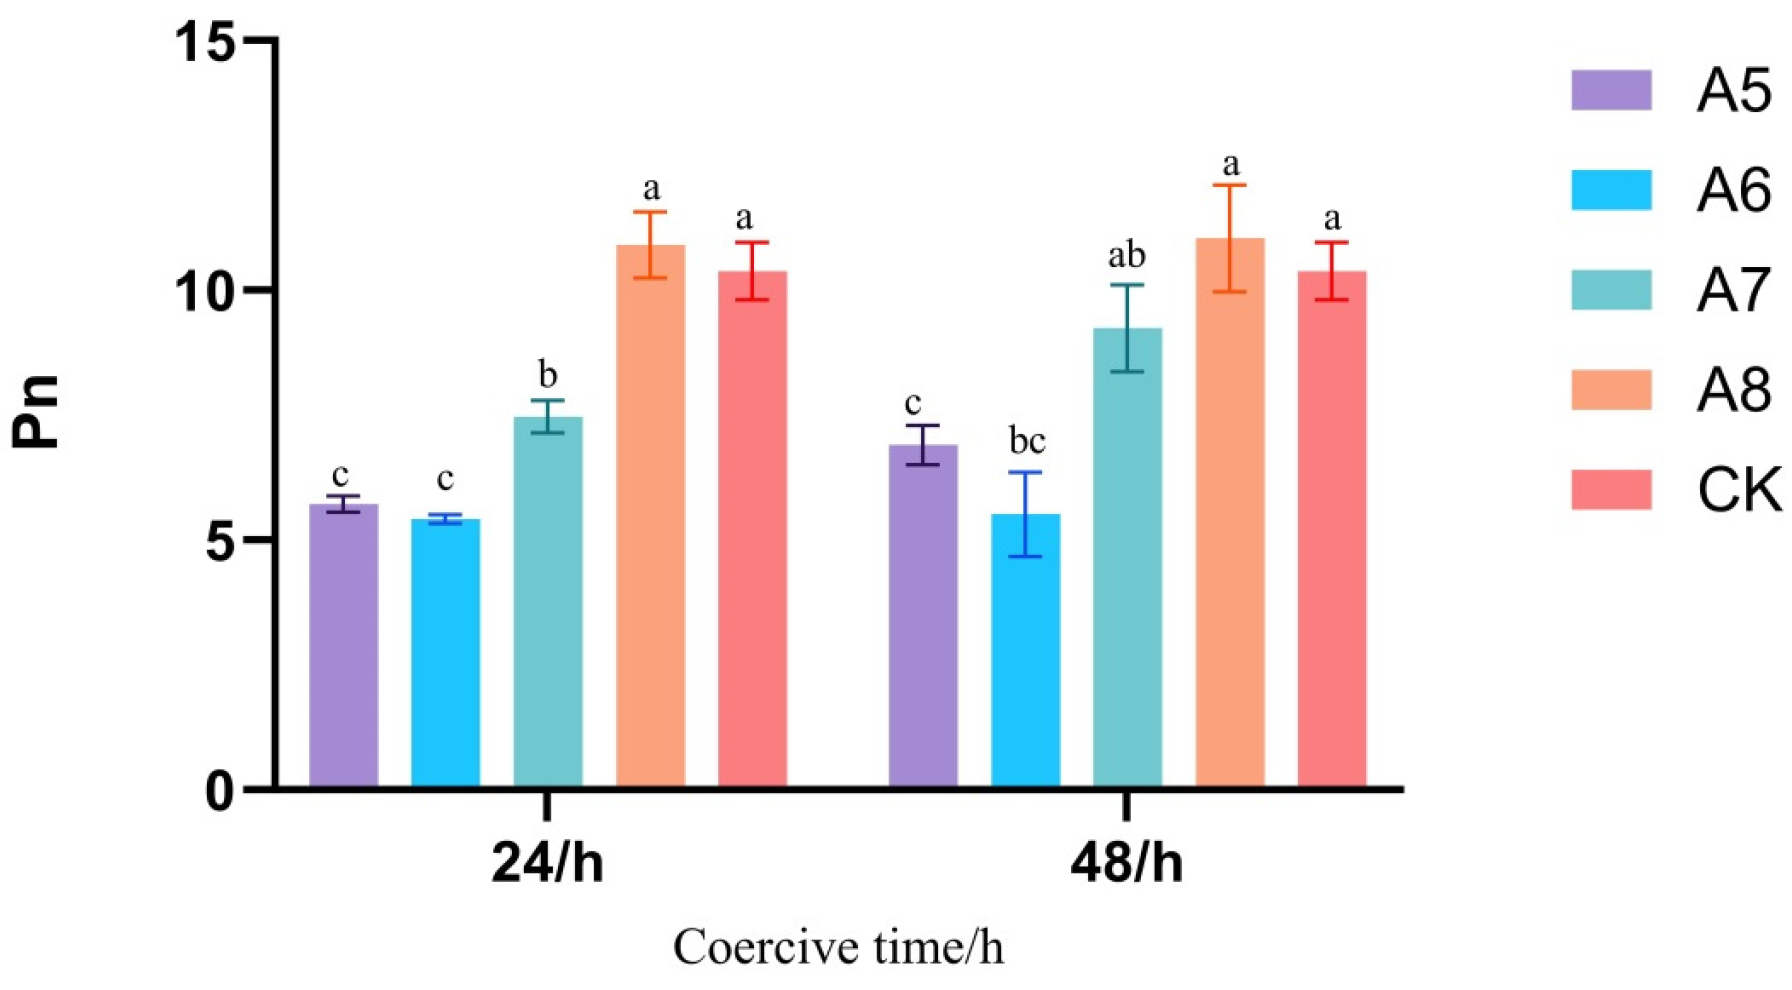
3.1. Response of Maize Leaf Physiological Parameters to Different Light and Temperature Environments

Chlorophyll, as the core pigment component in leaves, is responsible for capturing light energy and converting it into chemical energy during photosynthesis. Its content is an important indicator for assessing plant photosynthetic efficiency and responding to environmental stress [23] and it plays a crucial role in the real-time monitoring of crop growth status and yield prediction [24]. The response of maize leaf SPAD values to different light and temperature environments is shown in Figure 1. The results indicate that in the single-factor experiment, the SPAD values of the leaves exhibited small variations among the treatment groups. In the two-factor experiment, under 24-h stress, the light–temperature treatment groups A6 and A7 had lower SPAD values, 40.6417 and 41.6083, respectively, with an increase of 23.78%. Under 48-h stress, the SPAD values of treatment groups A6 and A7 were 39.9056 and 40.8417, respectively, with an increase of 23.46%. In the environment of high temperature invasion, the molecular structure of chlorophyll in plants will be degraded, and the orderly arrangement will be disrupted, resulting in the loss of the original stability and functionality of chlorophyll. Chlorophyll is a key pigment of photosynthesis. High temperature destroys the porphyrin ring and the chemical bond with the protein, resulting in the distortion and fracture of the molecular structure, and the decrease in the relative content, reduced chlorophyll and reduced chloroplast ability to absorb light energy. The number of chlorophyll–protein complexes on the thylakoid membrane decreases, the photosystem I and function are blocked, it is difficult for light energy to effectively convert into chemical energy, the light reaction of photosynthesis is inhibited, the ATP and NADPH produced are insufficient to meet the needs of dark reaction, and the photosynthesis ability of leaves is weakened. Corn has high dependence on photosynthesis, reduced photosynthesis products, which restricts its growth, short plants, yellow leaves and slow growth, which seriously affect its yield and quality [25].
Net photosynthetic rate is a key indicator for evaluating the photosynthetic efficiency of vegetation. The response of maize leaf Pn values to different light and temperature environments is shown in Figure 2. The results indicate that under different stress durations, treatment group A8 consistently had the highest Pn. After 24 h of stress, the Pn value for treatment group A8 was 10.9059 μmol·m−2·s−1, and after 48 h of stress, the Pn value was 11.0419 μmol·m−2·s−1, an increase of 6.37%. Treatment group A6 had the lowest Pn value, at 5.4220 μmol·m−2·s−1. In the same treatment environment, the net photosynthetic rate of the leaves did not show significant changes as stress duration increased. Under the same light intensity, the Pn value of the leaves decreased with increasing temperature. Compared to treatment group A8, the net photosynthetic rate of treatment groups A5 and A6 significantly decreased (p < 0.05). This is because high temperatures damage the chloroplasts and cytoplasm structures in the leaves. Chloroplasts are the main sites for photosynthesis, and damage to their structure directly affects the efficiency of photosynthesis. Additionally, high temperatures also cause enzyme inactivation within the chloroplasts [26]. Enzymes are key substances that catalyze biochemical reactions, and their reduced activity decreases the reaction rates of related processes in photosynthesis, thereby affecting the net photosynthetic rate. On the other hand, weak light may have inhibited the photosynthetic process in the leaves to some extent [27]. Photosynthesis is the process in which plants convert inorganic substances into organic compounds using light energy, and light is the essential energy source for this process [28]. When light intensity weakens, the amount of light energy that plants can capture decreases, leading to a reduction in photosynthesis and a decrease in the net photosynthetic rate.

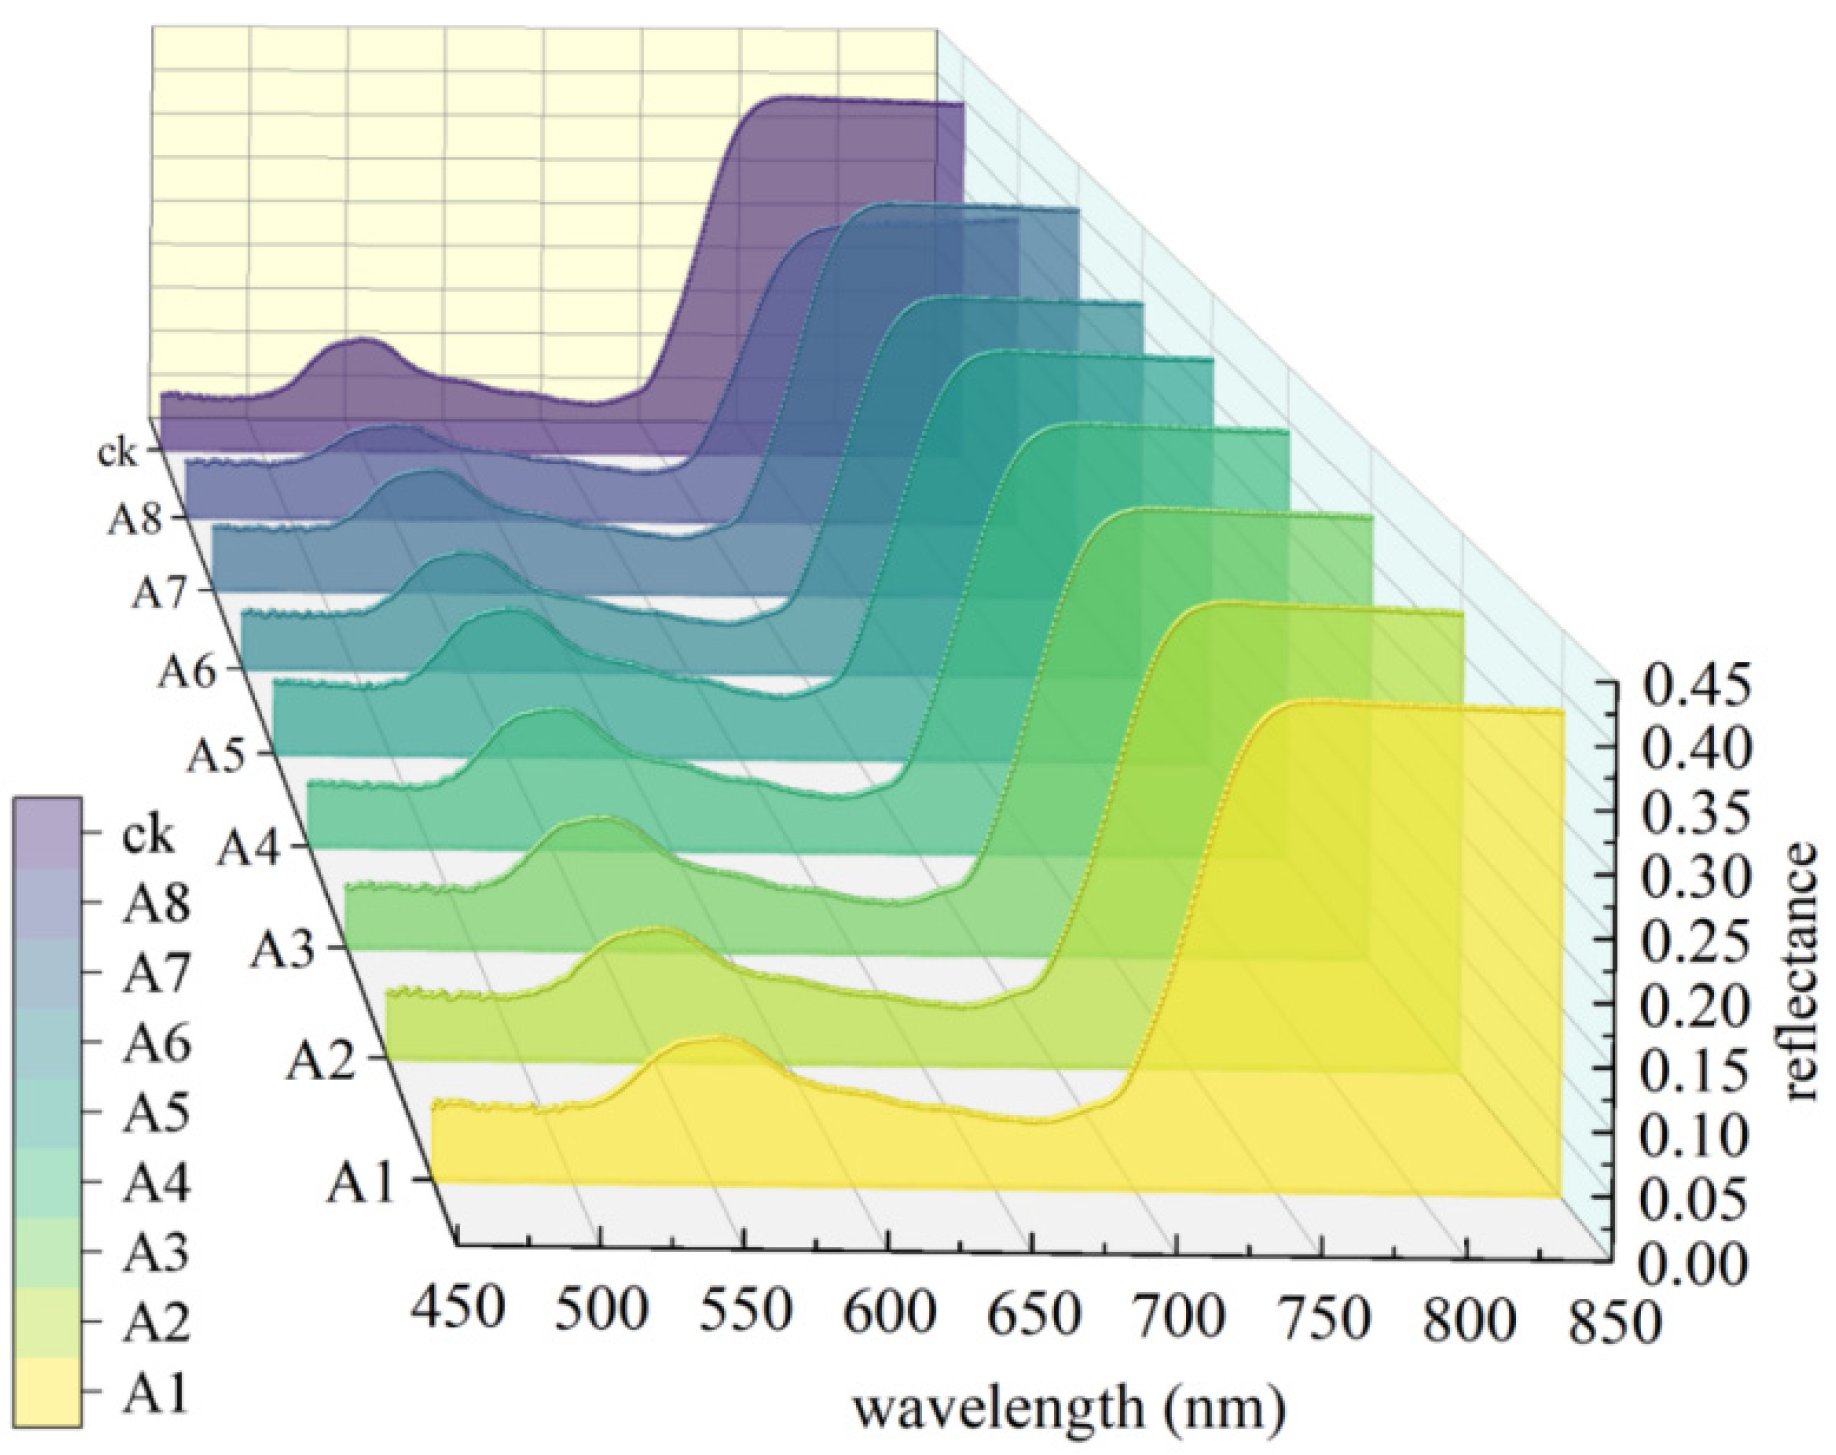
3.2. Spectral Characteristics of Maize Leaves in Visible and Near-Infrared Regions Under Different Light–Temperature Environments

The visible–near-infrared spectrum of maize leaves reveals their spectral characteristics in the visible light (380–780 nm) and near-infrared (780–2500 nm) regions. These characteristics are closely related to leaf chlorophyll content, water content, cell structure, as well as nutritional status and pest conditions. The changes in the visible–near-infrared spectral characteristics of maize leaves under light–temperature stress conditions are shown in Figure 3. It can be seen that under different light–temperature stress conditions [29], the spectral changes in maize leaves exhibit consistent patterns. Specifically, in the visible light region of 520–600 nm, a significant reflection peak appears at 550 nm, known as the “green peak”. In the 630–690 nm range, a reflection trough appears at 680 nm, known as the “red valley”. When entering the near-infrared region of 700–900 nm, the spectral reflectance rapidly increases and eventually levels off to a stable reflection plateau.
However, differences in light–temperature environments had a significant impact on the spectral characteristics. In the green light range of 520–600 nm, the light–temperature treatment group A7 exhibited higher reflectance, which can be attributed to the close relationship between the reflectance of maize leaves in the 500–700 nm wavelength band and their chlorophyll content. The spectral reflectance increases with the increase in light intensity [30]. Light–temperature stress can damage the chloroplast membrane, alter the grana structure, and thus affect chlorophyll synthesis, leading to a decrease in chlorophyll content in the leaves, which in turn increases the spectral reflectance. In this light–temperature coupled environment, visible and near-infrared spectra show high sensitivity to changes in light intensity. On the other hand, in the 700–900 nm wavelength range, the spectral reflectance increases with temperature. The reflectance of light–temperature treatment group A6 is relatively higher. In the 760–900 nm range, the CK group has higher spectral reflectance than the weak-light stress treatment group but lower than the high-temperature stress treatment group. This is because the reflectance of maize leaves is mainly influenced by their internal structure, and high temperatures can damage the internal structure of the leaves, reducing light absorption and increasing reflectance.

3.3. Establishment of the SPAD and Net Photosynthetic Rate Inversion Model for Maize Leaves

3.3.1. Selection of Sensitive Bands

The correlation analysis method calculates the correlation coefficient between the spectral values at each wavelength and the chlorophyll content. The larger the absolute value of the coefficient, the more likely the wavelength is to be selected as a characteristic wavelength. By combining the wavelength with the corresponding correlation coefficient, a wavelength–correlation coefficient graph is created to select sensitive bands. Under different light–temperature treatment conditions (A1–A8), the correlation between maize leaf chlorophyll content data and corresponding spectral data was analyzed, as shown in Figure 4. The analysis results indicate that, within the full spectral range, there is a significant correlation between chlorophyll content and spectral data. The threshold for the correlation of maize leaf reflectance spectra with chlorophyll content at a significance level of 0.05 is −0.4. The wavelength range with an absolute correlation coefficient greater than 0.40 (p < 0.05) is focused on two bands: 519–583 nm and 703–730 nm. Wavelengths below the threshold line are selected as characteristic wavelengths. A total of 93 characteristic wavelength variables were selected, and 658 variables were excluded. The selected variables account for 12.38% of the full spectrum, greatly improving the utilization of spectral data. The sensitive band in the wavelength range of 519–583 nm is closely related to plant cell structure and some photosynthetic pigments. This band is sensitive to the morphology and arrangement of chloroplasts, as a key organelle of photosynthesis, the stacking degree and arrangement of the internal thylakoid membrane can affect light absorption and scattering. When the cell structure is changed due to environmental stress or physiological state, the spectral signal changes accordingly in this wavelength range. At the same time, auxiliary pigments such as lutein have specific absorption characteristics in this band. Lutein can assist chlorophyll in absorbing light energy and dissipate the excess light energy through the lutein cycle under strong light conditions to protect the photosynthetic mechanism from photooxidative damage.
The 703–730 nm sensitive band is highly correlated with the absorption characteristics of chlorophyll A, which is the core light pigment in photosynthesis and has obvious absorption peaks in the red-light area (about 680 nm) and the far-red light area (700–750 nm). A range of 703–730 nm is just within the range of far-red light absorption peak of chlorophyll A, and the change of spectral signal in this band can accurately reflect the fluctuation of chlorophyll A content. Chlorophyll A content directly affects the capture efficiency of light energy and the photochemical reaction rate, which is an important measure of plant photosynthetic capacity. In addition, the sensitive band may be affected by other organelles, such as intracellular vacuoles, because the material composition and concentration changes in the vacuole can change the refractive index of the cell, which has an indirect effect on the propagation and absorption of light in this band.
Based on this, the 519–583 nm and 703–730 nm bands were identified as sensitive spectral bands closely related to chlorophyll content.
The hyperspectral reflectance of maize leaves at different net photosynthetic rates is shown in Figure 5. The results indicate that there are differences in the net photosynthetic efficiency of maize leaves under different light–temperature treatment groups, and the spectral characteristics change accordingly. The spectral reflectance peaks at the 540–560 nm and 760–780 nm bands, while it reaches a trough at the 655–675 nm band. The reflectance changes in these bands are significant and identified as sensitive spectral bands closely related to the net photosynthetic rate. Within these sensitive bands, the wavelengths with the highest reflectance are 550 nm, 770 nm, and 665 nm, referred to as E550, E770, and E665, respectively. These wavelengths are selected as characteristic wavelengths for studying net photosynthetic rate. A total of 63 characteristic wavelength variables were selected, and 688 variables were excluded. The selected variables account for 9.16% of the full spectrum, effectively reducing the number of modeling variables and improving computational efficiency.

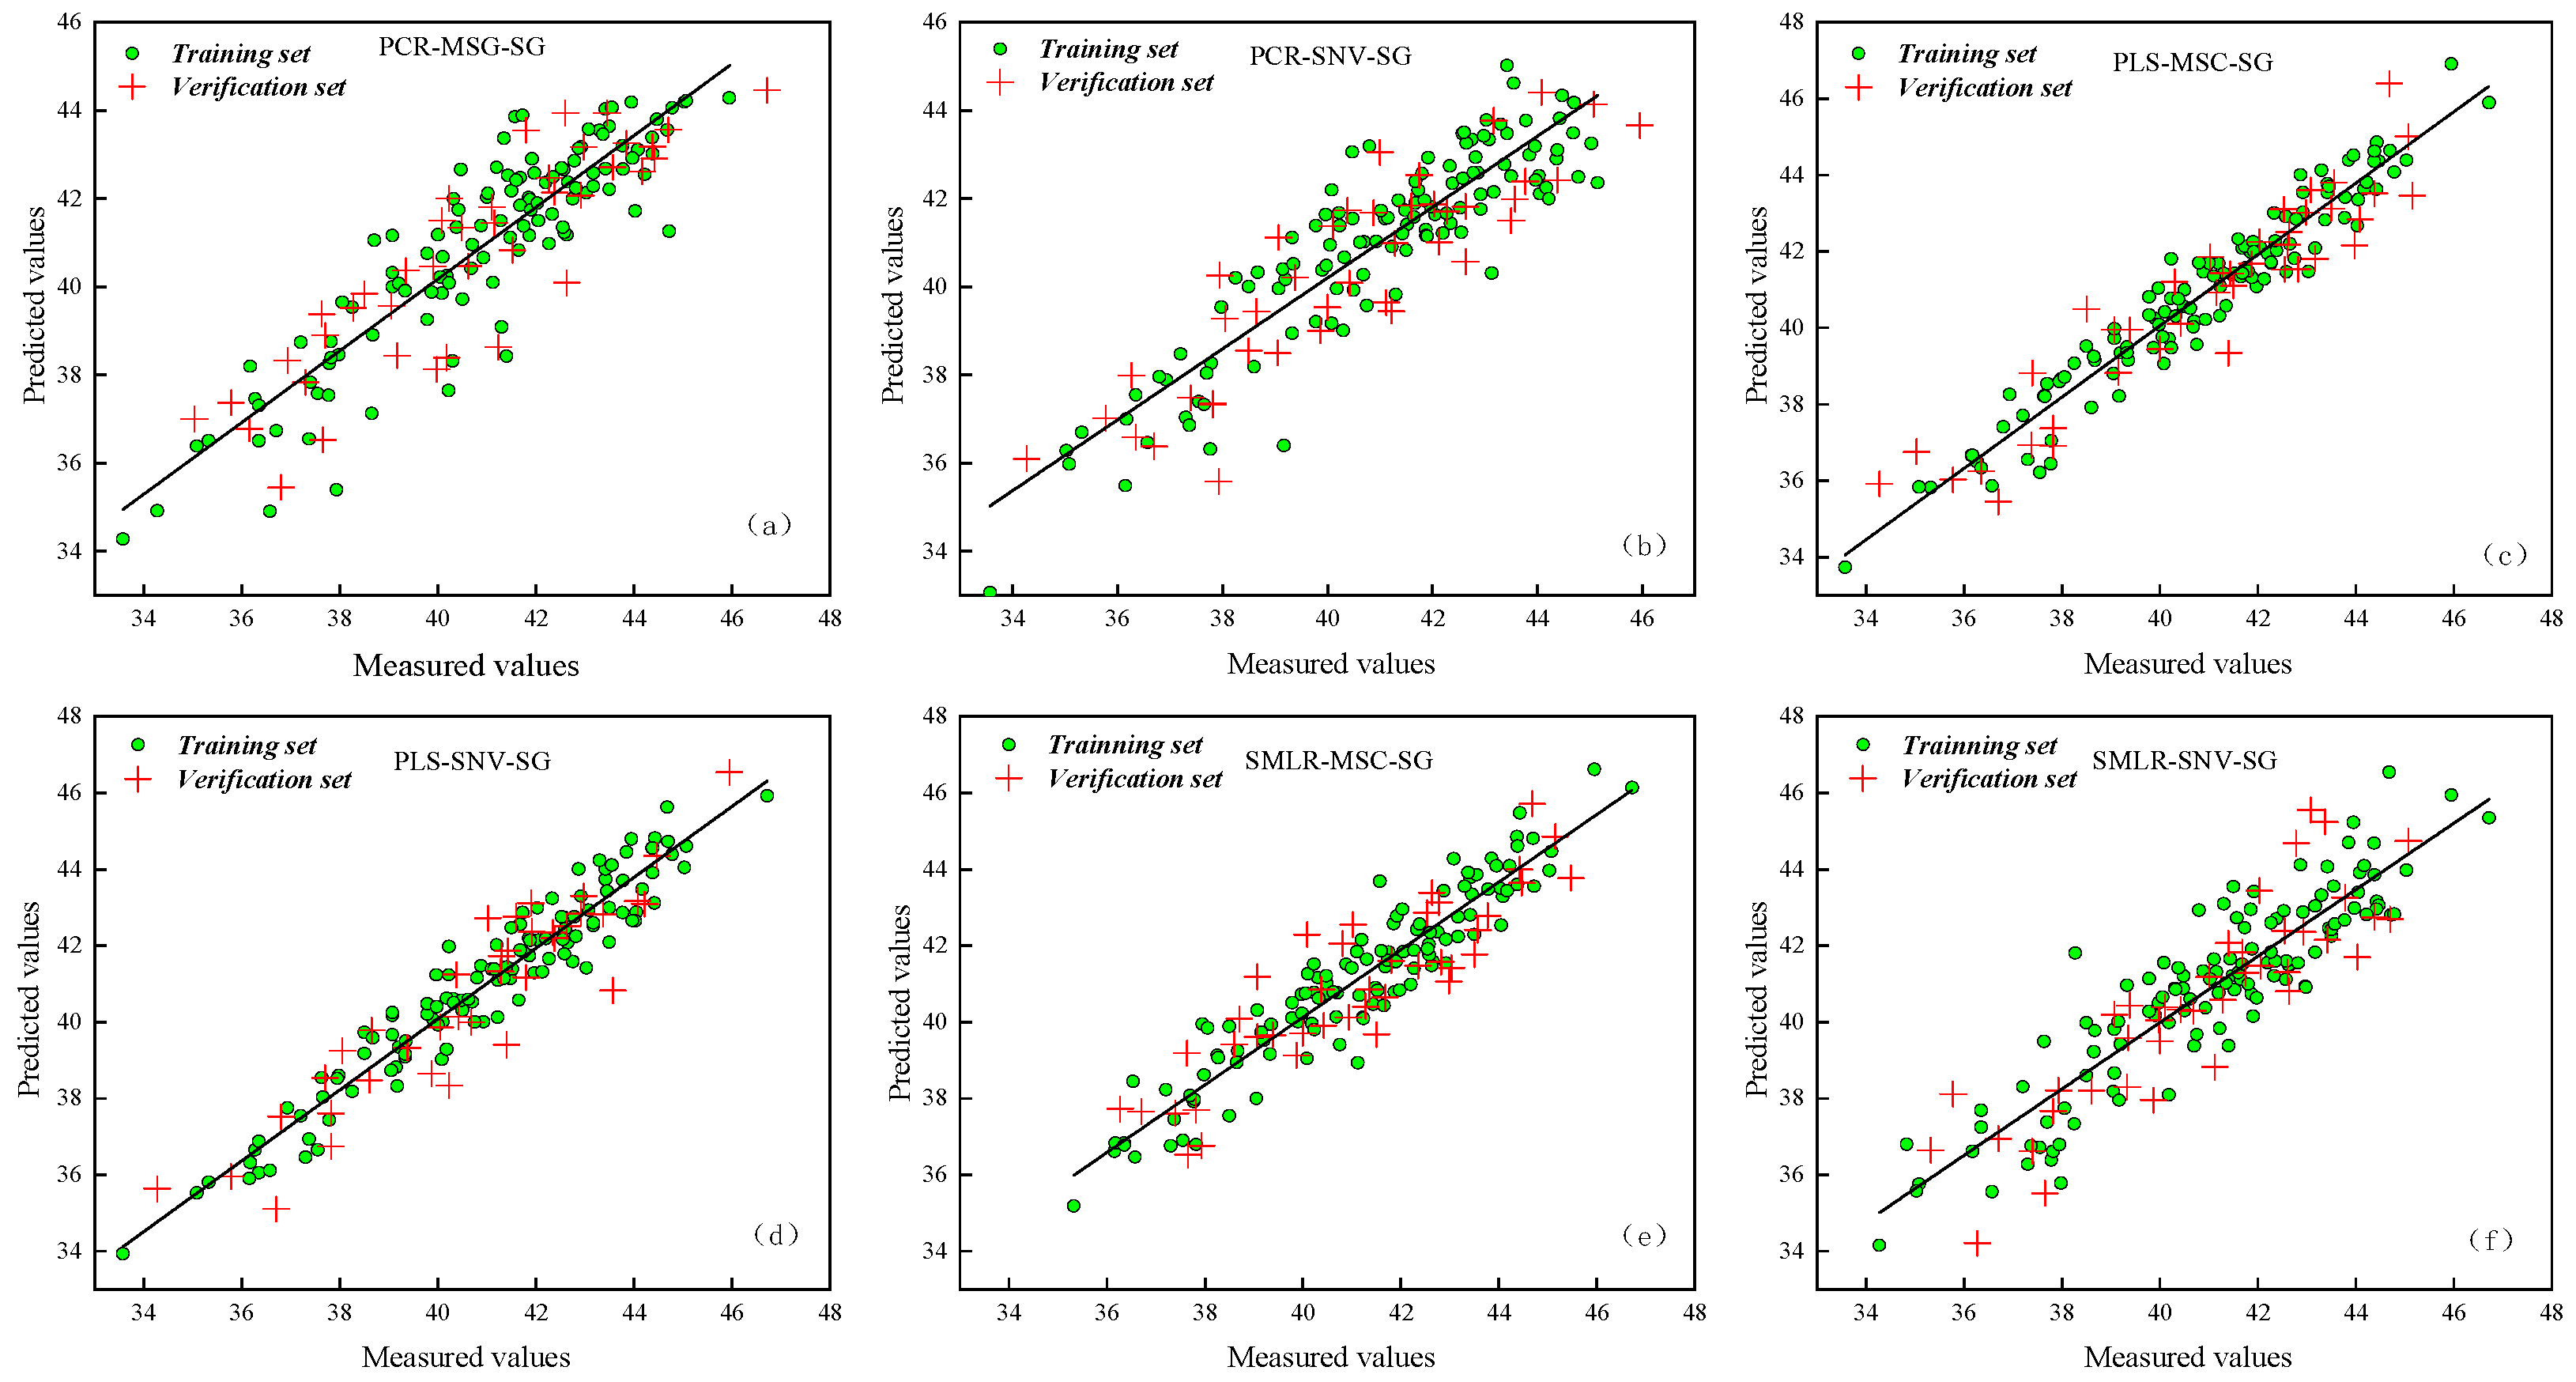
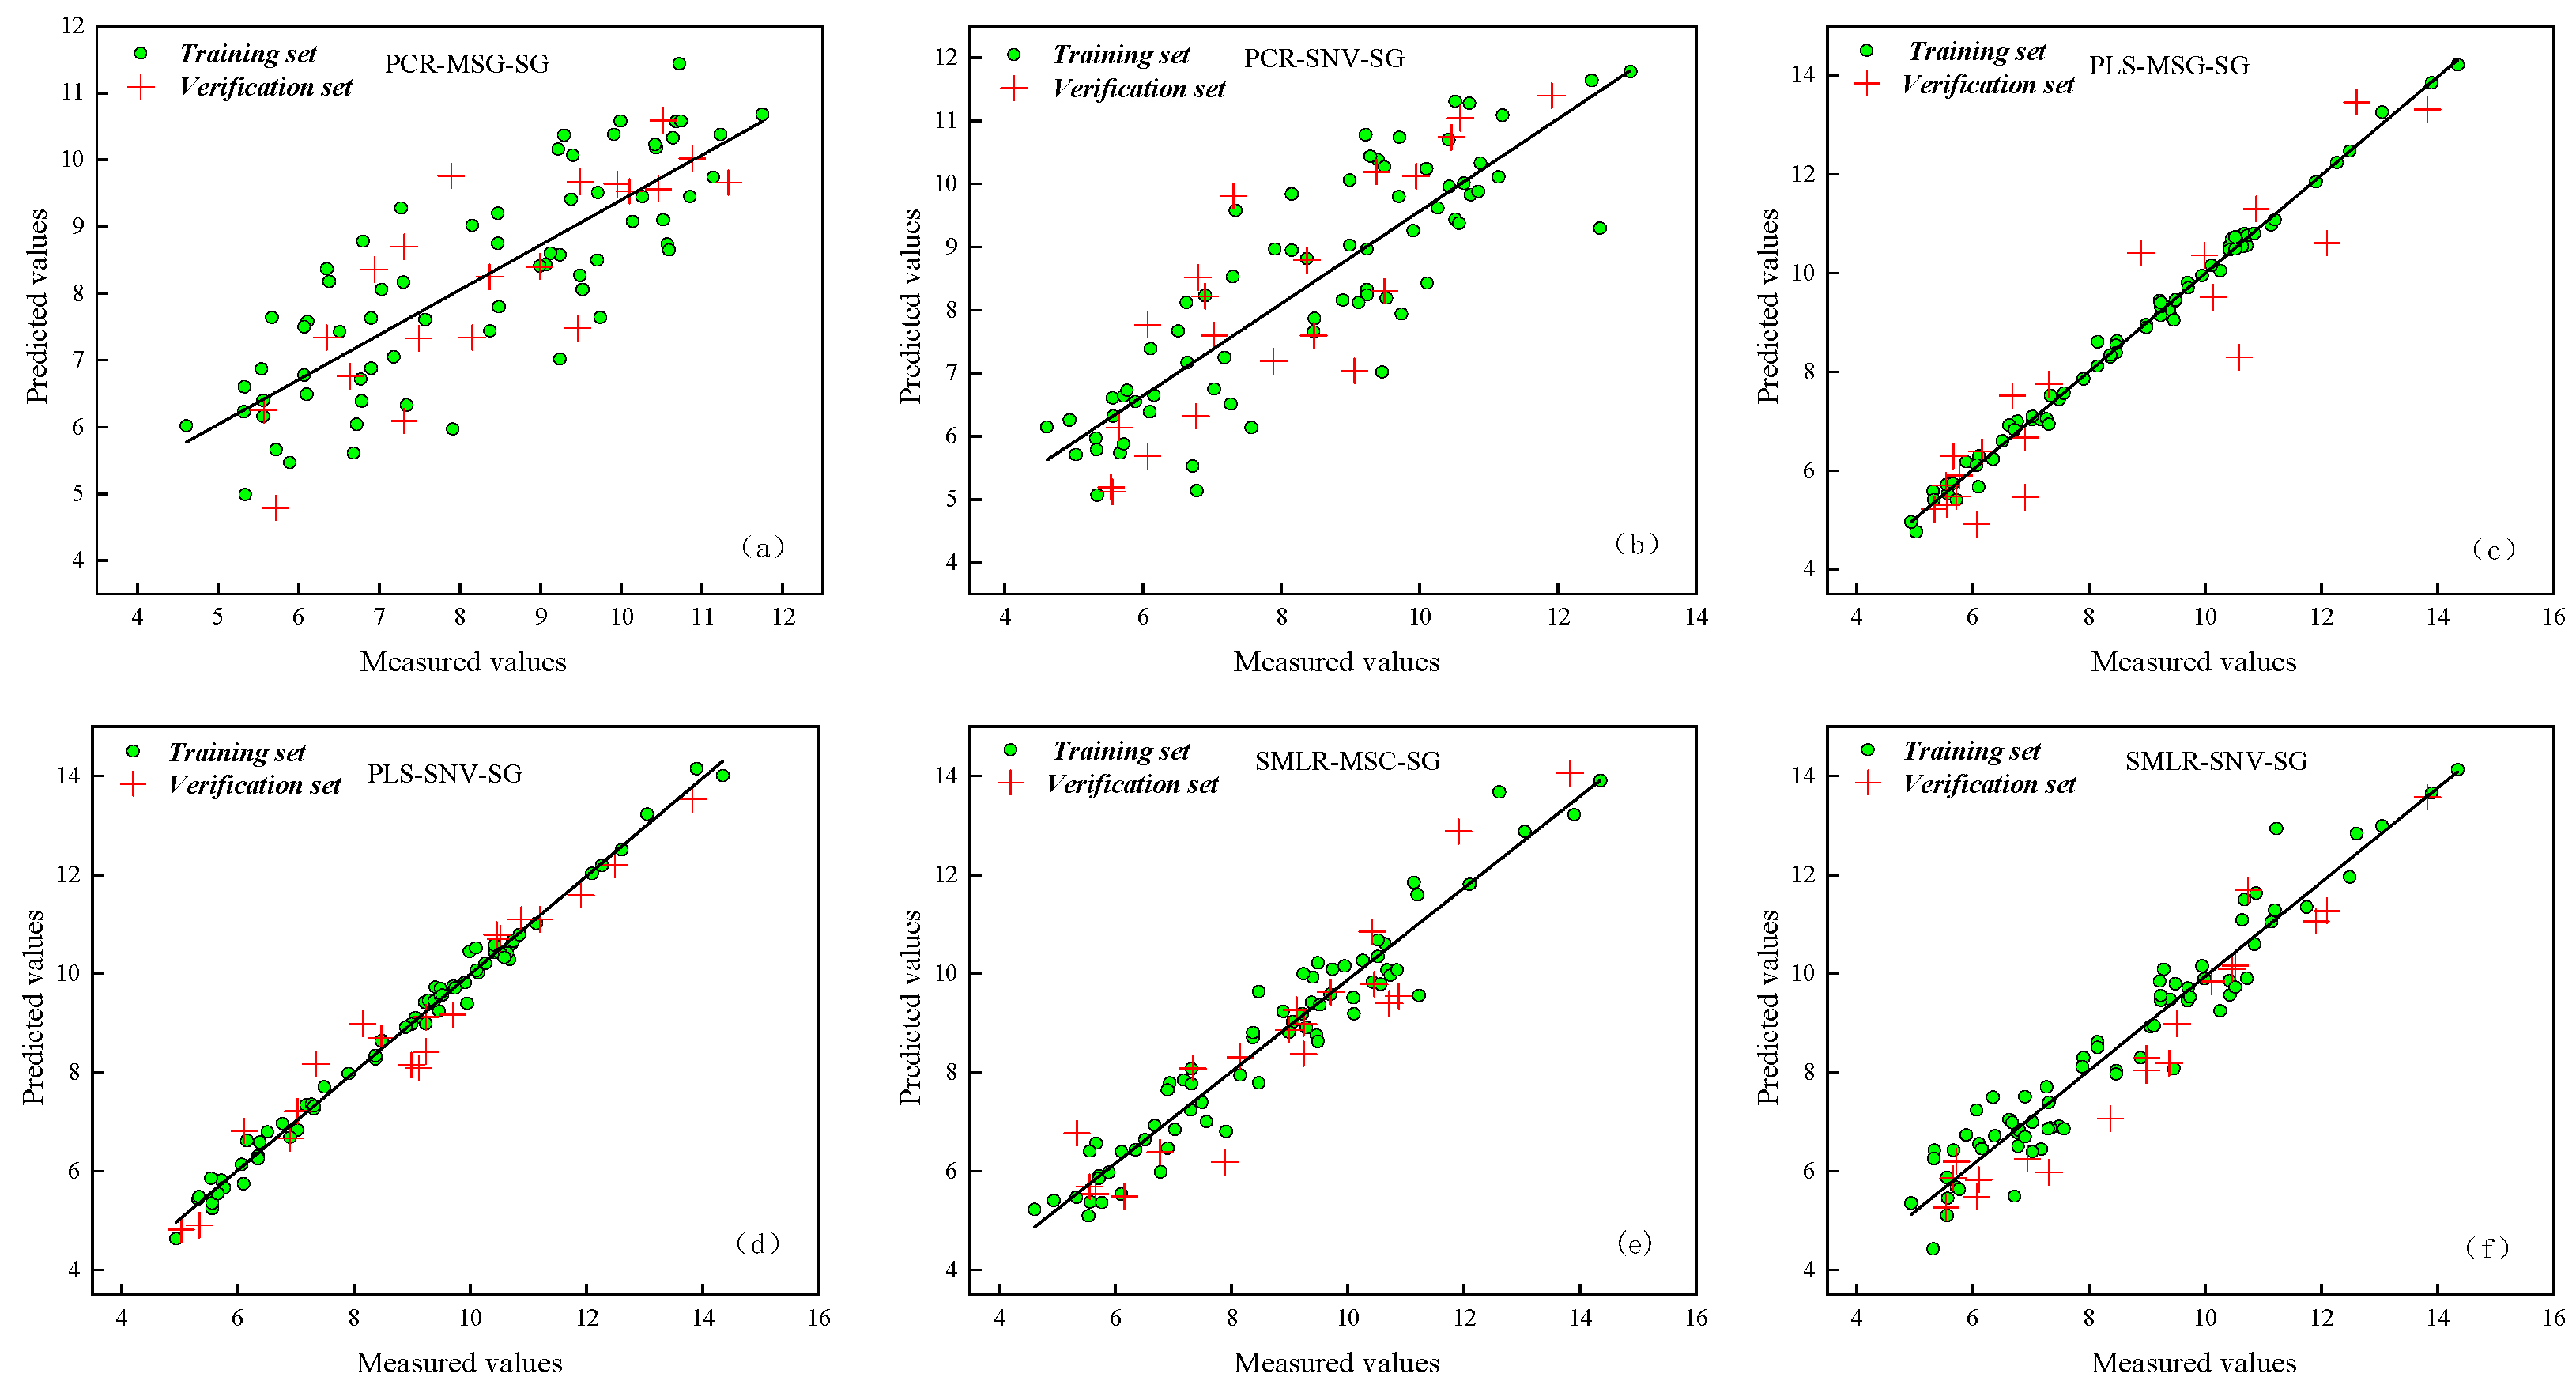
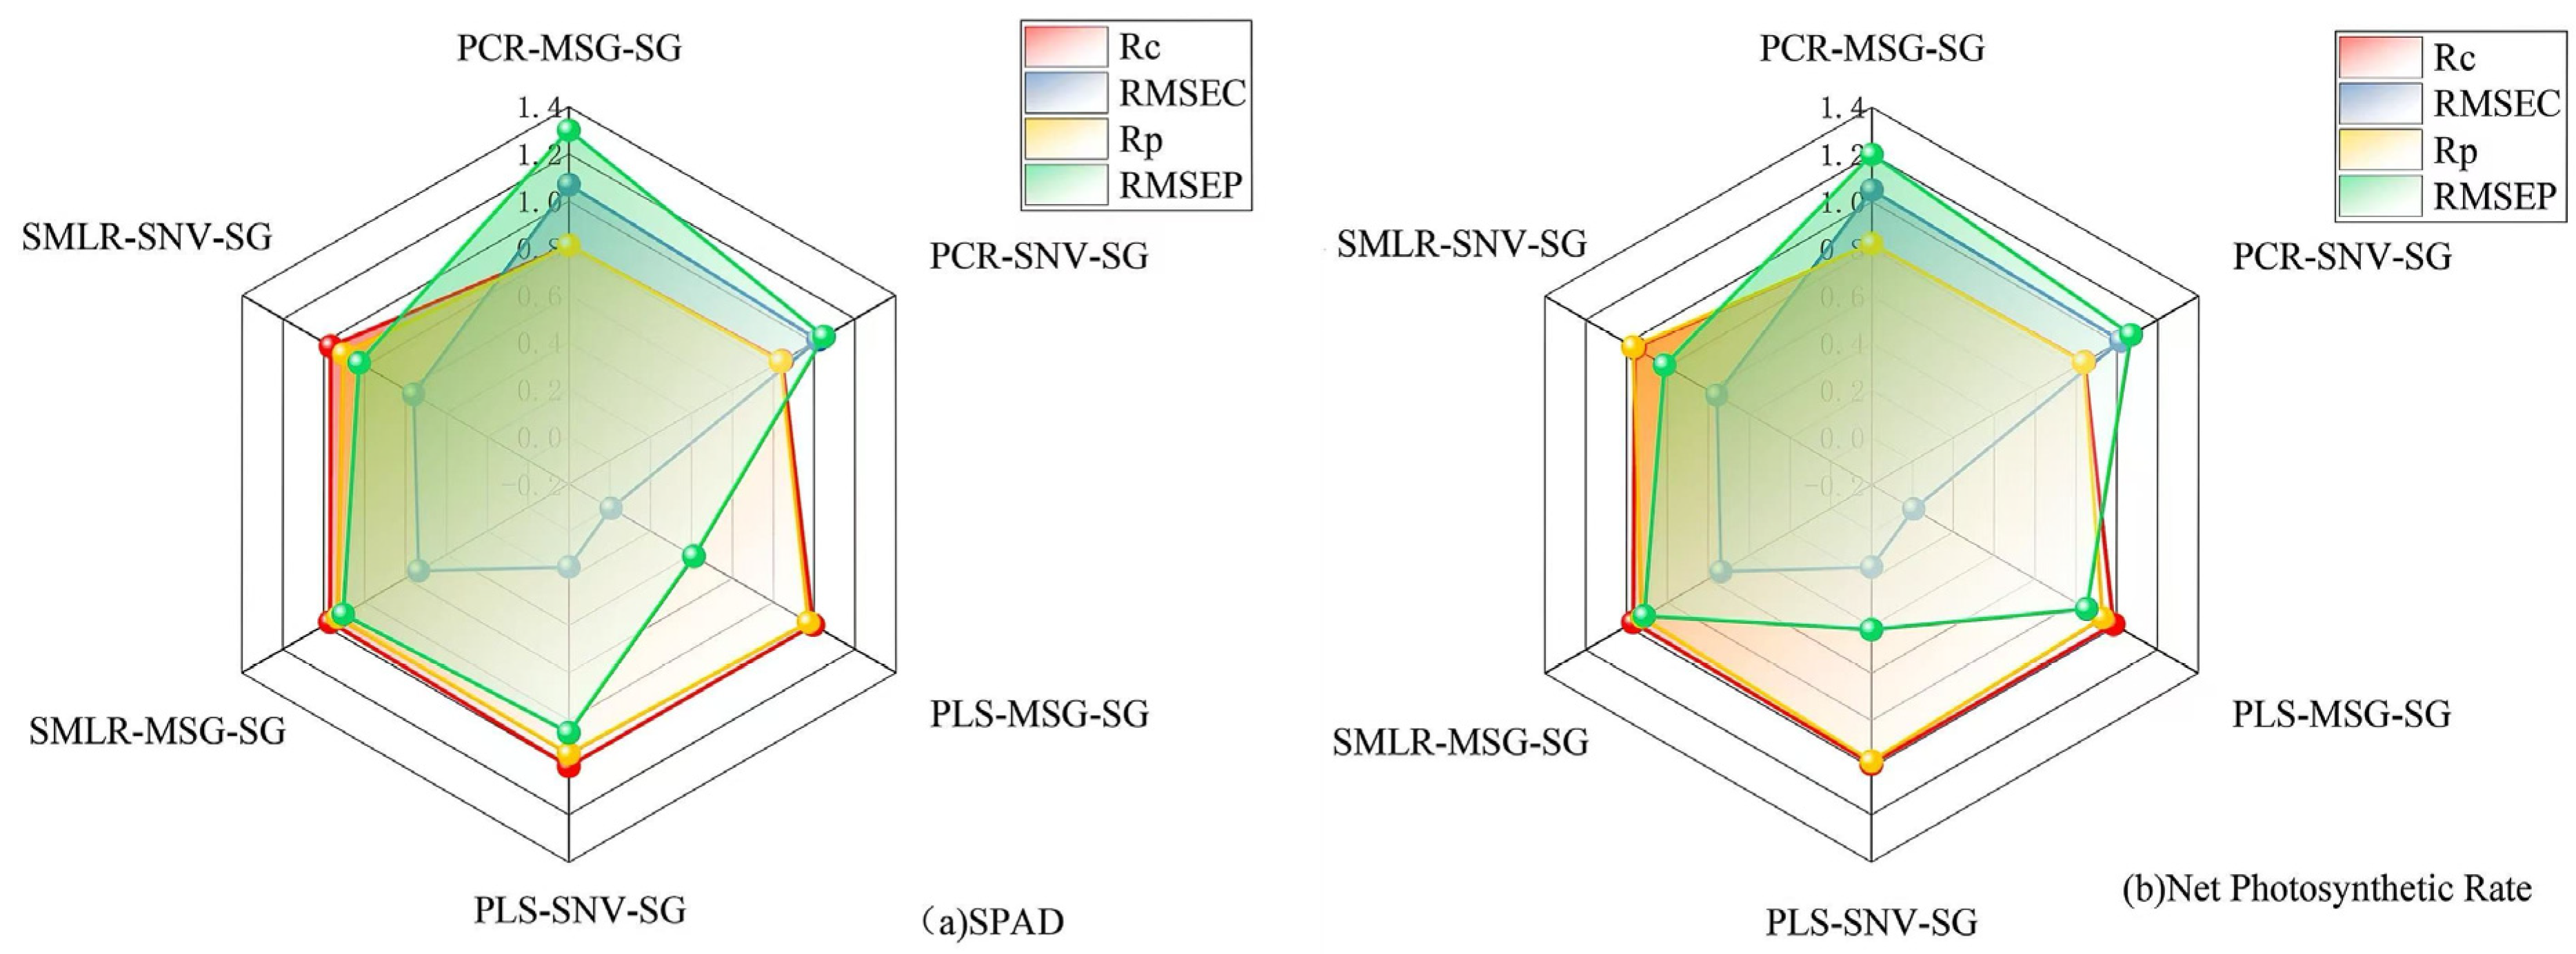
3.3.2. Establishment and Comparison of Physiological Information Inversion Models in Maize Leaves

The effective sample of this experiment was 180 corn leaves, and the validation set and training set samples were randomly divided according to a 1:3 ratio, including 135 as the model training set and 45 as the model validation set. Using six combined methods of spectral preprocessing and modeling, the spectral sensitive bands (519–583 nm and 703–730 nm) and characteristic wavelength data (E550, E770 and E665) were used as input quantities to construct the visible–NIR spectral inversion model of maize leaf SPAD value and net photosynthesis rate, respectively. Among them, the multiplicative scattering correction (MSC), standard normal variable transformation (SNV) and Savitzky–Golay (SG) were smoothed, and the modeling methods were partial least squares regression (PLS), principal component regression (PCR) and stepwise multiple linear regression (SMLR). The correlation of model predictions and actual measurements of maize leaf SPAD values and net photosynthetic rate were evaluated, respectively, and the results are shown in Figure 6 and Figure 7. The results show that, using the combination of six different spectral preprocessing and modeling, the coefficient of determination (R2) is greater than 0.8, which can reverse the physiological information of maize leaves to different degrees. In contrast, the correlation between the predicted and measured values of modeling by the PLS method is better than that of the PCR and SMLR methods, proving that the physiological information of maize leaves can be effectively predicted based on visible–near-infrared spectroscopy.
The correlation coefficients (Rc and Rp) and root mean square errors (RMSEC and RMSEP) of the training and validation sets were used as evaluation indicators for the maize leaf physiological information inversion models. The inversion results of the models using six combinations of spectral preprocessing and modeling methods are compared in Figure 8. The larger the correlation coefficient and the smaller the root mean square error, the better the model inversion effect for maize leaf physiological parameters. At this point, the corresponding combination method is considered the optimal inversion model combination.
The comparison of the maize leaf physiological information inversion model results is shown in Table 2. From Figure 8 and Table 2, it can be seen that the optimal combination method for constructing the SPAD value inversion model of maize leaves is PLS-MSC-SG, with a validation set correlation coefficient (Rp) of 0.9743 and a root mean square error of 0.413. MSC plays a key role in SPAD value inversion, and structural differences in plant leaves, such as cell arrangement and density of mesophyll tissue, can lead to light-scattering phenomena and interfere with spectral signals. MSC corrects the baseline drift and the spectral deformation caused by light scattering by constructing the reference spectrum. For the SPAD value inversion, the accurate reduction of the leaf pigment absorption spectral characteristics is the key. In chlorophyll, for example, its absorption peaks in a specific wavelength range, and scattering interference can obscure these features. After MSC removes the influence of scattering, the spectrum can more accurately reflect the internal connection between chlorophyll content and SPAD value, providing high quality data for the reliable model of partial least squares (PLS). The optimal combination method for constructing the net photosynthetic rate inversion model of maize leaves is PLS-SNV-SG, with a validation set correlation coefficient (Rp) of 0.9738 and a root mean square error (RMSEP) of 0.415. SNV has a significant advantage in the determination of net photosynthetic rate, and the physical differences in blade thickness, water content and surface state can fluctuate the spectral signal in intensity and baseline position. The SNV standardizes the spectrum by subtracting the mean from each spectral data point and dividing it by the standard deviation, eliminating the spectral changes due to differences in the physical properties of the leaves. The net photosynthetic rate is closely related to the efficiency of light energy capture and conversion by the leaf photosynthetic mechanism, with a specific response in the spectrum. After SNV eliminates physical interference, the spectrum can more clearly show the characteristics related to the photosynthetic efficiency, and assist PLS to accurately construct the net photosynthetic rate prediction model. The spectral signals of plant leaves are often disturbed by environmental factors and instrument noise, which may obscure the key chemical information.
Savitzky–Golay filtering (SG) is based on the polynomial fitting principle, which retains the chemical characteristic peaks of the spectrum to the maximum extent. For SPAD value inversion, the chemical composition and content changes of leaf pigment correspond to specific spectral absorption peaks. SG smoothing can enhance the identification of these peaks and help PLS to mine the chemical information related to the SPAD value. In the net photosynthetic rate determination, the photosynthetic process involves a series of chemical reactions whose subtle changes in the spectrum are easily overwhelmed by noise. SG treatment highlights the spectral features related to photosynthetic chemical reactions, improving the accuracy of PLS for model construction, so as to achieve accurate prediction of the net photosynthetic rate.
The research results will provide valuable reference for the inversion and prediction of physiological information in maize seedlings under unfavorable light and temperature conditions.

4. Conclusions

4.1. Main Conclusion

This study focuses on maize seedlings, measuring the visible–near-infrared spectra, chlorophyll content, and net photosynthetic rate of maize leaves under eight light–temperature stress conditions. Two spectral characteristic wavelength selection methods and six different spectral preprocessing and modeling combinations were applied to process the full-spectrum data based on spectral technology, establishing inversion models for the chlorophyll content and net photosynthetic rate of maize leaves. The results show that: (1) The spectral characteristics of maize leaves are influenced by different light and temperature conditions. In the wavelength range of 500–700 nm, the spectral reflectance of the leaves increases with the intensity of light; in the 760–900 nm wavelength range, the spectral reflectance increases with the temperature. (2) The spectral characteristic wavelength extraction method can effectively extract sensitive spectral information, improving the utilization of spectral data. (3) Based on visible–near-infrared spectroscopy, maize physiological information can be effectively inverted and predicted. PLS-MSC-SG is the optimal spectral combination method for the chlorophyll content inversion model of maize leaves, with an Rc value of 0.996 and an Rp value of 0.9743. PLS-SNV-SG is the optimal combination method for the net photosynthetic rate inversion model of maize leaves, with corresponding Rc and Rp values of 0.9848 and 0.9743, respectively.

4.2. Potential Technology Development Path

Farmers and agricultural technicians can use spectroscopic technology to monitor the growth of maize seedlings in real time, and by analyzing the spectral reflectance or transmission of maize seedlings, information can be obtained about the physiological state of the plant, such as chlorophyll content, water content and nutritional status of the plant. For example, a decrease in chlorophyll content may indicate nutrient deficiency or stress, which can be detected by changes in spectral characteristics in the red marginal region of the electromagnetic spectrum. When maize seedling growth is found to be abnormal, appropriate measures can be taken to adjust the environmental conditions, and if the seedlings show signs of heat stress, increasing irrigation can help cool the ground and decrease the temperature around the plant. In cases of cold stress, measures such as the use of coverslips to maintain heat can be taken. Spectroscopy can be used to assess the light conditions to which seedlings are exposed, and when the light intensity is too high, shade can be provided to protect seedlings from photoinhibition. Under low-light conditions, the illumination can be replenished to ensure adequate photosynthesis. Different pests and diseases cause characteristic changes in the spectral properties of maize plants, for example, when plants are attacked by fungal diseases, the affected areas may show altered spectral reflectance in the visible and near-infrared areas due to changes in plant cell structure, pigmentation and water content due to the disease. Insect pests can also be detected by spectroscopic analysis, and feeding damage caused by insects leads to changes in leaf spectral characteristics, such as increased reflectance at some wavelengths. By continuously monitoring spectral data from corn fields, farmers and technicians can detect early signs of pest outbreaks. This allows for timely interventions, such as using pesticides or fungicides in a targeted manner, which helps to reduce crop losses and reduce the use of excess chemicals, thereby promoting sustainable agriculture.
There are still many areas for improvement in the practical application of visible–near-infrared spectroscopy technology for the inversion of crop physiological information. For example, different crop varieties or the same variety under different growth conditions will inevitably show varying degrees of differences in energy absorption and photosynthetic capacity. As a result, their photosynthetic physiological information and spectral data will also differ, leading to the need for a large amount of data for modeling calculations in order to reduce the impact of these differences during the inversion process, which increases the workload. Therefore, in the future, more spectral characteristic wavelength or sensitive band extraction methods need to be continuously updated to enhance both the inversion accuracy and speed.
In addition, machine learning or transfer learning methods can be used to effectively address the limitations of crop varieties and growth conditions. Machine learning models can be updated in real time and adjusted according to new environmental data. For example, by using sensor data, drones, or satellite imagery to monitor crop growth status in real time, the model can self-adjust to adapt to the impacts of different growth environments and weather changes. Transfer learning, on the other hand, enables adaptive learning by transferring knowledge from existing models, reducing the need for large amounts of local data and improving the efficiency of applications. Intelligent decision-making systems based on machine learning and transfer learning can help farmers or agricultural technicians provide personalized planting management advice based on crop varieties and growth conditions.

Author Contributions

Conceptualization, S.G. and L.K.; methodology, S.G. and S.L.; formal analysis, S.G. and L.Z.; investigation, S.G. and S.L.; resources, S.G. and J.Q.; writing—original draft preparation, S.G. and S.L.; writing—review and editing, Y.Y. and L.C.; visualization, J.Q. and L.Z.; supervision, L.K.; funding acquisition, L.K. All authors have read and agreed to the published version of the manuscript.

Funding

This study was supported by Science and Technology Project of Jilin Provincial Department of Education, China, grant number JJKH20230390KJ, founded by Lijuan Kong.

Data Availability Statement

The data presented in this study are available on request from the Corresponding author. The data are not publicly available due to privacy.

Conflicts of Interest

The authors declare no conflicts of interest.

References

  1. Jia, M.H.; Yang, Y.; Zhang, Y.H.; Chen, C.; Tong, Y.X. The influence of continuous light supply with different blue light intensity on the morphology, photosynthetic characteristics and nutrient ion absorption of lettuce. Chin. J. Ecol. Agric. 2024, 32, 839–850, (In Chinese and English). [Google Scholar]
  2. Chen, G.L. Effects of light intensity on growth and photosynthesis in soybean seedling stage. Sichuan Agric. Sci. Technol. 2019, 9, 18–21. [Google Scholar]
  3. Cheng, Y.J.; Chen, J.X.; Wang, Z.L.; Fan, Y.F.; Chen, S.Y.; Li, Z.L.; Liu, Q.L.; Li, Z.C.; Yang, F.; Yang, W.Y. Effect of light intensity and light quality on the morphology and photosynthetic characteristics of soybean seedlings. Agric. Sci. China 2018, 51, 2655–2663. [Google Scholar]
  4. Gao, Z.Y.; Zhang, Z.P.; Fan, L.; Yang, Y.H. Effects of light intensity and nitrogen levels on maize growth and development, photosynthetic physiology, and dry matter accumulation. J. Yunnan Agric. Univ. (Nat. Sci.) 2020, 35, 187–195. [Google Scholar]
  5. Zhang, S.H.; Zhang, X.H.; Yang, Z.R.; Huang, X.M.; Zhang, F.L. Effect of C. High temperature stress on seedling growth and fluorescence dynamic parameters of sand mustard and chlorophyll leaf plants. North. Hortic. 2024, 10, 1–8. [Google Scholar]
  6. Shi, S.B.; Shi, R.; Zhou, D.W.; Zhang, W. Effect of low temperature on the photochemical and non-photochemical energy dissipation characteristics of alpine songgrass leaves. J. Plant Ecol. 2023, 47, 1441–1452. [Google Scholar] [CrossRef]
  7. Li, X.F.; Shao, J.Y.; Yu, W.Z.; Liu, P.; Zhao, B.; Zhang, J.W.; Ren, B. Effect of high temperature and drought compound stress on the yield and photosynthetic properties of summer maize. Agric. Sci. China 2022, 55, 3516–3529. [Google Scholar]
  8. Shao, J.Y.; Li, X.F.; Yu, W.Z.; Liu, P.; Zhao, B.; Zhang, J.W.; Ren, B.C. Effect of heat and drought compound stress on yield and stalk microstructure in summer maize. Agric. Sci. China 2021, 54, 3623–3631. [Google Scholar]
  9. Newiton, D.S.T.; Paulo, C.C.; Cristiano, D.F.; Adriano, H.R.; Marina, P.S. Effects of drying temperature of corn from the center and extremities of the corncob on drying parameters, protein and starch properties, and carotenoid profile. Food Res. Int. 2023, 163, 112267. [Google Scholar]
  10. Han, Y.F.; Wu, C.X.; Wu, H.H.; He, Y.K.; Yang, B.H.; Yuan, Y.W. Fruit and vegetables quality detection method based on visible-near-infrared spectroscopy technology. Agric. Eng. 2024, 14, 95–101. [Google Scholar]
  11. Jiang, X.G.; Zhu, M.W.; Yao, J.L.; Li, B.; Liao, J.; Zhang, Y.X.; Liu, Y.D. Effect of apple size difference on the applicability of the sugar degree model based on NIRS technology. J. Huazhong Agric. Univ. 2024, 43, 242–248. [Google Scholar]
  12. Lu, Y.J.; Wang, W.J.; Zhang, J.D.; Wang, Z.Y.; Lu, S.H. Classification and identification of rice images at different growth stages in wheat based on NIR spectroscopy and ELM. J. Henan Univ. Technol. (Nat. Sci. Ed.) 2023, 44, 104–111. [Google Scholar]
  13. Zhang, M.Y.; Hao, M.; Tian, H.Q. Nondestructive testing of pH values of silage corn feed based on hyperspectral imaging technology. J. Agric. Eng. 2023, 39, 239–247. [Google Scholar]
  14. Liu, S.; Yu, H.Y.; Chen, M.C.; Yu, T.; Li, F.Q.W.; Sui, Y.Y. Hyperspectral analysis of different water and nitrogen stress response rules in soybean. Spectrosc. Spectrosc. Anal. 2020, 40, 1575–1580. [Google Scholar]
  15. Hetta, M.; Mussadiq, Z.; Wallsten, J.; Halling, M.; Swensson, C.; Geladi, P. Prediction of nutritive values, morphology and agronomic characteristics in forage maize using two applications of NIRS spectrometry. Acta Agric. Scand. Sect. B Soil Plant Sci. 2017, 67, 326–333. [Google Scholar]
  16. Xin, L.; Tian, J.; Wanli, D.; Sai, X. Dual-Channel Co-Spectroscopy–Based Non-Destructive Detection Method for Fruit Quality and Its Application to Fuji Apples. Agronomy 2025, 15, 484. [Google Scholar] [CrossRef]
  17. Li, J.C.; Gu, Y.; Liu, C.L.; Sun, X.R.; Zhang, S.Z. Asash content of wheat flour based on hyperspectroscopy. J. Food Saf. Qual. Test. 2023, 14, 60–67. [Google Scholar]
  18. Cai, X.; Li, X.X.; Wang, Q.; Zhang, X.; Feng, J.Y.; Li, J. Response of maize, wheat, and rape to different light intensity treatments. South. Agric. 2023, 17, 6–11. [Google Scholar]
  19. Wen, W.M. Key influencing factors and countermeasures of corn yield. Grain Oil Feed. Technol. 2024, 8, 93–95. [Google Scholar]
  20. Lv, H.H.; Niu, Y.Y.; Zhang, M.; Li, H. Analysis of the trend of light intensity and air temperature and humidity in solar greenhouse. J. Agric. Mach. 2021, 52, 410–417. [Google Scholar]
  21. Wang, F.; Liu, L.; Wu, Y.Y.; Li, X.; Sun, Z.G.; Yin, F.; Jiao, N.Y.; Fu, G.Z. Mechanism of peanut intercropping. J. Plant Nutr. Fertil. 2020, 26, 901–913. [Google Scholar]
  22. Zhang, L.X.; Wu, X.D.; Cai, L.T.; Lu, C.P. Study on the effect of biodegradable plastic film mulching on fresh corn yield and soil temperature and humidity. Gard. Seedl. 2024, 44, 83–85. [Google Scholar]
  23. Jung, C.; Arar, M. Natural vs. Artificial Light: A Study on the Influence of Light Source on Chlorophyll Content and Photosynthetic Rates on Indoor Plants. Buildings 2023, 13, 1482. [Google Scholar] [CrossRef]
  24. Yao, J.F.; Liu, J. Design and implementation of crop growth environment information detection system based on DTU. Smart Agric. Guide 2022, 2, 11–13. [Google Scholar]
  25. Ji, H.; Zhang, M.; Huang, C.H.; Lin, W.; Lu, Y.; Wang, P.J.; Dong, B.; He, B.Z.; Wu, B.H.; Guo, L.J. The Impact of Piriformospora indica on plant heat and drought tolerance. Front. Plant Sci. 2024, 15, 1479561. [Google Scholar] [CrossRef]
  26. Wang, T.; Feng, J.L.; Zhang, C. Progress in the molecular mechanism of high temperature stress affecting corn growth and development. J. Bot. 2024, 59, 963–977. [Google Scholar]
  27. Yuan, M.; Jin, Z.X.; Sun, Z.S.; Chen, C. Effect of different light intensities on the photosynthetic properties of long fruit scale hammer trees. Fujian For. Sci. Technol. 2024, 51, 24–31. [Google Scholar]
  28. Stepanova, N.; Tarakhovskaya, E.; Soboleva, A.; Orlova, A.; Basnet, A.; Smolenskaya, A.; Frolova, N.; Bilova, T.; Kamionskaya, A.; Folov, A.; et al. Green Light Drives Embryonic Photosynthesis and Protein Accumulation in Cotyledons of Developing Pea (Pisum sativum L.) Seeds. Agronomy 2024, 14, 2367. [Google Scholar] [CrossRef]
  29. Almoujahed, M.B.; Apolo-Apolo, O.E.; Alhussein, M.; Kazlauskas, M.; Kriaučiūnienė, Z.; Šarauskis, E.; Mouazen, A.M. Prediction of Deoxynivalenol contamination in wheat kernels and flour based on visible near-infrared spectroscopy, feature selection and machine learning modelling. Spectrochimica Acta Part A Mol. Biomol. Spectrosc. 2025, 330, 125718. [Google Scholar]
  30. Yang, H.; Ming, B.; Nie, C.; Xue, B.; Xin, J.; Lu, X.; Xue, J.; Hou, P.; Xie, R.; Wang, K.; et al. Maize Canopy and Leaf Chlorophyll Content Assessment from Leaf Spectral Reflectance: Estimation and Uncertainty Analysis across Growth Stages and Vertical Distribution. Remote Sens. 2022, 14, 2115. [Google Scholar] [CrossRef]
Figure 1. Changes in leaf SPAD values under different light and temperature conditions. Note: Different lowercase letters indicate significant differences at the p < 0.05 level for different treatments.
Agronomy 15 00828 g001
Figure 2. Changes in leaf net photosynthetic rate under different light and temperature conditions. Note: Different lowercase letters indicate significant differences at the p < 0.05 level for different treatments.
Agronomy 15 00828 g002
Figure 3. Spectral characteristics of leaves under different light–temperature environments.
Agronomy 15 00828 g003
Figure 4. Correlation between maize leaf spectra and SPAD.
Agronomy 15 00828 g004
Figure 5. Spectral characteristics of net photosynthetic rate under different light–temperature coupling treatments.
Agronomy 15 00828 g005
Figure 6. Correlation between the measured and predicted values of the SPAD inversion model. Note: (af): PCR-MSG-SG, PCR-SNV-SG, PLS-MSG-SG, PLS-SNV-SG, SMLR-MSC-SG, and SMLR-SNV-SG.
Agronomy 15 00828 g006
Figure 7. Correlation between the measured and predicted values of the net photosynthetic rate inversion model. Note: (af): PCR-MSG-SG, PCR-SNV-SG, PLS-MSG-SG, PLS-SNV-SG, SMLR-MSC-SG, and SMLR-SNV-SG.
Agronomy 15 00828 g007
Figure 8. Comparison of inversion results using different spectral combination methods.
Agronomy 15 00828 g008
Table 1. Experimental light–temperature treatment group.
Experimental GroupingTreatment NumberTreatment Combination DescriptionDay/Night Temperature (°C)Light Intensity (lux)
Single-Factor ExperimentA1Low-light intensity stress environment20/154400
A2High-light intensity stress environment20/1522000
A3Low-temperature stress environment14/58800
A4High-temperature stress environment34/228800
Light and Temperature Factors ExperimentA5Photothermal environment 125/1512,000
A6Photothermal environment 234/2212,000
A7Photothermal environment 334/2222,000
A8Photothermal environment 425/1522,000
Table 2. Inversion model results of maize leaf physiological information.
Physiological InformationSpectral Combination MethodRcRMSECRpRMSEP
SPADPCR-MSG-SG0.81041.07000.81181.300
PCR-SNV-SG0.84501.02000.83671.050
PLS-MSG-SG0.99600.00640.97430.413
PLS-SNV-SG0.99490.15200.94280.853
SMLR-MSG-SG0.96940.53600.93210.904
SMLR-SNV-SG0.96740.56100.90400.827
Net Photosynthetic RatePCR-MSG-SG0.82031.05000.82141.200
PCR-SNV-SG0.84141.02000.83741.070
PLS-MSG-SG0.98600.00590.93280.854
PLS-SNV-SG0.98480.14900.97380.415
SMLR-MSG-SG0.96840.53740.92480.913
SMLR-SNV-SG0.95920.55900.96790.814
Disclaimer/Publisher’s Note: The statements, opinions and data contained in all publications are solely those of the individual author(s) and contributor(s) and not of MDPI and/or the editor(s). MDPI and/or the editor(s) disclaim responsibility for any injury to people or property resulting from any ideas, methods, instructions or products referred to in the content.

