Abstract
Process-based crop growth models, as an important analytical tool in agricultural production, face the problem of calibrating many parameters during the application process, and sensitivity analysis (SA) can quantify the effects of the model input parameters on the model output and provide an important basis for parameter calibration. In this study, we combined the good performance of the Agricultural Production Systems sIMulator Next-Generation (APSIM NG) model in simulating crop growth, soil carbon and nitrogen cycles, and soil N2O emissions with the efficient computational efficiency of the extended Fourier amplitude test (EFAST) method. The sensitivity of the APSIM NG model to the simulation of soil N2O emissions was systematically investigated using the EFAST method in a dry-crop wheat field in the semi-arid region of the Loess Plateau in Longzhong, China, where 28 crop cultivar parameters, 15 soil parameters, 4 meteorological parameters, and 4 field management parameters were selected. The parameters were selected based on the existing literature and the official documents of the model, and the parameter boundaries were determined based on the initial values of the APSIM NG model and the measured data and adjusted upward and downward by the standard normal distribution. In this study, parameters with a first-order sensitivity index () > 0.05 and a total sensitivity index () > 0.10 were identified as having a significant influence on the model outputs. The results of this study demonstrated that soil N2O emission modeling in dry-crop wheat fields showed high sensitivity to the following parameters: (1) Among the crop cultivar parameters, the sensitivity from high to low was the leaf appearance rate, maximum leaf area, maximum nitrogen concentration of the grain, and thermal time from the starting grain-fill stage to end grain-fill stage. (2) Among the soil parameters, the sensitivity from high to low was a lower effective moisture limit, wilting coefficient, and ammonium nitrogen content. (3) Among the meteorological parameters, precipitation and solar radiation showed high sensitivity. (4) Among the field management parameters, the nitrogen application rate exhibited the most significant sensitivity. For this reason, we believe that by prioritizing the calibration of the most sensitive parameters through the results of the sensitivity analysis in this study, the workload of the APSIM NG model in the calibration process can be effectively reduced, which is conducive to the rapid localization and application of the model.
1. Introduction
As global warming continues to worsen, the issue of greenhouse gas emissions is becoming increasingly prominent. Nitrous oxide (N2O), a notable greenhouse gas, has a global warming potential (GWP) that is 298 times greater than that of carbon dioxide (CO2) [1], and its concentration in the atmosphere is continuing to increase at a rate of 0.25 percent per annum, so its contribution to global warming should not be ignored [2]. In China, GHG emissions (Greenhouse Gas emissions) from the production of agriculture make up over 15 percent of the total GHG emissions and about 90 percent of the total N2O emissions [3]. In agricultural activities, agricultural soils, as the main source of N2O emissions, emit about 42% of the total global anthropogenic N2O emissions annually [4]. In northwest China, due to perennial drought and low rainfall, dry-crop wheat fields have become the main food production base. It has been found that wheat fields are cultivated over a vast area, accounting for 44% of the total cultivated area in northwest China, thus leading to an increase in regional N2O emissions [5]. An accurate estimation of soil N2O emissions from dry-cropped wheat fields faces difficulties due to the lack of continuous field monitoring data and the limitations of the time and spatial conditions [6]. Crop modeling can take into account multiple factors such as the soil, climate, crop growth, and field management, and can accurately simulate the nitrogen cycle [7,8], thus achieving the precise control of soil N2O emissions. Therefore, the use of crop models to investigate the global sensitivity of N2O emissions from dry-crop wheat fields is of great significance for optimizing regional strategies to reduce soil N2O emissions.
Crop modeling integrates several factors closely related to soil C and N dynamics, such as crop, soil, climate, and field management modules, and describes the physiological, ecological, physical, and chemical processes through mathematical equations to realize the detailed simulation of key processes, such as crop growth, soil C and N cycling, and greenhouse gas emissions [9,10,11]. However, as crop models are complex process-based nonlinear dynamic systems involving many biophysical processes, which usually cover numerous input parameters, state variables, and diverse model structures, these factors are at the root of the modeling uncertainty problem [12]. Parameter calibration is critical before applying a crop model, as the complexity of the model and the number of parameters directly affect the number of runs the model needs to make [13]. Due to the large amount of parameters involved, several model runs need to be performed, thus taking a long computational time. To minimize the number of parameters in the calibration procedure, a sensitivity analysis was introduced to identify those parameters that are most influential [14], which reduces the workload of the model calibration by correcting only the parameters that are more influential and fixing those that are less influential [15].
The sensitivity analysis (SA) method, as a method to determine how sensitive the model’s output variables are to variations in the input parameters, is utilized to determine the magnitude of the effect of the parameters on the model simulation results, and the analysis methods are usually separated into two categories: global and local sensitivity analysis [16]. Local sensitivity analyzes just one parameter’s impact on the model’s output, which is somewhat one-sided, whereas global sensitivity analyzes the effect of the entire parameter space on the model output [17]. When investigating the sensitivity of multiple variables to the model output, many scholars have used global sensitivity analysis methods for their studies, Confalonieri [18] and Makowski et al. [19] evaluated different crop models utilizing global sensitivity analysis methods and proved that sensitivity analysis simplifies the modeling process by fitting the observed values to the simulated values. The important role of sensitivity analysis is in simplifying models. Many various crop models have been subjected to sensitivity analysis techniques [20,21]; studies on parameter sensitivity analyses using The Extended Fourier Amplitude Sensitivity Test, a global sensitivity analysis method for parameter sensitivity analysis, focus on models such as the Agricultural Production Systems sIMulator (APSIM) and DeNitrification–DeComposition Model (DNDC), etc., models. Liu et al. [22] applied the EFAST method for parameter sensitivity analysis to identify key sensitive parameters in the APSIM-Oryza rice growth model, and the study found that there were significant differences in the sensitivity of the models to each parameter. Zhao et al. [13] investigated the effects of 10 varietal parameters in the APSIM model on the wheat yield, biomass, anthesis, and maturity using parameter global sensitivity analysis, and found that the yield was mainly affected by the varietal parameters associated with it. Cheng et al. [23] used the DNDC model to simulate N2O emission and parameter sensitivity analysis in dry-crop wheat fields under different fertilizer application levels, and through the analysis, the most sensitive parameter affecting N2O emissions was derived from soil properties. In summary, sensitivity analysis plays an important role in improving the simulation accuracy of the model, which not only helps the model to better adapt to the growth characteristics of crops in a specific region and cope with the temporal and geographical fluctuations of the crop growth process, but also provides a scientific foundation for the calibration of cultivar-specific parameters in the model. Through sensitivity analysis, it is possible to clarify which parameters have a significant impact on the model output, and then optimize the model structure to improve the accuracy of the model in practical applications.
The APSIM model, a leading process-based crop model, has been extensively used for over 25 years in both academic research and practical applications [24]. Currently, the APSIM model has not only been widely used in research on agricultural production systems in various agricultural and environmental circumstances [25,26] and parameter sensitivity analyses [27], but has also made some progress in research related to simulating the nitrogen cycle and soil N2O emissions [28,29]. However, although studies have been conducted to investigate the application of the APSIM model in the sensitivity analysis of the crop yield formation parameters and the simulation of soil N2O emissions, these studies have mainly focused on the classical version of the APSIM model, and have been limited to the local sensitivity analyses of the parameters or simulated variations of the model’s response under specific conditions. There is still a lack of studies on parameter sensitivity analyses of the APSIM NG model, especially the global sensitivity analyses of parameters related to soil N2O emissions in dry farming systems.
Given this, in this study, the APSIM NG model was applied for the first time to simulate soil N2O emissions from dry-crop wheat fields in the semi-arid zone of the Loess Plateau in Longzhong, China, and global sensitivity analyses of the model parameters were conducted using the EFAST method. This study focuses on the sensitivity of soil N2O emission simulation outputs to input parameters in dry-crop wheat fields. This area has been less thoroughly explored in previous studies, especially those based on the APSIM NG model, which is more limited. Based on the above background, the following hypothesis is proposed in this study: the APSIM NG model simulates significant differences in the sensitivity of soil N2O emissions to input parameters. Through the EFAST method, key parameters and their interactions can be identified to provide a scientific basis for model parameter rate setting and optimization. Through this study, we aim to provide a reference basis for the parameter calibration and parameter rate determination of the APSIM NG model during the simulation of N2O emissions from dry-crop wheat soils and to promote the rapid localization and application of the model.
2. Materials and Methods
2.1. Next-Generation APSIM
The APSIM NG model is a new-generation version of the APSIM Classic model, which inherits the generic modeling framework of the Classic version and improves the algorithms, interfaces, and module combinations to increase the code execution rate [30]. The model integrates multiple modules through a plug-in mechanism to simulate complex processes such as crop development, soil water, the dynamics of carbon and nitrogen, effects of the climate, and agricultural management techniques [31,32]. The APSIM NG model enables the fine-grained simulation of key processes, such as GHG emissions and the cycle of carbon and nitrogen in soil. And the model uses a comparatively easy conceptual pool method for modeling the dynamics of carbon (C), followed by linking the nitrogen cycle through the carbon-to-nitrogen ratio. In the model, N2O emissions are simulated using a daily step-size simulation, which is based on daily meteorological data as well as the simulation of soil N2O emissions during wheat growth driven by crop cultivar data, soil data, and field management data. Soil N2O emissions were simulated in the APSIM NG model as a result of the nitrification and denitrification processes, where emissions of N2O were computed as a fixed percentage of nitrate nitrogen (k2, dimensionless) representing the proportion of N2O emitted during nitrification [33]. In contrast, N2O emissions during denitrification are predicted according to the model of Del Grosso et al. [34], which takes into account the ratio of N2 to N2O emissions during denitrification. The soil nitrogen module of the APSIM model achieves a dynamic simulation of soil N2O emissions by simulating nitrogen mineralization and fixation, nitrification, and denitrification [35]. It was modified in the next-generation version to include N2O emissions to separate the N gas released during denitrification into N2 and N2O, as well as during nitrification [36]. The APSIM NG (2023.7.7280.0) version was used in this study.
2.2. Study Area
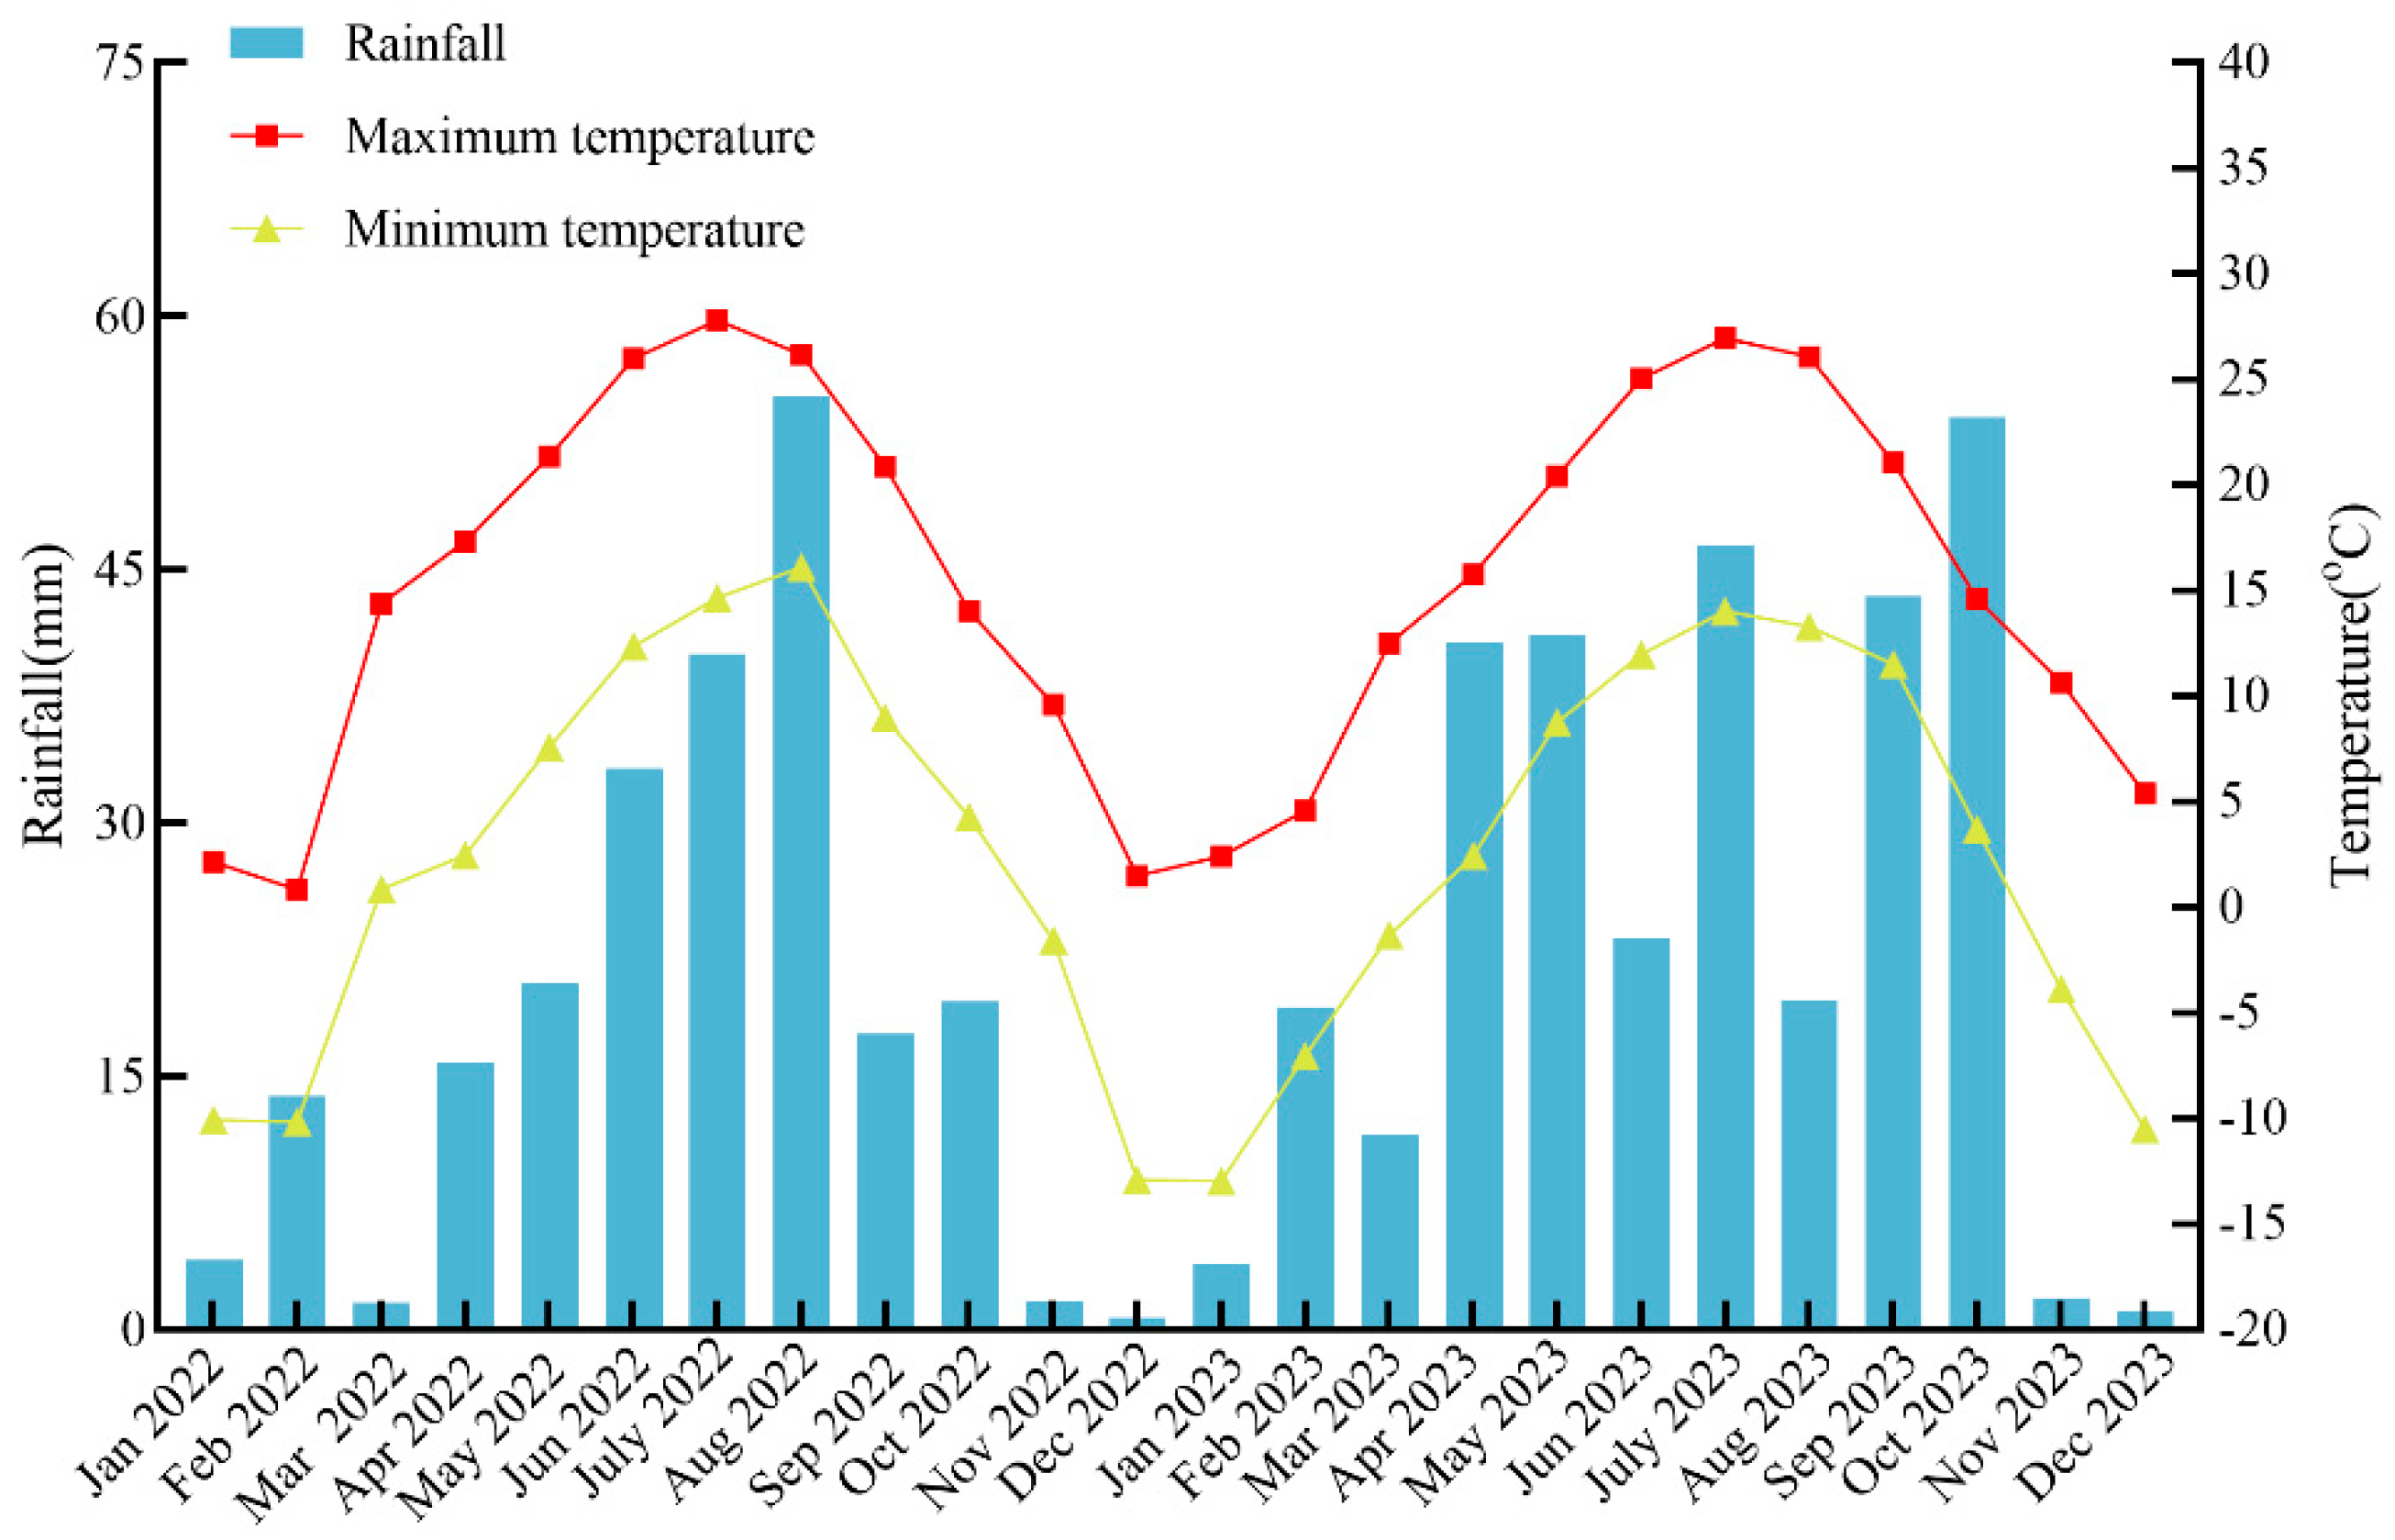
The experimental site was located in Anjiapo Village, Anding District, Dingxi City, Gansu Province, China (104°64′ E, 35°64′ N), which is at an average altitude of 2000 m above sea level and has a 6.4 °C average annual temperature and a temperate semi-arid climate. This study area has sufficient sunshine and a significant variation in temperature between day and night, with the average number of hours of sunshine each year above 2400 h, an interval of 140 days without frost, and a yearly precipitation average of 394.1 mm, which is a typical semi-arid rain-fed agricultural region. The soil type of the study area is loess, accurately categorized as Calcaric Cambisols according to the World Soil Resource Reference Benchmark (WRB), with a sandy loam texture and good water retention and aeration properties. The bulk density of the soil was 1.19 g⋅cm−3, the organic matter content was 12.01 g⋅kg−1, the pH was 8.40, the overall amount of nitrogen was 0.76 g⋅kg−1, and the overall amount of phosphorus was 1.77 g⋅kg−1. The distribution of the specific monthly mean temperature and monthly precipitation data for the spring wheat growing season of 2022–2023 is shown in Figure 1.
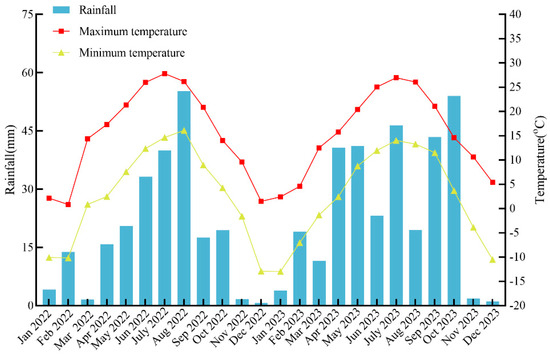
Figure 1.
Changes in monthly precipitation and monthly mean maximum and minimum temperatures at the test site from 2022 to 2023.
2.3. Experimental Design
The experiment took place between 2022 and 2023 in the experimental field of Anjiapo Village, Anding District, Dingxi City, and the spring wheat ‘Dingxi 35’ from the area was chosen as the cultivar to be sown, which was matured once a year. A randomized, full group design was used for the investigation and the crop was sown in the traditional plowing method of three plows and two purses, with three replications in three sample plots, each with an area of 24 m2 (6 m × 4 m). The crop was sown on or around 19 March at a sowing rate of 187.5 kg⋅hm−2 (kilograms per hectare) (which means 187.5 kg of seed per hectare) with a 25 cm gap between each row, and a sowing depth of 7 cm. Then, 150 kg⋅hm−2⋅y−1 (which means 150 kg of calcium superphosphate is applied per hectare per year as a basal fertilizer) of calcium superphosphate was uniformly applied as the basal fertilizer based on the local fertilization experience. To minimize the difference between the sample plots’ marginal effects, the plots were separated by a 0.5 m wide barrier strip, and methods of field management were in line with regional wheat production standards.
2.4. Method of Global Sensitivity Analysis
The EFAST method is a global sensitivity analysis tool that relies on variance decomposition, which can consider both the individual parameters’ sensitivity as well as the interactions and coupling between parameters. It is a technique for global sensitivity analysis put out by Saltelli et al. [37] that combines the advantages of the Sobol method and the FAST method. The EFAST method analyzes the output variance in the frequency domain by Fourier decomposition, and this method allows for a more efficient investigation of the input parameters’ multidimensional space. Compared to other methods that necessitate numerous model runs, EFAST can estimate sensitivity indices with fewer model runs, improving the efficiency of the analysis [38].
In the EFAST method, the sensitivity of the parameters is determined by analyzing the model output’s reaction to modifications in the input parameters. Let be the model output, be the input parameters’ joint probability density function, and be the k-dimensional parameter space. The expected output value can be obtained from the subsequent role:
Each input parameter is assigned a unique frequency and transformed by the following function:
where s is a scalar in the range (−π, π) and is a random phase uniformly selected within [0, 2\pi]. All factors change throughout the scanning input space curve with different values of s. If parameter I has a significant impact on the model, the output will have a high amplitude. and are Fourier coefficients:
where represents the number of calculations, /2, and /2. The overall variance of the output from the model, V(K), is portrayed as the Fourier approximation:
Variations in parameter cause variance in model output :
where M is the maximum number of harmonics considered. and are the Fourier coefficients without the parameter . After normalization, the first-order sensitivity coefficient for parameter is:
The global sensitivity coefficient is:
where without the parameter , is the total of the simulated variances of all other parameters.
In this investigation, 0.05 and 0.10 are defined as the criteria for parameter sensitivity judgment, which were proposed by DeJonge et al. [39] to assist us in determining which parameters are most affected by the model’s outputs and further optimize the parameter calibration model.
2.5. Parameter Selection Settings
In this study, 51 parameters (crop cultivar parameters, soil parameters, meteorological parameters, and field management parameters) were chosen primarily for the investigation of global sensitivity. The crop cultivar parameters were selected regarding the study of Zhao et al. [13] and the documentation of the model on the official website of APSIM [32]. For the parameter bounds, we used standard normal distributions and the crop cultivar parameters ranges were calculated with reference to previous studies [27], based on the initial values of the APSIM NG model, up and down by 50%. The soil parameters, meteorological parameters, and field management parameters were derived from measurements made by the experimental site, also using standard normal distribution. The range of soil parameters was calculated by combining the relevant literature [40] based on the measured values with a 5% upward and downward fluctuation, and the range of meteorological parameters and field management parameters was calculated by referring to the relevant literature [41], based on the measured values with a 10% upward and downward fluctuation. Table 1, Table 2 and Table 3 report the lower and upper limits, units, and definitions of the 28 varietal parameters, 15 soil parameters, and 4 meteorological and 4 field management parameters specified for sensitivity analyses in this study.

Table 1.
Ranges and definitions of the crop cultivar parameters chosen for the APSIM NG model.
Table 2.
Ranges and definitions of the soil parameters chosen for the APSIM NG model.
Table 3.
Ranges and definitions of meteorological and field management parameters chosen for the APSIM NG model.
2.6. Simulation Program
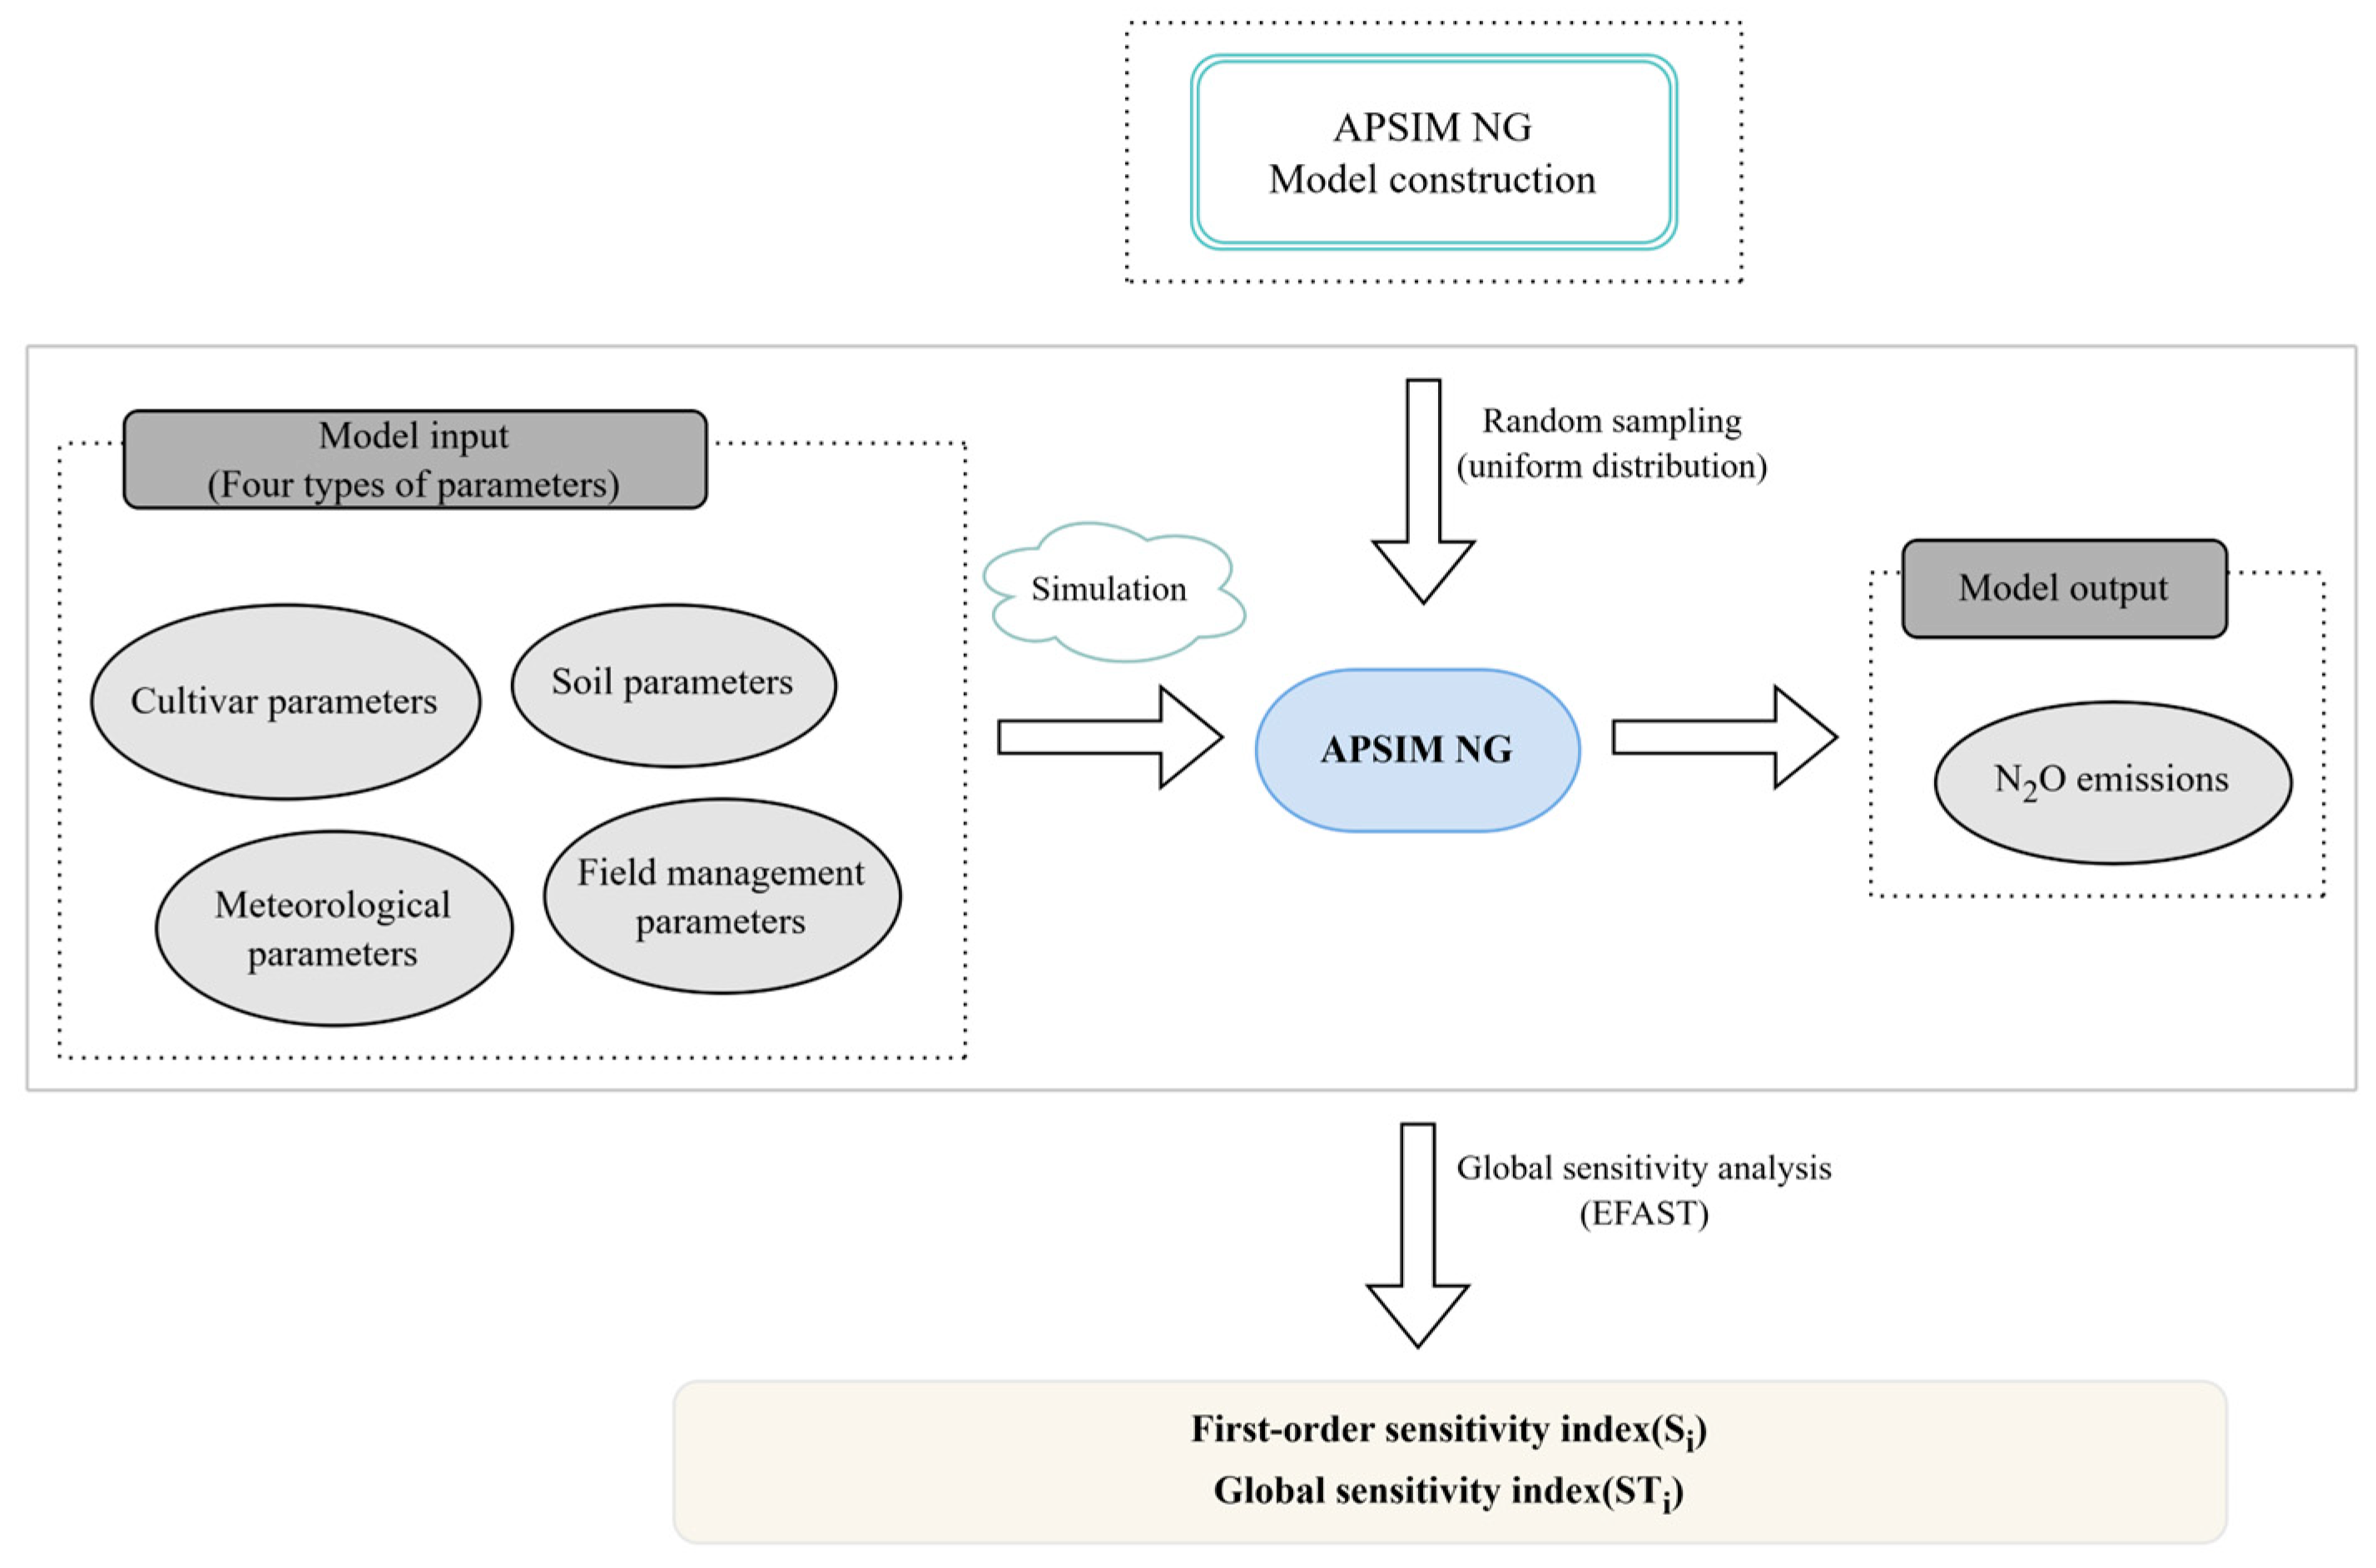
The global sensitivity analysis tests of parameters conducted in this study were based on the EFAST module of the sensitivity analysis software SimLab 2.2.1. The batch-run simulation of the crop cultivar parameters of the APSIM NG-Wheat module was carried out with the help of RStudio (2024.09.1+394), and the simulation of the soil parameters, meteorological parameters, and field management parameters was carried out by a manual trial-and-error method with the perturbation input model run. Figure 2 illustrates an overview of the main experimental processes in this study.

Figure 2.
Global sensitivity analysis workflow.
The sensitivity analysis process for this study was as follows.
- (1)
- The APSIM NG simulation platform based on the basic data of 2022–2023 was built in the study area and the ranges of the crop cultivar parameters, soil parameters, meteorological parameters, and field management parameters of the APSIM NG model were determined; the parameter definitions and ranges are shown in Table 1, Table 2 and Table 3.
- (2)
- Uniformly distributed random sampling was performed within the parameter ranges using SimLab 2.2.1 software to generate multidimensional parameters. A total of 51 parameters were entered in this study, generating a total of 51 × 130 = 6630 data sets (in the EFAST method, the number of samples of the parameters needs to be greater than 65 times as many parameters which must be taken into account for the analysis, and in this study, it was set to 130 times accordingly).
- (3)
- The Apsimx package in R4.2.3 was used to input the generated crop cultivar parameters into the model and run the APSIM NG model simulation. Additionally, the simulation was run by the manual trial-and-error method for the generated soil parameters, meteorological parameters, and field management parameters, respectively, one by one, for the perturbation input model.
- (4)
- The output results of the parameter simulation operations were collated, and then the collated data were entered into SimLab 2.2.1 for analysis to obtain the results of the first-order sensitivity and global sensitivity analyses of the parameters.
2.7. Data Sources
The meteorological data including rainfall (mm), solar radiation (MJ·m−2), and daily maximum and daily minimum temperatures (°C) were obtained from meteorological 52995 near the test site. Soil data were obtained from the measured data after an accurate analysis of soil samples collected from the experimental field. Field management data including the sowing time and fertilizer application were obtained from local traditional farming practices.
3. Results
3.1. Sensitivity Analysis of Crop Cultivar Parameters
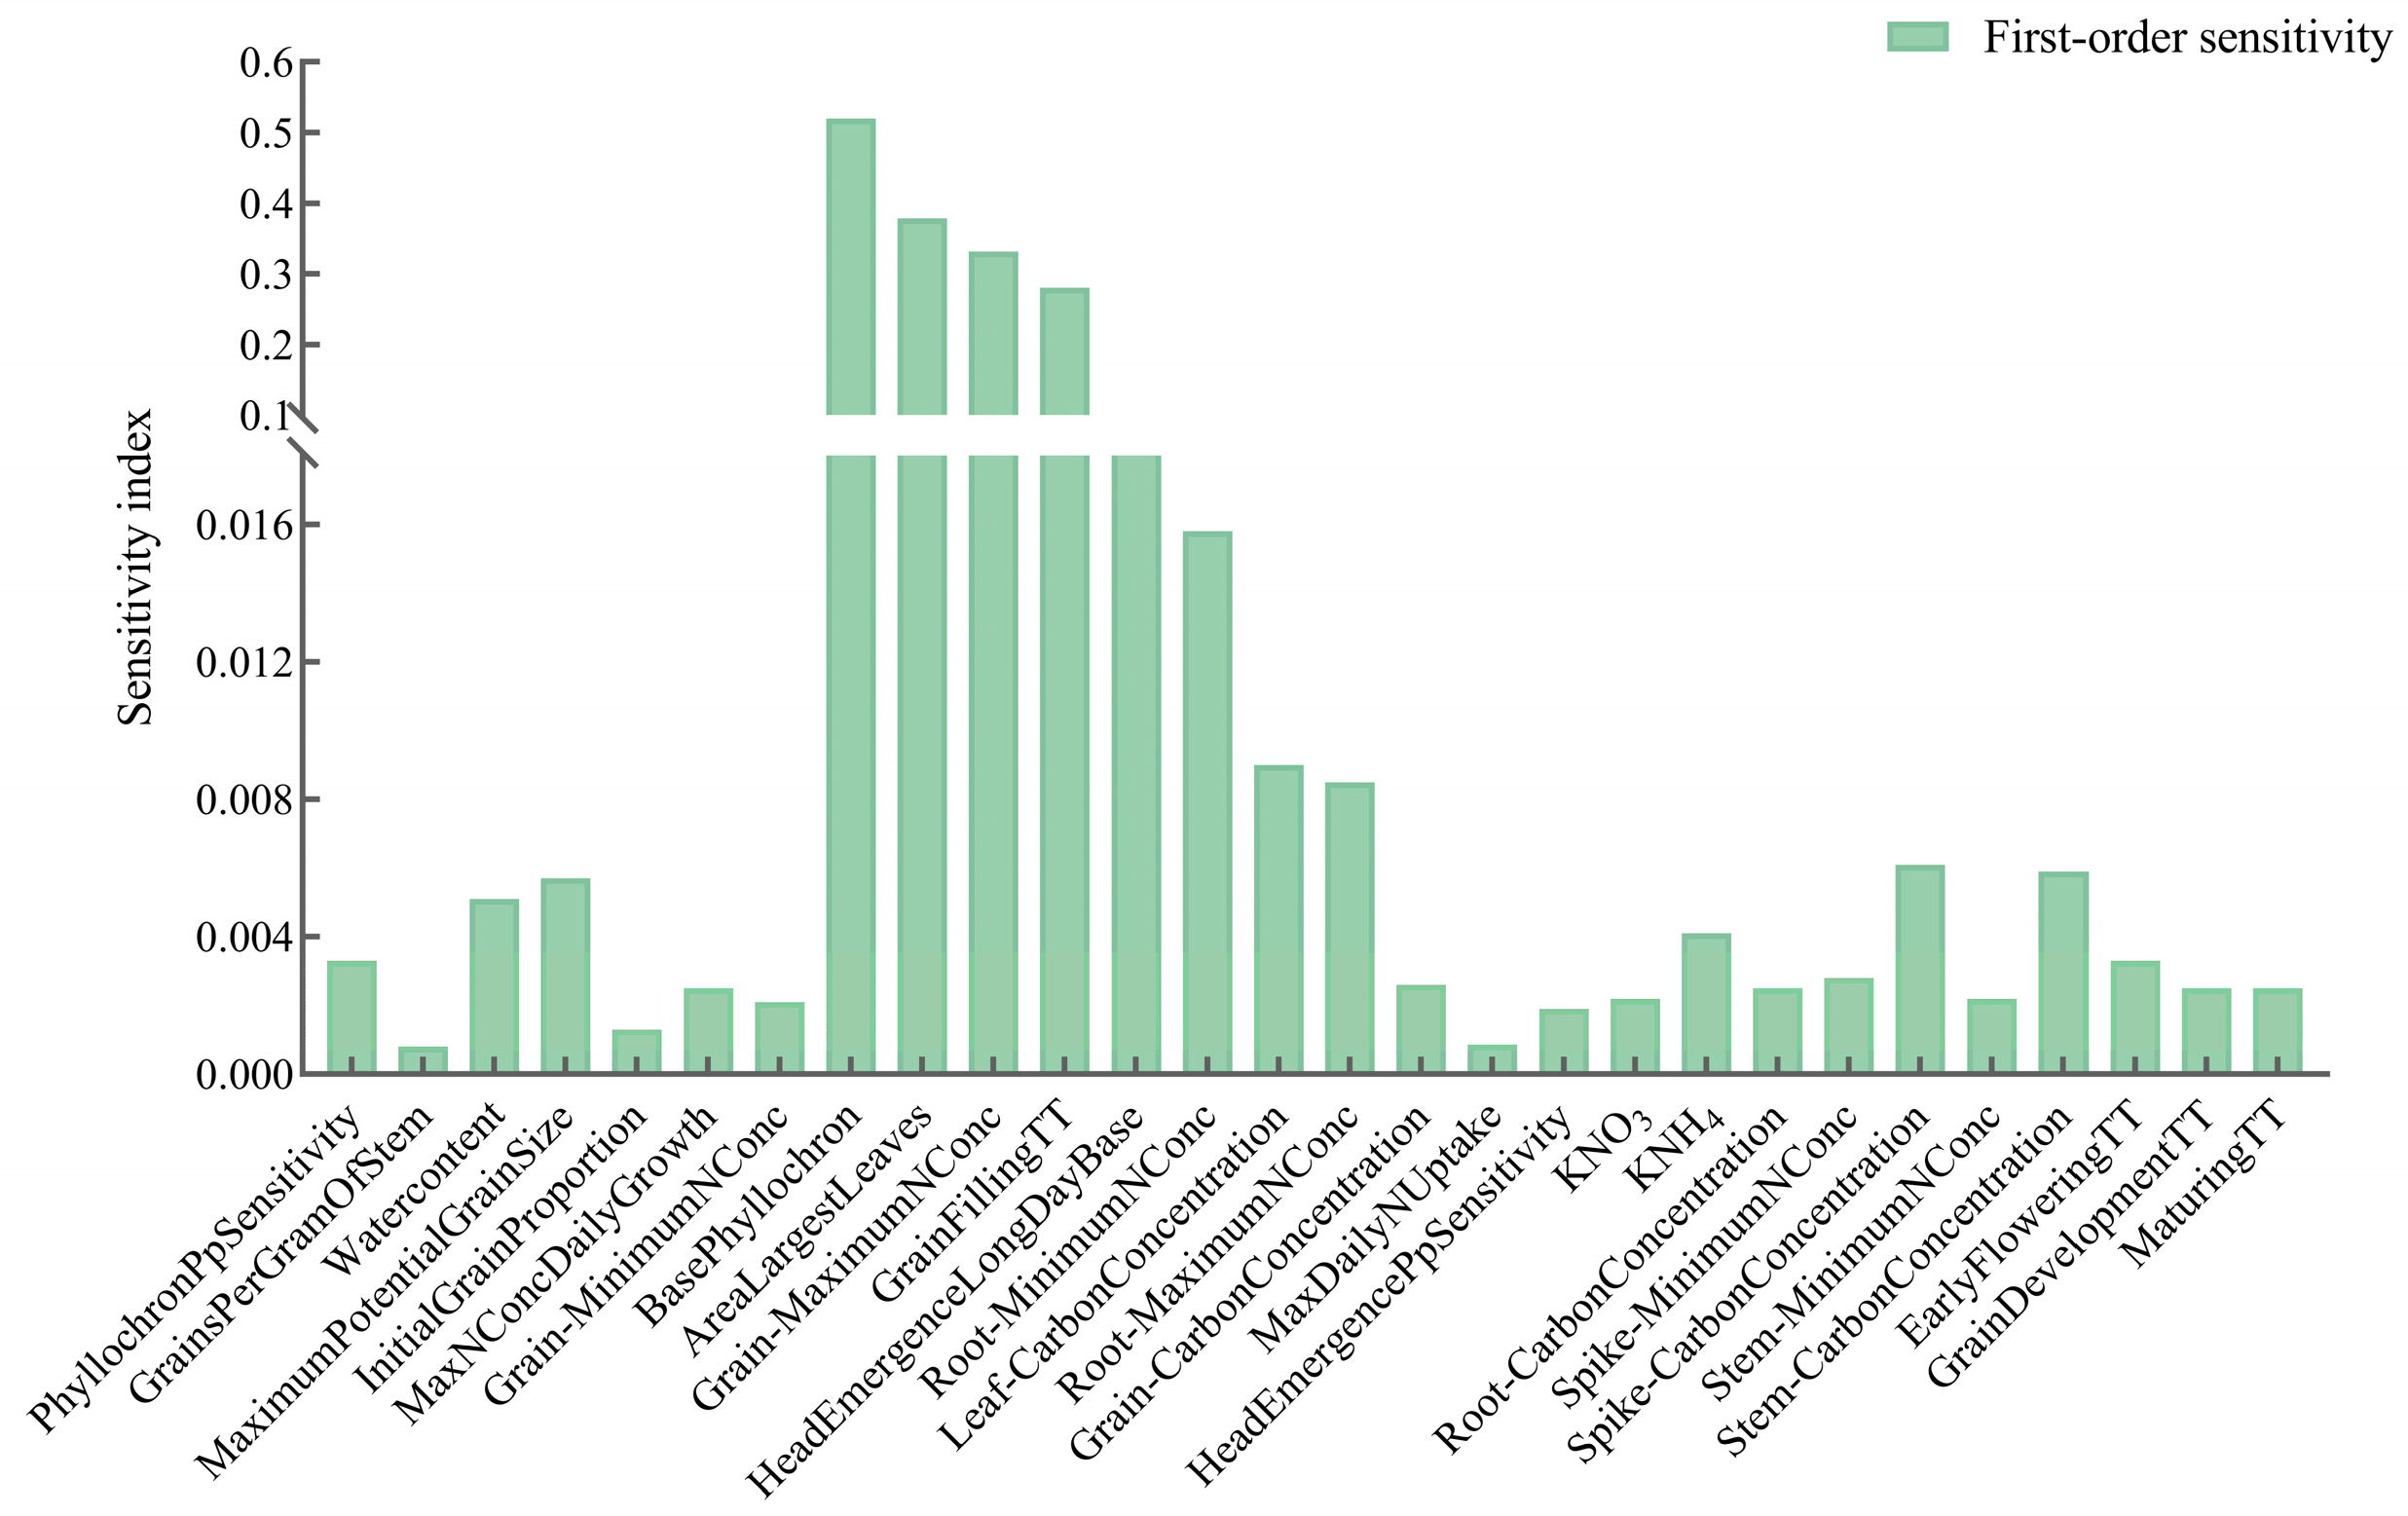
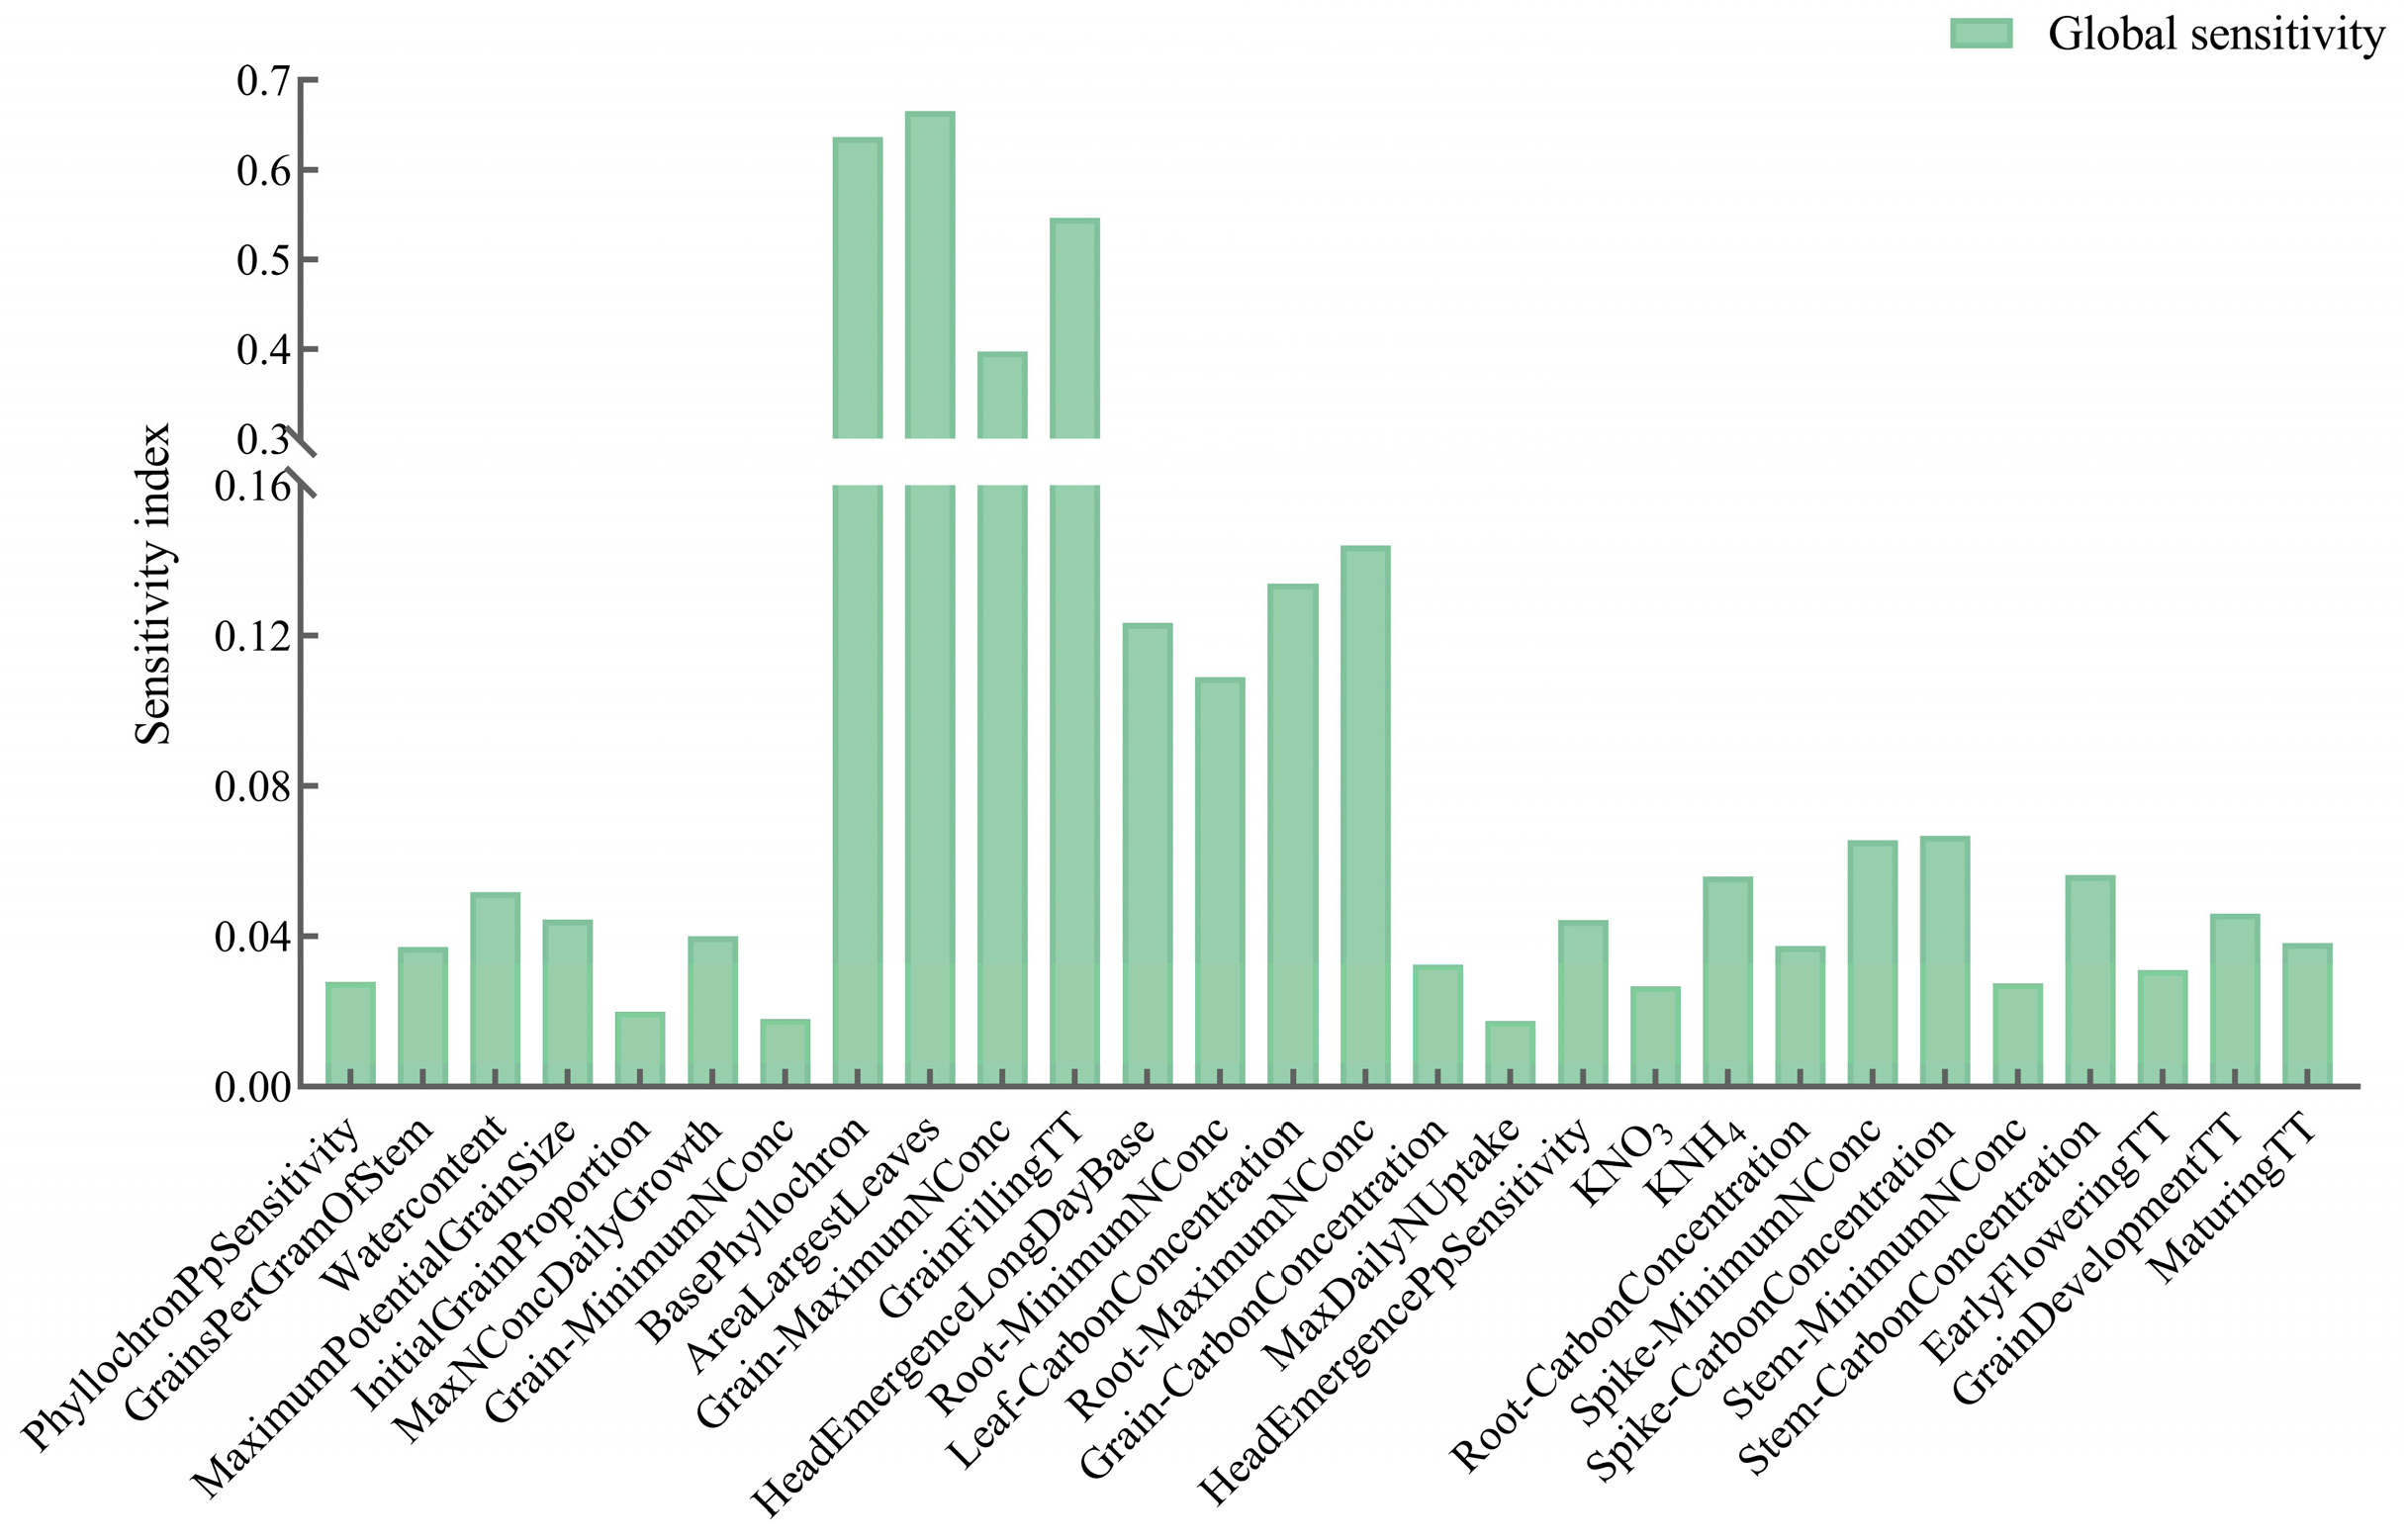
The first-order sensitivity analysis of crop cultivar parameters to N2O emissions simulated by the APSIM NG model is shown in Figure 3, and there are four parameters with a first-order sensitivity index greater than 0.05: the leaf appearance rate (BasePhyllochron), maximum leaf area (AreaLargestLeaves), maximum nitrogen concentration of the grain (Grain-MaximumNConc), and thermal time from the starting grain-fill stage to end grain-fill stage (GrainFillingTT). The global sensitivity analysis is shown in Figure 4, and there were eight parameters with global sensitivity indices greater than 0.10: the leaf appearance rate (BasePhyllochron), basal duration of tasseling under long sunlight exposure (HeadEmergenceLongDayBase), maximum nitrogen concentration of the grain (Grain-MaximumNConc), leaf carbon concentration (Leaf-CarbonConcentratio), maximum nitrogen concentration in the root system (Root-MaximumNConc), minimum nitrogen concentration in the root system (Root-MinimumNConc), maximum leaf area (AreaLargestLeaves), and thermal time from the starting grain-fill stage to the end grain-fill stage (GrainFillingTT). The first-order sensitivity index and global sensitivity index expressed the sensitivity strength between the parameters which were basically the same, and the global sensitivity index reflected the interaction between soil N2O emissions and each parameter more clearly than the first-order sensitivity index, so its index value was larger than the first-order sensitivity index value.
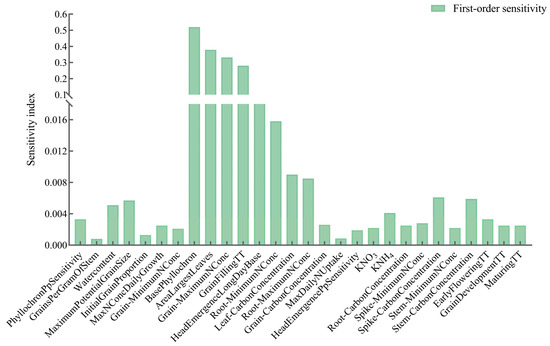
Figure 3.
First-order sensitivity indices of crop cultivar parameters to N2O emissions from dry-crop wheat soils.

Figure 4.
Global sensitivity indices of crop cultivar parameters to N2O emissions from dry-crop wheat soils.
According to the results of the sensitivity index, it can be found that the first-order sensitivity index of the leaf appearance rate (BasePhyllochron), maximum leaf area (AreaLargestLeaves), maximum nitrogen concentration of the grain (Grain-MaximumNConc), and thermal time from the starting grain-fill stage to end grain-fill stage (GrainFillingTT) were 0.520, 0.378, 0.332, and 0.280, and the global sensitivity indexes were 0.637, 0.665, 0.397, and 0.547, which means that the leaf appearance rate (BasePhyllochron), maximum leaf area (AreaLargestLeaves), maximum nitrogen concentration of the grain (Grain-MaximumNConc), and thermal time from the starting grain-fill stage to the end grain-fill stage (GrainFillingTT) can explain 63.7%, 66.5%, 39.7%, and 54.7% of the variance variation of the simulated N2O emissions, respectively. It has a great influence on the simulated soil N2O emissions.
In addition, the first-order sensitivity indexes of the basal duration of tasseling under a long sunlight duration (HeadEmergenceLongDayBase), the leaf carbon concentration (Leaf-CarbonConcentratio), maximum nitrogen concentration in the root system (Root-MaximumNConc), and minimum nitrogen concentration in the root system (Root-MinimumNConc) were all less than 0.05, while the global sensitivity indexes were as follows: 0.123, 0.134, 0.144, and 0.109, indicating that they affect soil N2O emissions mainly through interactions with other parameters, and other crop cultivar parameters are not sensitive to soil N2O emissions.
The detailed explanation of each crop cultivar parameter is shown in Table 1.
3.2. Sensitivity Analysis of Soil Parameters
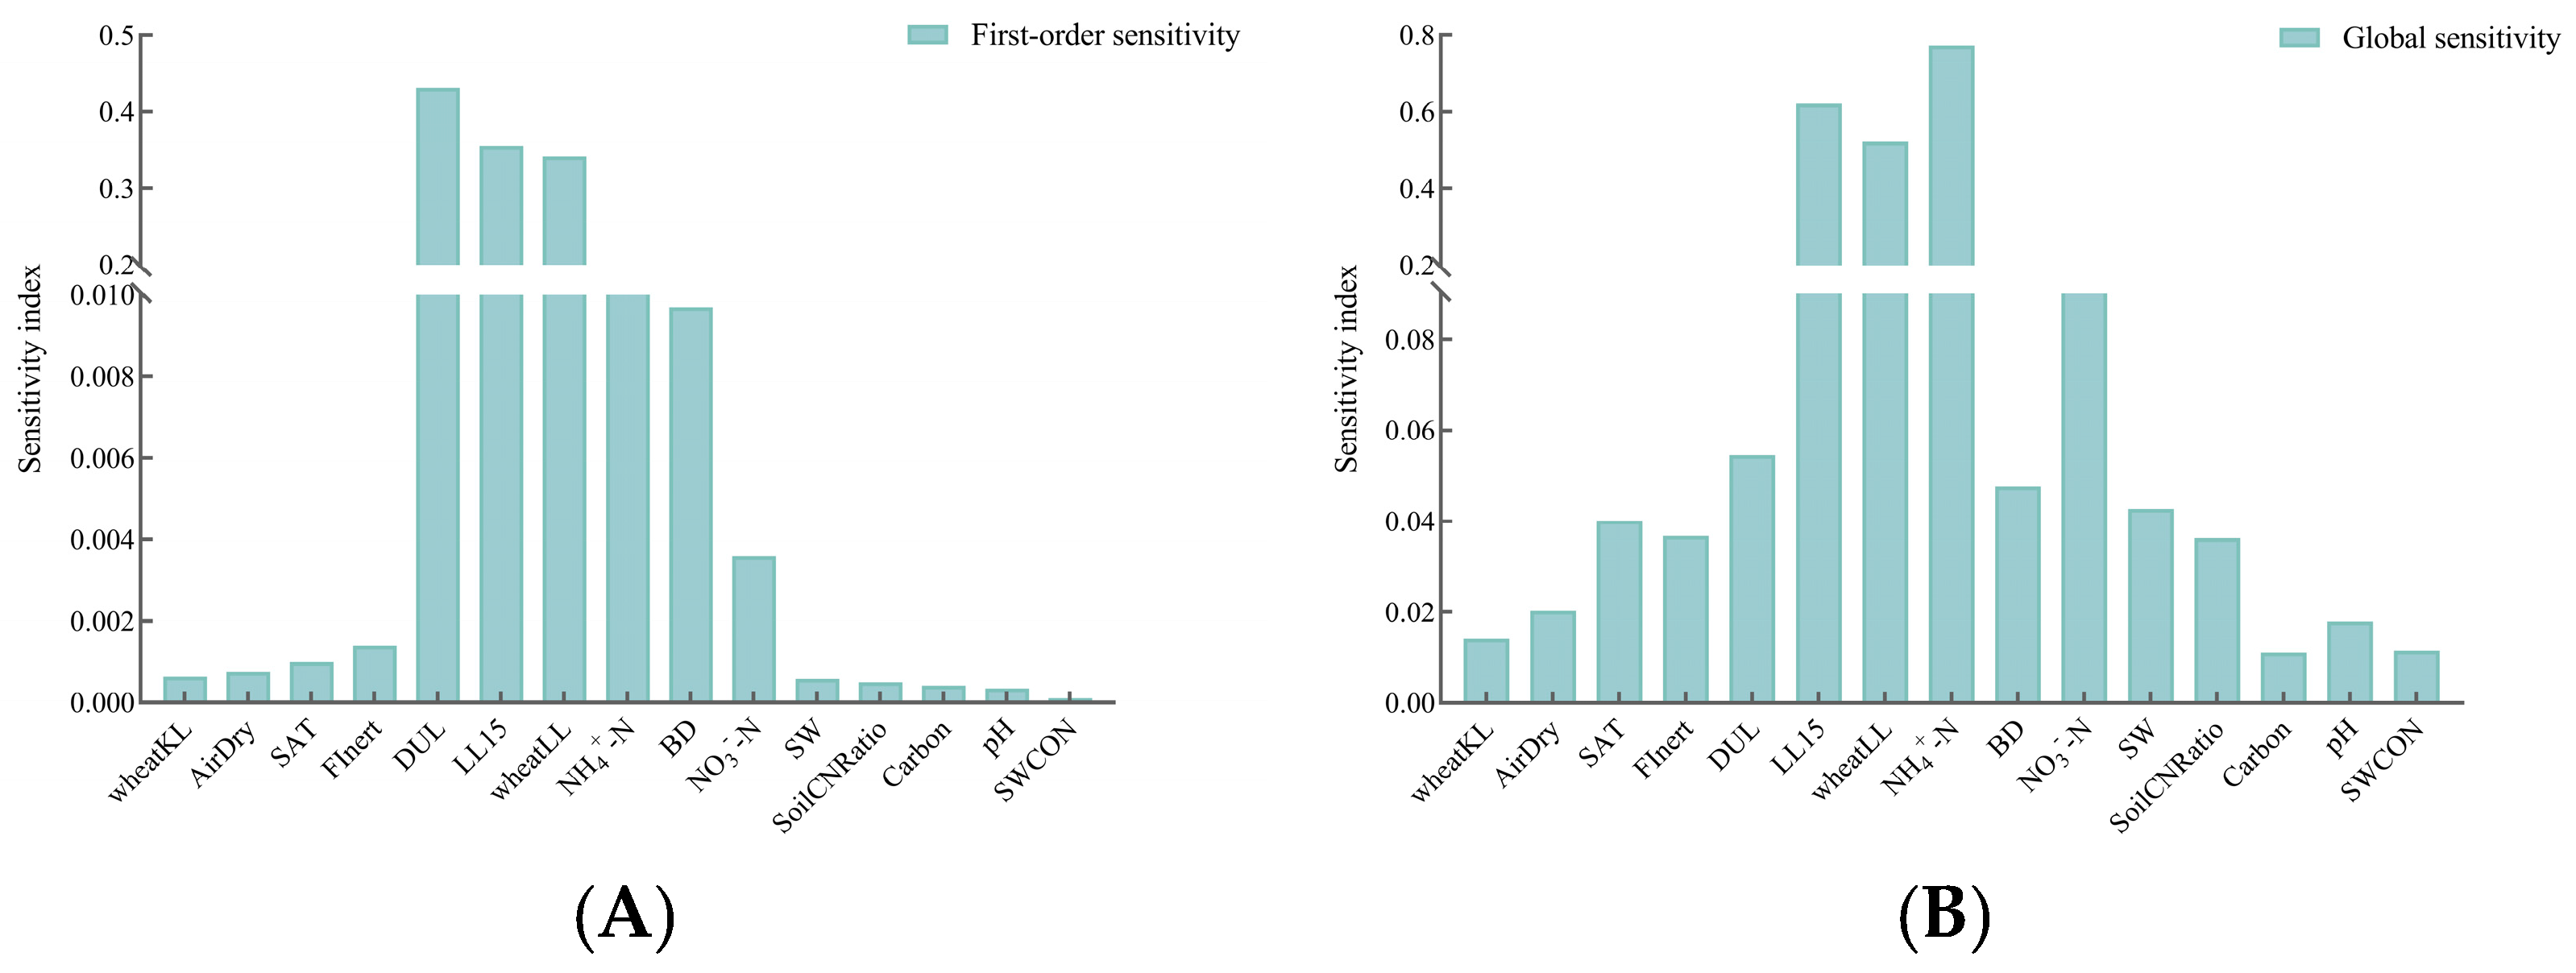
The first-order sensitivity analysis of soil parameters to N2O emissions simulated by the APSIM NG model is shown in Figure 5A, with three parameters having a first-order sensitivity index greater than 0.05: the lower effective moisture limit (LL15), Wilting coefficient (wheatLL), and ammonium nitrogen content (NH4+-N). The global sensitivity analysis is shown in Figure 5B, and there were four parameters with global sensitivity indices greater than 0.10: the lower effective moisture limit (LL15), Wilting coefficient (wheatLL), ammonium nitrogen content (NH4+-N), and nitrate nitrogen content (NO3−-N).

Figure 5.
First-order sensitivity indices (A) and global sensitivity indices (B) of soil parameters to N2O emissions from dry-crop wheat soils.
According to its sensitivity index ranking, the lower effective moisture limit (LL15) > Wilting coefficient (wheatLL) > ammonium nitrogen content (NH4+-N), it is evident that the soil moisture status is crucial for soil N2O emissions. Among them, the first-order sensitivity index corresponding to the lower effective moisture limit (LL15) reached 0.432, and the total sensitivity index also reached the highest at 0.620, which shows that this parameter itself and the interaction with other parameters have a great influence on the emission of soil N2O, and its contribution to the simulated N2O reached 62%. The first-order sensitivity indices of the Wilting coefficient (wheatLL) and ammonium nitrogen content (NH4+-N) were 0.356 and 0.342, respectively. The global sensitivity indices of the parameters’ Wilting coefficient (wheatLL) and ammonium nitrogen content (NH4+-N) were 0.523 and 0.773, which means that the contribution of the Wilting coefficient (wheatLL) and ammonium nitrogen content (NH4+-N) to the simulated N2O reached 52.3% and 77.3%, respectively, whereas the first-order sensitivity index of the parameter the nitrate nitrogen content (NO3−-N) was less than 0.05, while the global sensitivity index was 0.118, indicating that its effect on the soil N2O was mainly achieved through the interaction with other parameters, and its contribution to the simulated N2O reached 11.8%. In contrast, all other soil parameters were insensitive to the soil N2O emissions.
The detailed explanation of each soil parameter is shown in Table 2.
3.3. Sensitivity Analyses of Meteorological and Field Management Parameters
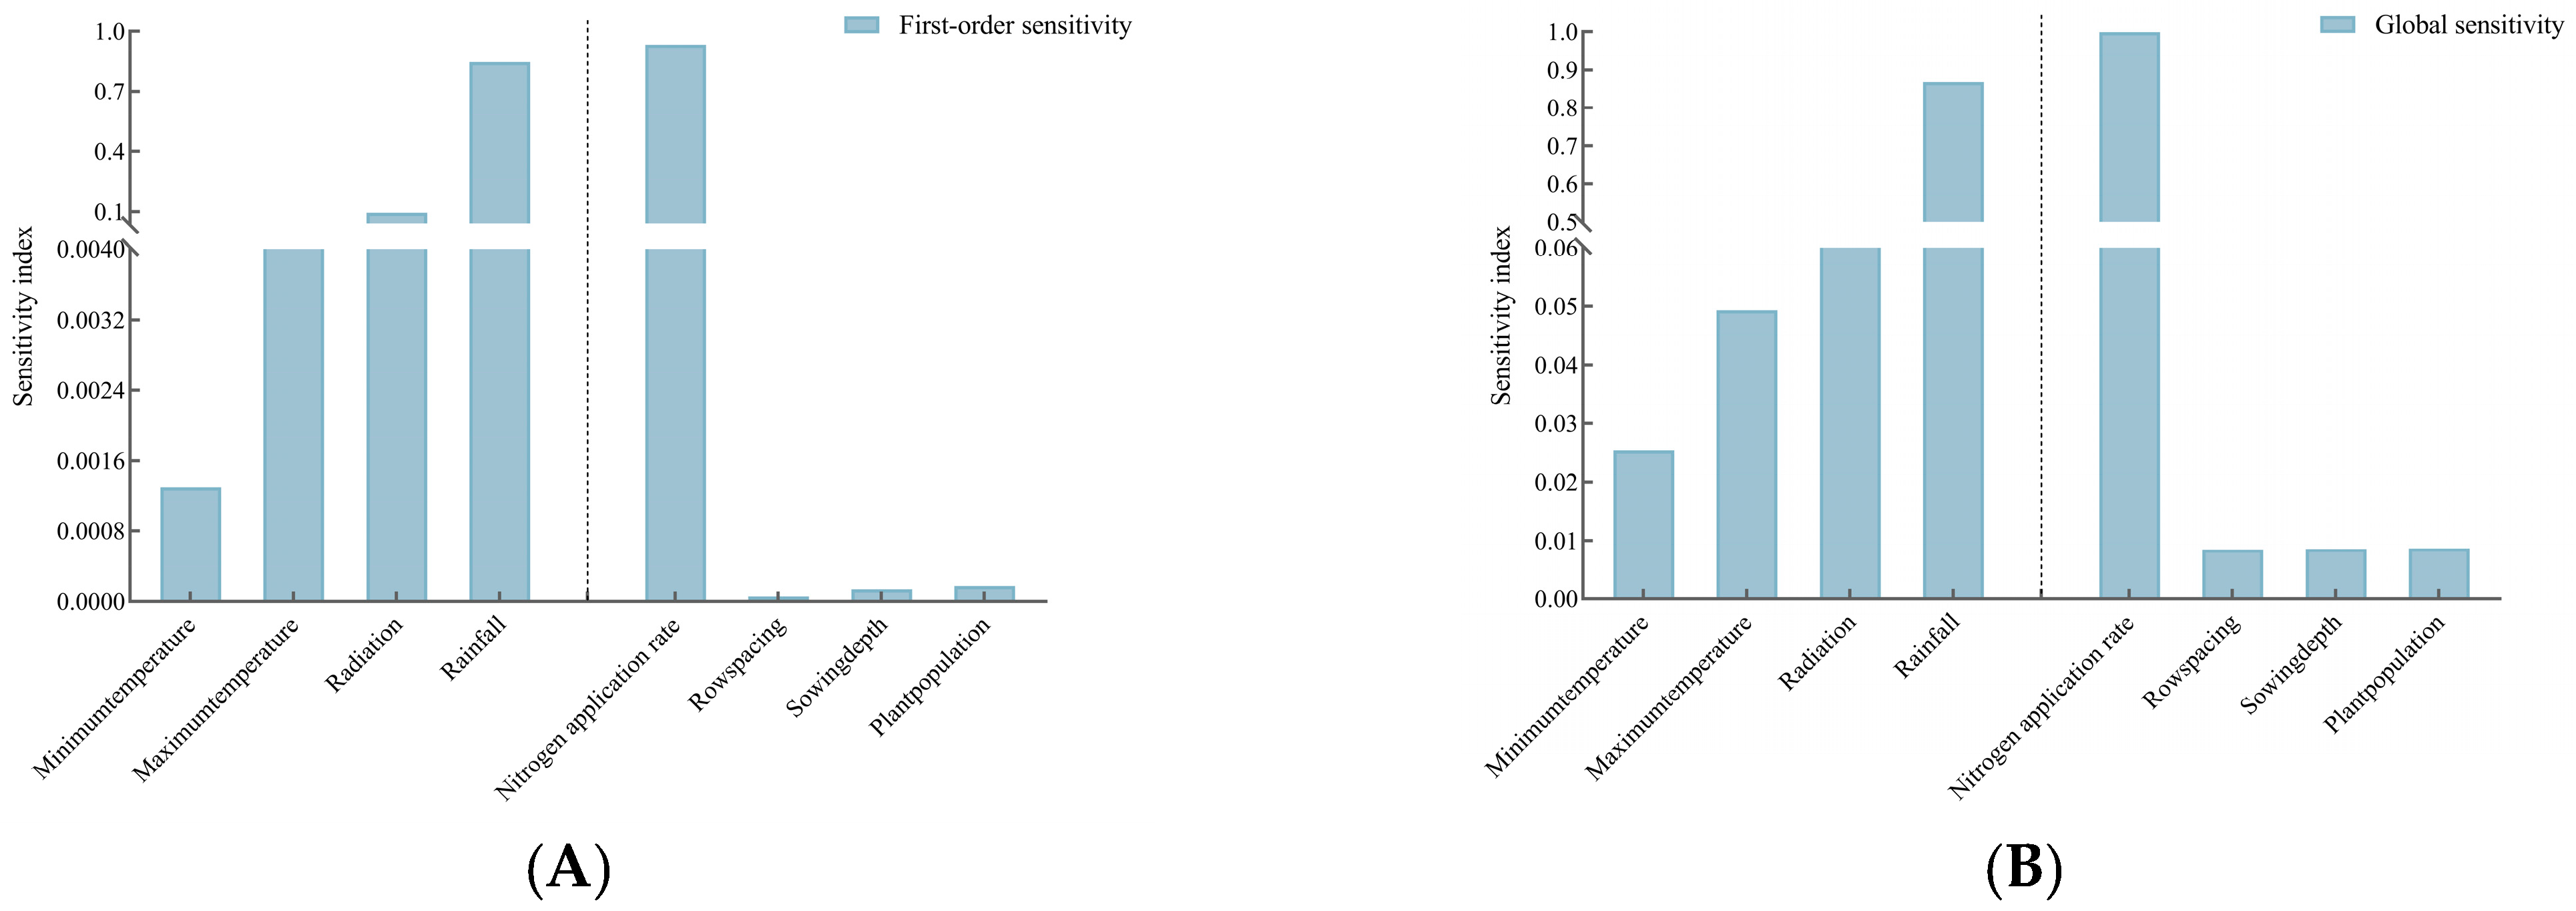
The first-order sensitivity analysis of meteorological parameters to N2O emissions simulated by the APSIM NG model is shown in Figure 6A, and the parameters with a first-order sensitivity index greater than 0.05 are rainfall and radiation. The global sensitivity analysis is shown in Figure 6B, and the parameters with a global sensitivity index greater than 0.10 are also rainfall and radiation. In terms of the sensitivity indices, the first-order sensitivity index of rainfall reaches 0.848 and the global sensitivity index reaches 0.868, which can contribute 86.8% of the modeled N2O uncertainty, and have a great influence on the soil N2O emission. The first-order sensitivity index of radiation is 0.094 and the global sensitivity index is 0.126, that is, radiation can contribute 12.6% of the modeled N2O uncertainty.
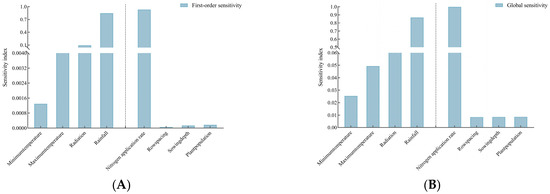
Figure 6.
First-order sensitivity indices (A) and global sensitivity indices (B) of meteorological parameters and field management parameters to soil N2O emissions from dry-crop wheat fields.
In contrast, the first-order sensitivity indices of the daily minimum temperature (minimum temperature) and daily maximum temperature (maximum temperature) were less than 0.05, and the global sensitivity index was less than 0.1, indicating that they were both insensitive to soil N2O emissions.
The first-order sensitivity analysis of field management parameters on N2O emissions simulated by the APSIM NG model is shown in Figure 6A, and the parameter with a first-order sensitivity index greater than 0.05 is the nitrogen application rate. The global sensitivity analysis is shown in Figure 6B, and the parameter with a global sensitivity index greater than 0.10 is also the nitrogen application rate. From the sensitivity indices, the first-order sensitivity index of the nitrogen application rate reached 0.932, and the global sensitivity index reached 0.999, which shows that this parameter itself and the interaction with other parameters have a great influence on soil N2O emissions, and its contribution to the simulated N2O reached 99.9%. In contrast, the first-order sensitivity indices of the sowing depth, row spacing, and plant population were less than 0.05, and the global sensitivity index was less than 0.1, indicating that they were not sensitive to soil N2O emissions.
The left side of the dotted line of the x-axis in the figure represents the meteorological parameters, and the right side of the dotted line represents the field management parameters. The detailed explanation of each meteorological parameter and field management parameter is shown in Table 3.
The global sensitivity analyses showed significant differences in the sensitivity of soil N2O emissions to the input parameters. The variability of the sensitivity indices for each parameter is demonstrated in Figure 3, Figure 4, Figure 5 and Figure 6. The EFAST method successfully identified the key parameters and their interactions, and the above results partially demonstrate the analysis of the sensitive parameters with high impacts, and the interactions between the key parameters are reflected through the global sensitivity indices.
4. Discussion
Based on the good performance of the APSIM NG model in simulating crop growth, soil carbon, nitrogen cycling, and N2O emissions, and the efficient computational efficiency of the EFAST method in the global sensitivity analysis of parameters is shown. In this study, the EFAST method was applied to effectively screen out the more sensitive parameters in the simulation of soil N2O emissions from dry-crop wheat fields by the APSIM NG model. From the results of the global sensitivity analyses of crop cultivar parameters, the leaf appearance rate, maximum nitrogen concentration of the grain, maximum leaf area, and thermal time from the starting grain-fill stage to the end grain-fill stage had a greater effect on the soil N2O gas emissions from wheat fields. The emission of soil N2O from wheat fields is a complex and integrated process interconnected with crop growth and development, and the APSIM NG model achieves the dynamic simulation of soil N2O emissions by simulating nitrogen transformation, nitrification, and denitrification processes [35]. The model simulates nitrification and denitrification concerning parameters related to the thermal temperature and nitrogen concentration. Xu et al. [41] used the APSIM Classic model to study the sensitivity of N2O emission parameters in a dry-crop wheat field and found that the thermal temperature from the seedling stage to the jointing stage, the thermal temperature at the early flowering stage, and the thermal temperature during the filling period were the crop cultivar parameters that affected the sensitivity of the N2O emission simulation. In contrast, in this study, the leaf appearance rate, maximum nitrogen concentration of grain, maximum leaf area, and thermal time from the starting grain-fill stage to the end grain-fill stage were found to be the crop cultivar parameters affecting the sensitivity of the N2O emission simulation, which is because the effects on the crop phenology are different in the APSIM Classic and APSIM NG models [42]; in the APSIM Classic model, the effect on the crop phenology is mainly designed based on the thermal temperature and photoperiod, while the APSIM NG model improves the original phenology model, in which the target thermal temperature at the reproductive stage of the crop is determined by the leaf area and the leaf appearance rate, and is no longer a fixed value [43]. In the APSIM NG model, the leaf appearance rate and leaf area determine the target thermal temperature, which in turn affects soil N2O emissions by influencing crop growth and development. In this study, we also found that the maximum N concentration of seeds had a greater effect on N2O emissions. According to the simulation mechanism of the irrigation process in the APSIM NG model, a higher N concentration of seeds means that more nitrogen is transported to the seeds during the initial stage of irrigation, which reduces the available nitrogen in the soil, and thus reduces the substrate concentration in the process of nitrification and denitrification, and affects the production of N2O.
The findings of a worldwide sensitivity analysis of soil parameters, the lower limit of effective moisture, Wilting coefficient, and ammonium nitrogen content have a greater effect on N2O emissions from wheat field soil. We can find that these parameters are all related to the soil moisture status and soil nitrogen patterns. The APSIM NG model simulates that N2O emission during nitrification and denitrification is related to the soil moisture factor, which affects the nitrification and denitrification of the plant root system to produce N2O emissions mainly by changing the aeration condition of the soil [44]. Soil moisture conditions close to the lower limit of effective moisture lead to decreased crop root vigor and a reduced nitrogen uptake, increasing nitrogen accumulation in the soil, providing more substrate for nitrification and denitrification by soil microorganisms, and affecting the production during the nitrification and denitrification processes of N2O [45]. The study of Huang et al. [46] also demonstrated a link between N2O production and the soil moisture status in dry-crop agricultural soils. According to the mechanism of nitrification and denitrification simulated by APSIM NG, it was found that the soil NH4+-N and NO3−-N contents would affect N2O emissions, and in this study, it was found that the ammonium nitrogen content had a greater effect on the soil N2O gas emissions in the wheat field, while there was no significant relationship with the nitrate nitrogen content. The reason may be due to the alkaline nature of the soil in the study area, under which ammonium nitrogen is more easily converted to nitrate nitrogen by microorganisms, which increases the concentration of nitrate nitrogen in the soil, thus providing more substrate for denitrification and affecting the emission of N2O [47]. In addition, this study found that the pH did not affect the soil N2O emissions, and the study of Čuhel et al. [48] also confirmed that soil N2O emissions were not related to the pH.
The results of the global sensitivity analysis of meteorological parameters showed that rainfall had the greatest effect on soil N2O emissions from wheat fields, and the study of An et al. [49] also confirmed that rainfall significantly affected soil N2O emissions from wheat fields. The APSIM NG model simulates N2O emissions concerning soil moisture status, where rainfall variations are modeled as daily modifications, and it can directly affect the soil water-filled pore space, and higher soil moisture can lead to an insufficient supply of oxygen in the soil, which promotes the denitrification process to produce N2O. In this study, radiation was also found to have a large effect on soil N2O emissions, which is consistent with the finding of Keane et al. [50] that effective solar radiation drives daily changes in N2O emission fluxes. In the model simulation of N2O emissions, higher solar radiation affects plant photosynthesis and growth, which accelerates the efficiency of the soil nitrogen uptake and reduces the substrate concentration for denitrification. The simulation of the N2O emission mechanism according to the APSIM NG model found that the temperature factor also affected soil N2O emissions, whereas the daily maximum and daily minimum temperatures were found to not affect soil N2O emissions in wheat fields in this study, which is inconsistent with the findings of Ma et al. [51]. This may be because under relatively stable soil moisture conditions soil microorganisms are more adapted to temperature, and temperature changes are usually more moderate in the range between the daily maximum and daily minimum temperatures, which do not significantly change N2O emissions [52].
The findings of the field management parameters’ sensitivity study revealed that the nitrogen application rate had the greatest effect on soil N2O emissions from wheat fields, and the study of Li et al. [29] also confirmed that N2O emissions were significantly correlated with the nitrogen application. The APSIM NG model was able to simulate the dynamics of nitrate nitrogen and ammonium nitrogen in the soil, and a higher nitrogen application would promote nitrification, which would provide more substrate for denitrification, leading to the increase in soil N2O emissions. In contrast, this study found that the effects of the sowing depth, sowing spacing, and planting density on soil N2O emissions were not significant. This is because the simulation of soil N2O emission in the APSIM NG model is mainly achieved by simulating nitrogen mineralization and fixation, nitrification, and denitrification. Although these parameters have a certain effect on plant growth and development, they have a weaker effect on nitrogen cycling and N2O emission in soil compared with precipitation and nitrogen applications.
The APSIM NG model’s parameters in this investigation, that have a strong influence on soil N2O gas emissions from dry-crop wheat fields, were identified through global sensitivity analyses. When conducting parameter localization rate setting, the more sensitive parameters need to be adapted according to the actual situation of the region. Therefore, when using the APSIM NG model to optimize and adjust the parameters, these more influential parameters can be prioritized to provide a reference basis for the applicability of the model in the regionalization process as well as the accuracy of the N2O emission prediction. This study’s primary drawback is that it was carried out using soil types and climatic conditions in a specific region, which limits the general applicability of the results. Future studies should consider conducting a wider range of experiments in different regions to validate and extend the findings of this study.
5. Conclusions
In this study, we applied the APSIM NG model and the EFAST method to assess the global sensitivities of parameters related to soil N2O emissions from dry-crop wheat fields in the semi-arid zone of the Loess Plateau in Longzhong, China. Using the EFAST sensitivity criteria ( > 0.05 and > 0.10), we identified the parameters that had a significant effect on the model-simulated soil N2O emissions, including crop cultivar parameters (the leaf appearance rate (BasePhyllochron), maximum leaf area (AreaLargestLeaves), maximum nitrogen concentration of the grain (Grain-MaximumNConc), and thermal time from the starting grain-fill stage to the end grain-fill stage (GrainFillingTT)), soil parameters (the lower effective moisture limit (LL15), Wilting coefficient (wheatLL), and ammonium nitrogen content (NH4+-N)), meteorological parameters (rainfall and radiation), and field management parameters (the nitrogen application rate). By precisely locating these sensitive parameters, one can provide a certain reference basis for the parameter rate determination of N2O emissions from soil in dry-crop wheat fields simulated by the APSIM NG model. This not only facilitates the rapid localization of the model, but also guides the subsequent optimization of the model parameters.
Author Contributions
Y.L.: Investigation, Data curation, Software, Methodology, Writing—original draft. Y.Y.: Investigation, Formal analysis, Writing—comments and editing. M.D.: Investigation, writing, commenting and editing. L.D.: Visualization, writing—comments and editing. J.Y.: Supervision, methodology, resources, writing—review and editing. G.L.: Conceptualization, validation, project management, investigation, Writing—review and editing. All authors have read and agreed to the published version of the manuscript.
Funding
This study was supported by the National Natural Science Foundation of China (32360438) and the Gansu Provincial Leading Talent Project (GSBJLJ-2023-09).
Data Availability Statement
Data will be made available on request.
Acknowledgments
We would like to express our sincere thanks to all those who carried out the experimental work on the data underlying this study.
Conflicts of Interest
The authors declare that the research was conducted in the absence of any commercial or financial relationships that could be construed as a potential conflict of interest.
References
- Milam-Guerrero, J.; Yang, B.; To, D.T.; Myung, N.V. Nitrous oxide is no laughing matter: A historical review of nitrous oxide gas-sensing capabilities highlighting the need for further exploration. ACS Sens. 2022, 7, 3598–3610. [Google Scholar] [CrossRef]
- Wuebbles, D.J. Nitrous oxide: No laughing matter. Science 2009, 326, 56–57. [Google Scholar] [CrossRef] [PubMed]
- Zhen, W.; Tang, Y.; Wang, H.; Qin, Q. Crop-specific embodied greenhouse gas emissions inventory for 28 staple crops in China from 2007 to 2017. Sci. Data 2025, 12, 421. [Google Scholar] [CrossRef] [PubMed]
- Denman, K.L.; Brasseur, G.; Chidthaisong, A.; Ciais, P.; Cox, P.M.; Dickinson, R.E.; Hauglustaine, D.; Heinze, C.; Holland, E.; Jacob, D.; et al. Couplings between Changes in the Climate System and Biogeochemistry. In Climate Change 2007: The Physical Science Basis. Contribution of Working Group I to the Fourth Assessment Report of the Intergovernmental Panel on Climate Change; Cambridge University Press: Cambridge, UK; New York, NY, USA, 2007; pp. 499–587. [Google Scholar]
- Wang, K.; Shi, L.; Ma, L.; Wang, S.; Zhang, R.; Li, Z.; Zhai, B. Emission characteristics and microbiological properties of N2O from wheat field soil in the dry zone of Northwest China under organic-inorganic dosing. Environ. Sci. 2021, 42, 6038–6046. [Google Scholar] [CrossRef]
- Smith, P.; Gregory, P.J. Climate change and sustainable food production. Proc. Nutr. Soc. 2013, 72, 21–28. [Google Scholar] [CrossRef]
- Keating, B.A.; Carberry, P.S.; Hammer, G.L.; Probert, M.E.; Robertson, M.J.; Holzworth, D.; Huth, N.I.; Hargreaves, J.N.G.; Meinke, H.; Hochman, Z.; et al. An overview of APSIM, a model designed for farming systems simulation. Eur. J. Agron. 2003, 18, 267–288. [Google Scholar] [CrossRef]
- Lagerquist, E.; Vogeler, I.; Kumar, U.; Bergkvist, G.; Lana, M.; Watson, C.A.; Parsons, D. Assessing the effect of intercropped leguminous service crops on main crops and soil processes using APSIM NG. Agric. Syst. 2024, 216, 103884. [Google Scholar] [CrossRef]
- Liang, H.; Hu, K.L.; Li, B.G.; Liu, H.T. Construction of a coupled model for hydrothermal carbon and nitrogen processes in soil-crop-atmosphere system. J. Agric. Eng. 2014, 30, 54–66. [Google Scholar]
- Steduto, P.; Hsiao, T.C.; Raes, D.; Fereres, E. AquaCrop—The FAO Crop Model to Simulate Yield Response to Water: I. Concepts and Underlying Principles. Agron. J. 2009, 101, 426–437. [Google Scholar] [CrossRef]
- Stöckle, C.O.; Donatelli, M.; Nelson, R. CropSyst, a cropping systems simulation model. Eur. J. Agron. 2003, 18, 289–307. [Google Scholar] [CrossRef]
- Tan, J. Research on the Sensitivity and Uncertainty Analysis Method of Crop Model Parameters. Ph.D. Thesis, Wuhan University, Wuhan, China, 2018. [Google Scholar]
- Zhao, G.; Bryan, B.A.; Song, X. Sensitivity and uncertainty analysis of the APSIM-wheat model: Interactions between cultivar, environmental, and management parameters. Ecol. Model. 2014, 279, 1–11. [Google Scholar] [CrossRef]
- Khorashadi Zadeh, F.; Nossent, J.; Sarrazin, F.; Pianosi, F.; Van Griensven, A.; Wagener, T.; Bauwens, W. Comparison of variance-based and moment-independent global sensitivity analysis approaches by application to the SWAT model. Environ. Model. Softw. 2017, 91, 210–222. [Google Scholar] [CrossRef]
- Confalonieri, R.; Bellocchi, G.; Tarantola, S.; Acutis, M.; Donatelli, M.; Genovese, G. Sensitivity analysis of the rice model WARM in Europe: Exploring the effects of different locations, climates and methods of analysis on model sensitivity to crop parameters. Environ. Model. Softw. 2010, 25, 479–488. [Google Scholar] [CrossRef]
- Saltelli, A.; Annoni, P. How to avoid a perfunctory sensitivity analysis. Environ. Model. Softw. 2010, 25, 1508–1517. [Google Scholar] [CrossRef]
- Yang, J.; Si, L.; Li, J.; Xin, W.; Zhao, B.; Wei, B. Sensitivity analysis and compensation for tooth surface deviation of spiral bevel gear machine tool. Sci. Rep. 2024, 14, 22736. [Google Scholar] [CrossRef]
- Confalonieri, R. Monte Carlo based sensitivity analysis of two crop simulators and considerations on model balance. Eur. J. Agron. 2010, 33, 89–93. [Google Scholar] [CrossRef]
- Makowski, D.; Naud, C.; Jeuffroy, M.-H.; Barbottin, A.; Monod, H. Global sensitivity analysis for calculating the contribution of genetic parameters to the variance of crop model prediction. Reliab. Eng. Syst. Saf. 2006, 91, 1142–1147. [Google Scholar] [CrossRef]
- Kamali, B.; Abbaspour, K.C.; Lehmann, A.; Wehrli, B.; Yang, H. Uncertainty-based auto-calibration for crop yield-the EPIC+ procedure for a case study in sub-Saharan Africa. Eur. J. Agron. 2018, 93, 57–72. [Google Scholar] [CrossRef]
- Sexton, J.; Everingham, Y.L.; Inman-Bamber, G. A global sensitivity analysis of cultivar trait parameters in a sugarcane growth model for contrasting production environments in Queensland. Aust. Eur. J. Agron. 2017, 88, 96–105. [Google Scholar] [CrossRef]
- Liu, J.; Liu, Z.; Zhu, A.-X.; Shen, F.; Lei, Q.; Duan, Z. Global sensitivity analysis of the APSIM-Oryza rice growth model under different environmental conditions. Sci. Total Environ. 2019, 651, 953–968. [Google Scholar] [CrossRef]
- Cheng, S.; Li, G.; Yao, Y.; Yuan, J.; He, J. DNDC model simulation of soil N2O emission and its sensitivity analysis in dry-cropped wheat field under different fertilizer application levels. J. Gansu Agric. Univ. 2024, 59, 44–54. [Google Scholar] [CrossRef]
- Holzworth, D.P.; Huth, N.I.; deVoil, P.G.; Zurcher, E.J.; Herrmann, N.I.; McLean, G.; Chenu, K.; Van Oosterom, E.J.; Snow, V.; Murphy, C.; et al. APSIM-Evolution towards a new generation of agricultural systems simulation. Environ. Model. Softw. 2014, 62, 327–350. [Google Scholar] [CrossRef]
- Che, P.; Liu, Q.; Wang, J.; Gao, X.; Han, X. Effects of nitrogen application on spring wheat yield in Longzhong dryland under different tillage practices simulated by APSIM-based model. Trop. Agric. Eng. 2023, 47, 79–86. [Google Scholar]
- Hao, S.; Ryu, D.; Western, A.; Perry, E.; Bogena, H.; Franssen, H.J.H. Performance of a wheat yield prediction model and factors influencing the performance: A review and meta-analysis. Agric. Syst. 2021, 194, 103278. [Google Scholar] [CrossRef]
- He, L.; Zhao, G.; Jin, N.; Zhuang, W.; Yu, Q. Global sensitivity analysis of parameters of APSIM-Wheat model in different climatic zones and at different yield levels. J. Agric. Eng. 2015, 31, 148–157. [Google Scholar]
- Ma, C.; Cai, H.; Lu, Y. Emission of N2O under different water nitrogen treatments based on APSIM model. J. Irrig. Drain. 2020, 39, 120–129. [Google Scholar] [CrossRef]
- Li, J.; Wang, L.; Luo, Z.; Wang, E.; Wang, G.; Zhou, H.; Li, H.; Xu, S. Reducing N2O emissions while maintaining yield in a wheat–maize rotation system modelled by APSIM. Agric. Syst. 2021, 194, 103277. [Google Scholar] [CrossRef]
- Holzworth, D.; Huth, N.I.; Fainges, J.; Brown, H.; Zurcher, E.; Cichota, R.; Verrall, S.; Herrmann, N.I.; Zheng, B.; Snow, V. APSIM Next Generation: Overcoming challenges in modernising a farming systems model. Environ. Model. Softw. 2018, 103, 43–51. [Google Scholar] [CrossRef]
- Gaydon, D.S.; Balwinder-Singh Wang, E.; Poulton, P.L.; Ahmad, B.; Ahmed, F.; Akhter, S.; Ali, I.; Amarasingha, R.; Chaki, A.K.; Chen, C.; et al. Evaluation of the APSIM model in cropping systems of Asia. Field Crops Res. 2017, 204, 52–75. [Google Scholar] [CrossRef]
- Zheng, B.; Chenu, K.; Doherty, A.; Chapman, S. The APSIM wheat module (7.5 R3008). Agric. Prod. Syst. Simulator (APSIM) Initiat. 2014, 615, 3–8. Available online: https://www.apsim.info/wp-content/uploads/2019/09/WheatDocumentation.pdf (accessed on 3 October 2023).
- Thorburn, P.J.; Biggs, J.S.; Collins, K.; Probert, M.E. Using the APSIM model to estimate nitrous oxide emissions from diverse Australian sugarcane production systems. Agric. Ecosyst. Environ. 2010, 136, 343–350. [Google Scholar] [CrossRef]
- Del Grosso, S.J.; Parton, W.J.; Mosier, A.R.; Ojima, D.S.; Kulmala, A.E.; Phongpan, S. General model for N2O and N2 gas emissions from soils due to dentrification. Glob. Biogeochem. Cycles 2000, 14, 1045–1060. [Google Scholar] [CrossRef]
- Verburg, K.; Pasley, H.R.; Biggs, J.S.; Vogeler, I.; Wang, E.; Mielenz, H.; Snow, V.O.; Smith, C.J.; Pasut, C.; Basche, A.D.; et al. Review of APSIM’s soil nitrogen modelling capability for agricultural systems analyses. Agric. Syst. 2025, 224, 104213. [Google Scholar] [CrossRef]
- Thorburn, P.J.; Meier, E.A.; Probert, M.E. Modelling nitrogen dynamics in sugarcane systems: Recent advances and applications. Field Crops Res. 2005, 92, 337–351. [Google Scholar] [CrossRef]
- Saltelli, A.; Tarantola, S.; Chan, K.P.-S. A quantitative model-independent method for global sensitivity analysis of model output. Technometrics 1999, 41, 39–56. [Google Scholar] [CrossRef]
- Li, Z.; Jin, X.; Liu, H.; Xu, X.; Wang, J. Global sensitivity analysis of wheat grain yield and quality and the related process variables from the DSSAT-CERES model based on the extended Fourier amplitude sensitivity test method. J. Integr. Agric. 2019, 18, 1547–1561. [Google Scholar] [CrossRef]
- DeJonge, K.C.; Ascough, J.C.; Ahmadi, M.; Andales, A.A.; Arabi, M. Global sensitivity and uncertainty analysis of a dynamic agroecosystem model under different irrigation treatments. Ecol. Model. 2012, 231, 113–125. [Google Scholar] [CrossRef]
- Deng, X.; Dong, L.; Li, G.; Nie, Z.G.; Xu, J.J.; Wang, J.; Lu, Y.L. Global sensitivity analysis of Apsim-Wheat model parameters in northwest spring wheat region. J. Triticeae Crops 2022, 42, 746–754. [Google Scholar]
- Xu, Z.; Dong, L.; Li, G.; Yan, Z.; Wang, J.; Nie, Z.; Lu, Y. Global sensitivity analysis of N2O emission from APSIM model based on EFAST method. Agric. Res. Arid Reg. 2024, 42, 244–251. [Google Scholar]
- Brown, H.E.; Huth, N.I.; Holzworth, D.P. The APSIM Wheat Model (Version 2023.7.7280.0). Available online: https://www.apsim.info (accessed on 28 October 2023).
- Zhang, M.; Gao, Y.; Zhang, Y. Sensitivity study and model calibration validation of APSIM NG model for winter wheat under different sowing density and irrigation management. Chin. J. Ecol. Agric. 2023, 31, 102–112. (In English) [Google Scholar]
- Davidson, E.A.; Swank, W.T. Environmental Parameters Regulating Gaseous Nitrogen Losses from Two Forested Ecosystems via Nitrification and Denitrification. Appl. Environ. Microbiol. 1986, 52, 1287–1292. [Google Scholar] [CrossRef] [PubMed]
- Liu, R.; He, J.; Zhang, L. Characteristics of nitrification/denitrification and its functional microorganisms under different moisture conditions in paddy soil. Environ. Sci. 2014, 35, 4275–4283. [Google Scholar] [CrossRef]
- Huang, G.; Chen, K.; Han, B.; Van Cleemput, O. Soil water content and N2O production pathways. J. Appl. Ecol. 1999, 9, 55–58. [Google Scholar]
- Xu, H.; Li, N.; Feng, Y.; Ren, G.; Xie, C.; Lv, H.; Ma, X.; Hao, J. Effects of nitrogen fertiliser and straw return on N2O emission from wheat and jade rotational cropping soils. Environ. Sci. 2020, 41, 5668–5676. [Google Scholar] [CrossRef]
- Čuhel, J.; Šimek, M.; Laughlin, R.J.; Bru, D.; Chèneby, D.; Watson, C.J.; Philippot, L. Insights into the Effect of Soil pH on N2O and N2 Emissions and Denitrifier Community Size and Activity. Appl. Environ. Microbiol. 2010, 76, 1870–1878. [Google Scholar] [CrossRef] [PubMed]
- An, Y.; Gu, Z.; Jiao, X.; Wei, Q.; Xu, J.; Liu, K. Enhanced N2O Emissions from Winter Wheat Field Induced by Winter Irrigation in the North China Plain. Agronomy 2022, 12, 955. [Google Scholar] [CrossRef]
- Keane, B.J.; Ineson, P.; Vallack, H.W.; Blei, E.; Bentley, M.; Howarth, S.; McNamara, N.P.; Rowe, R.L.; Williams, M.; Toet, S. Greenhouse gas emissions from the energy crop oilseed rape (Brassica napus); the role of photosynthetically active radiation in diurnal N2O flux variation. GCB Bioenergy 2018, 10, 306–319. [Google Scholar] [CrossRef]
- Ma, C.; Liu, Y.; Wang, J.; Xue, L.; Hou, P.; Xue, L.; Yang, L. Warming increases the N2O emissions from wheat fields but reduces the wheat yield in a rice-wheat rotation system. Agric. Ecosyst. Environ. 2022, 337, 108064. [Google Scholar] [CrossRef]
- Ran, M.; Ding, J.; Sun, D.; Gu, F. A review of the characteristics of soil respiration in response to temperature and moisture changes under global climate change. Chin. Agric. Meteorol. 2024, 45, 1–11. [Google Scholar]
Disclaimer/Publisher’s Note: The statements, opinions and data contained in all publications are solely those of the individual author(s) and contributor(s) and not of MDPI and/or the editor(s). MDPI and/or the editor(s) disclaim responsibility for any injury to people or property resulting from any ideas, methods, instructions or products referred to in the content. |
© 2025 by the authors. Licensee MDPI, Basel, Switzerland. This article is an open access article distributed under the terms and conditions of the Creative Commons Attribution (CC BY) license (https://creativecommons.org/licenses/by/4.0/).