Article

Responses of Nitrogen Metabolism Pathways to Low-Phosphorus Stress: Decrease in Nitrogen Accumulation and Alterations in Protein Metabolism in Soybeans

Soybean Research Institute, Heilongjiang Academy of Agricultural Sciences, Harbin 150086, China
*
Author to whom correspondence should be addressed.
Agronomy 2025, 15(4), 836; https://doi.org/10.3390/agronomy15040836
Submission received: 16 February 2025 / Revised: 10 March 2025 / Accepted: 26 March 2025 / Published: 27 March 2025
(This article belongs to the Section Plant-Crop Biology and Biochemistry)

Abstract

:
Phosphorus is an indispensable nutrient for nitrogen metabolism in soybeans. In this study, two P levels were established, 1 mg/L (low-P stress) and 31 mg/L (normal P, CK), by combining 15N labeling with real-time quantitative PCR and the UHPLC-MS/MS method, to analyze soybean nitrogen accumulation, 15N abundance, nodule nitrogen fixation accumulation, nodule nitrogen fixation rate, soluble protein content, the relative expression of phosphorus transporters, amino acid changes, and metabolic pathways. The impacts of phosphorus stress on soybean nitrogen metabolism were explored from the perspectives of nitrogen accumulation and protein metabolism. The results demonstrated that low-P stress promoted the absorption of fertilizer nitrogen by aboveground parts, roots, and nodules of soybeans. However, it significantly inhibited nitrogen accumulation (11.09–95.41%), nodule nitrogen fixation accumulation (21.54–96.21%), and nodule nitrogen fixation rate (2.95–37.75%). The soluble protein content in both leaves and nodules decreased remarkably, while the relative expression of GmPT7 was upregulated in leaves, roots, and nodules under low-P stress. A total of 70 amino acids exhibited alterations, among which 26 amino acids were involved in 37 metabolic pathways, playing a crucial role in regulating the effects of low-P stress on soybean nitrogen metabolism. This study identifies significant alterations in nitrogen accumulation, nodule nitrogen fixation, and the expression of phosphorus transporter genes, providing insights into the metabolic pathways involved in soybean’s adaptation to phosphorus deficiency. This research provides a solid theoretical foundation for further in-depth investigations into the physiological and molecular mechanisms of soybean response to low-P stress.

1. Introduction

Soybean (Glycine max L.) originating in China is a widely grown crop worldwide, renowned as an important food and economic crop [1]. Phosphorus (P) is an essential major element accounting for about 0.2–1.1% of the dry weight of plants [2], and plays key roles in photosynthesis, respiration, and energy transformation in plants [3,4,5,6]. Nevertheless, approximately 43% of arable land worldwide suffers from phosphorus deficiency, with phosphorus-deficient farmland accounting for about two-thirds of total farmland area in China, and about 30% of arable land has only 3–5 mg·kg−1 of soil available P [7,8]. Consequently, due to the limited availability of P and its low mobility in soil, the growth and yield of crops are sometimes restricted [9].
Soybeans are phosphorus-loving crops. The rational application of phosphorus fertilizer can effectively regulate the growth and development of soybean nodules, enhance the nitrogen fixation ability of nodules, and promote plant growth, thereby facilitating nitrogen utilization and increasing yield [10]. The nitrogen fixation process requires a substantial amount of energy and has a high requirement for phosphorus. As a result, it is especially sensitive to P deficiency [10]. P deficiency reduces the weight of soybean plants, resulting in a nearly 50% decrease in the fresh and dry weight of nodules [11]. Isaac et al. applied 15N labeling to Acacia senegal under low-, mid-, and high-P supply levels and found that the total biomass and nitrogen content increased significantly with increasing P supply [12]. A study on the interactions between N and P was conducted with 18 soybean varieties, and the results demonstrated that low-P stress reduced nitrogen accumulation and nodule nitrogen fixation in soybean plants [13].
P, being one of the important mineral nutrients in plants, is involved in regulating numerous changes throughout plant growth and development [14], such as protein metabolism [15,16,17]. Thus, plants will activate a series of adaptive mechanisms to ensure normal growth and development under low-phosphorus stress [18]. Proteomic analysis has identified a large number of differentially accumulated proteins (DAPs) that respond to P availability. This analysis revealed that plants can also respond to P stress at the protein level, especially in terms of the protein modification level [19,20,21,22].
The assimilation of phosphate encompasses its absorption from soil by roots, along with its transport and transformation in plants. The phosphate transport system is of great significance in the process of phosphate assimilation. Regulating phosphate transporters (PTs) to influence the uptake and transport of P in plants represents a crucial physiological and molecular strategy for enhancing P uptake and utilization efficiency [23]. Phosphorus transporters are high-affinity transporters, and the absorption, transport, and reactivation of phosphate in plants are predominantly mediated by phosphate transporters in the plasma membrane [24]. Phosphorus can be absorbed from soil or transported within the plant via phosphate transport genes [25,26,27]. Low-P stress induces the expression of PTs in the roots of leguminous crops [28], including soybean Pht1 family, alfalfa MtPT1 and MtPT2 genes, bean PvIDS4-like genes, PvPS2 and PvPT1 genes [29], pea PsPT1 and PsPT4 genes [30], and Lotus root LjMAMI and LjPT4 genes [31]. Recently identified PTs play a vital role in the response to low-P stress in crops, such as ZmPT7 [32], OsPHT1;1 [33], OsPHT1;2 [34], OsPHT1;7 [35], TaPT2 [36], TaPHT1;9-4B [37], GmPT4 [38], and VPT5 [39]. Soybeans may optimize P absorption and transport capabilities by upregulating the expression of transporter genes [40].
Phosphorus nutrition plays a beneficial role in increasing the concentration of essential amino acids and the proportion of unsaturated fatty acids, significantly increasing the content of nodule nitrogen fixation, protein, sugar, and amino acids [41], thus enhancing the quality of soybeans [42]. Primary metabolites in the roots of plants grown under P-deficiency have been shown previously to involve amino acids, organic acids, polyhydroxy acids, fatty acids, sugars, sugar phosphates, polyols, and other nitrogenous compounds [43]. Sulieman et al. found that as P supply levels declined, the content of free total amino acids and 17 amino acids in the phloem of alfalfa roots increased; moreover, the elevation of asparagine levels transferred from roots to nodules and downregulated nitrogenase activity [10]. Low-P stress promotes the synthesis of amino acids in nodules of lupin and inhibits the synthesis of amino acids in soybean nodules, which suggests that lupin may be more suitable than soybean for maintaining biological nitrogen fixation during short-term P deficiency [44].
Yao et al. conducted research on the effects of P levels on nitrogen accumulation and metabolites in soybean nodules during the nutritional growth stage [45,46]. This study further investigated the effects of P stress from the seedling stage to the grain filling stage on nitrogen accumulation and protein metabolism in soybean, providing a theoretical basis for further understanding the physiological and molecular mechanisms of P stress on soybean nitrogen metabolism.

2. Materials and Methods

2.1. Plant Materials and Sampling

This experiment was carried out at the experimental base of Heilongjiang Academy of Agricultural Sciences, Harbin city, Heilongjiang Province, China (127°3′ E, 46°9′ N), in 2022 and 2023. Soybean (Suinong 14, SN14) plants were grown in pots filled with sand medium. The nutrient composition and concentration (mg/L) of the nutrient solution were as follows: (NH4)2SO4, 235.80; MgSO4, 240.00; CaCl2, 220.00; Na2MoO4·H2O, 0.03; CuSO4·5H2O, 0.08; ZnSO4·7H2O, 0.22; MnCl2·4H2O, 4.90; H3BO3, 2.86; FeSO4·7H2O, 5.57; and Na2EDTA, 7.45. The P levels were as follows: P1 (P stress), KH2PO4, 4.39, K2SO4, 42.00, and KCl, 36.00, and P31 (normal P, CK), KH2PO4, 136.00. The nitrogen source was 15N-labeled ammonium sulfate with an abundance of 3.38%.
Before the vegetative cotyledon stage (VC, unfolded cotyledons), only 500 mL of distilled water were supplied to plants once per day. From the VC stage and thereafter, different P treatments were applied until the R5 stage, and the 500 mL nutrient solution was supplied once a day before R1 (flowering stage) and two times a day after R1.
Rhizobium inoculation was performed when opposite true leaves completely opened as follows: field soybean nodules from plants grown in Harbin, Heilongjiang Province, were collected during the previous year and stored in a refrigerator. They were ground and added to the nutrient solution, at a rate of approximately 5 g of nodules per liter. Inoculation of soybean plants was performed on five consecutive days to ensure that each plant was well inoculated.
Samples (3 replicates for each treatment) were taken from 8:00 to 10:00 am every 7 days from the start of P stress treatment until the R5 stage, and the plants were divided into two parts, above ground and underground, at the cotyledon scars. After determining the fresh weight of the aboveground part, it was dried at 65 °C, and the dry weight was measured. The nitrogen content and 15N abundance of the dried sample enabled the calculation of nitrogen accumulation, nodule nitrogen accumulation, and nodule nitrogen fixation rates.
Leaves, roots, and nodules were collected three times (3 replicate samples for each treatment) after the 7th, 14th, and 21st day of P stress treatment, frozen immediately in liquid nitrogen, stored at −80 °C, and then used for soluble protein content, GmPT7 real-time quantitative PCR, and amino acid target metabolomics analysis.

2.2. Measurement and Calculation Methods

For the determination of nitrogen content in plants, K2SO4 and CuSO4 were used as catalysts, with concentrated sulfuric acid (H2SO4) for digestion, and the nitrogen content was measured by an automatic Kjeldahl nitrogen analyzer. 15N abundance determination: The 15N abundance was measured by a mass spectrometer (Thermo-Fisher Delta V Advantage IRMS, Waltham, MA, USA) in dual-inlet (DI) mode.
Total Nitrogen Accumulation (TNA) = Dry matter × Nitrogen content
Fertilizer Nitrogen Accumulation (FNA) = TNA × (15N abundance of sample)/15N abundance of fertilizer
Nodule Nitrogen Fixation Accumulation (NNFA) = TNA − FNA
Ratio of Nodule Nitrogen Fixation (RNNF) = (TNA − FNA)/TNA
Statistical analyses were conducted using the SPSS 19.0 (SPSS Inc., Chicago, IL, USA) procedure. t-tests were used to analyze the comparison between two sets of data.

2.3. Soluble Protein Content Detection

The Coomassie Brilliant Blue G-250 method was used to determine protein content. The sample was ground into a powder using liquid nitrogen, producing 0.05 g samples, after which 1 mL of distilled water was added and the mixture was centrifuged at 8000 rpm for 10 min at 25 °C; then, 200 μL Coomassie Brilliant Blue G-250 Solution was added into 20 μL supernatant, and the absorbance of 595 nm was measured after mixing.
Soluble Protein Content (mg/g) = Detected Sample Concentration × Sample Volume ÷ Sample Weight × Dilution Factor

2.4. Real-Time Quantitative PCR Analysis

The RNA extracts of roots were used to synthesize cDNA with a 20 μL reaction volume containing 1 μg of the RNA template. Real-time PCR was performed according to the instructions provided with the TB Green1 Premix ExTaq™ II kit (Tli RNase H Plus) (TaKaRa Biomedical Technology (Beijing) Co., Ltd.: The company is located in the Life Science Park, 22 Ke Xueyuan Road, Changping District, Beijing 102206, China.) in a 20 μL PCR reaction volume. Three technical replicates and three biological replicates were performed in the experiments, using GmActin as the internal control. According to the Ct values, the relative expression levels were calculated using the 2−ΔΔCt method.

2.5. Metabolites Extraction

The freeze-dried samples were ground with a mixer mill for 180 s at 60 Hz. Then, a 15 mg aliquot of each individual sample was precisely weighed and transferred to a 2 mL Eppendorf tube, after the addition of 1 mL of extract solution (methanol/acetonitrile/water = 2:2:1, precooled at −40 °C, containing internal standard). After a 30 s vortex, the samples were homogenized at 35 Hz for 4 min and sonicated for 5 min in ice water, which was repeated 3 times at 40 °C for 1 h. Then, they were centrifuged at 12,000 rpm for 15 min at 4 °C. In total, 100 μL of supernatant was evaporated using rotary evaporation, dissolved with 100 μL of 50% methanol–water, and then treated with 100 μL of derivatizing agent and mixed with 50 μL of 1 M NaHCO3 at 40 °C for 1 h; this was removed at room temperature, treated with 50 μL 2 M HCl, evaporated until dry, and dissolved in 200 μL methanol to perform machine testing.

2.6. UHPLC-MS/MS Analysis

The UHPLC separation was carried out using Thermo Vanquish UHPLC System (Thermo Fisher, Waltham, MA, USA), equipped with a Waters ACQUITY UPLC BEH C18 (100 × 2.1 mm, 1.7 μm). The mobile phase A was 5 mM ammonium acetate in water, and the mobile phase B was acetonitrile. The column temperature was set at 45 °C. The auto-sampler temperature was set at 4 °C and the injection volume was 2 μL.
A Thermo Altis TSQ Plus Mass Spectrometer (Thermo Fisher), equipped with an electrospray ionization interface, was used for assay development. The typical ion source parameters were the following: Spray Voltage = −3300 V, Sheath Gas = 40 Arb, Aux Gas = 10 Arb, Sweep Gas = 1 Arb, Ion Transfer Tube Temp = 325 °C, and Vaporizer Temp = 350 °C.
The MRM parameters for each of the targeted analytes were optimized using flow injection analysis, by injecting the standard solutions of the individual analytes into the API source of the mass spectrometer. Several of the most sensitive transitions were used in the MRM scan mode to optimize the collision energy for each Q1/Q3 pair. Among the optimized MRM transitions per analyte, the Q1/Q3 pairs that showed the highest sensitivity and selectivity were selected as ‘quantifier’ variables for quantitative monitoring. The additional transitions acted as ‘qualifier’ for the purpose of verifying the identity of the target analytes.
Skyline was employed for MRM data processing, and Xcalibur (4.4.16.14, Thermo Fisher) was employed for MRM data acquisition.

2.7. Precision and Accuracy

The precision of the quantitation was measured as the relative standard deviation (RSD), determined by injecting analytical replicates of a QC sample. The accuracy of quantitation was measured as the analytical recovery of the QC sample determined. The percent recovery was calculated as [(mean observed concentration)/(spiked concentration)] × 100%.

3. Results

3.1. Changes of Nitrogen Accumulation of Soybean Plants Under Low-P Stress

The nitrogen accumulation of the aboveground parts, roots, and nodules gradually increased with the extension of low-P stress treatment time, and P1 was significantly lower than CK (P31) at all sampling times. During the 2-year experiment, aboveground parts, roots, and nodules decreased by 32.37–74.61%, 11.18–61.78%, and 76.00–95.41%,, respectively, in 2022, and 48.41–80.61%, 11.09–74.79%, and 69.85–92.57%, respectively, in 2023 (Table 1).

3.2. 15N Abundance of Soybean Plants Under Low-P Stress

The 15N abundance of P1 was higher than CK at 14 days under low-P stress and reached a significant difference level at 21 days under low-P stress, indicating that more fertilizer nitrogen was absorbed under low-P stress. The results of the 2-year experiment all showed that the 15N abundance of the aboveground part and root was higher than that in the nodule (Table 2).

3.3. Changes in Nodule Nitrogen Fixation Accumulation and Ratio of Nodule Nitrogen Fixation of Soybean Plants Under Low-P Stress

During the 2-year experiment, the nodule nitrogen fixation accumulation of the aboveground part, root, and nodule was inhibited significantly under low-P stress, except for the first 7 days in roots. The aboveground part, root, and nodule decreased by 38.45–89.66%, 21.54–79.67%, and 73.98–96.21%, respectively, in 2022, and 51.22–91.30%, 26.56–85.78%, 75.16–95.05%, respectively, in 2023 (Table 3).
During the 2-year experiment, from the 14th day of low-P stress, the ratios of nodule nitrogen fixation of the aboveground part, root, and nodule were inhibited significantly under low-P stress, except in the root. The aboveground part, root, and nodule decreased by 7.49–37.75%, 2.95–24.03%, 7.66–23.52%, respectively, in 2022; 5.62–32.44%, 6.36–18.59%, 11.92–26.67%, respectively, in 2023 (Table 4).

3.4. Effect of Low-P Stress on Soluble Protein Content of Soybean

The soluble protein content of leaves and nodules was significantly reduced under low-P stress, while that of roots was slightly lower at 7 days and 14 days (not significantly different) but reached a significant difference at 21 days (Figure 1).

3.5. Effect of Low-P Stress on PTs of Soybean

GmPT7 expression was upregulated under low-P stress, while there were some differences in different soybean organs. The relative expression level of GmPT7 in leaves significantly increased under low-P stress, and the longer the stress lasted, the more significantly the relative expression level increased. The relative expression level in roots was the highest at 14 days, followed by 21 days, reaching a significant difference under low-P stress. The trend of changes in the nodule was opposite to that in leaves, and the relative expression level of GmPT7 gradually decreased with the prolongation of low-P stress, being significantly higher at 7 days than at 14 and 21 days (Figure 2).

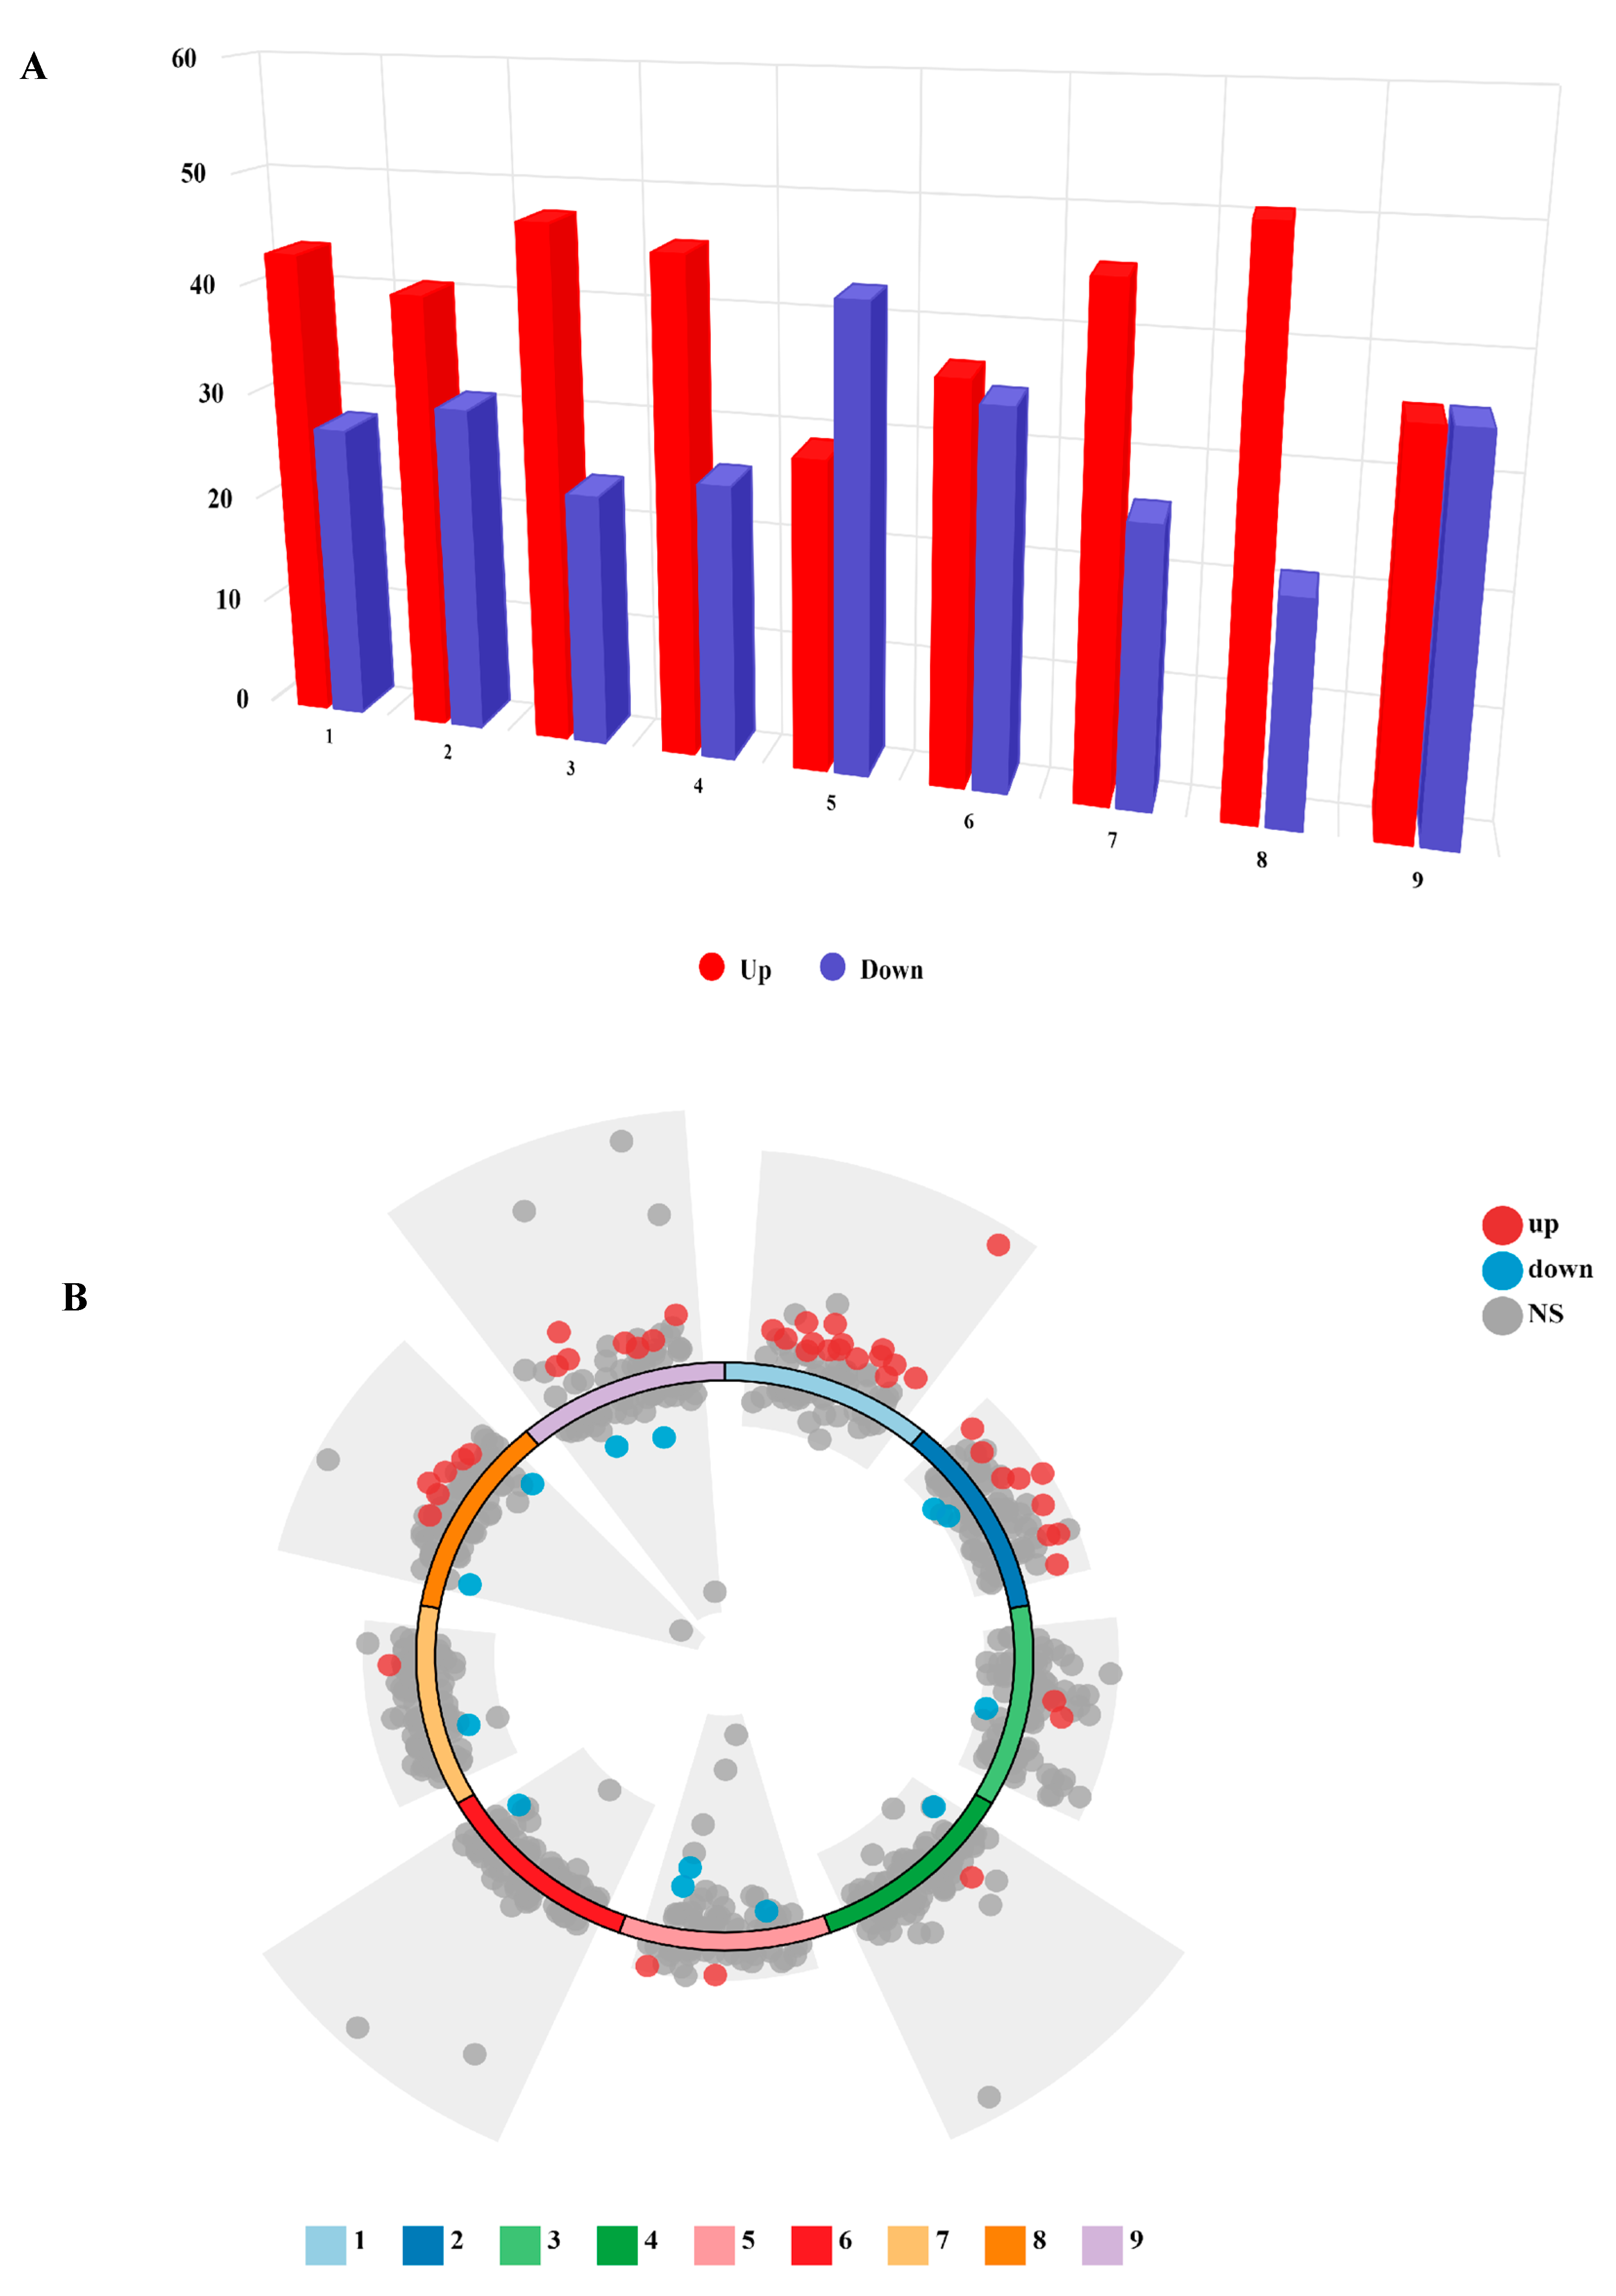
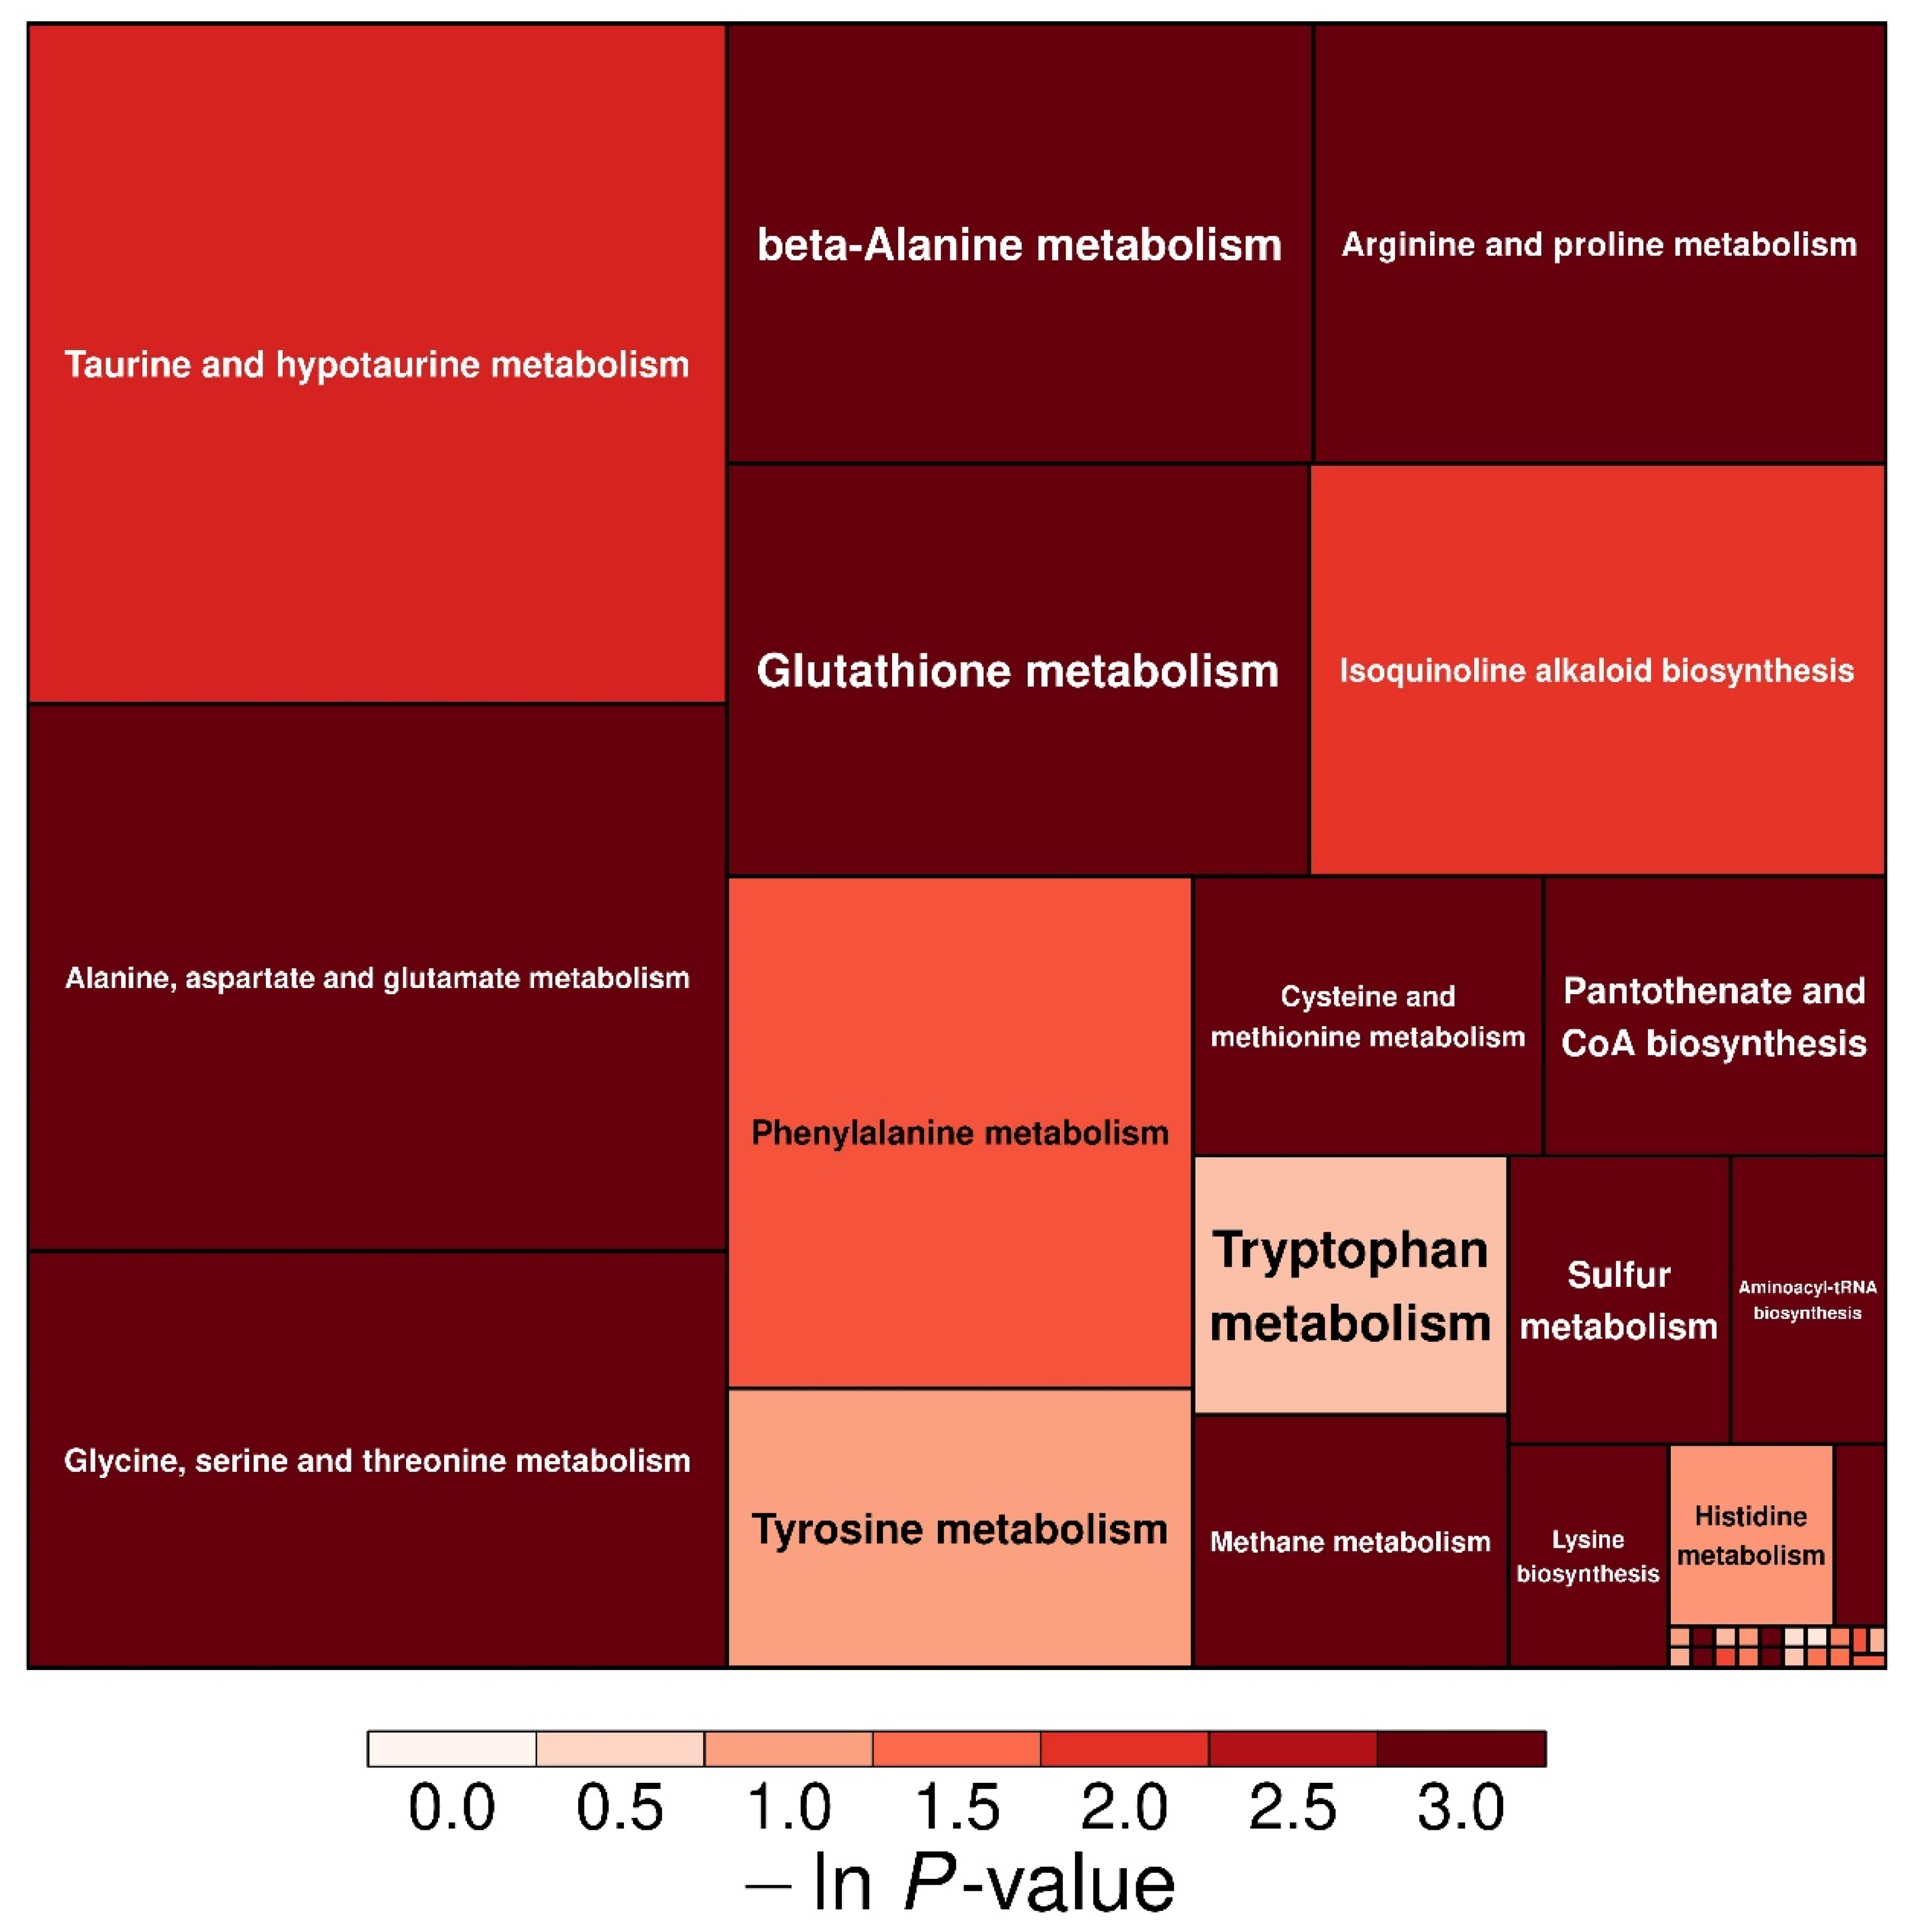
3.6. Effect of Low-P Stress on Amino Acid Metabolism in Soybean

A total of 70 amino acids were detected in leaves, roots, and nodules under low-P stress. The number of upregulated and downregulated amino acids at 7 days, 14 days, and 21 days was 43 and 27, 40 and 30, and 47 and 23 in leaves, 45 and 25, 28 and 42, and 36 and 34 in roots, and 45 and 25, 50 and 20, and 35 and 35 in nodules, respectively (Figure 3A, Supplementary Table S1). Under the screening conditions with a log2fc threshold of 1 and p-value < 0.05, the detected amino acids were mainly upregulated at 7, 14, and 21 days, and the number of upregulated amino acids in leaves and nodules was significantly higher than that in roots (Figure 3B).
There was a significant correlation between different amino acids under low-P stress, and there were differences among organs at different sampling times (Supplementary Figure S1). In Supplementary Figure S2, the top 10 differential amino acids with changes (upregulation and downregulation) in different parts and sampling times under low-P stress are listed. Ethanolamine was significantly downregulated, while upregulated amino acids besides D-asparagine and D-citrulline reached a significant difference level in P1_Leaf_7d-P31_Leaf_7d. D-cysteine, ethanolamine, L-2-aminobutyric acid, L-cysteine, D-leucine, and D-isoleucine were significantly downregulated and all upregulated amino acids besides L-cystine, L-histidine, and D-tryptophan reached a significant difference level in P1_Leaf_14d-P31_Leaf_14d. D-threonine was significantly downregulated in P1_Leaf_21d-P31_Leaf_21d. L-2-aminoadipic acid and L-cysteine were significantly downregulated while taurine and D-tyrosine were significantly upregulated in P1_Root_7d-P31_Root_7d. D-arginine and D-proline were significantly downregulated and L-histidine, L-tryptophan, L-asparagine, L-tyrosine, and symmetric dimethylarginine were significantly upregulated in P1_Root_14d-P31_Root_14d. D-proline was significantly downregulated and L-asparagine was significantly upregulated in P1_Root_21d-P31_Root_21d. D-threonine was significantly downregulated while L-arginine, beta-alanine, L-asparagine, and 3-methyl-histidine were significantly upregulated in P1_Nodule_7d-P31_Nodule_7d. Ethanolamine, L-2-aminobutyric acid, D-alanine, and D-arginine were significantly downregulated while D-citrulline, D-histidine, 3-methyl-histidine, L-histidine, and beta-alanine were significantly upregulated in P1_Nodule_14d-P31_Nodule_14d. D-alanine, L-glutamic acid, glutathione, and L-carnosine were significantly downregulated and L-histidine, L-homoarginine, symmetric dimethylarginine, and L-tryptophan were significantly upregulated in P1_Nodule_21d-P31_Nodule_21d.
Enrichment analysis showed that differential amino acids under low-P stress were mainly involved in six KEGG classifications, including amino acid metabolism, biosynthesis of other secondary metabolites, global and overview maps, membrane transport, metabolism of other amino acids, and translation, including fifteen KEEG pathways (Figure 4). The differential amino acids involved in the KEGG pathway in leaves were mainly upregulated, with upregulated differences observed in roots and nodules at 7 and 14 days, and downregulated differences observed at 21 days. The KEGG pathways that involve a large number of amino acids mainly include metabolic pathways, biosynthesis of amino acids, ABC transporters, D-amino acid metabolism, and aminoacyl-tRNA biosynthesis (Supplementary Figure S3).
The key pathways with higher correlation with differential amino acids were further analyzed on the basis of enrichment analysis. A total of 26 amino acids were mainly upregulated (Table 5) and participated in 37 metabolic pathways, mainly including arginine and proline metabolism, beta-alanine metabolism, alanine, aspartate, and glutamate metabolism, glycine, serine, and threonine metabolism, pantothenate and CoA biosynthesis, cysteine and methionine metabolism, aminoacyl-tRNA biosynthesis, etc. (Figure 5).

4. Discussion

P is one of the most important macro elements in crop growth and development and is the component of major functional substances such as nucleic acids, phospholipids, ATP, etc., in plants, which participate in various metabolic and physiological biochemical processes required by plant cells [6]. Approximately 13 million km2 of arable land in the world lacks available P in soil [8]. When the concentration of available P is low in the soil, cell division and proliferation are restricted, and growth and metabolic activities are significantly affected. Crops exhibit symptoms such as slow growth, stunted growth, and weak and long roots, leading to a sharp decline in yields [47]. P deficiency exerts a negative impact on the nitrogen fixation process, reducing the nitrogen fixation ability of nodules, thereby reducing plant weight, nodule weight, quantity, and function [11]. This study found that under low-P stress, the nitrogen accumulation in the aboveground parts, roots, and nodules of soybean was significantly inhibited (decreased by 11.09–95.41%), the nodule nitrogen fixation accumulation decreased by 21.54–96.21%, and the ratio of nodule nitrogen fixation significantly decreased. Lazali et al. found that P deficiency led to a decrease in nitrogen fixation rate in the aboveground parts and nodules of all genotypes of kidney beans [48]; nodule 15N/Nt (the ratios of 15N over total N content) was significantly related to both the quantity of N2 fixed and the P content of nodules. The results of this study indicated that low-P stress significantly inhibited the absorption of fertilizer nitrogen in soybean, which was mainly utilized for the growth and development of aboveground parts and roots.
P plays a noteworthy role in plant physiological and biochemical processes, and the substance that controls protein synthesis—ribonucleic acid (RNA)—requires P [17]. P influences nitrogen metabolism by promoting protein synthesis, increasing protein content, and enhancing nitrogen fixation in leguminous plants [15,16]. Low P reduces the protein content in plant leaves, and an appropriate P concentration is beneficial for increasing the protein content in leaves [49]. Our results demonstrated that low-P stress significantly reduces the soluble protein content in soybean leaves and nodules, while that in roots significantly decreases at 21 days.
PTs serve as the primary mediators of plants in the uptake and transport of P, which is important for regulating the plant uptake and utilization efficiency of P. When soybeans are subjected to low-P stress, the gene expression of PTs changes [50]. Organic P is transported to filamentous organisms via PTs in legumes, participating in metabolism and affecting nodule nitrogen fixation [10,51]. GmPT7 is a highly efficient PT in soybean, being expressed in the outer layer and nitrogen fixation zone of nodules and being involved in the transport of Pi to nodules [52]. The results indicated that low-P stress induced the expression of GmPT7 in soybean leaves, roots, and nodules. This is beneficial for the transport of Pi under low-P stress, promoting the absorption and utilization of P nutrients, and is used for soybean growth and development as well as nodule nitrogen fixation. The relative expression level of leaves significantly increased with prolonged treatment time, while the change in the trend in nodules was opposite to that of leaves; thus, further research is needed to investigate whether there is an interaction or regulatory effect between the leaf and nodule. The relative expression level in roots was highest at 14 days.
In order to adapt to low-phosphorus stress, plants have evolved various mechanisms that involve the induction of protein expression and alterations in amino acids [53,54]. The concentrations of amino acids and organic acids in root exudates were higher under the P0 condition, which suggests that soybean roots actively release metabolites in response to P deficiency [55]. Some plants respond to low-P stress by secreting increased amounts of sugars and amino acids into the rhizosphere to enhance P absorption [56]. Moreover, a study conducted by Mo demonstrated the detection of 155 DMs in soybean roots under P stress based on comparisons with the metabolite profile of unstressed roots, including 18 amino acids and their derivatives [57]. The response of soybean roots to low-P stress is a gradual process, with massive expression of differential proteins in response to low-P stress as the concentration of P in the environment decreases. The results of KEGG indicated that in the early stage of low P stress, nitrogen metabolism-related proteins are highly expressed on the first day in soybean roots, subsequently decreasing for the synthesis of glutamate and preparing for the synthesis of other amino acids. Proteins related to the ribosome metabolic pathway begin to express in large quantities on the third day and synthesize various proteins. A large amount of secondary metabolism-related proteins was expressed to maintain normal plant growth on the seventh day of low-P stress [58].
The authors’ preliminary research found that low-P stress-induced ribosomal protein structural changes were associated with altered key nodule protein synthesis profiles [46]. Nodules responded to low-P stress by increasing the number of amino acids and derivatives [45], while low-P stress significantly affected the types and quantities of root exudates in soybean, and P1 treatment was mainly upregulated [59]. This study is based on previous research and further conducted high-throughput targeted analysis of amino acids. Amino acids from bean root secretion were upregulated under low-P stress [60]; conversely, the levels of amino acids and other nitrogen metabolites in nodules were downregulated, reducing the content of glutamine, arginine, etc., and leading to the inhibition of the synthesis of required amino acids [61]. Lundberg et al. found that under low-P stress, amino acids such as alanine, glutamine, and arginine underwent changes in nodules of alfalfa, which impacts nitrogen metabolism [62]. This study indicated that 70 amino acids were involved in the response to low-P stress in soybean leaves, roots, and nodules and were mainly upregulated. L-tyrosine, L-tryptophan, and L-arginine were significantly upregulated while ethanolamine was significantly downregulated in leaves. Tyrosine and L-asparagine were significantly upregulated while D-proline was significantly downregulated in roots. Histidine and beta-alanine were significantly upregulated while D-alanine was significantly downregulated in nodules. These amino acids may be related to intermediate metabolites in energy metabolism processes [63]. The change in aspartate is related to phosphorus utilization [64] as aspartate metabolism is more vigorous in high-phosphorus utilization varieties, and the upregulation of aspartate may be beneficial for the absorption and utilization of phosphorus under low-phosphorus stress in soybean. Enrichment analysis showed that differential amino acids were mainly involved in six KEGG classifications under low-P stress. Further analysis of the key pathways’ higher correlation with differential amino acids revealed that 26 amino acids were involved in 37 metabolic pathways, mainly including arginine and proline metabolism, beta-alanine metabolism, alanine, aspartate, and glutamate metabolism, glycine, serine, and threonine metabolism, pantothenate and CoA biosynthesis, cysteine and methionine metabolism, aminoacyl-tRNA biosynthesis, etc. Therefore, the amino acid metabolism pathway is regulated by low-P stress in soybean. For instance, the metabolisms of glutamate and aspartate are tightly regulated, and they can be converted to other amino acids through various biochemical processes [64]. Amino acids participate in multiple metabolic pathways and play an important role in soybean response to low-P stress.

5. Conclusions

(1) Low-P stress has an inhibitory effect on soybean nitrogen metabolism. It significantly inhibits nitrogen accumulation and nodule nitrogen fixation accumulation in soybean aboveground parts, roots, and nodules, with the most substantial reduction occurring in nodules. The ratio of nodule nitrogen fixation decreases significantly as well. The fertilizer nitrogen absorbed by soybean plants is predominantly utilized for the growth and development of aboveground parts and roots under low-phosphorus stress.
(2) Low-P stress influenced the protein metabolism of soybean leaves, roots, and nodules. The soluble protein content significantly decreased in leaves and nodules, as well as in roots at 21 days. The expression of GmPT7 was upregulated in leaves, roots, and nodules in response to low-P stress. A total of 70 amino acids were mainly upregulated in response to low-P stress, among which 26 amino acids participated in 37 metabolic pathways. Tyrosine, L-tryptophan, L-arginine, L-asparagine, histidine, and beta-alanine were upregulated, while ethanolamine, D-proline, and D-alanine were downregulated. These amino acids participated in arginine and proline metabolism, beta-alanine metabolism, alanine, aspartate, and glutamate metabolism, glycine, serine, and threonine metabolism, pantothenate and CoA biosynthesis, cysteine and methionine metabolism, aminoacyl-tRNA biosynthesis, etc., encompassing the pathways that regulate the effect of low-P stress on soybean nitrogen metabolism.
(3) The results provide insights into the metabolic pathways involved in soybean’s adaptation to low-P deficiency from nitrogen accumulation and protein metabolism and lay the foundation for further analysis of the relationship between amino acid changes and tolerance to low-P stress or phosphorus utilization efficiency in soybean.

Supplementary Materials

The following supporting information can be downloaded at: https://www.mdpi.com/article/10.3390/agronomy15040836/s1, Supplementary Figure S1: The absolute value of the correlation threshold is greater than 0.8 and the p-value is less than 0.05. Supplementary Figure S2: The abscissa shows the change multiple after logarithmic transformation, the shade of the dot represents the VIP value, and * represents the significance. Supplementary Figure S3: The horizontal axis represents the differential abundance score (DA Score), and the vertical axis represents the KEGG metabolic pathways. Table S1: Compounds.

Author Contributions

Conceptualization, Y.Y.; Methodology, Y.Y.; Formal analysis, Y.Y.; Resources, X.L.; Writing—original draft, Y.Y.; Writing—review and editing, Y.Y. and X.L. All authors have read and agreed to the published version of the manuscript.

Funding

This work was supported by the Key Technology Research and Application for Enhancing Comprehensive Grain Production Capacity in modern agricultural laboratory of province (ZY04JD05-007), Heilongjiang Provincial Scientific Research Institute Scientific Research Business Expense Project (CZKYF2023-1-C011), and Heilongjiang Province Postdoctoral Research Start-up Fund.

Data Availability Statement

The raw data used to assemble this article will be made available by the authors, without undue reservation.

Acknowledgments

The authors thank Yongguo Xue, Xiaofei Tang, Dan Cao, Xiaoyan Luan, Qi Liu and Zifei Zhu (Heilongjiang Academy of Agricultural Sciences) for their support in this study, as well as their guidance and suggestions on the formal analysis, investigation and resources of this manuscript.

Conflicts of Interest

The authors declare that the research was conducted in the absence of any commercial or financial relationships that could be construed as a potential conflict of interest.

References

  1. Duan, Z.B.; Zhang, M.; Liang, S.; Fan, L. Natural allelic variation of GmST05 controlling seed size and quality in soybean. Plant Biotechnol. J. 2022, 20, 1807–1818. [Google Scholar] [CrossRef]
  2. Lu, J.L. Plant Nutrition; China Agricultural University: Beijing, China, 2003; pp. 35–36. [Google Scholar]
  3. Deng, L.; Zhang, C.; Yuan, K.; Gao, Y.; Pan, Y.W.; Ge, X.L.; He, Y.X.; Yuan, Y.; Lu, Y.; Zhang, X.X.; et al. Prioritizing natural-selection signals from the deep-sequencing genomic data suggests multi-variant adaptation in Tibetan highlanders. Natl. Sci. Rev. 2019, 6, 1201–1222. [Google Scholar] [CrossRef]
  4. King, K.E.; Lauter, N.; Lin, S.F.; Scott, M.P.; Shoemaker, R.C. Evaluation and QTL mapping of phosphorus concentration in soybean seed. Euphytica 2013, 189, 261–269. [Google Scholar] [CrossRef]
  5. Chen, L.; Liao, H. Engineering crop nutrient efficiency for sustainable agriculture. J. Integr. Plant Biol. 2017, 59, 710–735. [Google Scholar] [CrossRef] [PubMed]
  6. Yang, Z.J.; Gao, Z.; Zhou, H.W.; He, Y.; Liu, Y.X.; Lai, Y.L.; Zheng, J.K.; Li, X.X.; Liao, H. GmPTF1 modifies root architecture responses to phosphate starvation primarily through regulating GmEXPB2 expression in soybean. Plant J. 2021, 107, 525–543. [Google Scholar] [CrossRef] [PubMed]
  7. White, P.J. Efficiency of soil and fertilizer phosphorus use: Reconciling changing concepts of soil phosphorus behaviour with agronomic information. Exp. Agric. 2009, 45, 128–135. [Google Scholar] [CrossRef]
  8. Sun, M.; Li, P.C.; Wang, N.; Zheng, C.S.; Sun, X.Z.; Dong, H.L.; Han, H.M.; Feng, W.N.; Shao, J.J.; Zhang, Y.F. Soil available phosphorus deficiency reduces boll biomass and lint yield by affecting sucrose metabolism in cotton-boll subtending leaves. Agronomy 2022, 12, 1065. [Google Scholar] [CrossRef]
  9. Lambers, H. Phosphorus acquisition and utilization in plants. Annu. Rev. Plant Biol. 2022, 73, 17–42. [Google Scholar] [CrossRef]
  10. Sulieman, S.; Van Ha, C.; Schulze, J.; Tran, L.S. Growth and nodulation of symbiotic Medicago truncatula at different levels of phosphorus availability. J. Exp. Bot. 2013, 64, 2701–2712. [Google Scholar] [CrossRef]
  11. Tsvetkova, G.E.; Georgiev, G.I. Effect of phosphorus nutrition on the nodulation, nitrogen fixation and nutrient-use efficiency of Bradyrhizobium Japonicum-soybean (Glycine max l. merr.) symbiosis. Bulg. J. Plant Physiol. 2003, 3, 315–335. [Google Scholar]
  12. Isaac, M.E.; Harmand, J.M.; Drevon, J.J. Growth and nitrogen acquisition strategies of Acacia senegal seedlings under exponential phosphorus additions. J. Plant Physiol. 2010, 168, 776–781. [Google Scholar] [CrossRef]
  13. Maistry, P.M.; Cramer, M.D.; Chimphango, S.B. N and P colimitation of N2-fixing and N-supplied fynbos legumes from the Cape Floristic Region. Plant Soil 2013, 373, 217–228. [Google Scholar] [CrossRef]
  14. Sharma, P.; Kumari, A. Approaches to Enhance Abiotic and Biotic Stress Tolerance in Leguminous Crops and Microgreens; Mathur, P., Gupta, A., Eds.; Springer: Cham, Switzerland, 2025. [Google Scholar] [CrossRef]
  15. Qi, W.D. Functional Analysis of GmG3PT3 Involvement in Soybean Responses to Phosphorus Deficiency; South China Agricultural University: Guangzhou, China, 2017. [Google Scholar]
  16. Cai, B.Y.; Ge, J.P.; Zu, W. Soluble protein content in leaves and seeds of different soybean genotypes as affected by different phosphorus supplies. J. Plant Nutr. Fertil. 2007, 13, 1185–1188. [Google Scholar]
  17. Yang, L.X.; Wang, Y.L.; Huang, J.Y.; Zhu, J.G.; Yang, H.J.; Liu, G.; Dong, G.C.; Hu, J. Seasonal changes in the effects of free-air CO2 enrichment (FACE) on phosphorus uptake and utilization of rice at three levels of nitrogen fertilization. Field Crops Res. 2007, 102, 141–150. [Google Scholar] [CrossRef]
  18. Chu, S.S.; Zhang, X.Q.; Yu, K.Y.; Lv, L.L.; Sun, C.Y.; Liu, X.Q.; Zhang, J.Y.; Jiao, Y.Q.; Zhang, D. Genome-wide analysis reveals dynamic epigenomic differences in soybean response to low-phosphorus stress. Int. J. Mol. Sci. 2020, 21, 6817. [Google Scholar] [CrossRef] [PubMed]
  19. Iglesias, J.; Trigueros, M.; Rojas-Triana, M.; Fernández, M.; Albar, J.P.; Bustos, R.; Paz-Ares, J.; Rubio, V. Proteomics identifies ubiquitin-proteasome targets and new roles for chromatin-remodeling in the Arabidopsis response to phosphate starvation. J. Proteom. 2013, 94, 1–22. [Google Scholar] [CrossRef]
  20. Jiang, W.Z.; He, P.M.; Zhou, M.; Lu, X.; Chen, K.; Liang, C.Y.; Tian, J. Soybean responds to phosphate starvation through reversible protein phosphorylation. Plant Physiol. Biochem. 2021, 167, 222–234. [Google Scholar] [CrossRef]
  21. Liang, C.Y.; Tian, J.; Liao, H. Proteomics dissection of plant responses to mineral nutrient deficiency. Proteomics 2013, 13, 624–636. [Google Scholar] [CrossRef]
  22. Motte, H.; Vanneste, S.; Beeckman, T. Molecular and Environmental Regulation of Root Development. Annu. Rev. Plant Biol. 2019, 70, 465–488. [Google Scholar] [CrossRef]
  23. Chen, L.Y.; Qin, L.; Zhao, J.; Liao, H. Advances in Pht1 Phosphate Transporter Family Genes in Legumes. Soybean Sci. 2015, 34, 1057–1065. [Google Scholar]
  24. Song, H.N.; Yin, Z.T.; Chao, M.N.; Ning, L.H.; Zhang, D.; Yu, D.Y. Functional properties and expression quantitative trait loci for phosphate transporter GmPT1 in soybean. Plant Cell Environ. 2014, 37, 462–472. [Google Scholar] [CrossRef] [PubMed]
  25. Schachtman, D.P.; Reid, R.J.; Ayling, S.M. Phosphorus uptake by plants: From soil to cell. Plant Physiol. 1998, 116, 447–453. [Google Scholar] [CrossRef] [PubMed]
  26. Liang, C.Y.; Wang, J.X.; Zhao, J.; Tian, J.; Liao, H. Control of phosphate homeostasis through gene regulation in crops. Curr. Opin. Plant Biol. 2014, 21, 59–66. [Google Scholar] [CrossRef]
  27. Mitsukawa, N.; Okumura, S.; Shirano, Y.; Sato, S.; Kato, T.; Harashima, S.; Shibata, D. Overexpression of an Arabidopsis thaliana high-affinity phosphate transporter gene in tobacco cultured cells enhances cell growth under phosphate-limited conditions. Proc. Natl. Acad. Sci. USA 1997, 94, 7098–7102. [Google Scholar]
  28. Yang, X.J.; Finnegan, P.M. Regulation of phosphate starvation responses in higher plants. Ann. Bot. 2010, 105, 513–526. [Google Scholar] [CrossRef]
  29. Tian, J.; Venkatachalam, P.; Liao, H.; Yan, X.L.; Raghothama, K. Molecular cloning and characterization of phosphorus starvation responsive genes in common bean (Phaseolus vulgaris L.). Planta 2007, 227, 51–65. [Google Scholar] [CrossRef]
  30. Grønlund, M.; Albrechtsen, M.; Johansen, I.E.; Hammer, E.C.; Nielsen, T.H.; Jakobsen, I. The interplay between P uptake pathways in mycorrhizal peas: A combined physiologyogical and gene-silencing approach. Physiol. Plant. 2013, 149, 234–248. [Google Scholar] [CrossRef]
  31. Volpe, V.; Dellaglio, E.; Giovannetti, M.; Ruberti, C.; Costa, A.; Genre, A.; Guether, M.; Bonfante, P. An AM-induced, MYB-family gene of Lotusjaponicus (LjMAMI) affects root growth in an AM-independent manner. Plant J. 2013, 73, 442–455. [Google Scholar] [CrossRef]
  32. Wang, F.; Cui, P.J.; Tian, Y.; Huang, Y.; Wang, H.F.; Liu, F.; Chen, Y.F. Maize ZmPT7 regulates Pi uptake and redistribution which is modulated by phosphorylation. Plant Biotechnol. J. 2020, 18, 2406–2419. [Google Scholar] [CrossRef]
  33. Zhang, J.; Gu, M.; Liang, R.S.; Shi, X.Y.; Chen, L.L.; Hu, X.; Wang, S.C.; Dai, X.L.; Qu, H.Y.; Li, H.H.; et al. OsWRKY21 and OsWRKY108 function redundantly to promote phosphate accumulation through maintaining the constitutive expression of OsPHT1;1 under phosphate-replete conditions. New Phytol. 2021, 229, 1598–1614. [Google Scholar] [CrossRef]
  34. Wang, S.C.; Xu, T.T.; Chen, M.; Geng, L.Y.; Huang, Z.Y.; Dai, X.L.; Qu, H.Y.; Zhang, J.; Li, H.H.; Gu, M.; et al. The transcription factor OsWRKY10 inhibits phosphate uptake via suppressing OsPHT1;2 expression under phosphate-replete conditions in rice. J. Exp. Bot. 2022, 74, 1074–1089. [Google Scholar] [CrossRef] [PubMed]
  35. Dai, C.R.; Dai, X.L.; Qu, H.Y.; Men, Q.; Liu, J.Y.; Yu, L.; Gu, M.; Xu, G.H. The rice phosphate transporter OsPHT1;7 plays a dual role in phosphorus redistribution and anther development. Plant Physiol. 2022, 188, 2272–2288. [Google Scholar] [CrossRef]
  36. Noike, Y.; Okamoto, I.; Tada, Y. Root epidermis-specific expression of a phosphate transporter TaPT2 enhances the growth of transgenic Arabidopsis under Pi-replete and Pi-depleted conditions. Plant Sci. 2023, 327, 111540. [Google Scholar] [CrossRef]
  37. Wang, P.F.; Li, G.Z.; Li, G.W.; Yuan, S.S.; Wang, C.Y.; Xie, Y.X.; Guo, T.C.; Kang, G.Z.; Wang, D.W. TaPHT1;9-4B and its transcriptional regulator TaMYB4-7D contribute to phosphate uptake and plant growth in bread wheat. New Phytol. 2021, 231, 1968–1983. [Google Scholar] [CrossRef] [PubMed]
  38. Guo, Z.L.; Cao, H.R.; Zhao, J.; Bai, S.; Peng, W.T.; Li, J.; Sun, L.L.; Chen, L.Y.; Lin, Z.H.; Shi, C.; et al. A natural uORF variant confers phosphorus acquisition diversity in soybean. Nat. Commun. 2022, 13, 3796. [Google Scholar] [CrossRef]
  39. Luan, M.D.; Zhao, F.G.; Sun, G.F.; Xu, M.; Fu, A.; Lan, W.Z.; Luan, S. A SPX domain vacuolar transporter links phosphate sensing to homeostasis in Arabidopsis. Mol. Plant 2022, 15, 1590–1601. [Google Scholar] [CrossRef]
  40. Zhang, D.; Zhang, H.Y.; Chu, S.S.; Li, H.Y.; Chi, Y.J.; Triebwasser, F.D.; Lv, H.Y.; Yu, D.Y. Integrating QTL mapping and transcriptomics identifies candidate genes underlying QTLs associated with soybean tolerance to low-phosphorus stress. Plant Mol. Biol. 2017, 83, 137–150. [Google Scholar] [CrossRef]
  41. Medhi, A.K.; Dhar, S.; Roy, A. Effect of different growth regulators and phosphorus levels on nodulation, yield and quality components in green gram. Indian J. Plant Physiol. 2014, 19, 74–78. [Google Scholar] [CrossRef]
  42. Ran, Q.X.; Pang, J.Y.; Dong, R.; He, J. Enhanced seed yield, essential amino acids and unsaturated fatty acids in soybean seeds with phosphorus fertilizer supply. J. Food Compos. Anal. 2024, 125, 105813. [Google Scholar] [CrossRef]
  43. Hernández, G.; Ramírez, M.; Valdés-López, O.; Tesfaye, M.; Graham, M.A.; Czechowski, T.; Schlereth, A.; Wandrey, M.; Erban, A.; Cheung, F.; et al. Phosphorus stress in common bean: Root transcript and metabolic responses. Plant Physiol. 2007, 144, 752–767. [Google Scholar] [CrossRef]
  44. Le roux, M.R.; Khan, S.; Vapentine, A.J. Nitrogen and carbon costs of soybean and lupin root systems during phosphate starvation. Symbiosis 2009, 48, 102–109. [Google Scholar] [CrossRef]
  45. Yao, Y.B.; Yuan, H.M.; Wu, G.W.; Yan, J.; Zhao, D.S.; Chen, S.; Kang, Q.H.; Ma, C.M.; Gong, Z.P. Nitrogen fixation capacity and metabolite responses to phosphorus in soybean nodules. Symbiosis 2022, 88, 21–35. [Google Scholar] [CrossRef]
  46. Yao, Y.B.; Yuan, H.M.; Wu, G.W.; Ma, C.M.; Gong, Z.P. Proteome Analysis of the Soybean Nodule Phosphorus Response Mechanism and Characterization of Stress-Induced Ribosome Structural and Protein Expression Changes. Front. Plant Sci. 2022, 13, 908889. [Google Scholar] [CrossRef]
  47. Zhou, M.; Zhu, S.N.; Mo, X.H.; Guo, Q.; Li, Y.X.; Tian, J.; Liang, C.Y. Proteomic analysis dissects molecular mechanisms underlying plant responses to phosphorus deficiency. Cells 2022, 11, 651. [Google Scholar] [CrossRef] [PubMed]
  48. Lazali, M.; Bargaz, A.; Carlsson, G.; Ounane, S.M.; Drevon, J.J. Discrimination against 15N among recombinant inbred lines of Phaseolus vulgaris L. contrasting in phosphorus use efficiency for nitrogen fixation. J. Plant Physiol. 2014, 171, 199–204. [Google Scholar] [CrossRef]
  49. Høgh-Jensen, H.; Schjoerring, J.K.; Soussana, J.F. The influence of phosphorus deficiency on growth and nitrogen fixation of white clover plants. Ann. Bot. 2002, 90, 745–753. [Google Scholar] [CrossRef]
  50. Desnos, T. Root branching responses to phosphate and nitrate. Curr. Opin. Plant Biol. 2007, 11, 82–87. [Google Scholar] [CrossRef]
  51. Rotaru, V.; Sinclair, T.R. Interactive influence of phosphorus and iron on nitrogen fixation by soybean. Environ. Exp. Bot. 2009, 66, 94–99. [Google Scholar] [CrossRef]
  52. Chen, L.Y.; Qin, L.; Zhou, L.L.; Li, X.X.; Chen, Z.C.; Liao, H. A nodule-localized phosphate transporter GmPT7 plays an important role in enhancing symbiotic N2 fixation and yield in soybean. New Phytol. 2019, 221, 2013–2025. [Google Scholar] [CrossRef]
  53. Zhao, H.Y.; Yang, A.H.; Kong, L.J.; Wang, H.Y.; Ao, X. Proteome characterization of two contrasting soybean genotypes in response to different phosphorus treatments. AoB Plants 2021, 13, lab019. [Google Scholar] [CrossRef]
  54. Wang, X.Y.; Li, X.M.; Dong, S.K. Biochemical characterization and metabolic reprogramming of amino acids in Soybean roots under drought stress. Physiol. Plant. 2024, 176, e14319. [Google Scholar] [CrossRef] [PubMed]
  55. Tawaraya, K.; Horie, R.; Shinano, T.; Wagatsuma, T.; Saito, K.; Oikawa, A. Metabolite profiling of soybean root exudates under phosphorus deficiency. Soil Sci. Plant Nutr. 2014, 60, 679–694. [Google Scholar]
  56. Zhang, L. Root exudates and soil fertility. Bull. Biol. 2000, 35, 17. [Google Scholar] [CrossRef]
  57. Mo, X.H. Phosphate Starvation Responsive Protein Phosphatase GmHAD1-2 Regulates Flavonol Biosynthesis and Lateral Root Development in Soybean; South China Agricultural University: Guangzhou, China, 2019. [Google Scholar] [CrossRef]
  58. Shi, G.Y. Physiological Mechanism and Proteomics of Soybean Root Response to Low Phosphorus Stress; Guizhou University: Guiyang, China, 2021. [Google Scholar] [CrossRef]
  59. Yao, Y.B.; Yuan, H.M.; Liu, D.D.; Cheng, L.L. Response of soybean root exudates and related metabolic pathways to low phosphorus stress. PLoS ONE 2024, 19, e0314256. [Google Scholar] [CrossRef]
  60. Keitaro, T.; Ryota, H.; Saki, S.; Tadao, W.; Kazuki, S.; Akira, O. Metabolite profiling of root exudates of common bean under phosphorus deficiency. Metabolites 2014, 4, 599–611. [Google Scholar] [CrossRef] [PubMed]
  61. Hernández, G.; Valdés-López, O.; Ramírez, M.; Goffard, N.; Weiller, G.; Aparicio-Fabre, R.; Fuentes, S.I.; Erban, A.; Kopka, J.; Udvardi, M.K.; et al. Global changes in the transcript and metabolic profiles during symbiotic nitrogen fixation in phosphorus-stressed common bean plants. Plant Physiol. 2009, 151, 1221–1238. [Google Scholar] [CrossRef]
  62. Lundberg, P.; Lundquist, P.O. Primary metabolism in N2 fixing Alnus incanaFrankia symbiotic root nodules studied with 15N and 31P nuclear magnetic resonance spectroscopy. Planta 2004, 219, 661–672. [Google Scholar]
  63. Yao, Y.B. Multi-omics analysis of carbon and nitrogen metabolism pathways in soybean nodules under phosphorus stress. Soybean Sci. 2024, 43, 624–631. [Google Scholar] [CrossRef]
  64. Liu, M.; Zhao, M.; Yang, G.; Sun, M.; Yang, A.; Sun, C.; Zhao, H.; Ao, X. Root morphology, nitrogen metabolism and amino acid metabolism in soybean under low phosphorus stress. Sci. Rep. 2024, 14, 28583. [Google Scholar] [CrossRef]
Figure 1. Changes in soluble protein content under low-P stress (mg/g). ** denotes p < 0.01; *** denotes p < 0.001; ns denotes p > 0.05.
Agronomy 15 00836 g001
Figure 2. Changes in PTs under low-P stress * denotes p < 0.05; *** denotes p < 0.001; Lowercases: significance at probability of 0.01 < p < 0.05 level.
Agronomy 15 00836 g002
Figure 3. Amino acid expression at different sampling times and locations. (A): The number of upregulated and downregulated amino acids. (B): Under the screening conditions with a log2fc threshold of 1 and p-value < 0.05. 1: P1_Leaf_7d-P31_Leaf_7d; 2: P1_Leaf_14d-P31_Leaf_14d; 3: P1_Leaf_21d-P31_Leaf_21d; 4: P1_Root_7d-P31_Root_7d; 5: P1_Root_14d-P31_Root_14d; 6: P1_Root_21d-P31_Root_21d; 7: P1_Nodule_7d-P31_Nodule_7d; 8: P1_Nodule_14d-P31_Nodule_14d; 9: P1_Nodule_21d-P31_Nodule_21d.
Agronomy 15 00836 g003
Figure 4. Enrichment analysis. The horizontal axis represents the percentage of annotated differential metabolites in the pathway compared to all annotated differential metabolites, while the vertical axis represents the enriched KEGG metabolic pathway.
Agronomy 15 00836 g004
Figure 5. Pathway analysis results.
Agronomy 15 00836 g005
Table 1. Changes in nitrogen accumulation under low-P stress (mg/plant).
TreatmentsAbovegroundRootNodule
202220232022202320222023
7 daysP123.98 ± 0.21 *31.78 ± 1.67 *9.53 ± 0.10 *9.54 ± 0.10 *1.22 ± 0.00 *1.19 ± 0.08 *
P3139.49 ± 0.4766.90 ± 1.8210.73 ± 0.1610.73 ± 0.165.39 ± 0.128.82 ± 0.34
14 daysP129.78 ± 0.49 *47.68 ± 1.02 *16.74 ± 0.01 *9.94 ± 0.24 *1.53 ± 0.00 *2.56 ± 0.05 *
P3190.78 ± 2.7092.42 ± 1.9719.60 ± 0.1514.17 ± 0.1311.20 ± 0.468.49 ± 0.06
21 daysP148.26 ± 3.11 *46.48 ± 0.75 *18.96 ± 0.96 *17.09 ± 0.21 *1.23 ± 0.12 *2.67 ± 0.14 *
P31143.23 ± 7.02225.48 ± 3.6237.99 ± 0.0844.90 ± 2.5726.82 ± 0.2124.64 ± 0.30
28 daysP175.03 ± 2.98 *63.15 ± 0.12 *25.38 ± 1.12 *20.02 ± 1.04 *2.23 ± 0.04 *2.67 ± 0.17 *
P31248.56 ± 14.83325.61 ± 8.0566.41 ± 1.2676.50 ± 2.3833.59 ± 1.1824.87 ± 1.04
35 daysP1102.52 ± 0.27 *97.70 ± 3.49 *41.52 ± 1.04 *22.74 ± 1.28 *3.65 ± 0.35 *2.69 ± 0.23 *
P31403.80 ± 14.93476.66 ± 2.0292.52 ± 2.3190.20 ± 1.7337.02 ± 0.3936.22 ± 0.68
42 daysP1186.66 ± 0.59 *175.45 ± 1.29 *53.08 ± 1.68 *58.64 ± 0.16 *6.69 ± 0.04 *2.92 ± 0.21 *
P31425.70 ± 2.87464.67 ± 5.7389.55 ± 6.04140.15 ± 1.1340.09 ± 0.6530.95 ± 1.67
49 daysP1302.11 ± 0.88 *271.70 ± 5.51 *92.58 ± 0.19 *87.96 ± 4.19 *11.23 ± 0.07 *5.58 ± 0.23 *
P31446.68 ± 1.03684.25 ± 7.95117.42 ± 1.36108.26 ± 2.8546.79 ± 0.7725.94 ± 1.39
Vertical comparison. The data are represented as mean values ± standard error (with three replicates). * Indicates a significant level of 5%.
Table 2. Changes of 15N abundance under low-P stress (%).
TreatmentsAbovegroundRootNodule
202220232022202320222023
7 daysP11.89 ± 0.011.91 ± 0.002.11 ± 0.04 *2.02 ± 0.010.91 ± 0.00 *1.02 ± 0.02 *
P311.91 ± 0.021.94 ± 0.021.80 ± 0.001.81 ± 0.051.21 ± 0.010.78 ± 0.00
14 daysP12.08 ± 0.00 *2.17 ± 0.022.22 ± 0.022.33 ± 0.051.00 ± 0.03 *1.18 ± 0.05 *
P311.84 ± 0.012.00 ± 0.042.12 ± 0.042.13 ± 0.010.62 ± 0.000.78 ± 0.03
21 daysP12.31 ± 0.00 *2.28 ± 0.04 *2.29 ± 0.03 *2.23 ± 0.03 *1.01 ± 0.04 *1.21 ± 0.00 *
P311.33 ± 0.061.30 ± 0.031.71 ± 0.021.76 ± 0.010.51 ± 0.030.44 ± 0.00
28 daysP12.42 ± 0.00 *2.31 ± 0.03 *2.40 ± 0.00 *2.35 ± 0.03 *1.28 ± 0.02 *1.06 ± 0.01 *
P311.17 ± 0.021.55 ± 0.031.61 ± 0.012.00 ± 0.000.50 ± 0.000.53 ± 0.02
35 daysP12.45 ± 0.02 *2.43 ± 0.01 *2.44 ± 0.01 *2.44 ± 0.03 *1.00 ± 0.03 *1.40 ± 0.01 *
P311.20 ± 0.011.60 ± 0.001.75 ± 0.001.98 ± 0.030.57 ± 0.010.59 ± 0.04
42 daysP12.27 ± 0.08 *2.58 ± 0.02 *2.47 ± 0.05 *2.63 ± 0.00 *0.80 ± 0.01 *1.08 ± 0.04 *
P311.23 ± 0.001.72 ± 0.011.68 ± 0.002.07 ± 0.000.55 ± 0.000.53 ± 0.00
49 daysP12.20 ± 0.05 *2.38 ± 0.06 *2.41 ± 0.03 *2.49 ± 0.04 *0.77 ± 0.03 *0.89 ± 0.08 *
P311.18 ± 0.011.72 ± 0.061.66 ± 0.022.06 ± 0.060.46 ± 0.000.53 ± 0.03
Vertical comparison. The data are represented as mean values ± standard error (with three replicates). * Indicates a significant level of 5%.
Table 3. Changes in nodule nitrogen fixation accumulation under low-P stress (mg/plant).
TreatmentsAbovegroundRootNodule
202220232022202320222023
7 daysP110.26 ± 0.17 *11.76 ± 0.00 *5.86 ± 0.113.18 ± 0.02 *0.89 ± 0.00 *0.79 ± 0.06 *
P3116.67 ± 0.5124.11 ± 0.155.42 ± 0.024.33 ± 0.133.42 ± 0.066.54 ± 0.26
14 daysP110.99 ± 0.11 *13.54 ± 0.71 *5.50 ± 0.09 *2.31 ± 0.11 *1.07 ± 0.01 *1.57 ± 0.01 *
P3140.34 ± 1.5931.33 ± 0.797.01 ± 0.224.22 ± 0.099.10 ± 0.376.32 ± 0.15
21 daysP114.56 ± 0.79 *11.49 ± 0.50 *5.81 ± 0.11 *4.53 ± 0.11 *0.86 ± 0.10 *1.61 ± 0.08 *
P3185.36 ± 1.55128.9 ± 0.5018.31 ± 0.2818.81 ± 0.8622.70 ± 0.4321.08 ± 0.19
28 daysP120.06 ± 0.71 *15.03 ± 0.75 *6.94 ± 0.29 *4.50 ± 0.03 *1.37 ± 0.04 *1.73 ± 0.12 *
P31160.14 ± 7.94159.62 ± 7.7534.13 ± 0.8726.14 ± 0.8028.49 ± 0.9720.55 ± 1.02
35 daysP126.56 ± 0.75 *19.61 ± 1.10 *10.80 ± 0.82 *4.46 ± 0.02 *2.54 ± 0.21 *1.44 ± 0.11 *
P31256.88 ± 7.70225.39 ± 2.3943.48 ± 1.3131.36 ± 1.5030.63 ± 0.5029.12 ± 0.02
42 daysP158.44 ± 1.28 *26.11 ± 1.54 *13.38 ± 0.37 *7.83 ± 0.82 *5.07 ± 0.00 *1.88 ± 0.09 *
P31267.45 ± 1.61200.22 ± 4.5144.03 ± 1.1444.77 ± 0.5033.43 ± 0.5925.55 ± 1.31
49 daysP1101.24 ± 4.32 *58.84 ± 6.80 *24.97 ± 1.04 *15.85 ± 0.32 *8.62 ± 0.05 *3.96 ± 0.31 *
P31287.07 ± 2.21295.93 ± 11.3958.63 ± 1.5634.78 ± 1.5540.28 ± 0.5421.48 ± 1.43
Vertical comparison. The data are represented as mean values ± standard error (with three replicates). * Indicates a significant level of 5%.
Table 4. Changes in ratio of nodule nitrogen fixation under low-P stress (%).
TreatmentsAbovegroundRootNodule
202220232022202320222023
7 daysP142.79 ± 0.3237.01 ± 0.1436.05 ± 1.49 *33.37 ± 0.56 *72.41 ± 0.16 *66.49 ± 0.56 *
P3142.18 ± 0.7836.09 ± 0.7445.57 ± 0.1640.40 ± 1.8863.53 ± 0.3474.16 ± 0.08
14 daysP136.93 ± 0.21 *28.35 ± 0.88 *32.85 ± 0.6123.36 ± 1.77 *69.86 ± 1.05 *61.27 ± 1.67 *
P3144.42 ± 0.4233.97 ± 1.5935.80 ± 1.4329.72 ± 0.2581.29 ± 0.0674.39 ± 1.30
21 daysP130.20 ± 0.03 *24.76 ± 1.47 *30.76 ± 0.94 *26.54 ± 1.02 *69.54 ± 1.26 *60.23 ± 0.13 *
P3159.78 ± 1.8757.20 ± 1.1448.20 ± 0.8441.95 ± 0.4884.63 ± 0.9385.57 ± 0.26
28 daysP126.75 ± 0.11 *23.80 ± 1.15 *27.35 ± 0.05 *22.60 ± 1.02 *61.31 ± 0.77 *64.94 ± 0.61 *
P3164.50 ± 0.6548.96 ± 1.1651.38 ± 0.3434.17 ± 0.0184.83 ± 0.0782.56 ± 0.67
35 daysP125.90 ± 0.70 *20.04 ± 0.41 *26.13 ± 0.56 *19.75 ± 1.02 *69.88 ± 0.93 *53.78 ± 0.57 *
P3163.65 ± 0.4447.44 ± 0.3146.98 ± 0.2434.72 ± 0.9982.73 ± 0.4880.45 ± 1.45
42 daysP131.32 ± 0.24 *14.87 ± 0.77 *25.31 ± 1.51 *13.35 ± 0.07 *75.71 ± 0.46 *64.44 ± 1.51 *
P3162.83 ± 0.0443.17 ± 0.4449.14 ± 0.1931.94 ± 0.0983.37 ± 0.1282.56 ± 0.21
49 daysP133.52 ± 1.51 *21.57 ± 2.00 *26.97 ± 1.08 *17.88 ± 1.47 *76.73 ± 0.96 *70.75 ± 2.67 *
P3164.27 ± 0.3443.30 ± 2.1649.91 ± 0.7532.25 ± 2.2886.09 ± 0.2782.67 ± 1.09
Vertical comparison. The data are represented as mean values ± standard error (with three replicates). * Indicates a significant level of 5%.
Table 5. Pairwise comparison of pathways and compound differences.
PathwayCompoundsUpregulatedDownregulated
P1_Leaf_7d-P31_Leaf_7d37261511
P1_Leaf_14d-P31_Leaf_14d3726179
P1_Leaf_21d-P31_Leaf_21d3726197
P1_Root_7d-P31_Root_7d3726188
P1_Root_14d-P31_Root_14d37261412
P1_Root_21d-P31_Root_21d37261313
P1_Nodule_7d-P31_Nodule_7d3726188
P1_Nodule_14d-P31_Nodule_14d3726197
P1_Nodule_21d-P31_Nodule_21d37261214
Disclaimer/Publisher’s Note: The statements, opinions and data contained in all publications are solely those of the individual author(s) and contributor(s) and not of MDPI and/or the editor(s). MDPI and/or the editor(s) disclaim responsibility for any injury to people or property resulting from any ideas, methods, instructions or products referred to in the content.

