Article

Calibration and Simulation Analysis of Light, Temperature, and Humidity Environmental Parameters of Sawtooth Photovoltaic Greenhouses in Tropical Areas

1
Sanya Institute of Breeding and Multiplication, Hainan University, Sanya 572025, China
2
School of Tropical Agriculture and Forestry, Hainan University, Haikou 570228, China
*
Author to whom correspondence should be addressed.
Agronomy 2025, 15(4), 857; https://doi.org/10.3390/agronomy15040857
Submission received: 19 February 2025 / Revised: 18 March 2025 / Accepted: 27 March 2025 / Published: 29 March 2025

Abstract

:
To investigate the light and temperature environmental parameters of photovoltaic greenhouses in tropical areas, this study adopted experimental measurement and simulation methods to test and simulate the photosynthetically active radiation (PAR), relative temperature and humidity, and other environmental parameters inside and outside two types of serrated photovoltaic greenhouses in Langheng Village, Yangpu, Hainan. The study aimed to explore the distribution laws of PAR, light transmission rates, and relative humidity and temperature inside and outside double-slope and single-slope photovoltaic greenhouses. The ridges of both types of greenhouses run east to west, with photovoltaic panels arranged on the south-facing slopes, covering 57% of the area. The results show the following: (1) The trends of PAR inside and outside both types of photovoltaic greenhouses were consistent across all seasons, with the annual average values were 164.98 μmol/(m2·s) for double-slope and 127.59 μmol/(m2·s) for single-slope; (2) The annual average light transmission rates were 23.91% for double-slope and 19.17% for single-slope; (3) The average indoor temperatures in both types of greenhouses were higher than outside in all seasons, with a temperature difference ranging between 1 and 3 °C; (4) The indoor relative humidity in both types of greenhouses was higher than outside, with the difference reaching up to 6% during summer and autumn; (5) The annual light transmission rates for both types of greenhouses were simulated using Design Builder. The simulation results were generally consistent with the measured values, with the simulated values being higher overall than the measured ones by an average difference within 5%. In summary, the average light transmission rate of the double-slope photovoltaic greenhouse was 4.74% higher that of the single-slope photovoltaic greenhouse and the PAR was 37.39 μmol/(m2·s) higher than the single-slope. Additionally, the average temperature in the double-slope greenhouse was slightly higher and the relative humidity was slightly lower than that in the single-slope greenhouse. Both types of greenhouses could meet the light, temperature, and humidity requirements for cultivating leafy vegetables in tropical areas. Except for the temperature parameters in summer, the performance of the double-slope photovoltaic greenhouse was also better. The Design Builder simulation results showed little difference to the actual measurements and their trends were also consistent. The light transmission rate of photovoltaic greenhouses can be simulated by setting the overall light transmission coefficient of the light-transmitting roofing materials.

1. Introduction

Photovoltaic greenhouses refer to agricultural production facilities that cover part of the greenhouse roof with PV panels in order to generate solar power while meeting the necessary light and temperature conditions required for crop growth inside the greenhouse [1]. Supported by national policies in recent years, the agri-photovoltaic industry centered around photovoltaic greenhouses has been developed rapidly. Exploratory construction of photovoltaic greenhouses has been carried out in various regions across China such as Shouguang in Shandong, Chengde in Hebei, Changzhou in Jiangsu, Shangrao in Jiangxi, and Lingao in Hainan. The performance of photovoltaic greenhouses is closely related not only to the climatic conditions of the local area but also to the growing environment of the crops. Therefore, the construction of photovoltaic greenhouses should consider the specific light and temperature conditions both inside and outside the greenhouse in different areas, as well as the growing requirements of the crops. The study of the light and temperature environment parameters of photovoltaic greenhouses in different areas not only provides essential references for their design and construction but also offers reliable plans for their agricultural management.
The coverage rate of PV panels on the roof of photovoltaic greenhouses significantly affects the intensity and uniformity of light entering the greenhouse. Early research mainly focused on the arrangement of PV panels, which is also the core of designing photovoltaic greenhouse structures. The traditional PV greenhouses are usually covered with non-transparent PV panels or flexible PV panels on the upper or lower part of the greenhouse roof [2,3,4,5,6]. The checkerboard PV panel arrangement performed better than the traditional linear arrangement [7,8,9], compared to the environmental parameters between asymmetric-roofed greenhouse and Venlo-style greenhouse equipped with PV panels on the roof, and the results showed that the solar radiation transmittance of asymmetric-roofed greenhouse was 41.6%, and that of Venlo-style greenhouse was 46% [10]. In addition to the improvement of the arrangement and coverage of PV panels, dynamic systems that can change shading [11,12] or translucent PV modules can be used to reduce shading and obtain a more uniform light distribution [13]. An experiment on lettuce indicated that translucent PV panels and diffuse films can increase crop yield [14].
With deepening research, a wide range of discussions have been carried out on PV panel coverage and crop growth in PV greenhouses. The yield differences between 14 greenhouse horticultural and floral crops in four commercial PV greenhouse types in Southern Europe, with the PV coverage of the greenhouses ranging from 25% to 100% [15]. The light condition and light requirements of the crops were set based on the DLI in the PV greenhouses, and potential yields were estimated. The results showed that a PV coverage of 25% or lower can satisfy the growth of crops with high light demand (e.g., tomatoes, cucumbers, and bell peppers); a PV coverage of 25~60% can satisfy the growth of crops with a daily light accumulation of less than 17 mol/m2/d, which have a medium light demand (e.g., asparagus); a PV coverage of 60~100% can satisfy the growth of flower species with a daily light accumulation of less than 100 mol/m2/d, which have a low light demand (e.g., poinsettia, kalanchoe, and lobelia); and the yield and fruit quality of tomatoes grown in PV greenhouses is ensured with a PV coverage of 9.8~10% [16,17]. The results showed that a small reduction in PAR resulting from PV panels had no effect on the total yield and fruit quality, but would reduce the fruit diameter. The effects of PV coverage on tomato yields was studied, and it was found that a PV coverage of 25% was the best when there was no significant effect on the tomato yield. In addition, many researchers have studied the impact of PV coverage on the yield of leafy vegetable crops [18,19]. The microclimate and the growth and yield of lettuce in the greenhouse was optimized with a PV coverage of 20% [20]. The results showed that the growth and yield of lettuce in the greenhouse with PV coverage of 20% were similar to that with no PV coverage. The yield of Chinese cabbage in ordinary plastic greenhouses was compared with those in greenhouses covered with PV panels (38% coverage), and the results showed that there was no significant difference in the yield of Chinese cabbage between ordinary plastic greenhouses and greenhouses with PV coverage of 38% [21].
The coverage rate of roof PV panels of photovoltaic greenhouses can affect the internal light, temperature, humidity, and other environment parameters, thereby influencing the growth and yield of crops within the greenhouse. Researchers assessed the indoor and outdoor temperatures, humidity, and illumination in the photovoltaic greenhouse and found that when a wet curtain fan cooling system was used, the temperature could be reduced by 0.5–7.8 °C, the average transmittance in summer could reach 66.27%, and the illumination could meet the light requirements for crop growth [22]. Another study tested the light and temperature environment in photovoltaic greenhouses and traditional greenhouses in the tropical area of Hainan. The results indicated that the light intensity, temperature, and humidity levels in photovoltaic greenhouses could meet the production requirements of shade-tolerant and light-neutral crops (e.g., Brassica chinensis L.; Brassica campestris L.; Ipomoea aquatica; Brassica juncea; Lactuca sativa; Spinacia oleracea; etc.) [23].
The light and temperature environmental parameters of photovoltaic greenhouses can be precisely measured by monitoring equipment or accurately predicted by simulation software. The proper use of current analysis software can help to obtain the required data faster and more conveniently, and the feasibility of the simulation predictions can be verified by comparing the field measurements. Design Builder is relatively developed in current simulations of photothermal environmental parameters. The CFD model in Design Builder (https://designbuilder.co.uk/) was used to simulate the effects of south-facing PV panel shading on the environmental parameters and plant production in a single greenhouse. The results showed that during a summer day, the solar radiation in the PV greenhouse was 115 W/m2 lower than that in the control greenhouse, and the difference in solar radiation between the indoor and the outdoor of the PV greenhouse reached 220 W/m2 [24].
The research on photothermal environmental parameters of photovoltaic greenhouses not only provides the basis for researchers to design greenhouses, but also provides the research direction for the intelligent control of photovoltaic greenhouse environment in the future. In recent years, the application of smart sensors and Internet of Things technology has further promoted the intelligent development of greenhouse control technology [25]. Through real-time monitoring and data analysis, the greenhouse environmental control system can automatically adjust light, temperature, humidity, and other parameters according to the physiological needs of plants, so as to achieve the goal of regulating the greenhouse environment to meet the needs of plant growth [26]. The core of greenhouse control technology is to optimize plant growth conditions to the maximum extent through precise environmental regulation. For example, the precise control of photosynthetically active radiation (PAR) can significantly improve the photosynthetic efficiency of plants, while reasonable regulation of temperature helps to avoid growth inhibition of plants at extreme temperatures [27]. In addition, real-time monitoring of relative humidity can help farmers better manage irrigation systems and reduce water waste. The photothermal environmental parameters of photovoltaic greenhouses provide favorable conditions for the study of greenhouse environmental control, and the automatic control of the greenhouse environment is related to the stability and suitability of the crop-growing environment [28].
The photovoltaic greenhouse vegetable production base in Langheng Village, Yangpu District, Hainan Province, is one of the technologically advanced bases among the permanent annual vegetable bases established in Hainan Province. The production base was developed by Hainan University and funded by Hainan Huayukang New Energy Technology Co., Ltd. (Haikou, China). The facility spans nearly 200,000 square meters with a construction scale of 15 MW. This paper focuses on the double-slope and single-slope photovoltaic greenhouses at this base. The data on PAR, relative humidity, and temperature inside and outside the greenhouses were collected using monitoring equipment, and the distribution laws of light intensity, temperature, and relative humidity within the greenhouses were analyzed. The simulations on the two types of greenhouses were conducted by Design Builder software to analyze their light transmittance and compare with actual measurements to verify the reliability of the simulation method and the accuracy of the parameters for practical production applications.

2. Materials and Methods

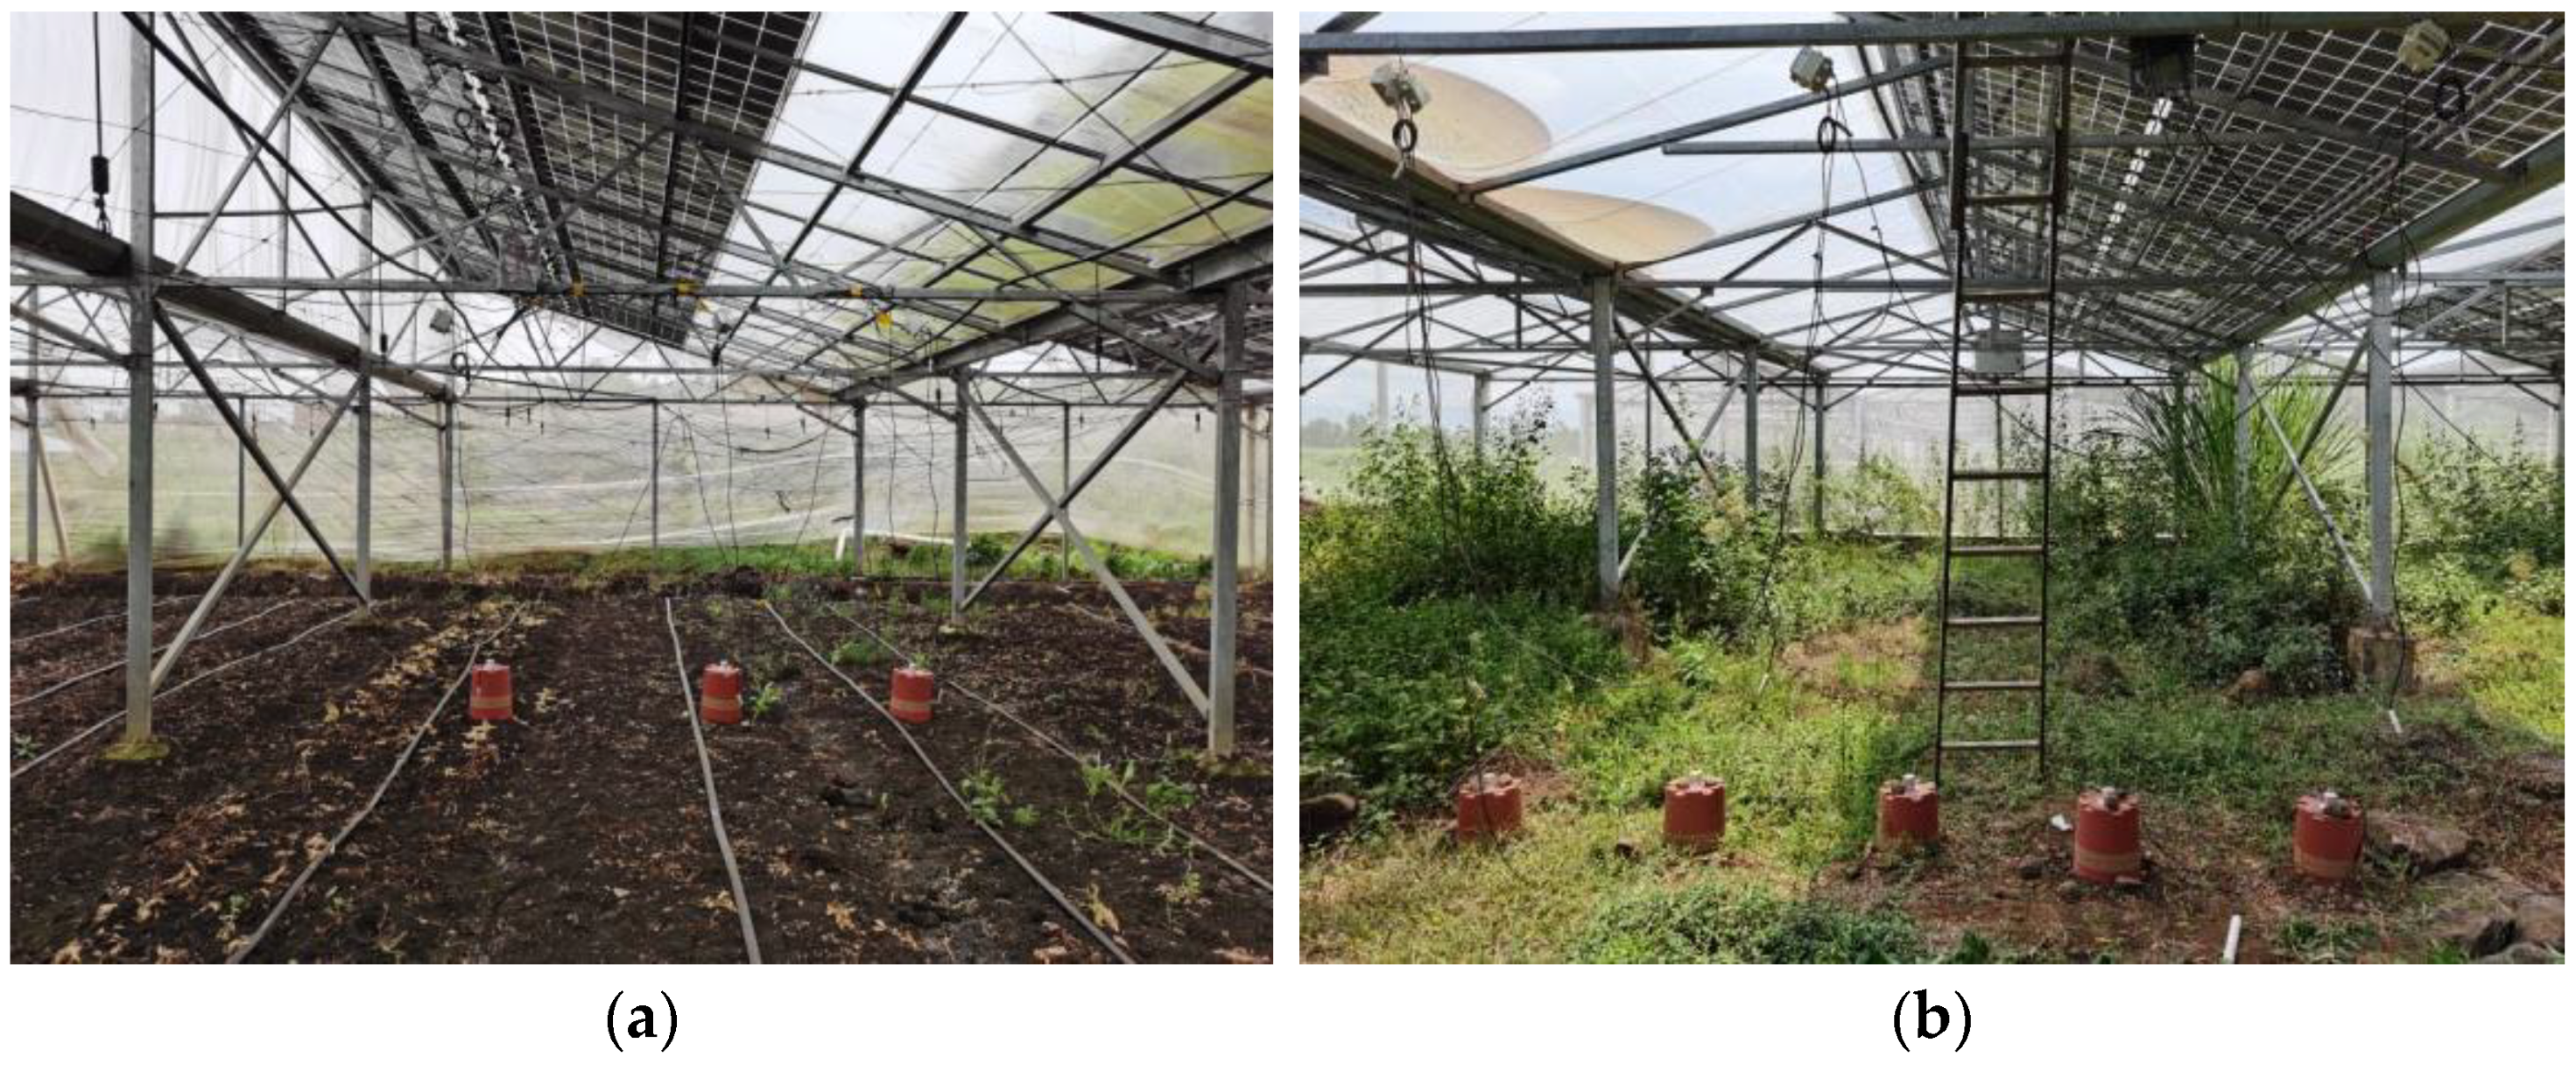
2.1. Structural Parameters of Photovoltaic Greenhouse

The serrated photovoltaic greenhouses used in this experiment have a span of 5.5 m, a bay width of 4 m, a shoulder height (interior clear height) of 2.4 m, a total length of 82.5 m from north to south, and a total width of 40 m from east to west. The single-slope greenhouse has a ridge height of 4.095 m, while the double-slope greenhouse has a ridge height of 3.561 m. The photovoltaic greenhouses were divided into double-slope photovoltaic greenhouse (Figure 1a) and single-slope photovoltaic greenhouse (Figure 1b) according to the forms of the roof structure. The greenhouses were also called serrated photovoltaic greenhouses due to the serrated-like arrangement of their roof structures. Aside from the roof design and the materials used for the light-receiving surfaces, all other design parameters were the same for both types of greenhouses. The greenhouses were covered with 40-mesh insect-proof screens on their facades, and there were no window systems or mechanical ventilation equipment installed inside. The mesh of the insect-proof screens allows for natural ventilation, and during extremely high temperatures, the screens can be rolled up to make the walls completely transparent, enhancing ventilation and the cooling effects.
The greenhouse ridges run east to west, with PV panels installed on the southern slope of the roof. The single-slope photovoltaic greenhouse roof was covered with dual-glass PV panels and 5 mm tempered glass (light-receiving surface), both mounted in specialized aluminum frames and sealed at the joints with structural adhesive. The size of the dual-glass PV panels was 1650 mm × 992 mm, and the light transmittance of the PV panels was about 5%. Each span of the roof was fitted with 68 panels, totaling 1020 panels for the entire greenhouse. Based on the projected area, the coverage rate of PV panels on the single-slope photovoltaic greenhouse was 57%, and the combined light-transmitting area accounted for 43% of the roof. The double-slope photovoltaic greenhouse roof was covered with similar PV panels and films (light-receiving surface), with the serrated ridge covered with a 40-mesh insect-proof screen. Based on the projected area, the coverage rate of PV panels in the double-slope photovoltaic greenhouse was also 57%, and the combined light-transmitting area accounted for 43% of the roof. The greenhouse has been in operation for approximately one year, and both the film and glass showed minor levels of contamination (such as dust and moss).

2.2. Test Equipment

Environment monitoring host: used for storing and uploading collected data; (2) PAR sensor: produced by Shandong Jiandarenke Electronic Technology Co., Ltd. (Shandong, China), model RS-XZJ-100-Y-4G, with a measurement range of 0~2500 μmol/ (m2·s) and an accuracy of ±5% (at 1000 μmol/(m2·s), @550 nm, 60%, 25 °C), which was used to collect data of PAR; (3) temperature and humidity transmitter: also produced by Shandong Jiandarenke Electronic Technology Co., Ltd., model RS-XZJ-100-Y-4G, with a temperature range of −40 to 80 °C and an accuracy of 0.5 °C, and a relative humidity range of 0~100% RH and an accuracy of 3% RH (60%, 25 °C), which was used for collecting temperature and humidity data.

2.3. Test Methods

Continuous monitoring was conducted from January 2022 to December 2022, collecting a full year of temperature, relative humidity, and PAR data. Data analysis was carried out according to meteorological division into different seasons: March to May as spring, June to August as summer, September to November as autumn, and December to February as winter. By analyzing the data from each region, the changes in microclimatic parameters within the photovoltaic greenhouse were investigated.
The specific experimental setup is as follows:
(1)
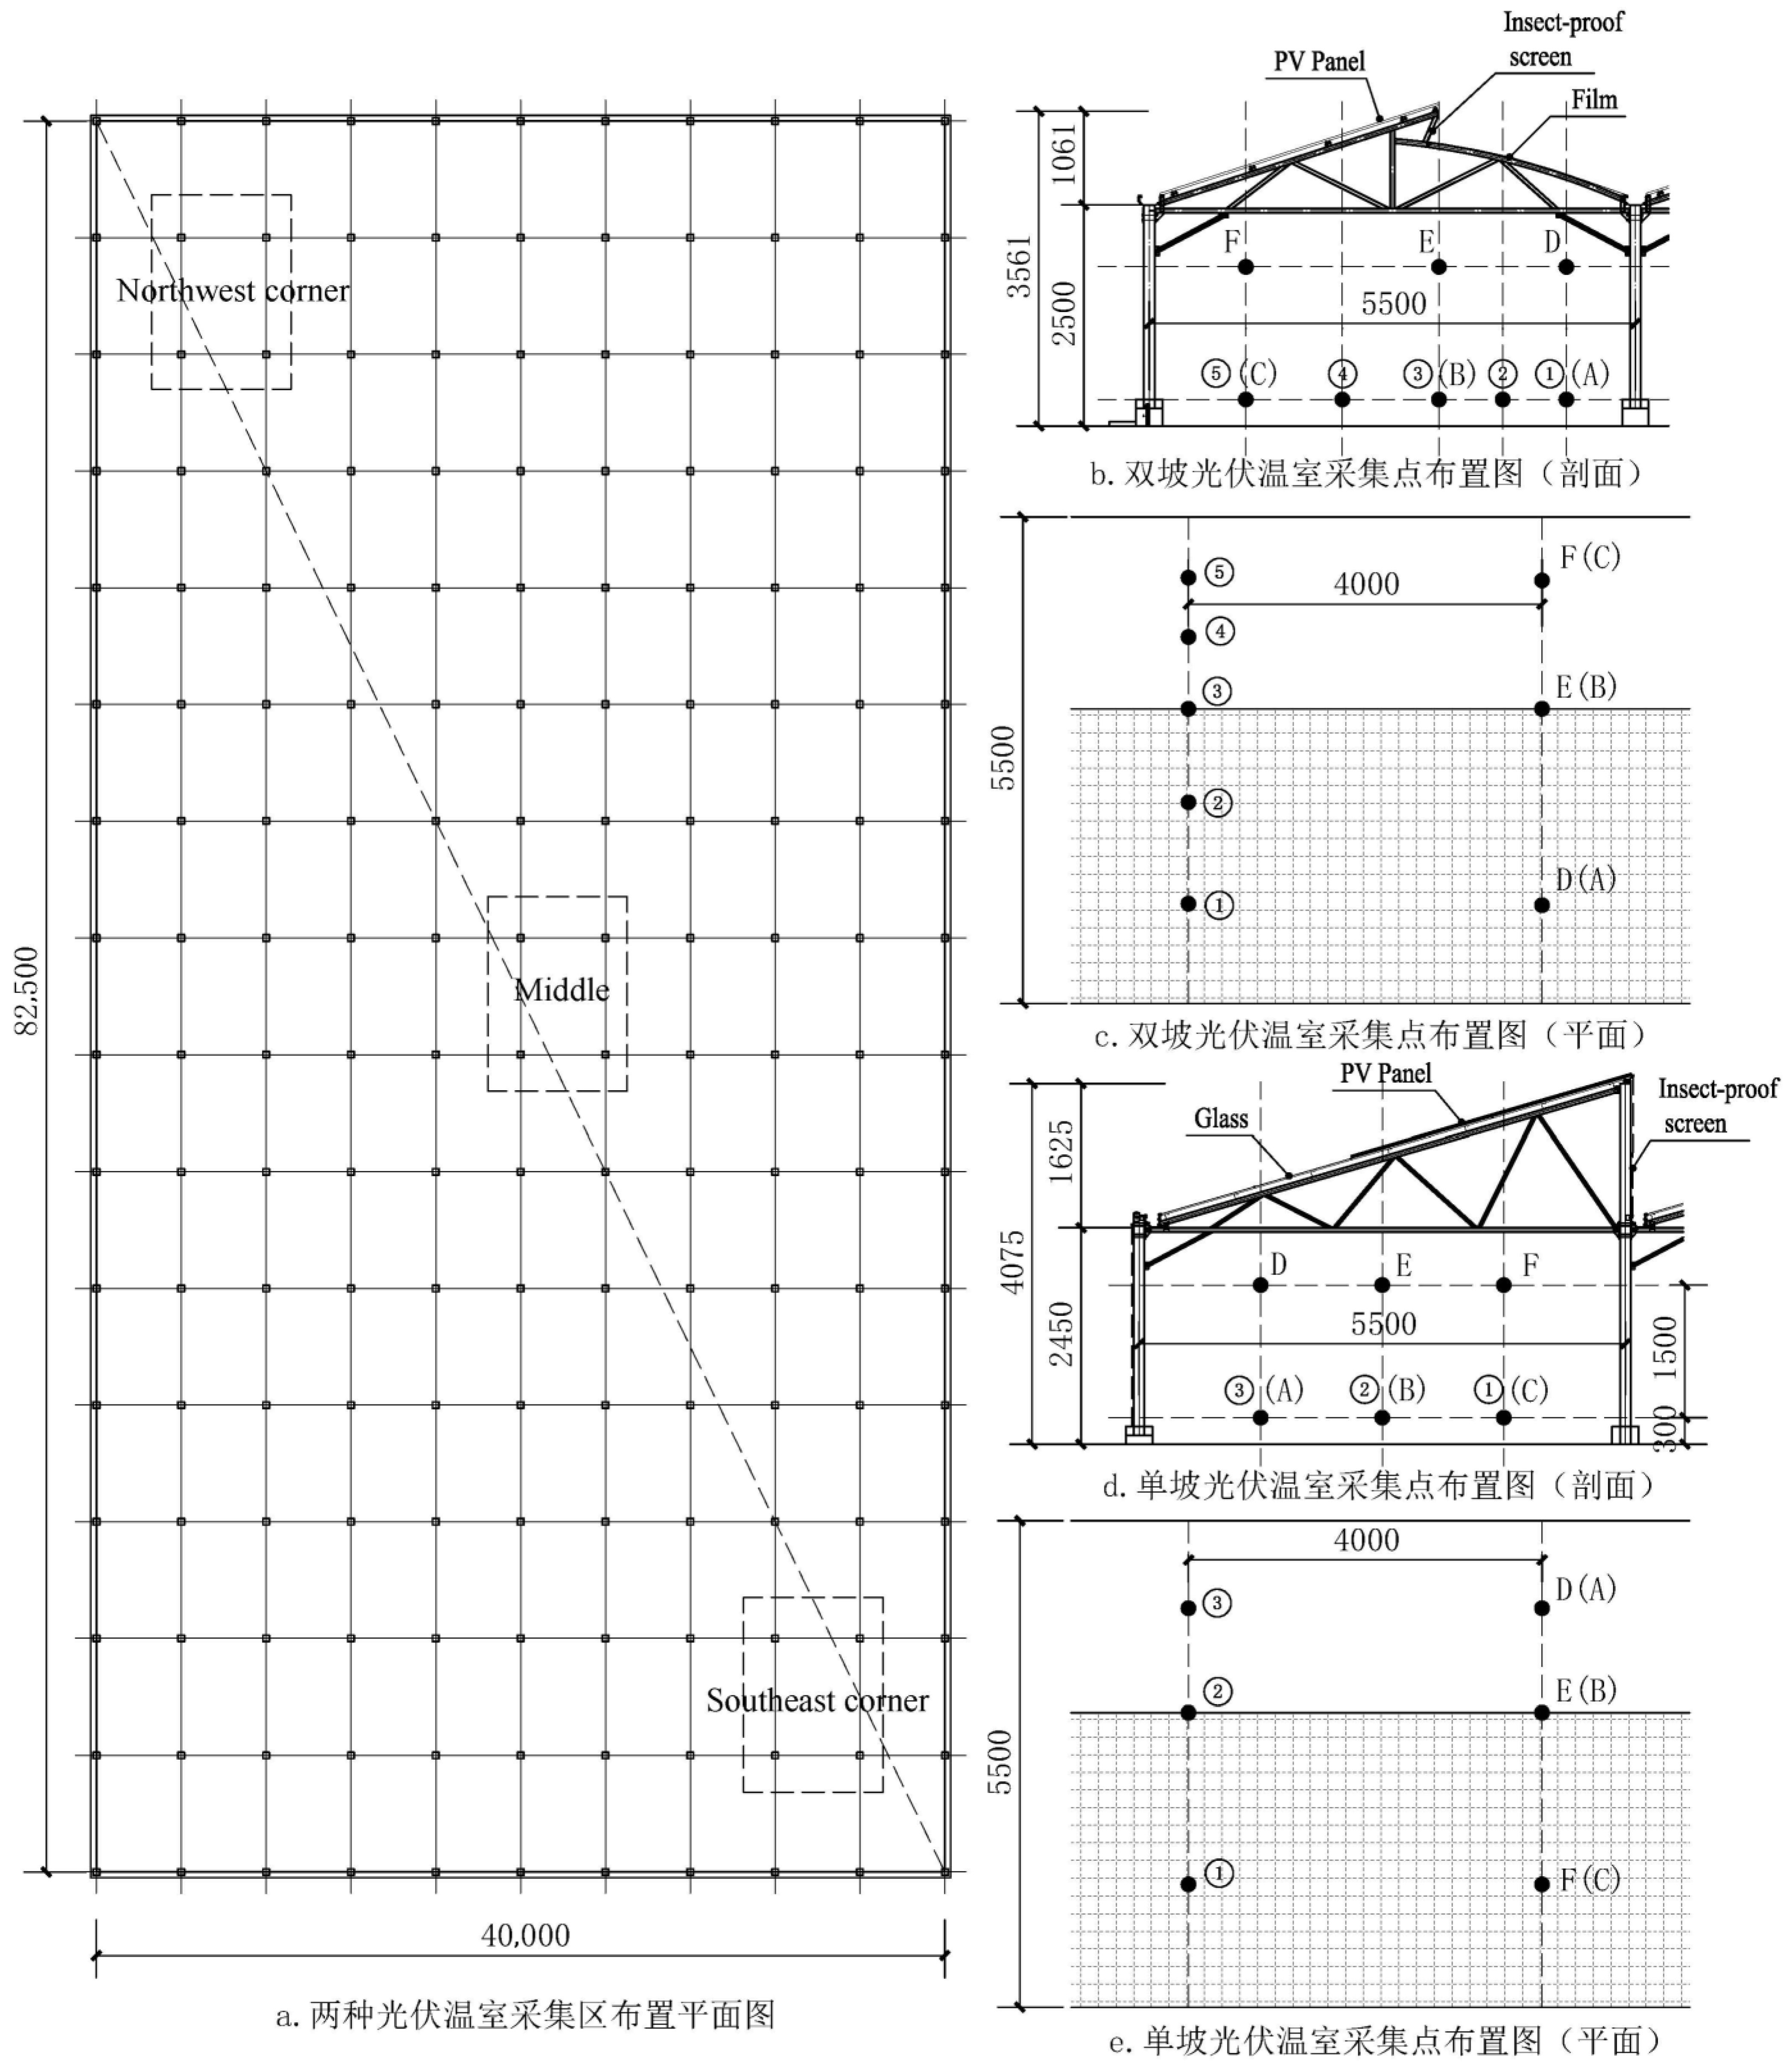
PAR: the PAR inside and outside the greenhouse was monitored and recorded by the environment monitoring host and the PAR sensor. The data were recorded every 30 min. Three measurement areas were selected along the diagonal of the greenhouse, located at both ends and the middle of the diagonal (see Figure 2a). In each measurement area, five points were arranged horizontally in the double-slope photovoltaic greenhouse (points ①, ②, ③, ④, and ⑤) (see Figure 2b,c), and, vertically, a test height of 30 cm was set. In the single-slope photovoltaic greenhouse, three points were arranged (points ①, ②, and ③) (see Figure 2d,e), and one point was set outside the greenhouse.
(2)
Temperature and humidity: the temperature and humidity inside and outside the greenhouse were continuously monitored and recorded by the environment monitoring host and the temperature–humidity transmitter. The data were collected every 30 min. Similarly to the PAR setup, three measurement areas were selected along the diagonal of the greenhouse, located at both ends and the middle of the diagonal (see Figure 2a). Considering the impact of the “edge effect”, the areas at both ends started from the second span and the second bay away from the edge. In each measurement area, six points were arranged horizontally (points A, B, C, and D, E, F) (see Figure 2b–e). Considering the height range of planting materials and human activity within the greenhouse, two vertical test heights were set: 30 cm and 180 cm, and one outside point was set on the greenhouse roof. For data analysis, full-day data were used.

2.4. Data Processing

2.4.1. Data Selection

(1)
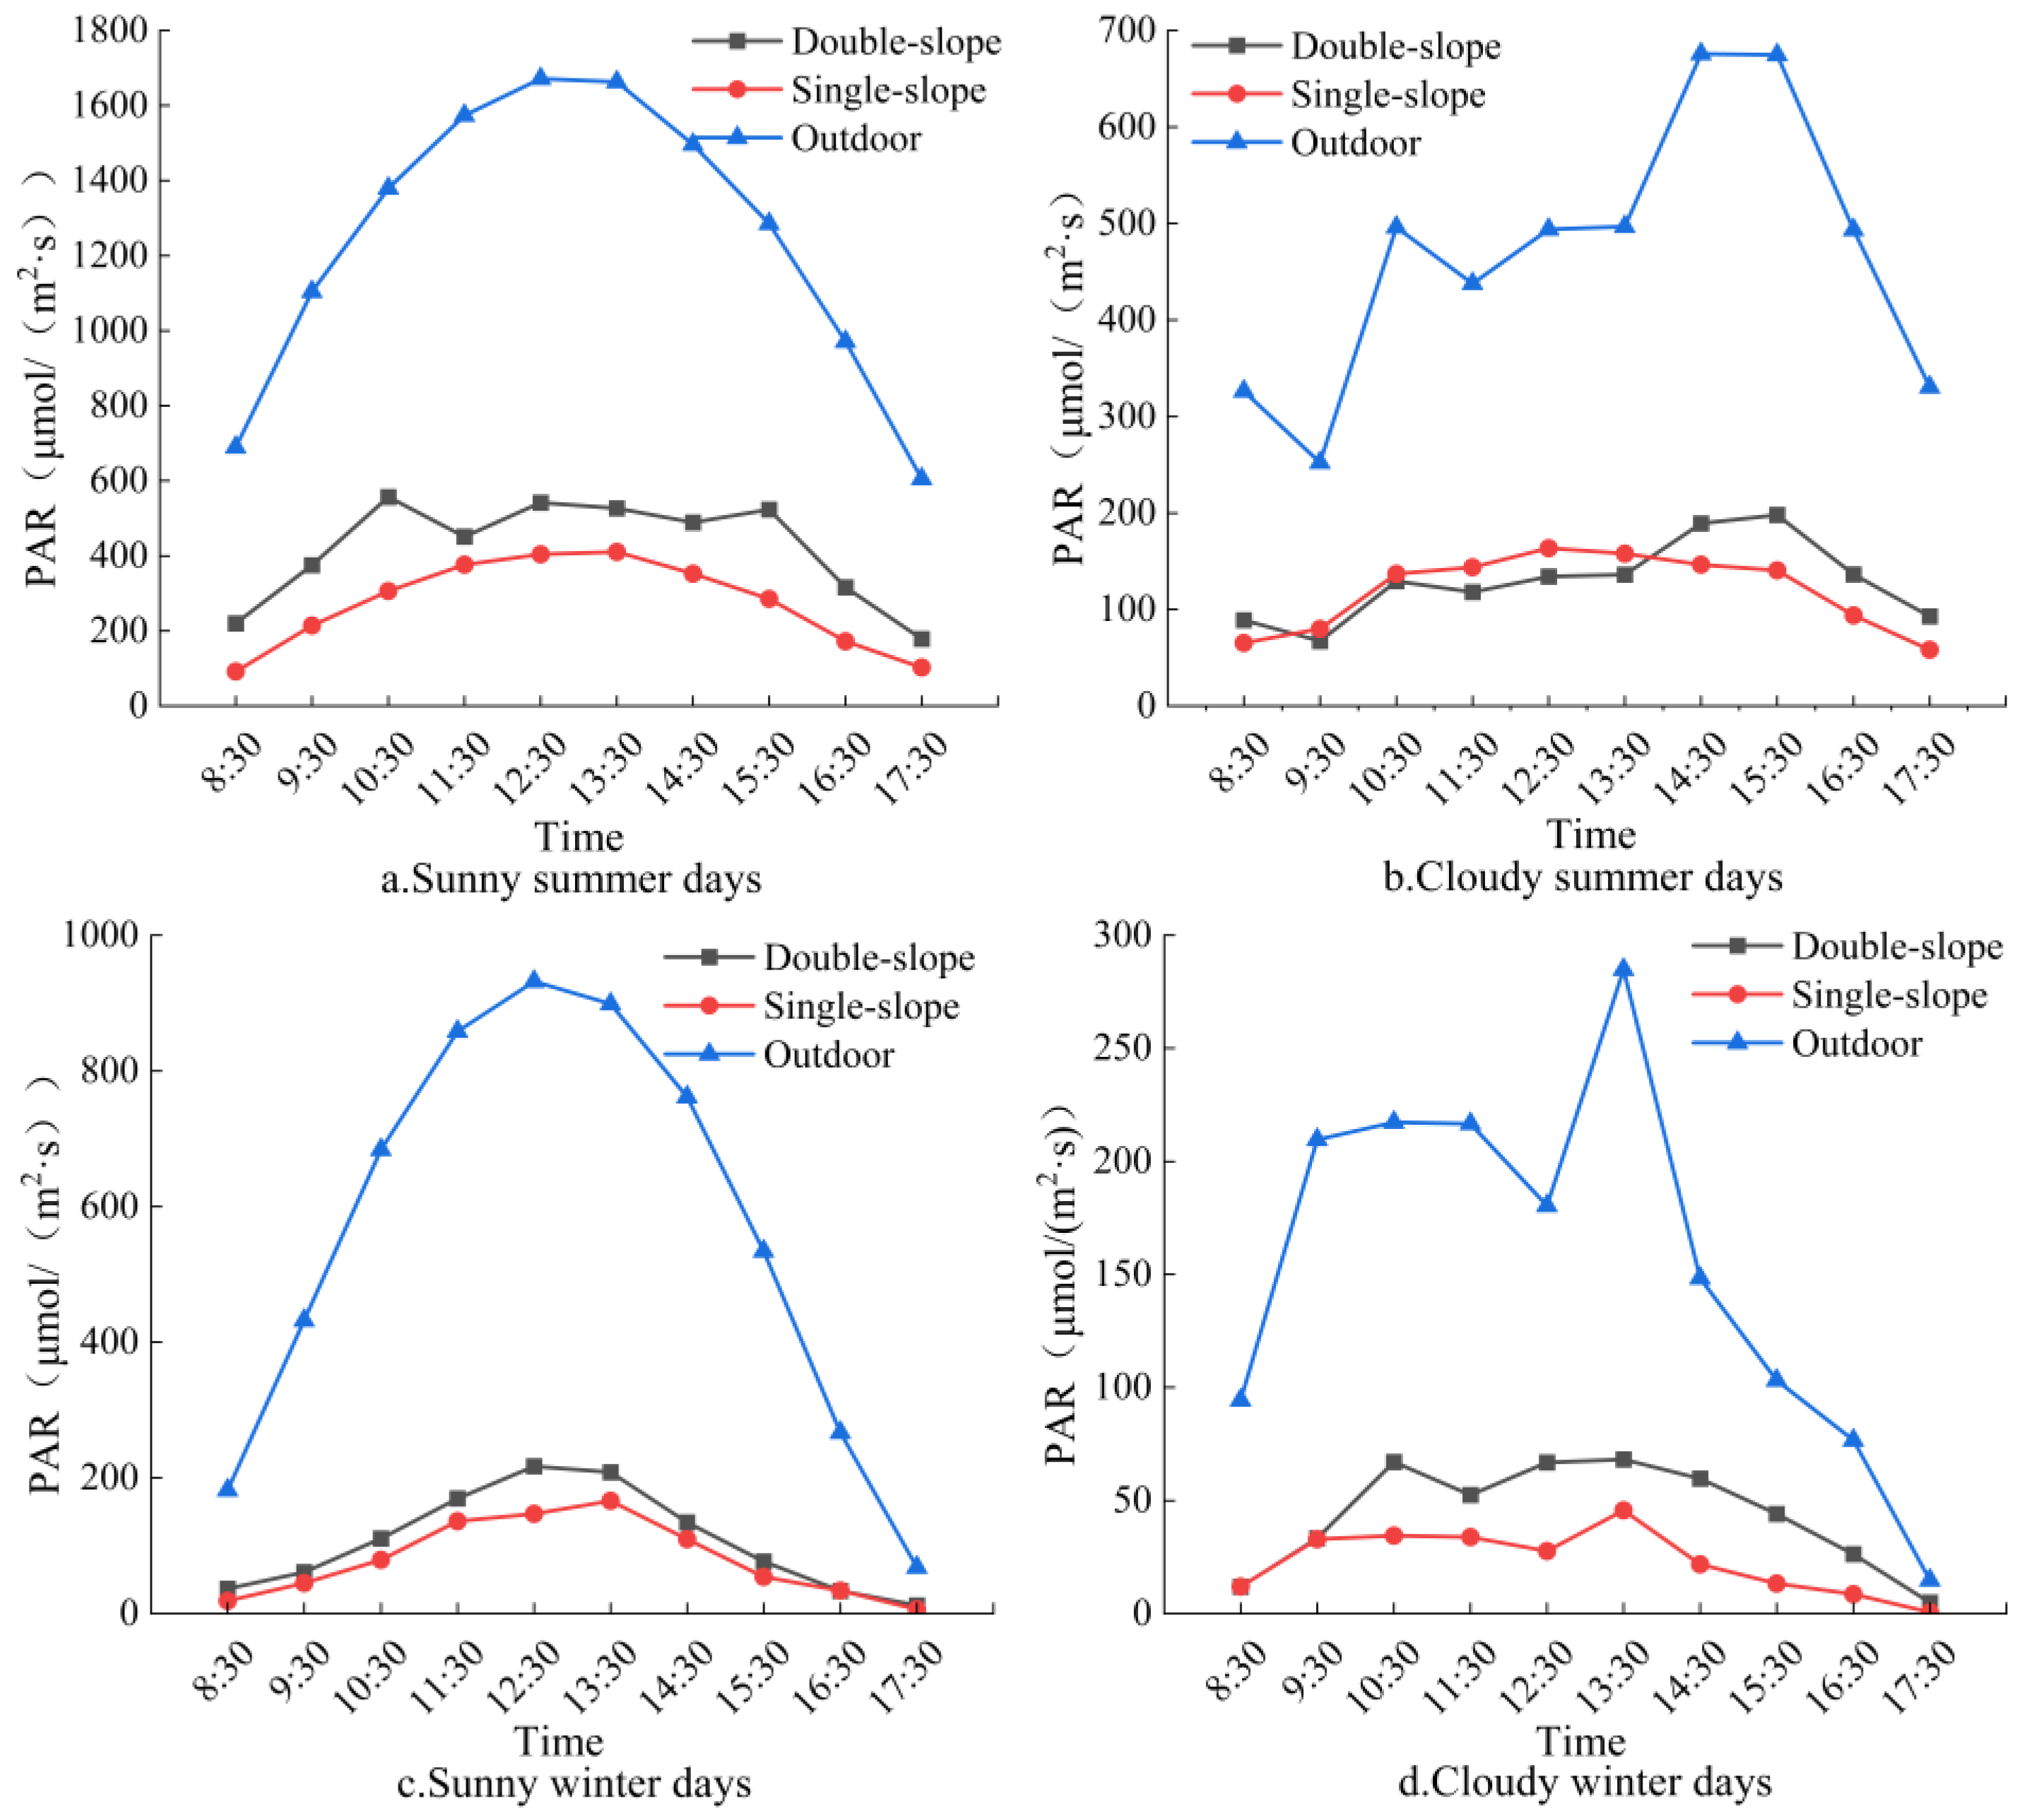
PAR: When analyzing seasonal changes, the data from January to December 2022 during 8:00~18:00 were selected. When analyzing spatial distribution, the data from the same period as above were chosen. When analyzing typical weather conditions, the data from days around the summer solstice (clear on 27 June 2022, and cloudy on 10 June 2022) and the winter solstice (clear on 19 December 2022, and cloudy on 20 December 2022) during 8:00~18:00 were used.
(2)
Temperature and relative humidity: When analyzing seasonal changes, the data from January to December 2022 during 0:00~24:00 were selected. When analyzing spatial distribution, the data from the same period were selected. When analyzing typical weather conditions, the data from days around the summer solstice (clear on 27 June 2022, and cloudy on 10 June 2022) and the winter solstice (clear on 19 December 2022, and cloudy on 20 December 2022) during 0:00~24:00 were used.
The data were collected every 30 min, and the data analysis involves averaging the measured data within the analysis time periods.

2.4.2. Methods and Software

(1)
Data Analysis:
In the data processing, we calculated the mean to describe the central tendency of the data and used the mean deviation and standard deviation to assess the dispersion of the data. Additionally, to further analyze the differences between the data, we calculated the abc difference. To visually display the data distribution and its variability, the results are presented in bar charts, with error bars added to represent the standard deviation.
(2)
Software:
SPSS 26.0, Excel 2023, and Origin 2022.

3. Results and Analyses

3.1. Analysis of Photosynthetically Active Radiation (PAR)

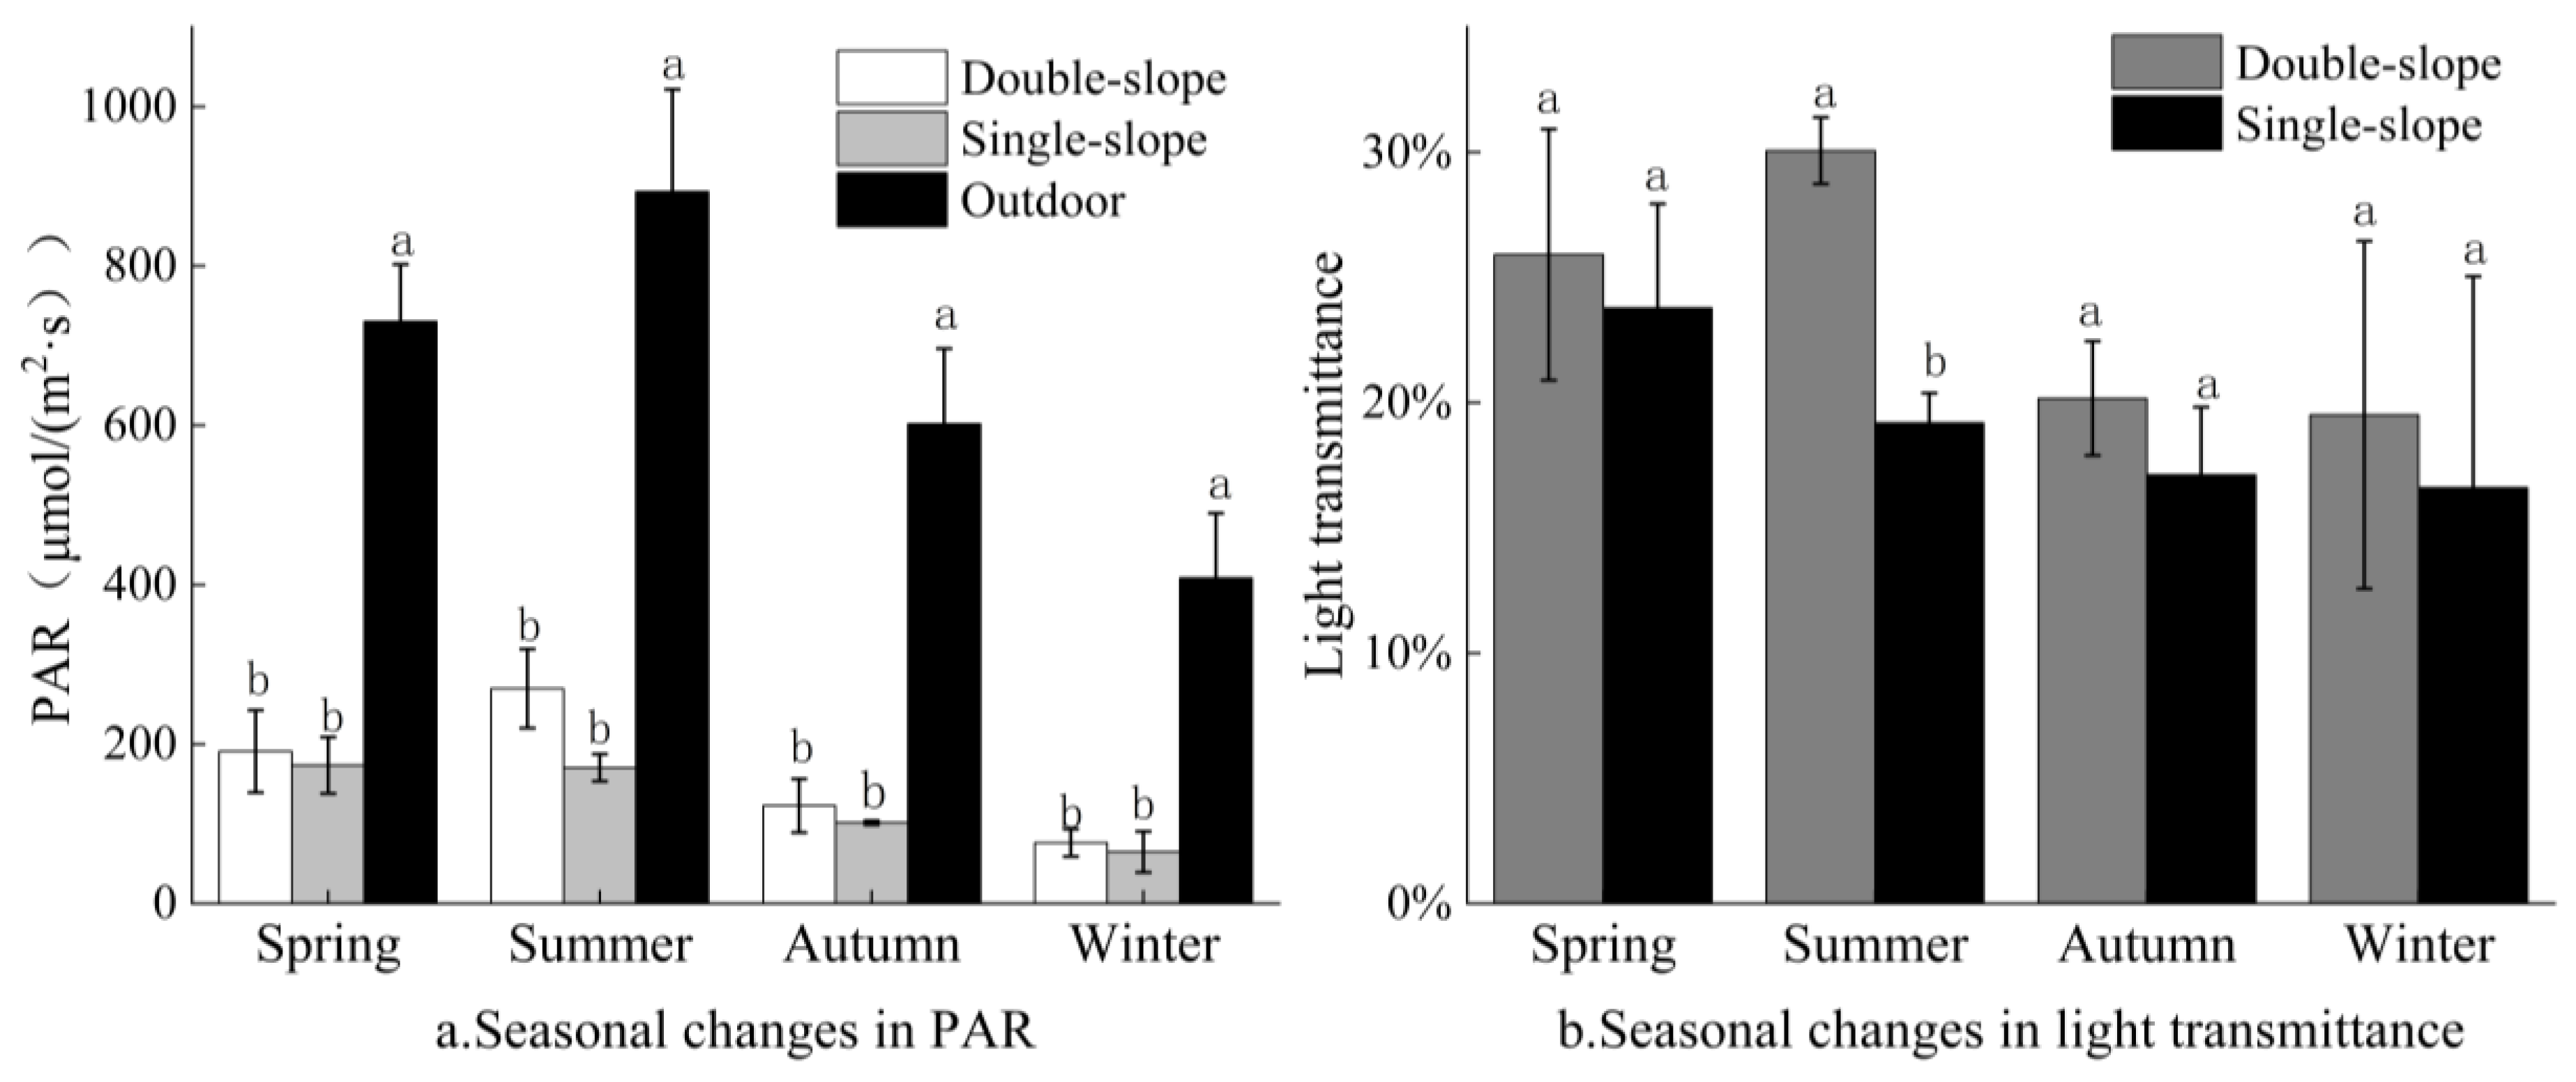
3.1.1. Seasonal Changes in PAR

The annual average PAR for two types of photovoltaic greenhouses are shown in Table 1. As shown, the annual PAR of the double-slope photovoltaic greenhouse was 164.98 μmol/(m2·s) and the light transmittance was 23.91%, whereas the annual PAR of the single-slope photovoltaic greenhouse was μmol/(m2·s), with a light transmittance of 19.17%. The PAR inside the photovoltaic greenhouses were significantly lower than outdoors due to the impact of PV panels, frame structure, cover material characteristics, and other factors. The lower light transmittance of the single-slope photovoltaic greenhouse compared with the double-slope one may be related not only to the differences in the light-transmitting cover materials but also to the structural types of the greenhouses. Further analysis is needed to explore this aspect from the perspectives of spatial distribution and seasonal changes.
The PAR and light transmittance of the two types of photovoltaic greenhouses were averaged by season (Figure 3) to analyze their change laws in the four seasons. The double-slope photovoltaic greenhouse exhibited the strongest average PAR in summer, at 269.69 μmol/(m2·s), and the weakest in winter, at 76.47 μmol/(m2·s). The order of PAR from strongest to weakest was as follows: summer > spring > autumn > winter. In the single-slope photovoltaic greenhouse, the strongest average PAR also occurred in summer, at 170.53 μmol/(m2·s), and the weakest in winter, at 64.77 μmol/(m2·s), following the same seasonal order. The change law of light transmittance in the double-slope photovoltaic was the same as that of PAR. However, for the single-slope photovoltaic greenhouse, the order of light transmittance from highest to lowest was as follows: spring > summer > autumn > winter. This law was likely related to the higher ridge of the single-slope greenhouse, which was more conducive to the entry of scattered light into the greenhouse.

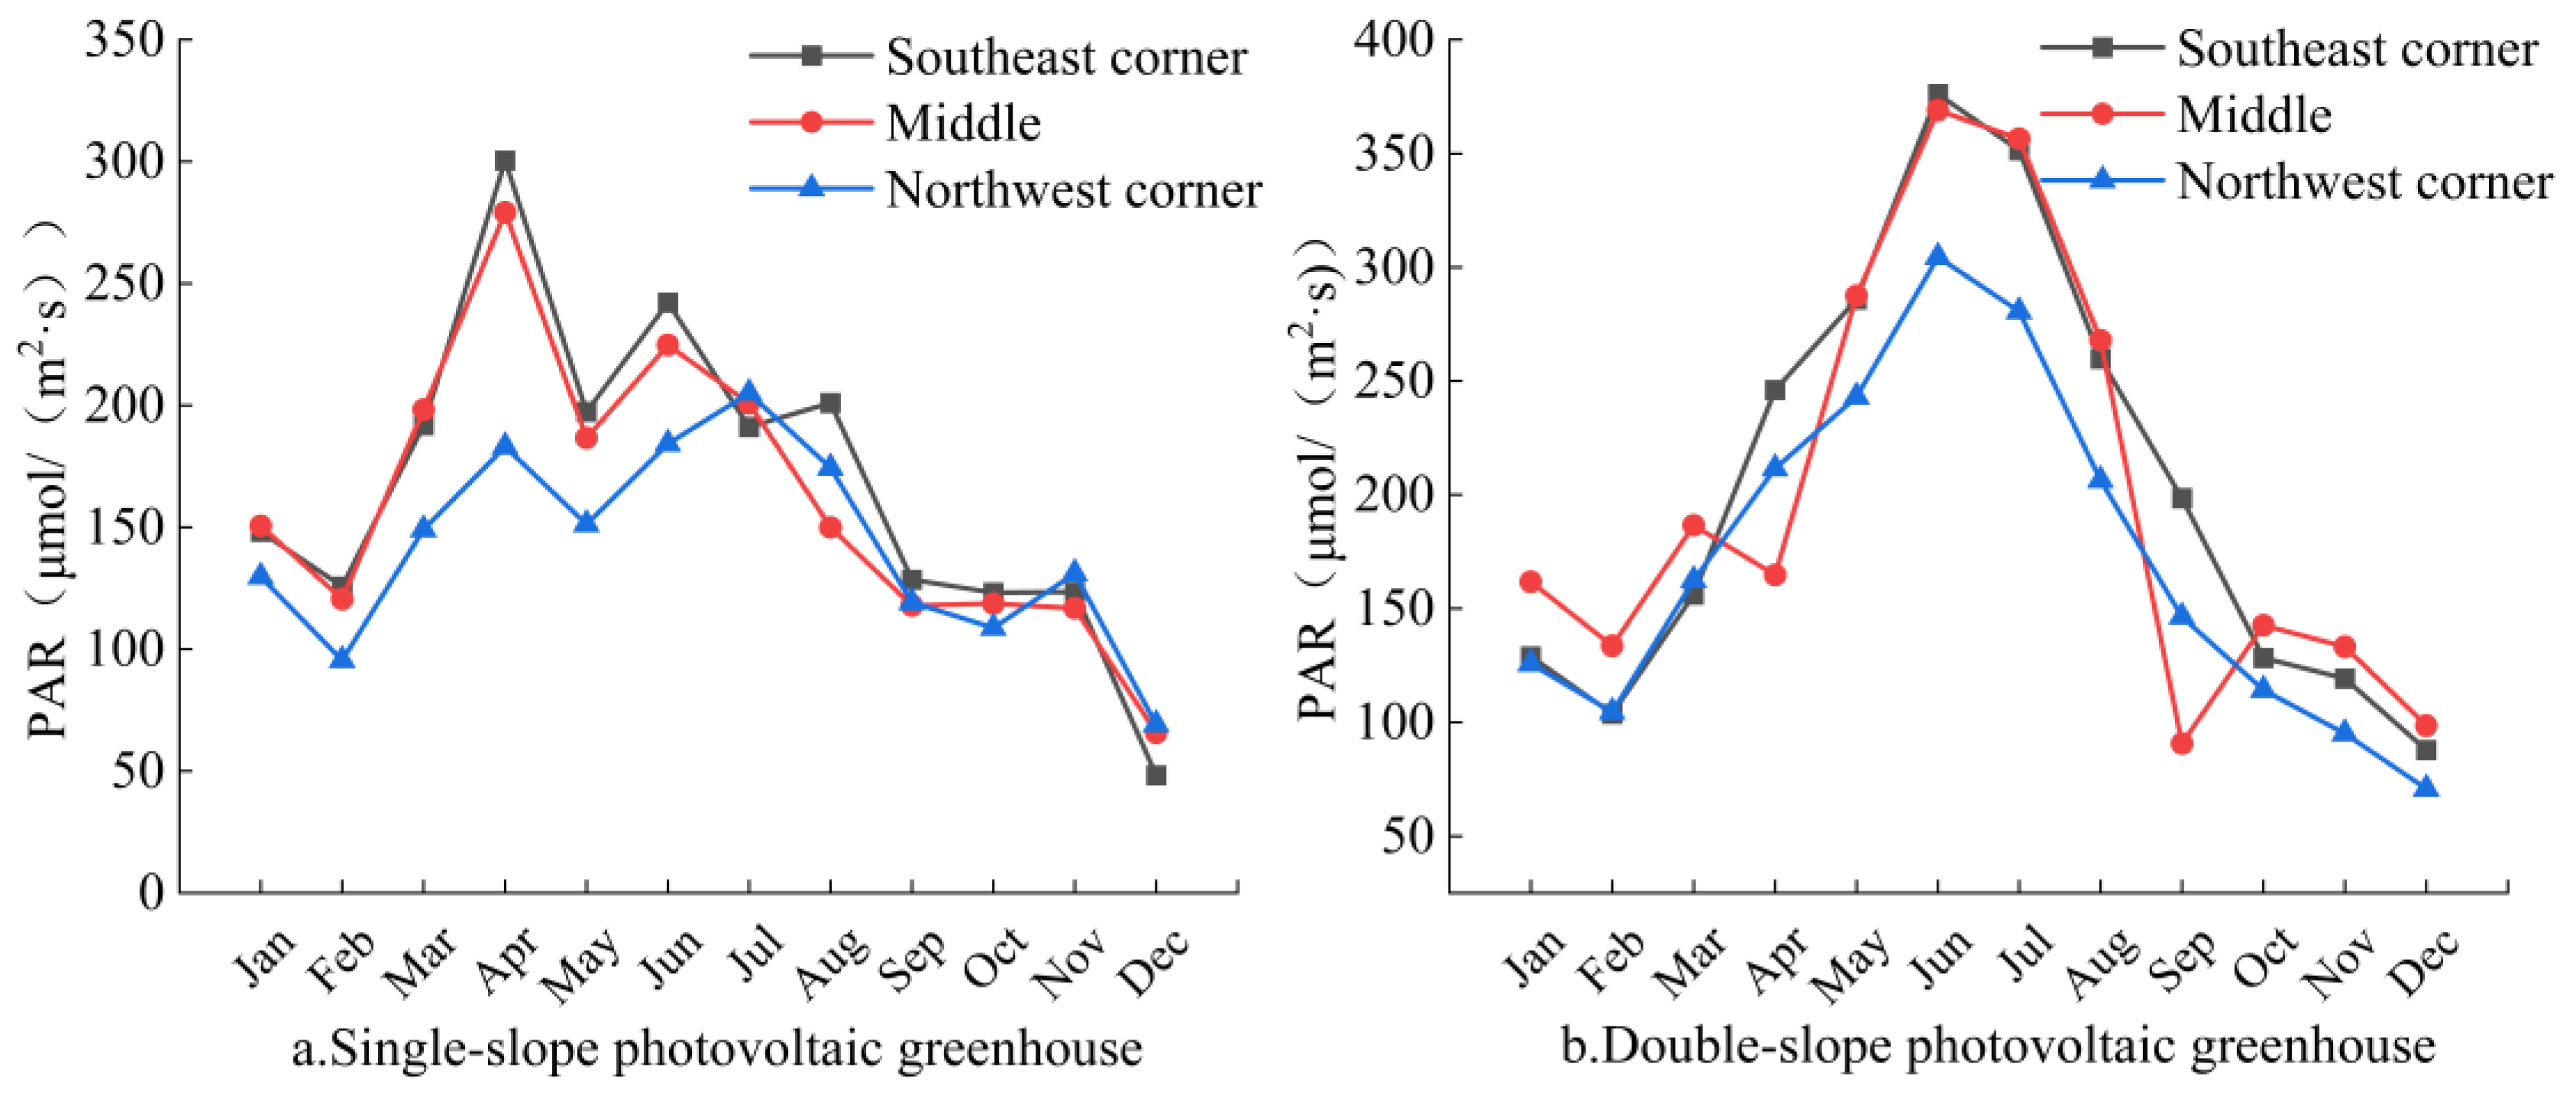
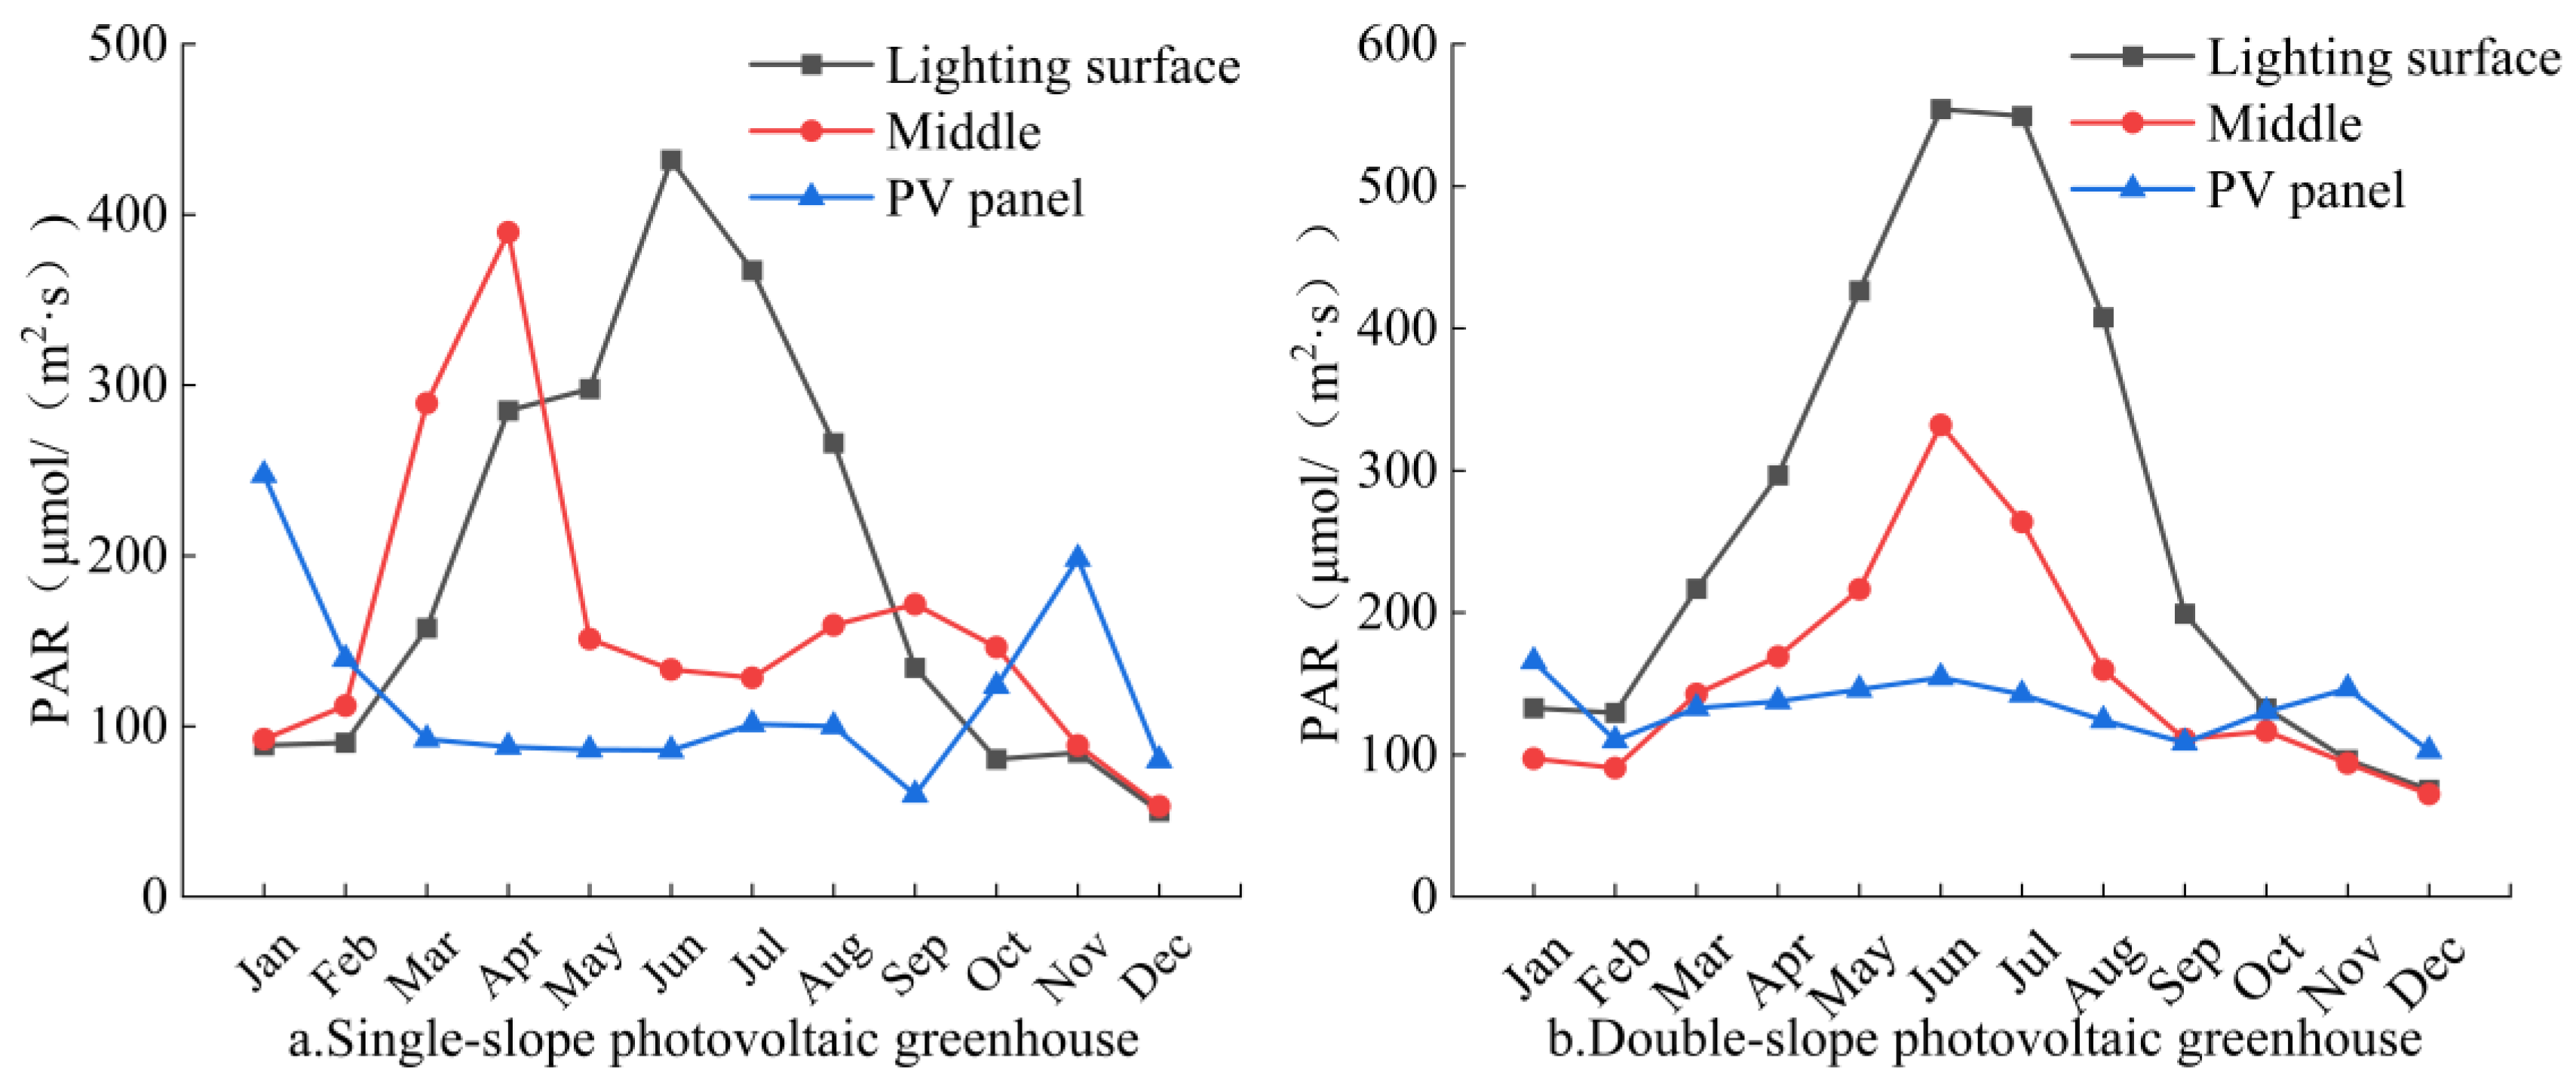
3.1.2. Spatial Distribution of PAR

In order to study the distribution of PAR in the horizontal direction, the PAR in the two types of photovoltaic greenhouses were segmented horizontally into three areas: the southeast corner, the middle, and the northwest corner, as shown in Figure 4. In the single-slope photovoltaic greenhouse, the PAR from January to June in the southeast corner and the middle area was significantly higher than in the northwest corner. However, the PAR levels from July to December in all three areas tended to be similar. The peak value occurred in April at the southeast corner, which was 254.61 μmol/(m2·s). In the double-slope photovoltaic greenhouse, the PAR from April to September in the southeast corner and the middle area was noticeably higher than in the northwest corner (with a notable dip in the middle test point in April and September, lower than the other two points). However, the PAR levels among the three areas from November to the following March tended to be equal, with the middle test point slightly higher. The peak value was in June at the southeast corner, which was 327.83 μmol/(m2·s).
In order to study the distribution laws of the PAR under different roof coverages, the PAR data of the two types of photovoltaic greenhouses were collected from three test points: the lighting surface, the middle, and the PV panel, as shown in Figure 5. In the single-slope photovoltaic greenhouse, the PAR from March to September at the lighting surface test point was also significantly higher than at the middle and PV panel points (with March to April slightly higher at the middle than at the lighting surface, which was related to the structural form of the ridge in the center of the single-slope greenhouse). The PAR levels from October to the following February at all three test points were roughly equal, with the PV panel point having higher values than the middle and lighting surface points. The peak value was in June at the lighting surface point, reaching 467.88 μmol/(m2·s). In the double-slope photovoltaic greenhouse, the PAR levels from March to September at the lighting surface test point were significantly higher than at the middle and PV panel points. The PAR levels from October to the following February at all three test points were roughly equal, with the PV panel point slightly higher than the middle and lighting surface points (this distribution law was mainly related to the solar altitude angle, which was lower from October to February, causing direct sunlight to fall under the PV panel). The peak value occurred in June at the lighting surface point, which was 360.61 μmol/(m2·s).

3.1.3. Diurnal Changes in PAR Under Typical Weather

Typical weather data around summer and winter solstices during 8:00~18:00 were selected to study the diurnal changes in PAR in two different photovoltaic greenhouses under typical weather conditions (sunny and cloudy), as shown in Figure 6.
Figure 6a indicates that on sunny summer days, the outdoor PAR exhibited a parabolic law and reached the peak value around 13:00. Inside the photovoltaic greenhouse, the PAR changed with the outdoor environment. The PAR of the double-slope photovoltaic greenhouse was about 37% higher than that of the single-slope greenhouse, indicating that the overall light transmittance of the double-slope photovoltaic greenhouse was superior to that of the single-slope greenhouse during clear summer weather.
Figure 6b showed that on cloudy summer days, the outdoor PAR was irregular due to the clouds, which reached the peak value at about 15:00. The PAR values of both types of photovoltaic greenhouses were relatively similar, but after 14:30, the double-slope greenhouse showed obviously higher PAR than the single-slope greenhouse. Based on the data before 14:30, it is apparent that when the outdoor PAR was lower, the single-slope greenhouse had greater PAR and higher light transmittance. A possible reason might be the higher ridge of the single-slope greenhouse, which can help to utilize the scattered light. In other words, when direct sunlight was weaker, a greater proportion of scattered light would enter the greenhouse, and the higher ridge of the single-slope greenhouse could facilitate the entry of scattered light into the greenhouse.
Figure 6c reveals that the change law of PAR inside the greenhouse on sunny winter days was consistent with that on sunny summer days, which means the indoor PAR changed with the outdoor trend. The PAR of the double-slope photovoltaic greenhouse was higher than that of the single-slope greenhouse, but the difference was slight except at noon.
Figure 6d depicted that on cloudy winter days, the outdoor PAR was steady due to the clouds and showed no clear trend. The PAR inside the double-slope photovoltaic greenhouse was significantly higher than that in the single-slope greenhouse. The difference in variation trend between the cloudy winter days and cloudy summer days was mainly due to the lower solar altitude angle in winter, resulting in direct sunlight hitting the lower part of the PV panels. During this time, the lower part of the double-slope greenhouse’s lighting surface mainly received scattered light, and the area was quite large.
In summary, throughout the year, under clear weather conditions, the PAR inside the double-slope photovoltaic greenhouse was higher than that in the single-slope greenhouse. On cloudy summer days with weak outdoor PAR, the PAR of single-slope greenhouse was higher than that of the double-slope greenhouse. On cloudy winter days, the PAR in the single-slope greenhouse was notably higher than in the double-slope greenhouse. Considering the year-round, effective utilization of PAR, especially the enhancement of PAR in photovoltaic greenhouses during cloudy winter days, double-slope greenhouse structure is more advantageous than single-slope greenhouse.

3.2. Change Laws of Temperature

3.2.1. Seasonal Changes in Temperature

Temperature is one of the crucial indicators for the growth and development of crops, which directly affects their physiological activities. The indoor temperature of the photovoltaic greenhouses changed with the outdoor temperature and, due to the “greenhouse effect”, the accumulation of solar radiation inside the greenhouse resulted in higher indoor temperature than outdoors. Based on the annual temperature data from two types of photovoltaic greenhouses, the average annual temperature and the average temperature of four seasons were compiled to analyze the seasonal laws of indoor temperature, as shown in Table 2 and Figure 7. The indoor average temperatures of both double-slope and single-slope photovoltaic greenhouses were higher than those outdoors, with the largest difference occurring in summer and the smallest in winter. The annual average temperature ranged from a minimum of 18.88 °C to a maximum of 30.91 °C, which generally could meet the temperature requirements for the growth of heat-tolerant vegetables in summer and temperature-loving vegetables in winter.

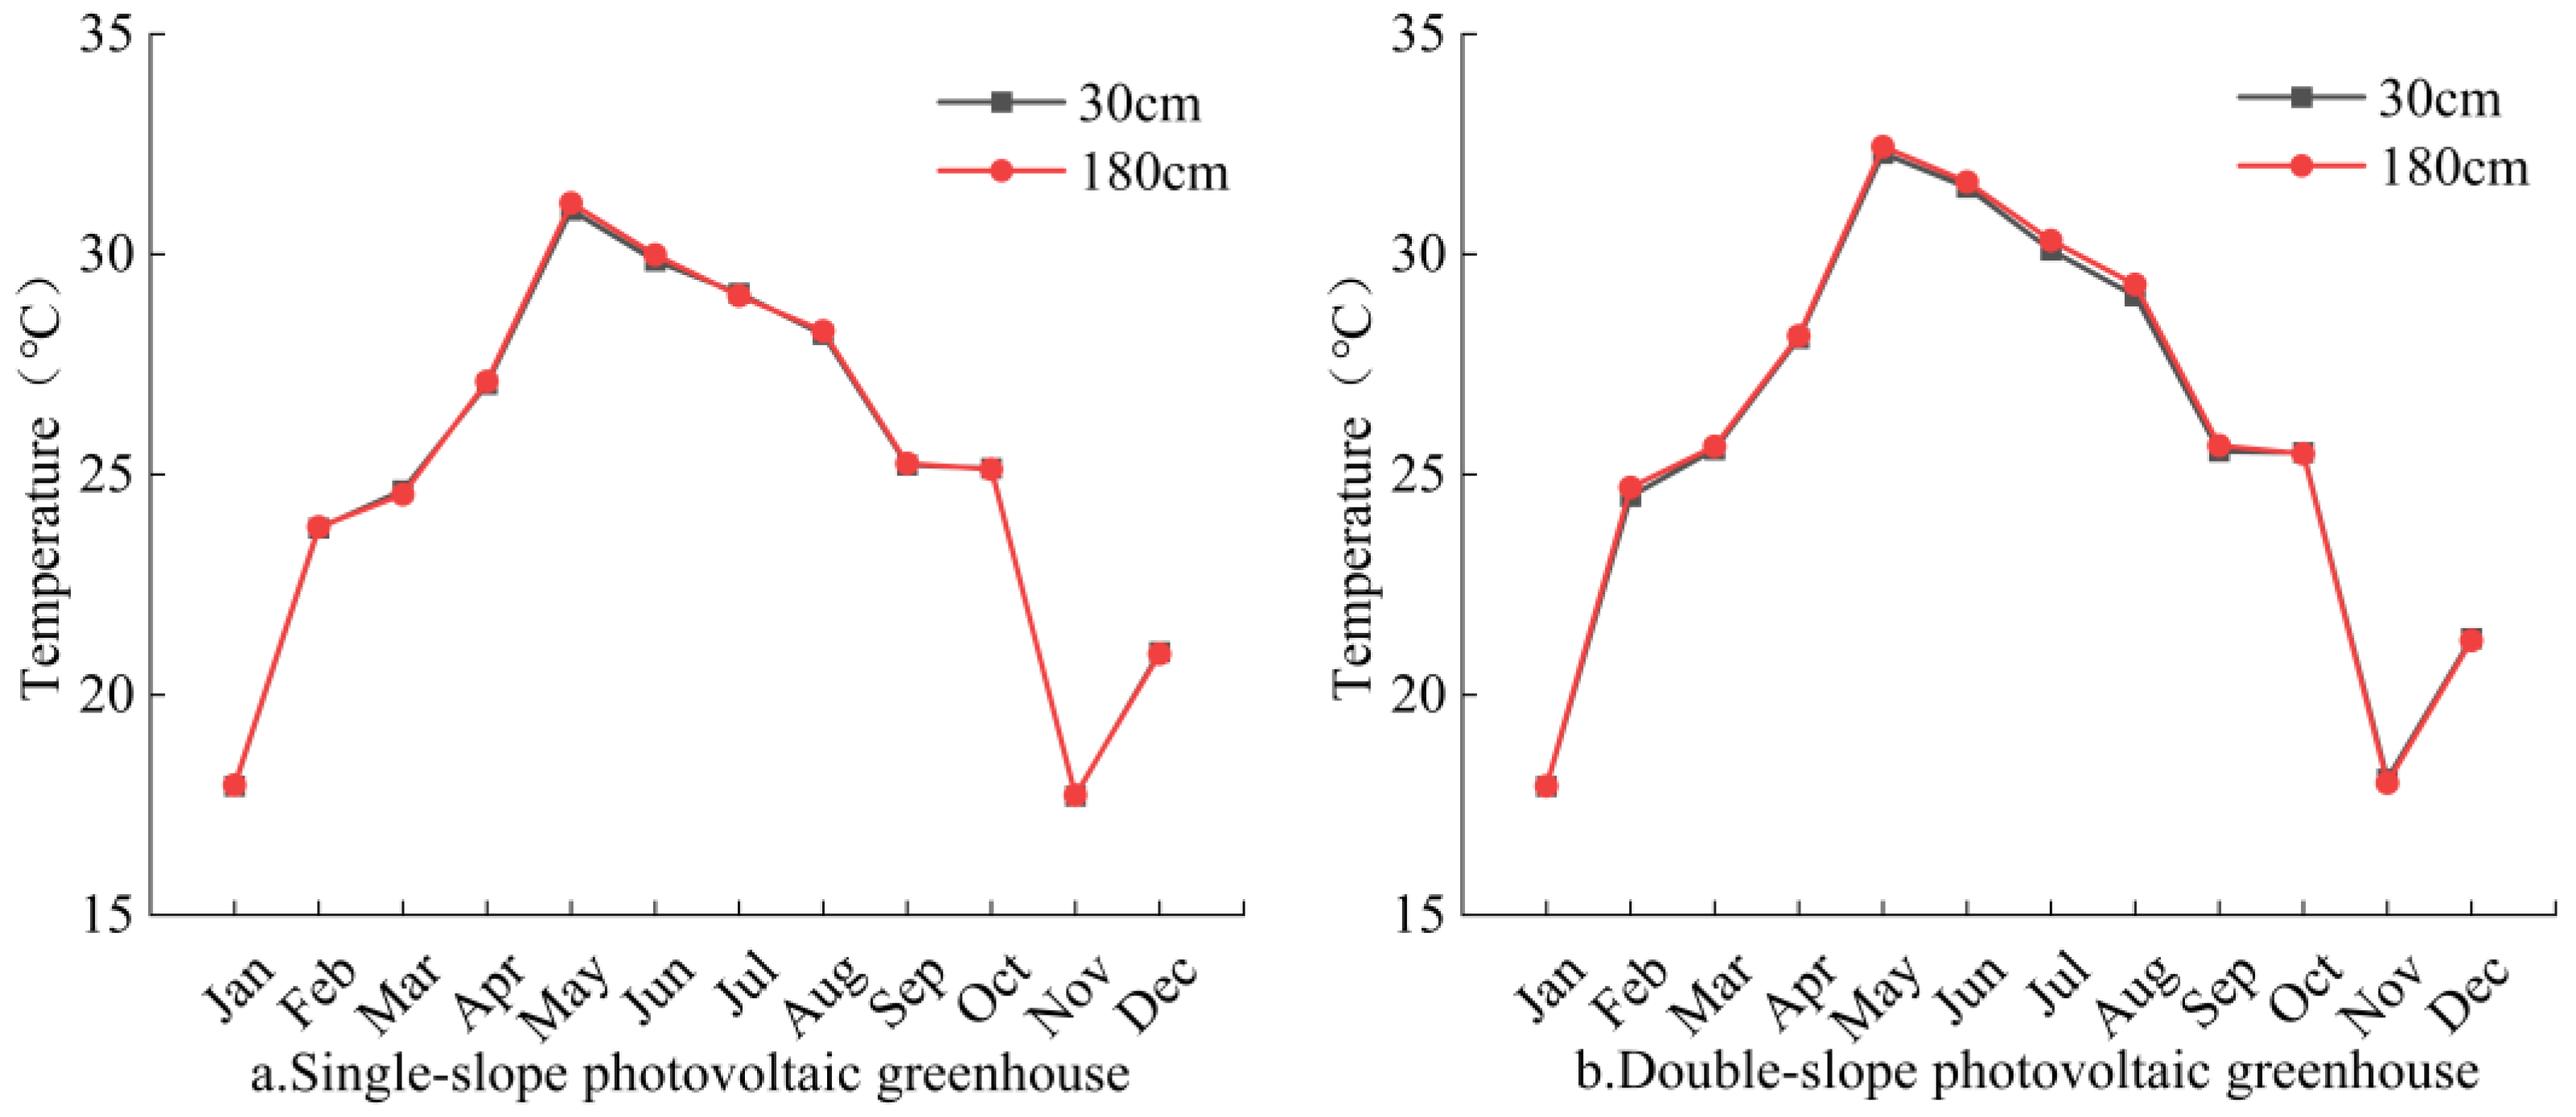
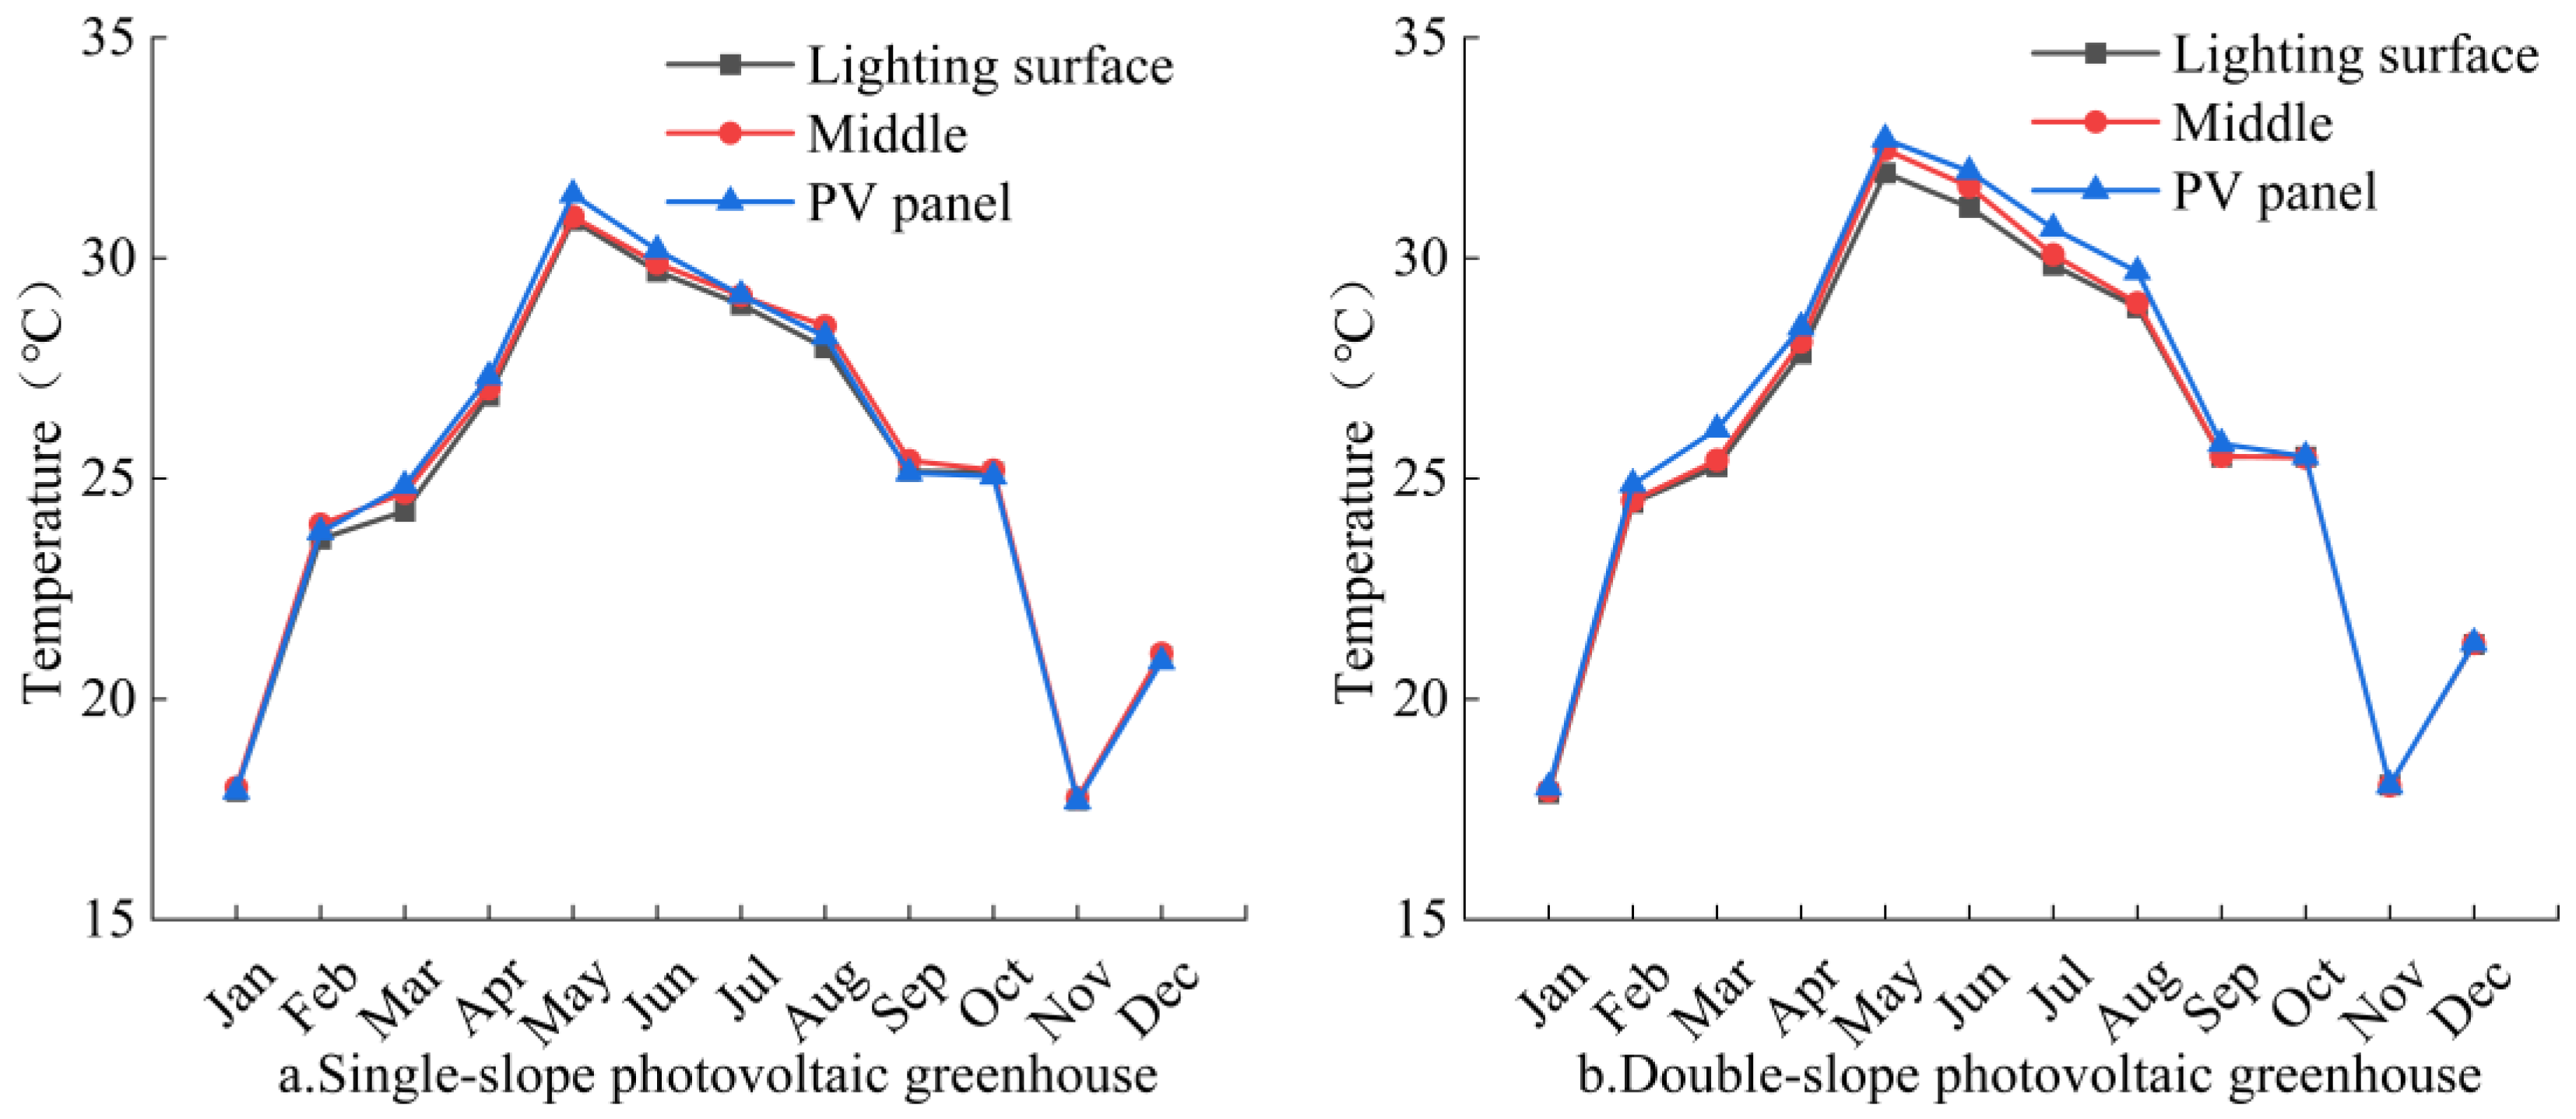
3.2.2. Spatial Distribution of Temperature

In order to study the distribution law of temperature, three zones along the horizontal direction of the two types of photovoltaic greenhouses were set: the southeast corner, the middle, and the northwest corner, as shown in Figure 8. As shown, the difference in the average annual temperature in the single-slope photovoltaic greenhouse across the horizontal direction was small (0.1 °C). In May, when the temperature was relatively high, the average temperature was 30.51 °C in the southeast corner, 31.08 °C in the middle, and 31.32 °C in the northwest corner, with the largest temperature difference being 0.81 °C. In the double-slope photovoltaic greenhouse, the difference in the average annual temperature across the horizontal direction was 0.53 °C. From February to August, there were noticeable differences among the three test points, though these differences were small, all not exceeding 1 °C.
Two test points were set vertically at 30 cm and 180 cm for the two types of photovoltaic greenhouses to analyze the vertical temperature distribution, as shown in Figure 9. As shown, in the single-slope photovoltaic greenhouse, the annual average temperature was 25.05 °C at 30 cm and 25.07 °C at 180 cm, with a mere difference of 0.02 °C. The maximum temperature difference between different months was 0.15 °C. In the double-slope photovoltaic greenhouse, the annual average temperature was 25.79 °C at 30 cm and 25.87 °C at 180 cm, with a difference of 0.09 °C, and the maximum temperature difference across different months was 0.24 °C.
In order to analyze the temperature distribution laws under different covers, three zones were set for the two types of photovoltaic greenhouses: the lighting surface, the middle, and the PV panels, as shown in Figure 10. As shown, for the single-slope photovoltaic greenhouse with different covers, the temperature difference between the three test points was 0.2 °C during February to August when the outdoor temperature was relatively high, and there was no significant temperature difference between the three points during other months. For the double-slope photovoltaic greenhouse with different covers, the temperature difference between the three test points was 0.47 °C during February to August when the outdoor temperature was relatively high, and there was no significant temperature difference between the three points during other months.
Therefore, it can be concluded that the temperature uniformity of both types of photovoltaic greenhouses was quite good in the vertical and horizontal directions, as well as across different components, and the temperature difference was less than 0.5 °C under various conditions. Due to the higher ridge and larger ventilation area, the single-slope photovoltaic greenhouse exhibited even smaller temperature difference among the test points across horizontal, vertical, and different covers.

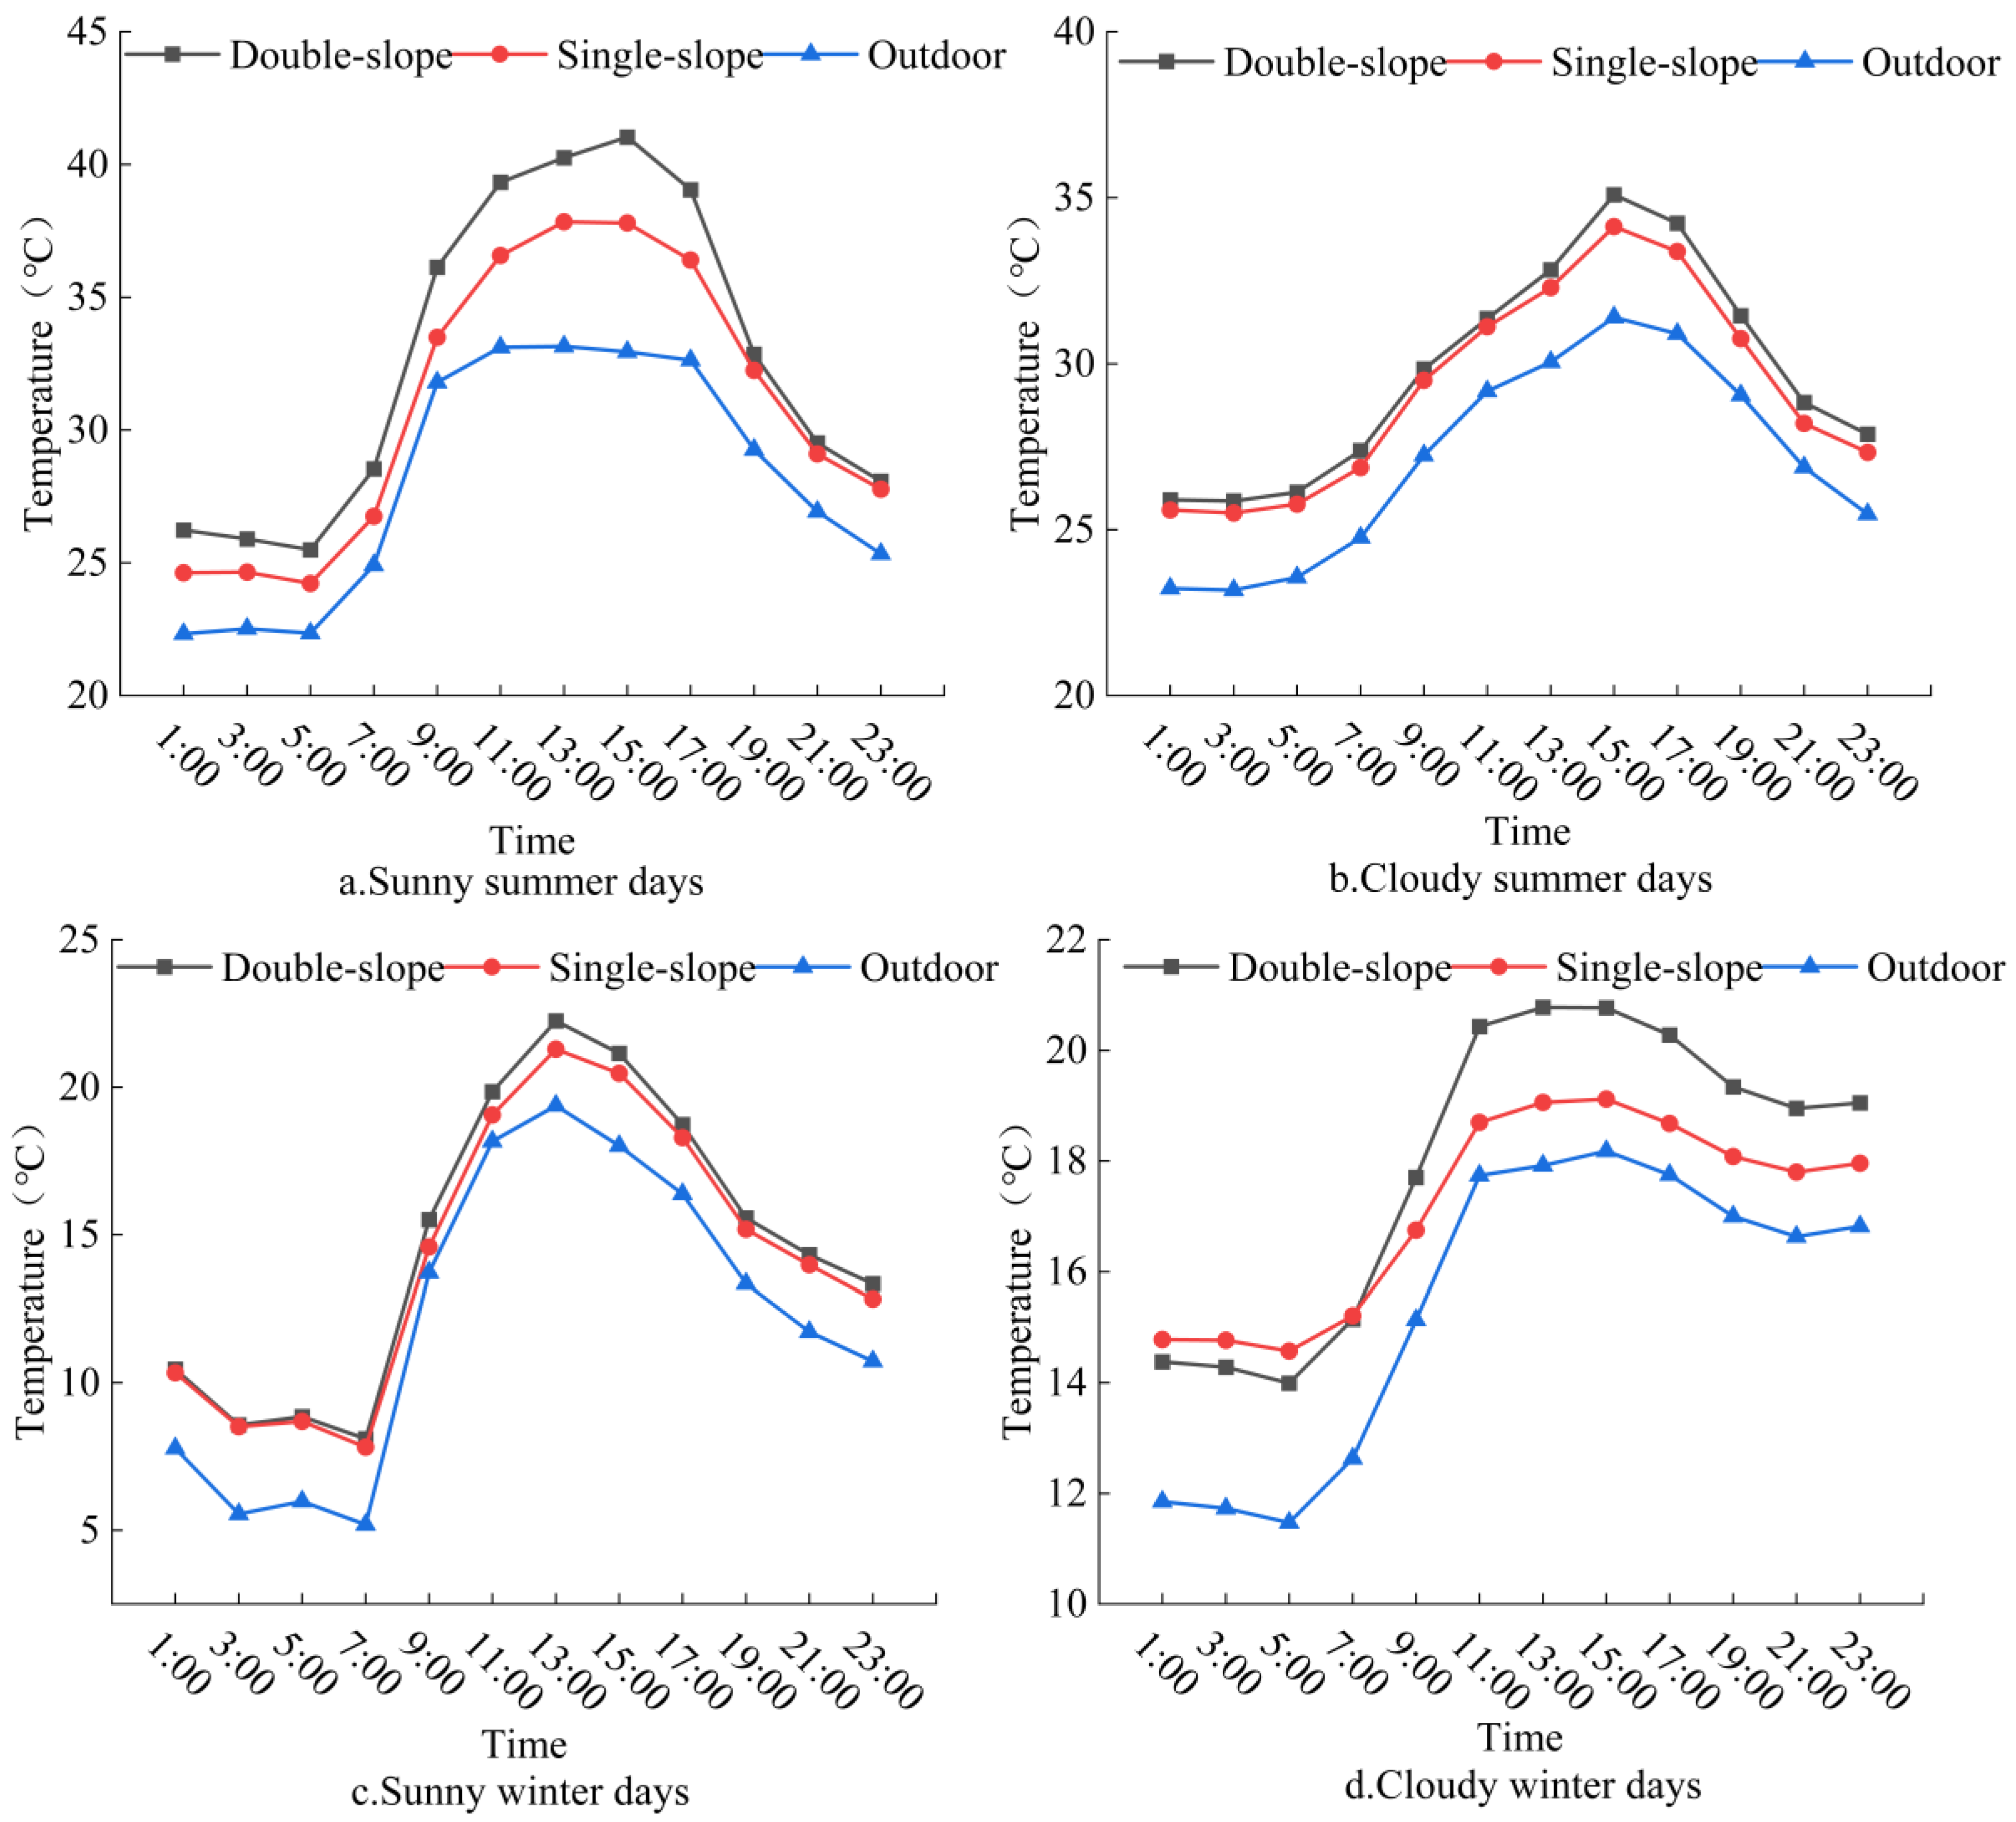
3.2.3. Diurnal Changes in Temperature Under Typical Weather

The typical weather data near the summer and winter solstices (0:00~24:00) were selected to examine the diurnal change laws of temperature in two different types of photovoltaic greenhouses under typical weather, as shown in Figure 11.
As shown in Figure 11a, the temperatures inside the photovoltaic greenhouses during sunny summer days were consistently higher than outdoor temperatures, with the largest difference occurring at 9:00~15:00. For the average temperature throughout the day, the temperature difference between the double-slope photovoltaic greenhouse and the outdoors was 4.59 °C, while the difference between single-slope and the outdoors was 2.84 °C.
As shown in Figure 11b, the temperatures inside both types of photovoltaic greenhouses during cloudy summer days were roughly the same and both were higher than the outdoor temperature. For the average temperature throughout the day, the temperature difference between the double-slope photovoltaic greenhouse and the outdoors was 2.66 °C, and the difference between the single-slope and the outdoors was 2.13 °C.
As indicated in Figure 11c, there was little difference in temperature between the inside and outside of the two types of photovoltaic greenhouses during 7:00~11:00 on sunny winter days. The temperature difference between single-slope and double-slope photovoltaic greenhouses was not significant during other periods, but both higher than the outdoors. For the average temperature throughout the day, the temperature difference between the double-slope photovoltaic greenhouse and the outdoors was 2.56 °C, and the difference between the single-slope and the outdoors was 2.09 °C.
As depicted in Figure 11d, the temperature difference between the two types of photovoltaic greenhouses was not significant during cloudy winter days from night to 9:00 AM the next day. After 9:00 a.m., the temperature in the double-slope photovoltaic greenhouse was significantly higher than that in the single-slope greenhouse. For the average temperature throughout the day, the temperature difference between the double-slope photovoltaic greenhouse and the outdoors was 2.52 °C, while it was only 1.72 °C for the single-slope photovoltaic greenhouse.
In summary, the temperature difference between the single-slope photovoltaic greenhouse and the outdoors was smaller than that of the double-slope photovoltaic greenhouse, which was good for reducing the high indoor temperature during summertime. On sunny summer days, the cooling effect of ventilation in the single-slope greenhouse was more obvious, with the average daily temperature being 1.75 °C lower than that of the double-slope photovoltaic greenhouse, and the temperature difference was nearly 3 °C at the peak of midday heat. On cloudy summer days, the temperature difference between the two types of greenhouses was not significant. In winter, the temperature in the double-slope photovoltaic greenhouse was higher than both the outdoors and the single-slope photovoltaic greenhouse during cloudy weather, showing a noticeable insulation effect of the greenhouse. Therefore, the double-slope photovoltaic greenhouse was beneficial for insulation during winter, but the ventilation around noon during summer should be strengthened to reduce high temperatures in the greenhouse.

3.3. Change Laws of Relative Humidity

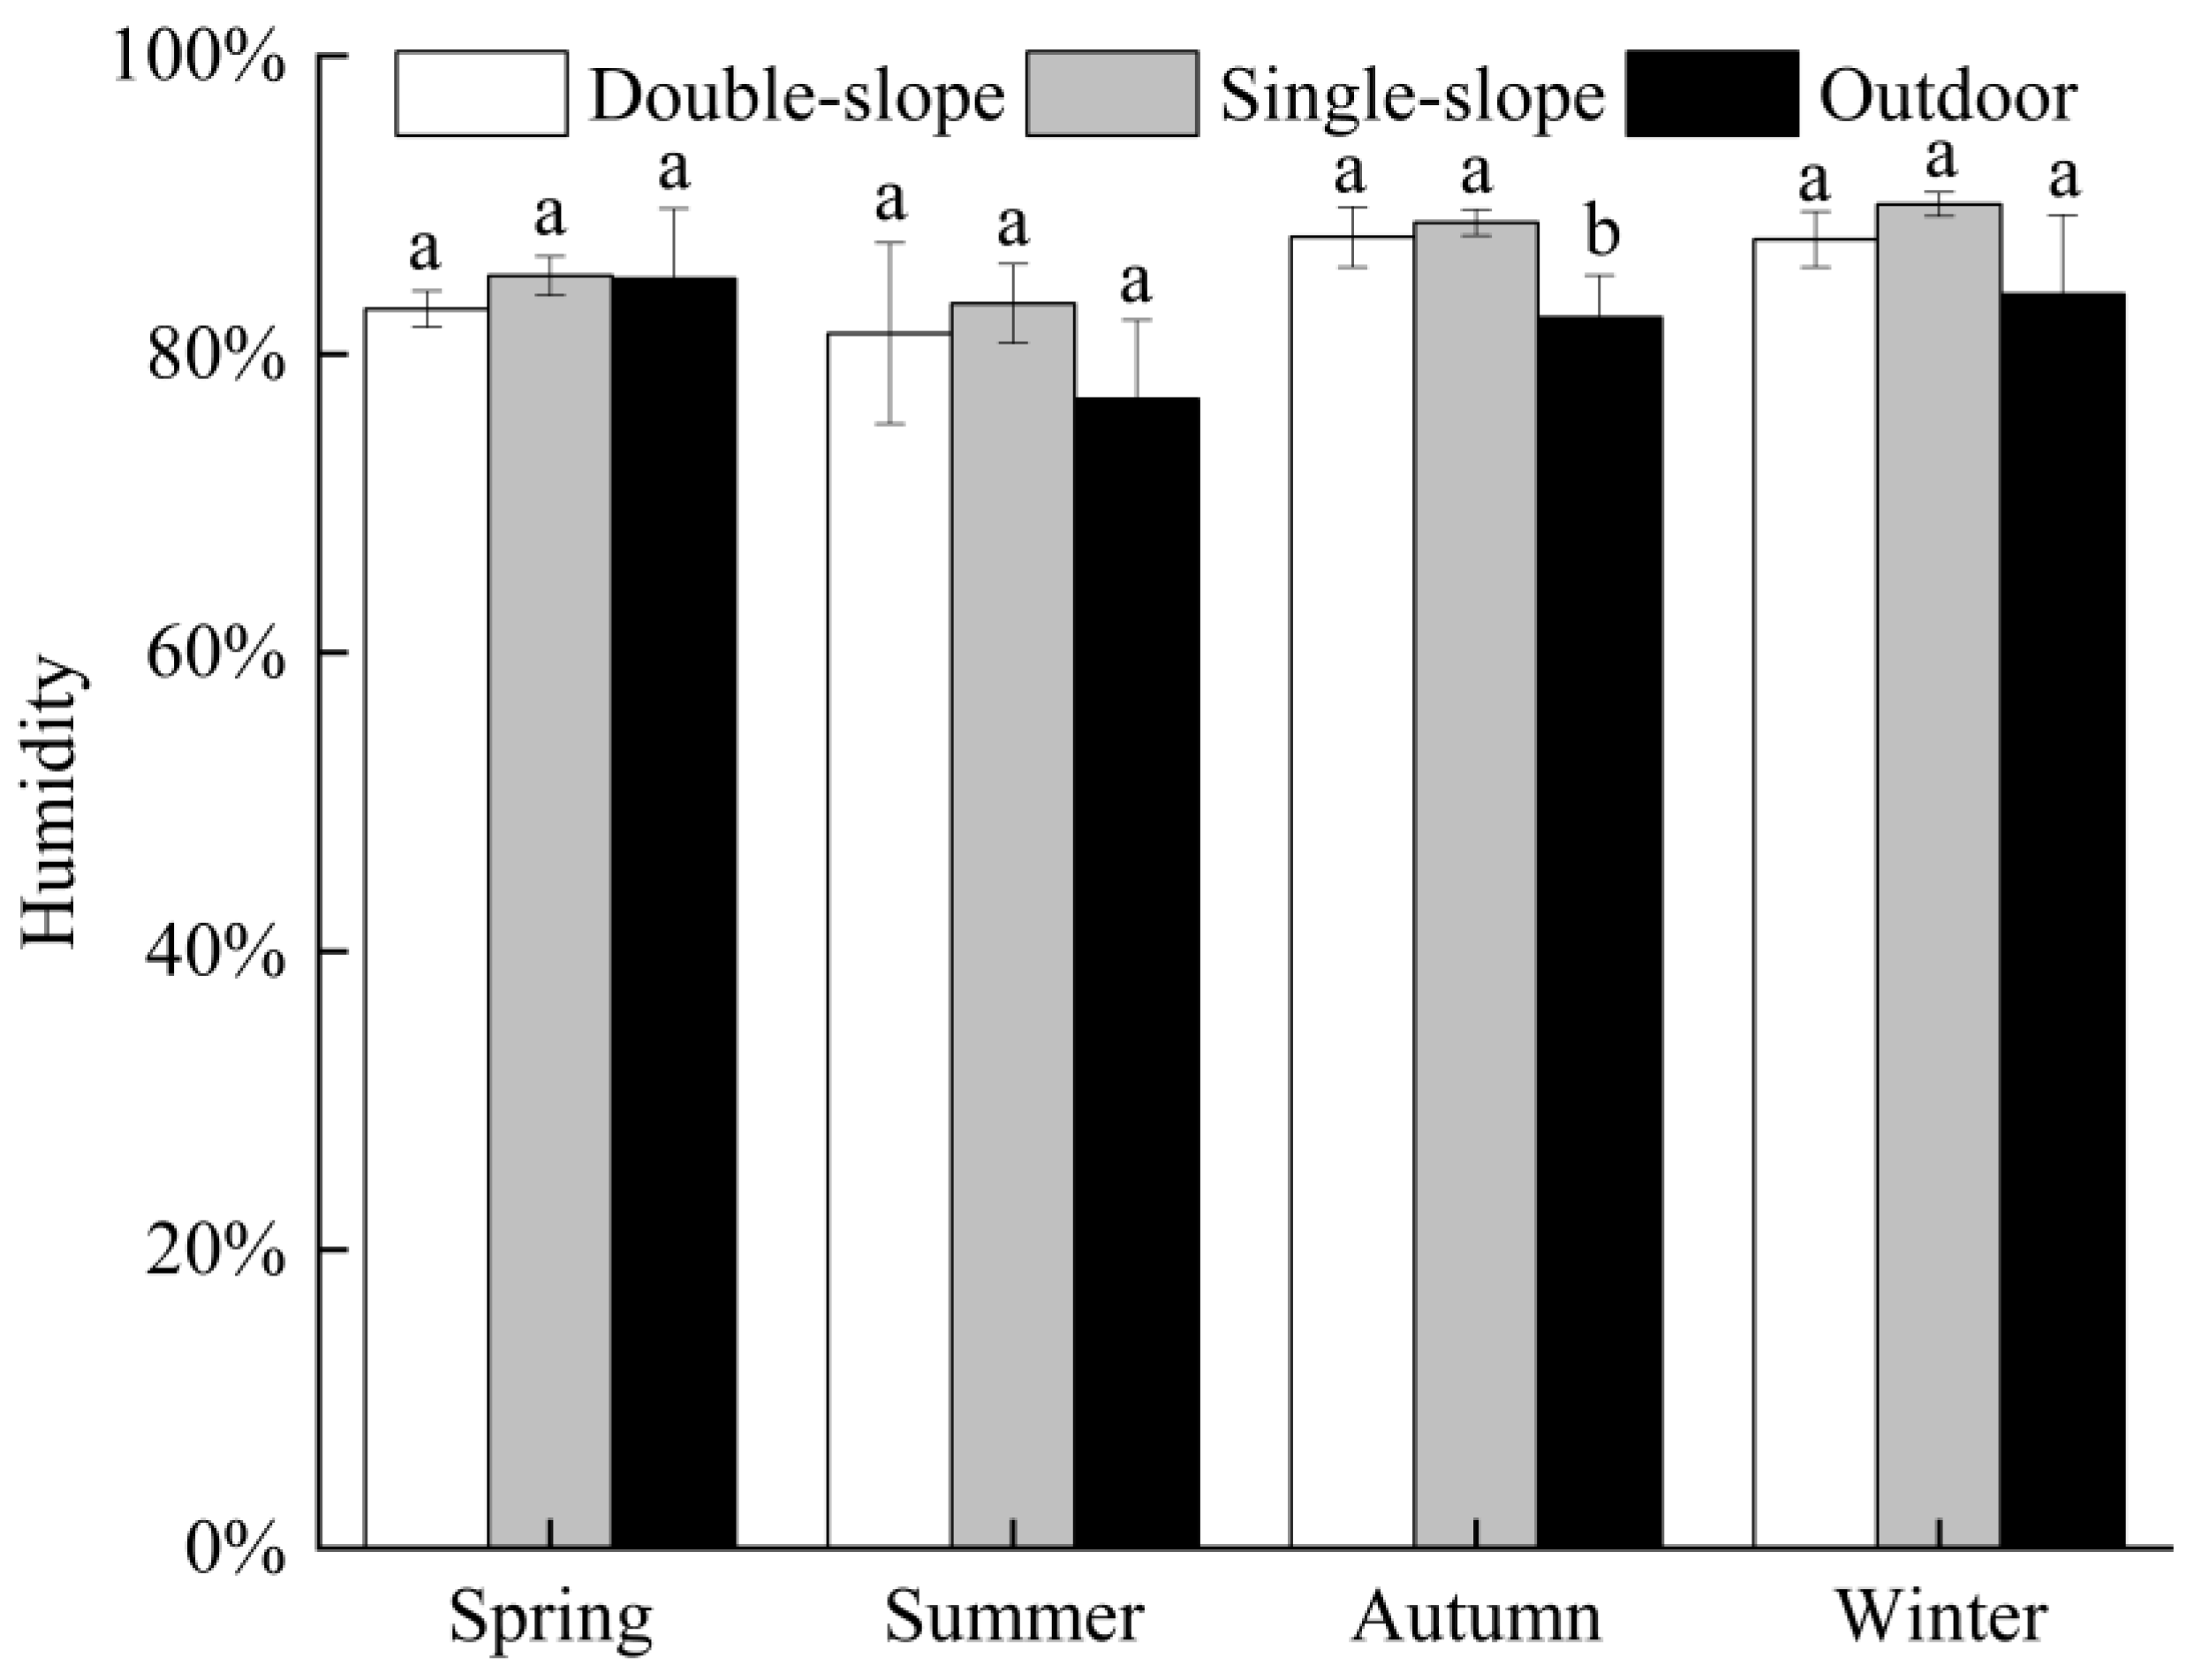
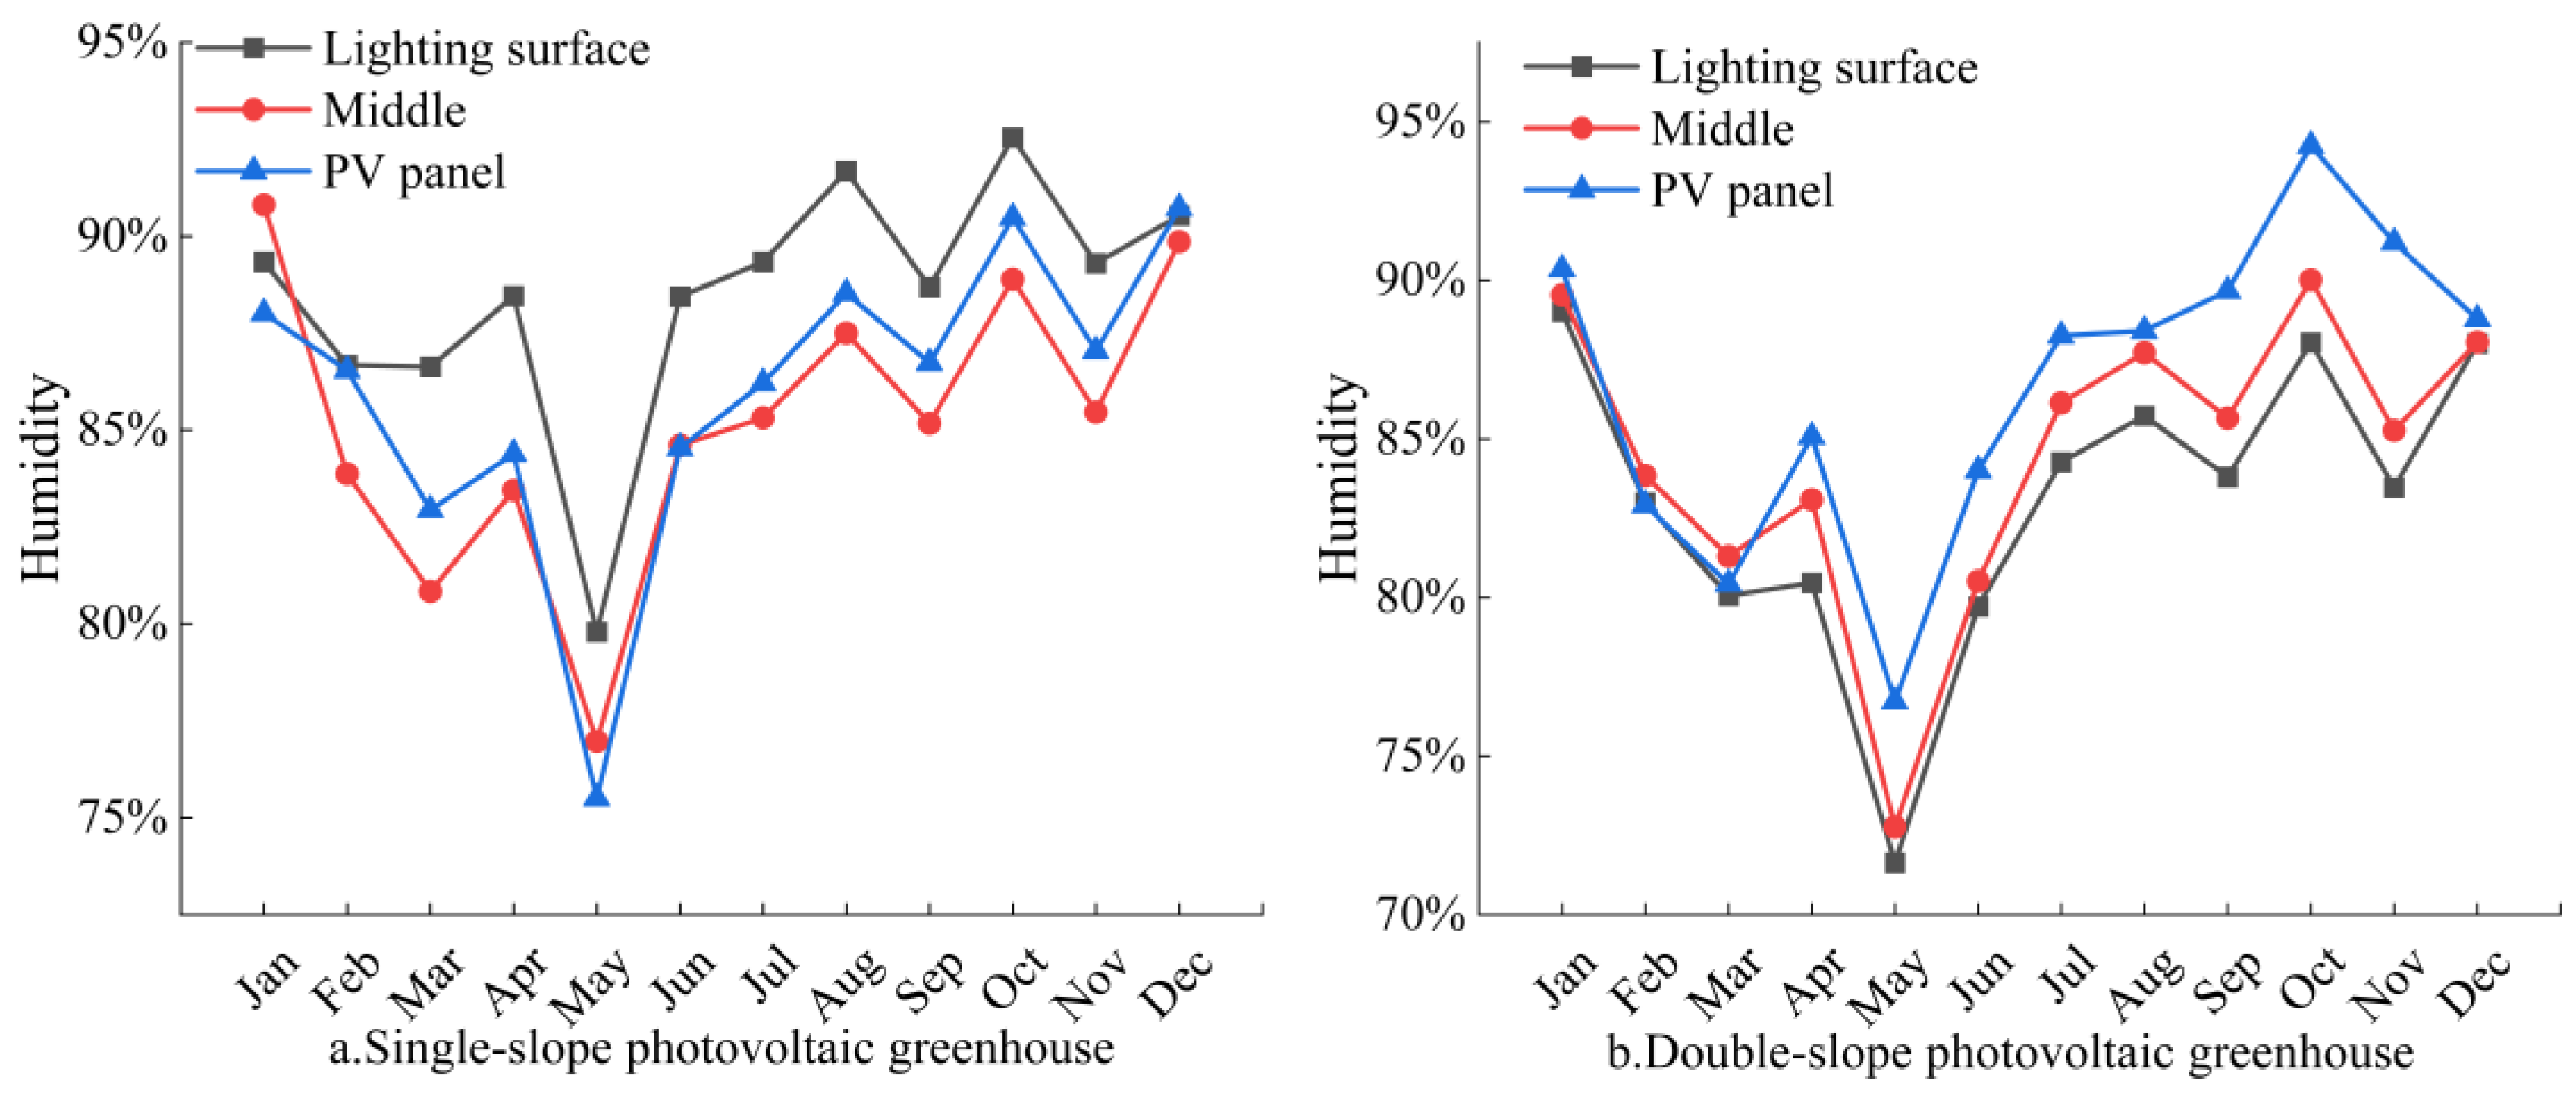
3.3.1. Seasonal Changes in Relative Humidity

Based on the annual relative humidity data for the two types of photovoltaic greenhouses, the average relative humidity of each of the four seasons was compiled and analyzed to study the seasonal change laws of the relative humidity, as shown in Figure 12. The average annual indoor relative humidity for the double-slope and single-slope photovoltaic greenhouses were 85.00% and 86.88%, respectively. The indoor relative humidity was consistently higher than outdoors, and there were significant seasonal differences between the four seasons within the greenhouse. Due to the strong solar radiation and higher temperatures in summer, the average relative humidity was the lowest in summer, which were 81.39% for the double-slope and 83.36% for the single-slope greenhouse. In autumn with frequent typhoons and heavy rains, and temperatures lower than in summer, the relative humidity was slightly higher, at 87.86% for the double-slope and 88.82% for the single-slope. The average indoor relative humidity in the single-slope photovoltaic greenhouse was higher than that in the double-slope greenhouse, with a difference of 1~2%, which may be due to the temperature in the double-slope greenhouse being higher than in the single-slope greenhouse.

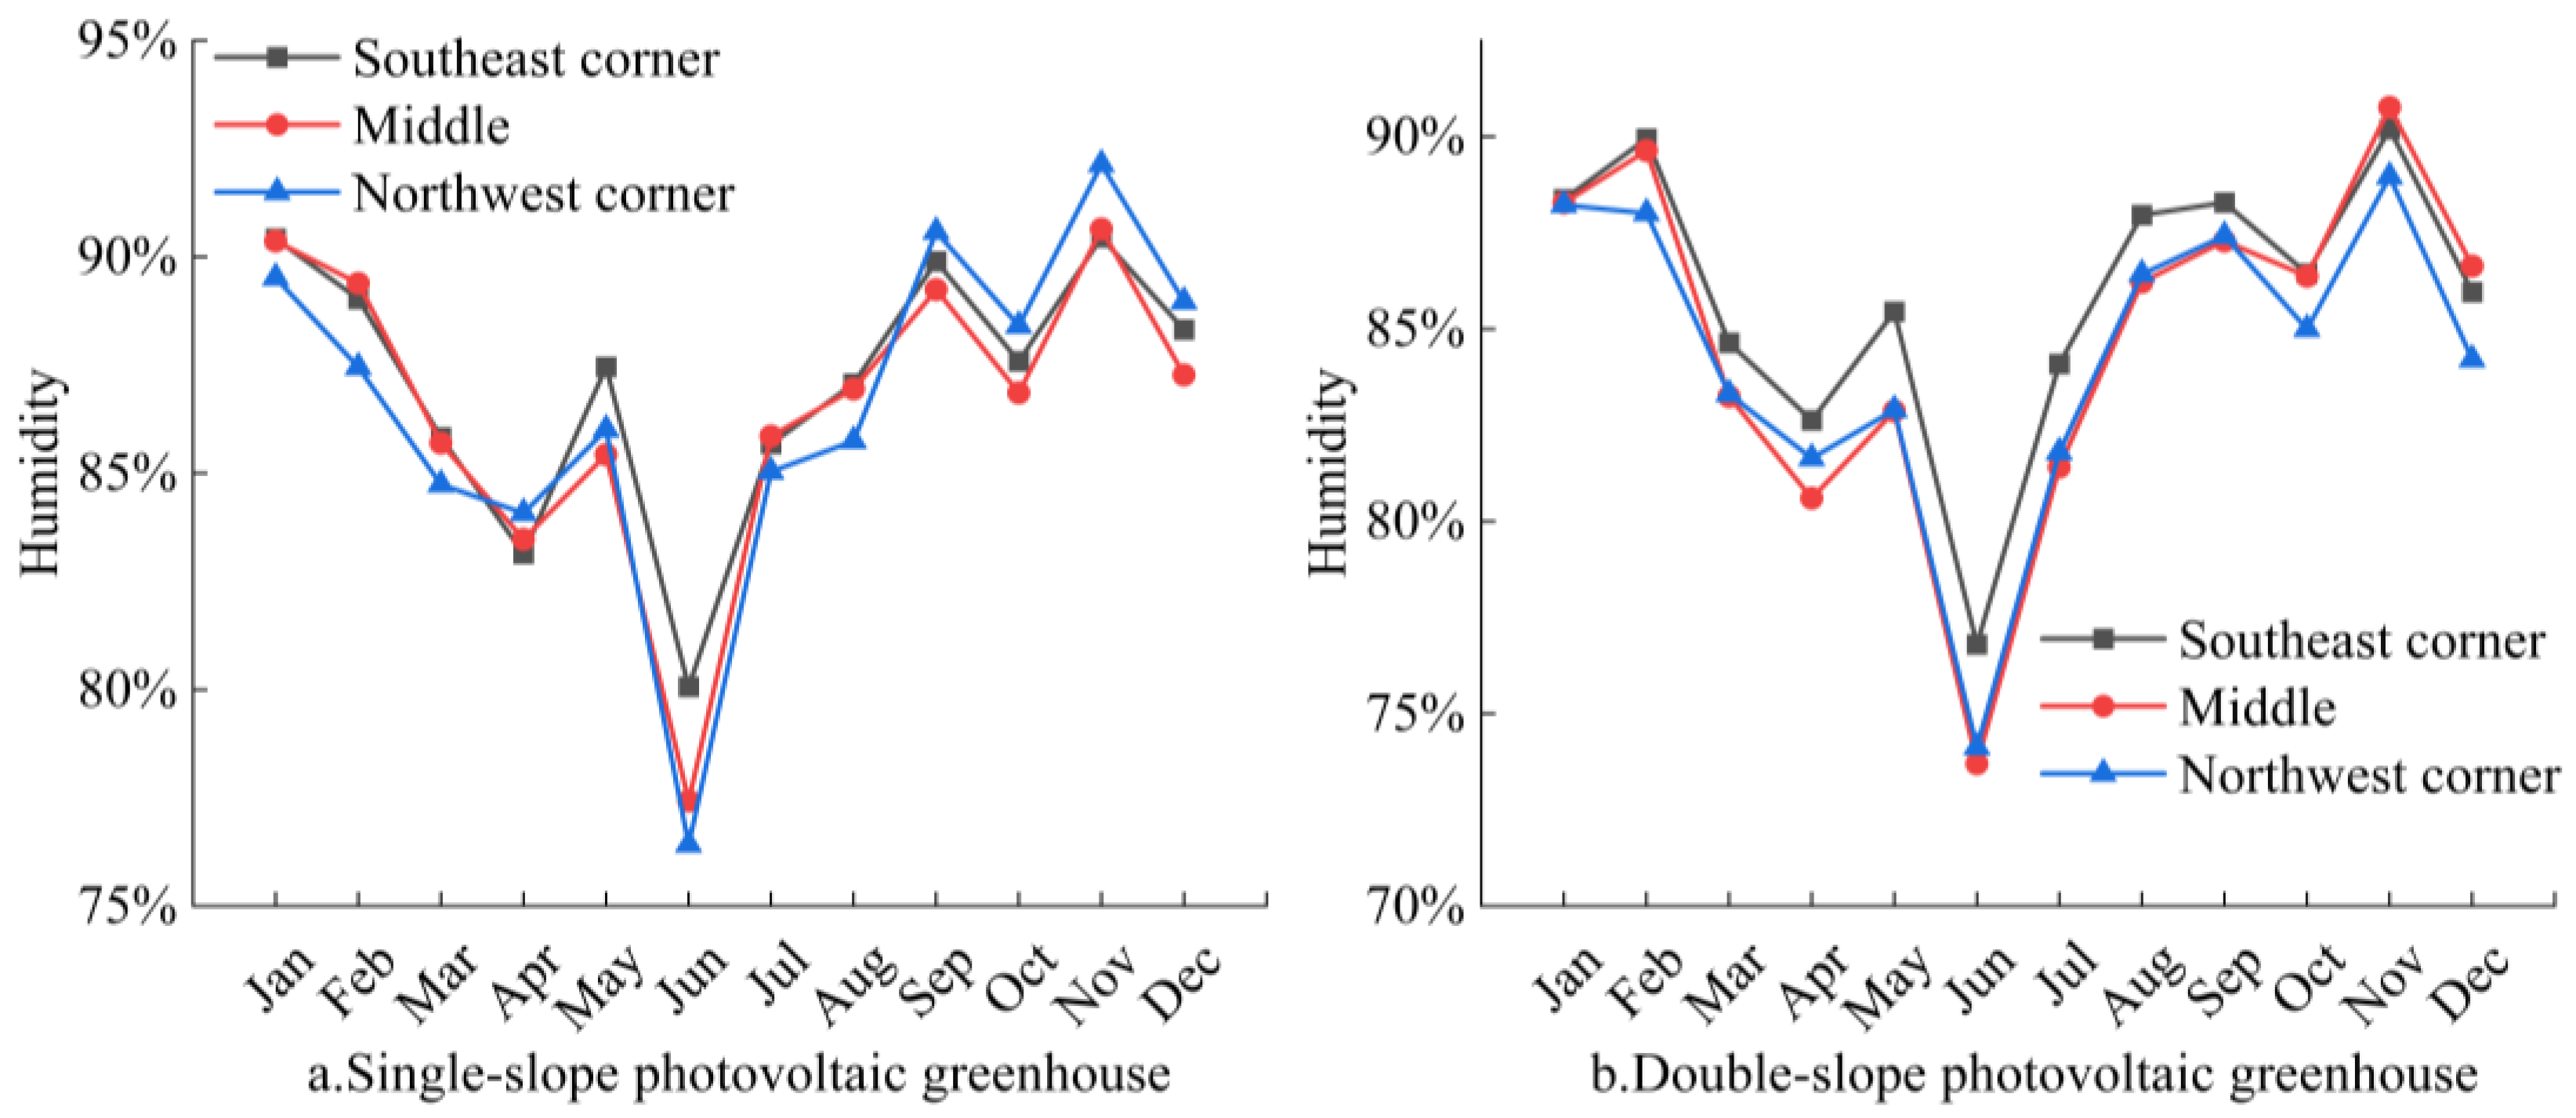
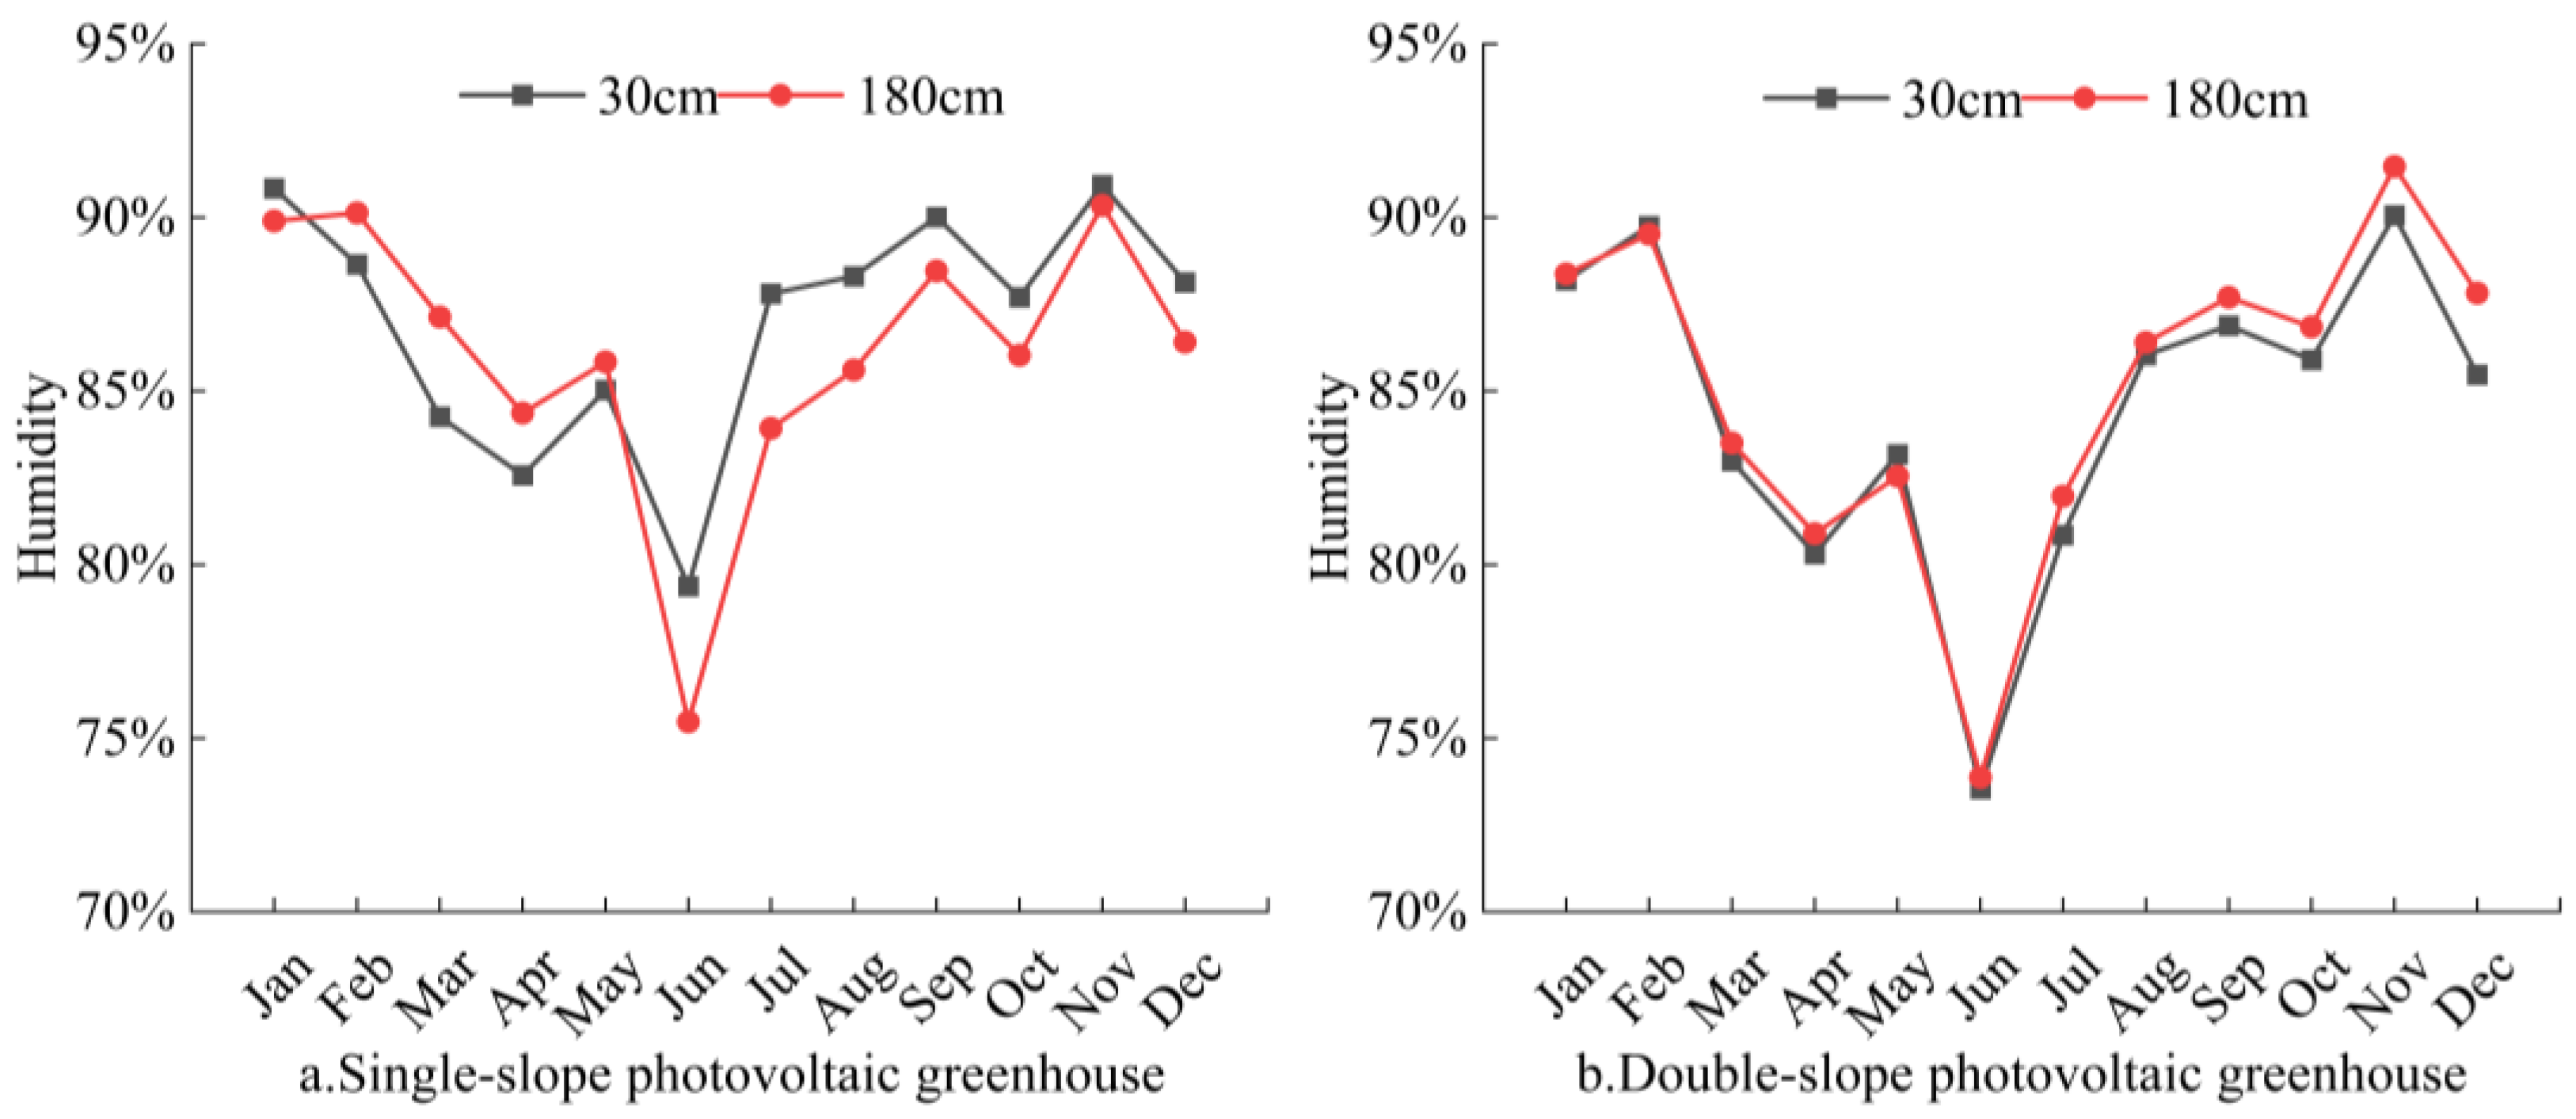
3.3.2. Spatial Distribution of Relative Humidity

In order to analyze the distribution law of relative humidity at the horizontal level, each of the two types of photovoltaic greenhouses was divided into three areas: the southeast corner, the middle, and the northwest corner, as illustrated in Figure 13. As shown, the relative humidity trends in the single-slope photovoltaic greenhouse were generally consistent throughout the year across all horizontal sections. In contrast, the change law of relative humidity of double-slope photovoltaic greenhouse was southeast corner > middle > northwest corner.
Vertically, two measurement points at 30 cm and 180 cm were set for the two types of photovoltaic greenhouses to analyze the distribution law of relative humidity, as shown in Figure 14. As shown, for the relative humidity of single-slope photovoltaic greenhouse from January to April, the vertical measurement point of 180 cm had a humidity higher than that of the measurement point of 30 cm, but this was reversed from May to December. The two values were close for the double-slope photovoltaic greenhouse, except that the relative humidity at the 30 cm point was slightly lower than that at the 180 cm point.
In order to analyze the distribution law of relative humidity of the two types of photovoltaic greenhouses under different covers, each of the greenhouses was divided into three areas: the lighting surface, the middle, and the PV panel, as shown in Figure 15. As shown, the relative humidity at the lighting surface of the single-slope photovoltaic greenhouse was higher than the middle and the PV panel. However, in the double-slope photovoltaic greenhouse, the relative humidity at the PV panel was higher than the middle and the lighting surface.
Due to the structural differences between the two types of greenhouses, both ventilation performance and temperature performance were different for the two greenhouse types. Therefore, the spatial distribution laws of relative humidity in the two types of greenhouses differed significantly, but the overall trends were similar, and the differences were not significant. It can be concluded that the spatial distribution of relative humidity was fairly balanced in both types of photovoltaic greenhouses.

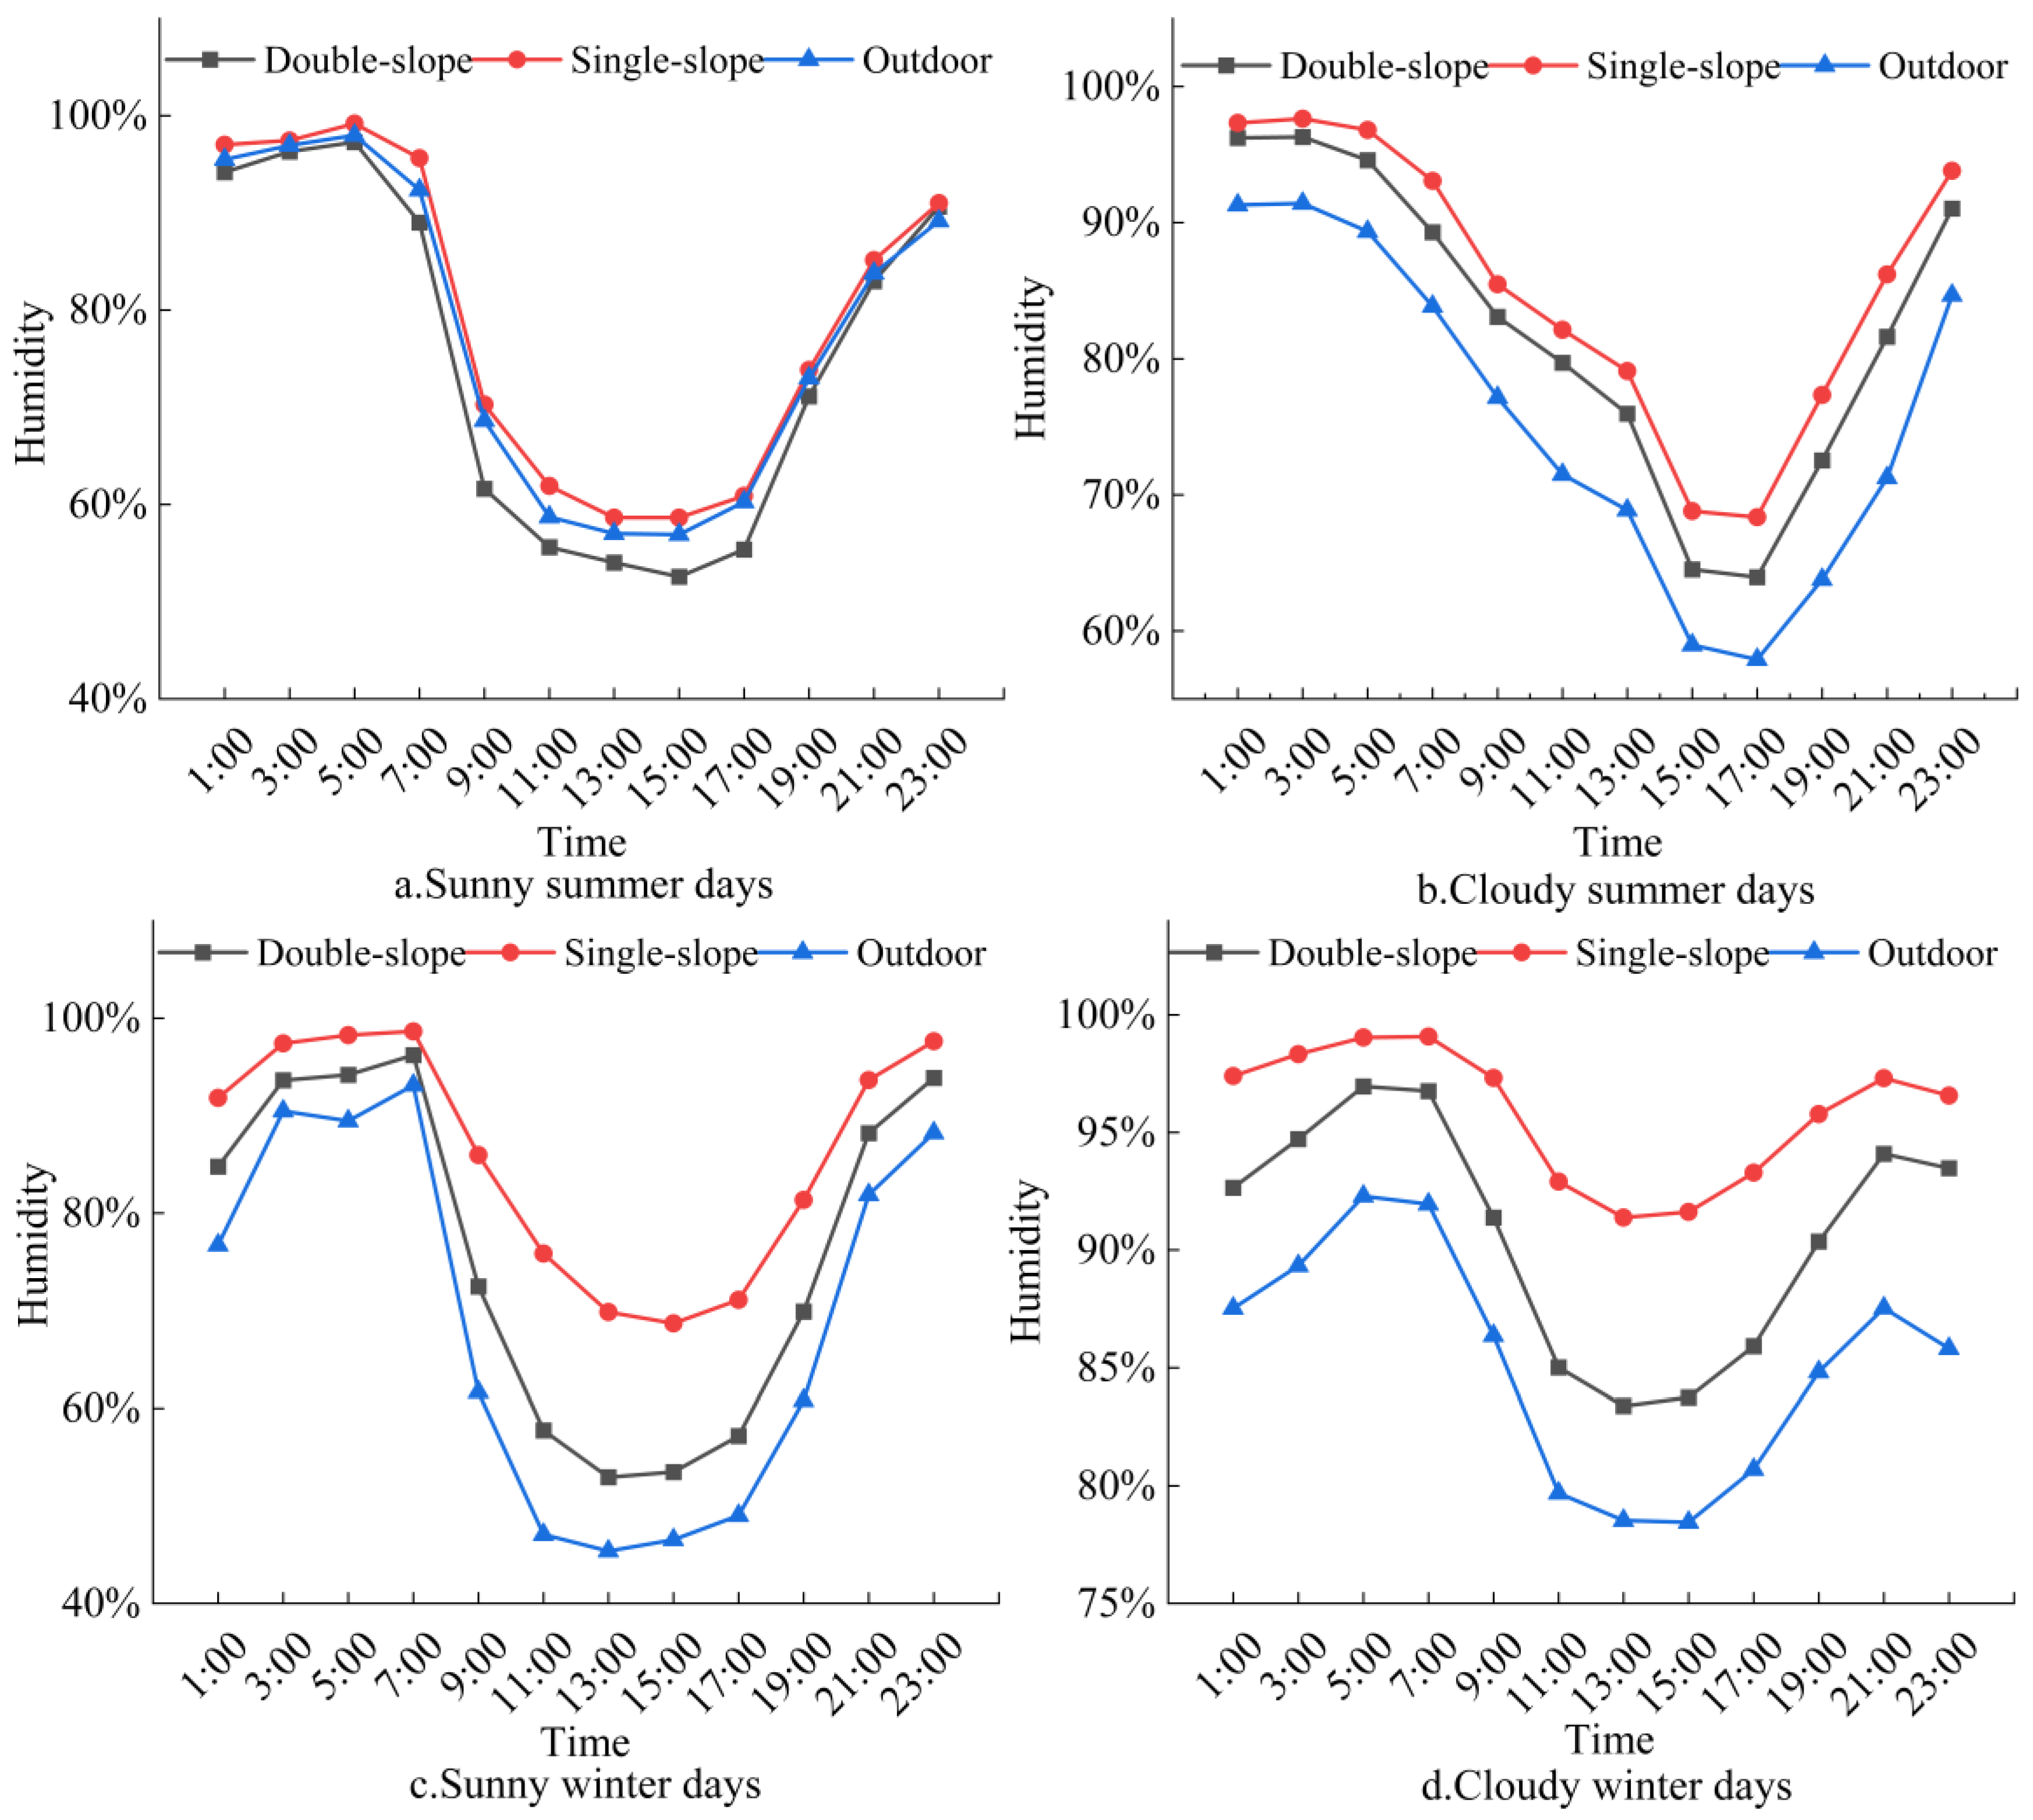
3.3.3. Diurnal Changes in Relative Humidity Under Typical Weather

Typical weather data near the summer and winter solstices (8:00~18:00) were selected to analyze the daily change laws of relative humidity in two different types of photovoltaic greenhouses under typical weather, as shown in Figure 16. As shown, except on clear summer days, the relative humidity in the single-slope photovoltaic greenhouse was generally higher than that in the double-slope photovoltaic greenhouse.
As shown in Figure 16a, on clear summer days, the relative humidity was lowest in the double-slope photovoltaic greenhouse and highest in the single-slope photovoltaic greenhouse, with outdoor relative humidity falling between the two. The average relative humidity throughout the day varied by no more than 4.1%.
As shown in Figure 16b, on cloudy summer days, the outdoors had the lowest relative humidity, the single-slope greenhouse had the highest relative humidity, and the double-slope photovoltaic greenhouse had slightly lower relative humidity than the single-slope greenhouse. The average relative humidity throughout the day varied by no more than 16.3%.
As shown in Figure 16c, on clear winter days, there was little difference in relative humidity between indoors and outdoors at night, both relatively high. During 9:00~19:00 when the temperature increased, the relative humidity dropped rapidly, with a more significant drop observed in the double-slope photovoltaic greenhouse. The average relative humidity throughout the day varied by no more than 23.7%.
As shown in Figure 16d, on cloudy winter days, the relative humidity in the single-slope greenhouse was consistently high (>90%) both at day and night. The relative humidity in the double-slope photovoltaic greenhouse during the daytime (around 85%) was significantly lower than that in the single-slope greenhouse.
In summary, the relative humidity in photovoltaic greenhouses was closely related to indoor temperatures. Since the temperature in the double-slope photovoltaic greenhouse was relatively higher, its humidity was relatively lower across different seasons and weather conditions, making it more suitable for crop growth.

3.4. Simulation Analysis of PAR and Light Transmittance

The analysis of measured environmental parameters indicated that in tropical areas, the arrangement of photovoltaics had a significant impact on PAR and light transmittance within the greenhouse, which were key limiting factors for photovoltaic greenhouses in the area. Therefore, based on these measured parameters, this paper further compared and analyzed the PAR and light transmittance in the two types of photovoltaic greenhouses.

Modeling and Parameter Setting of Photovoltaic Greenhouses

(1)
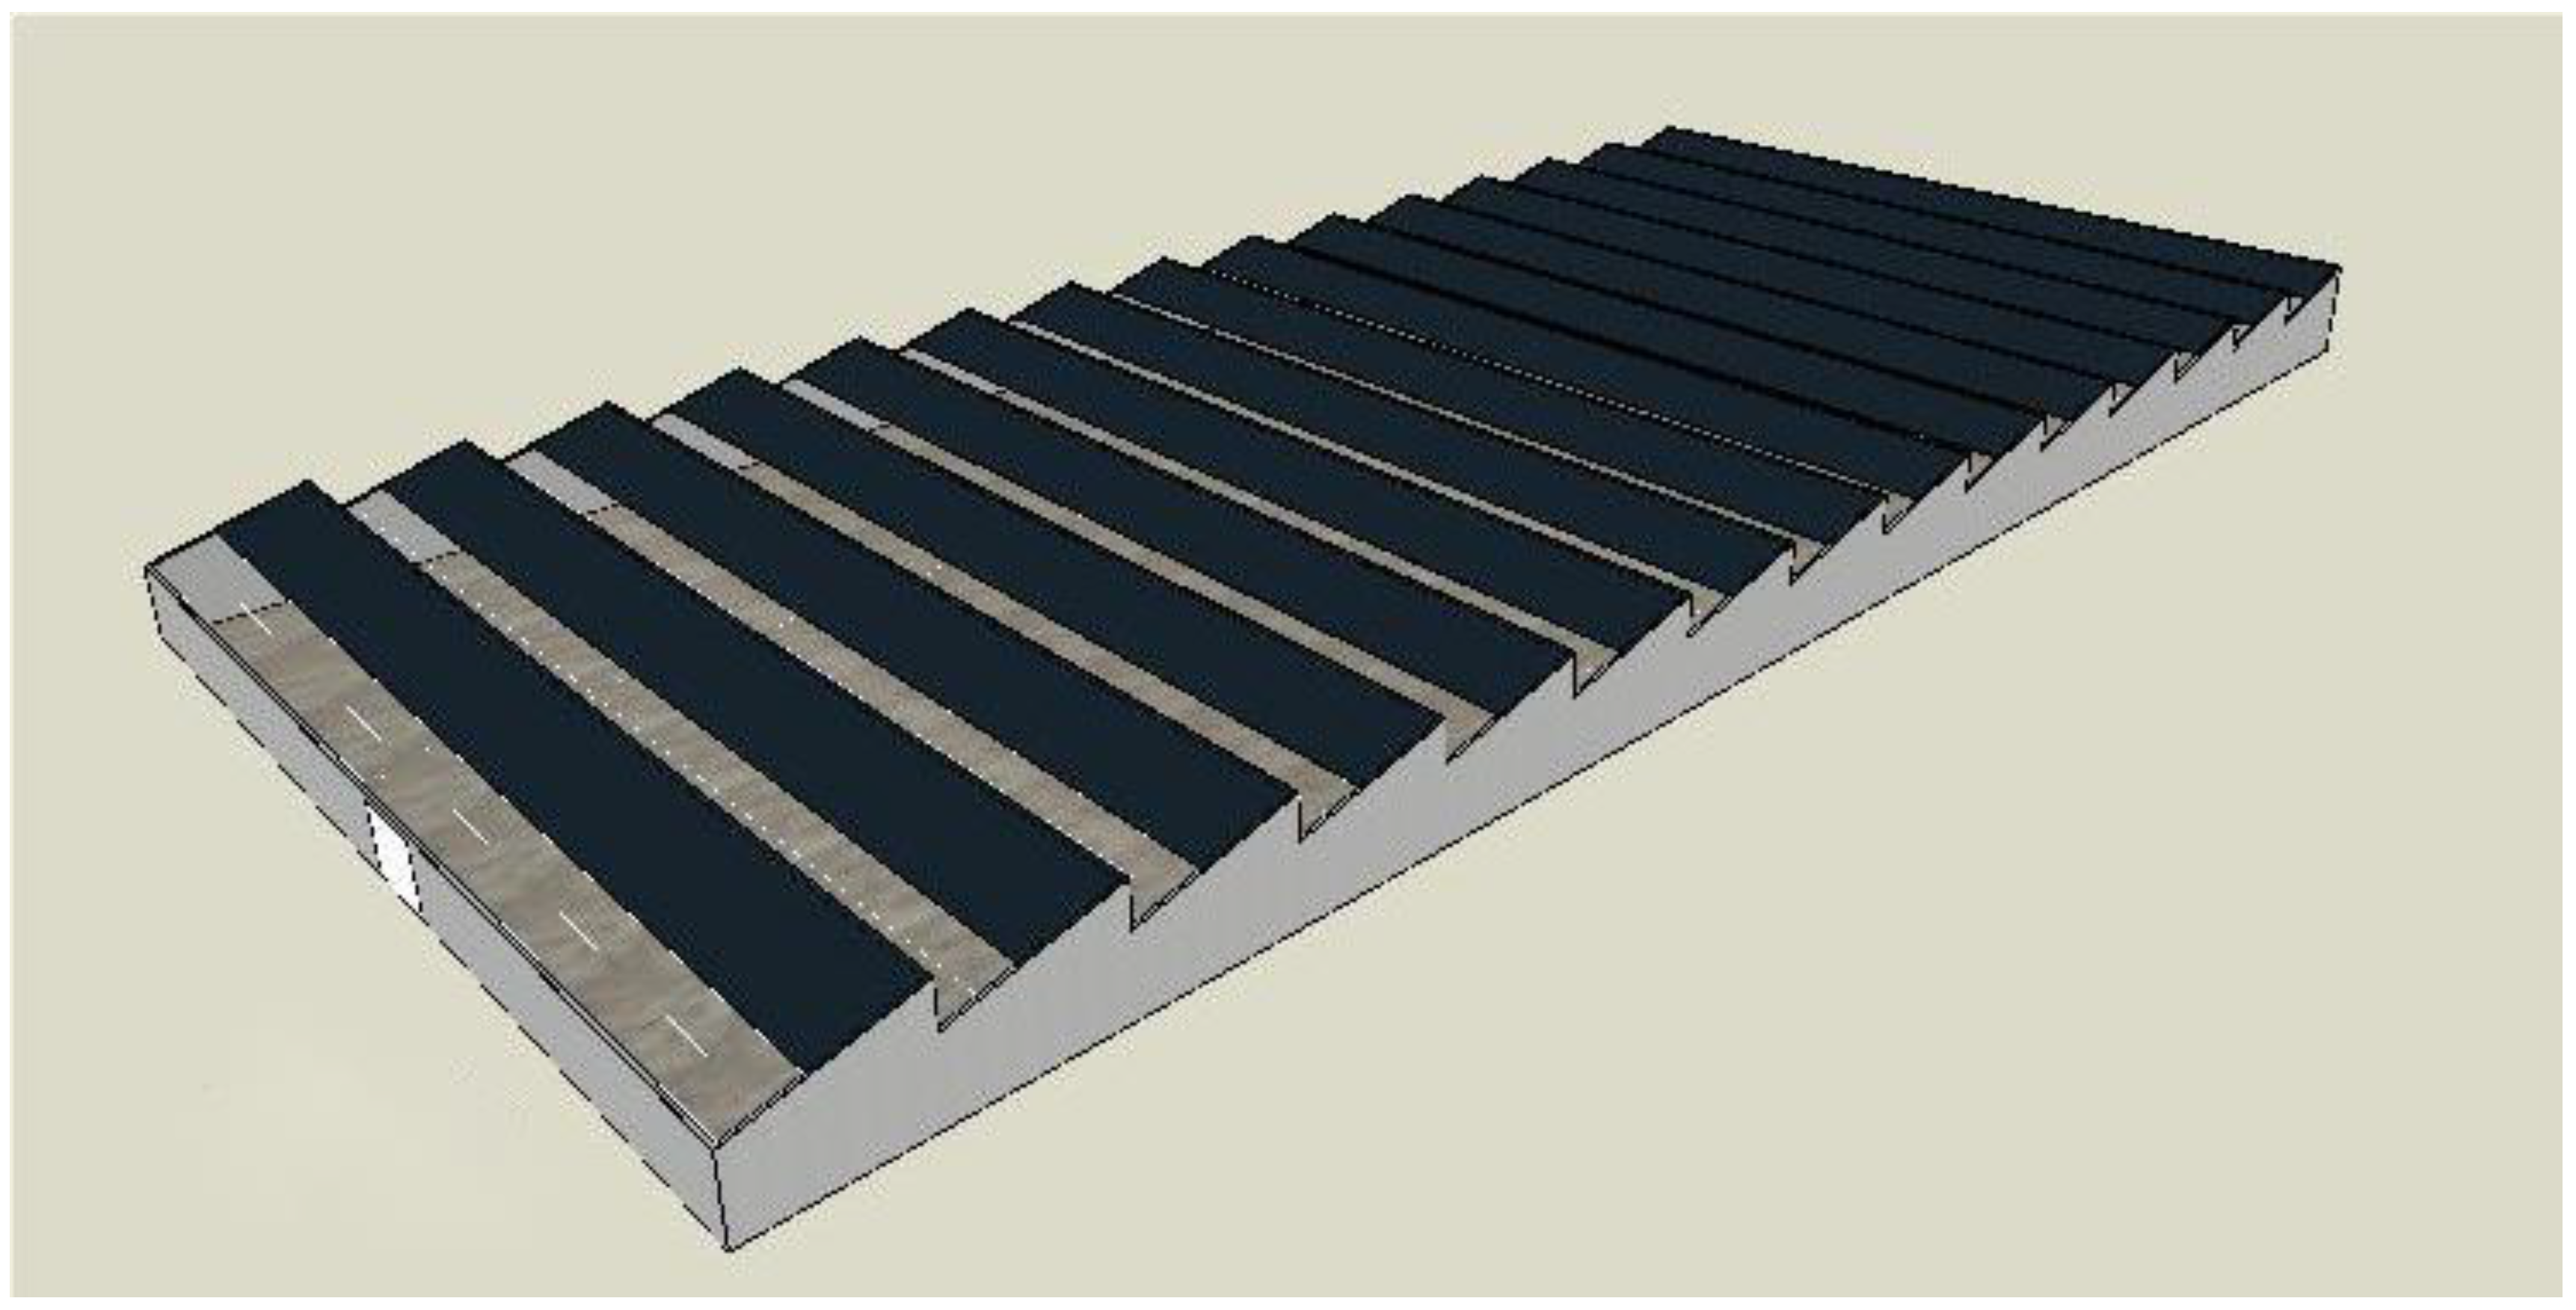
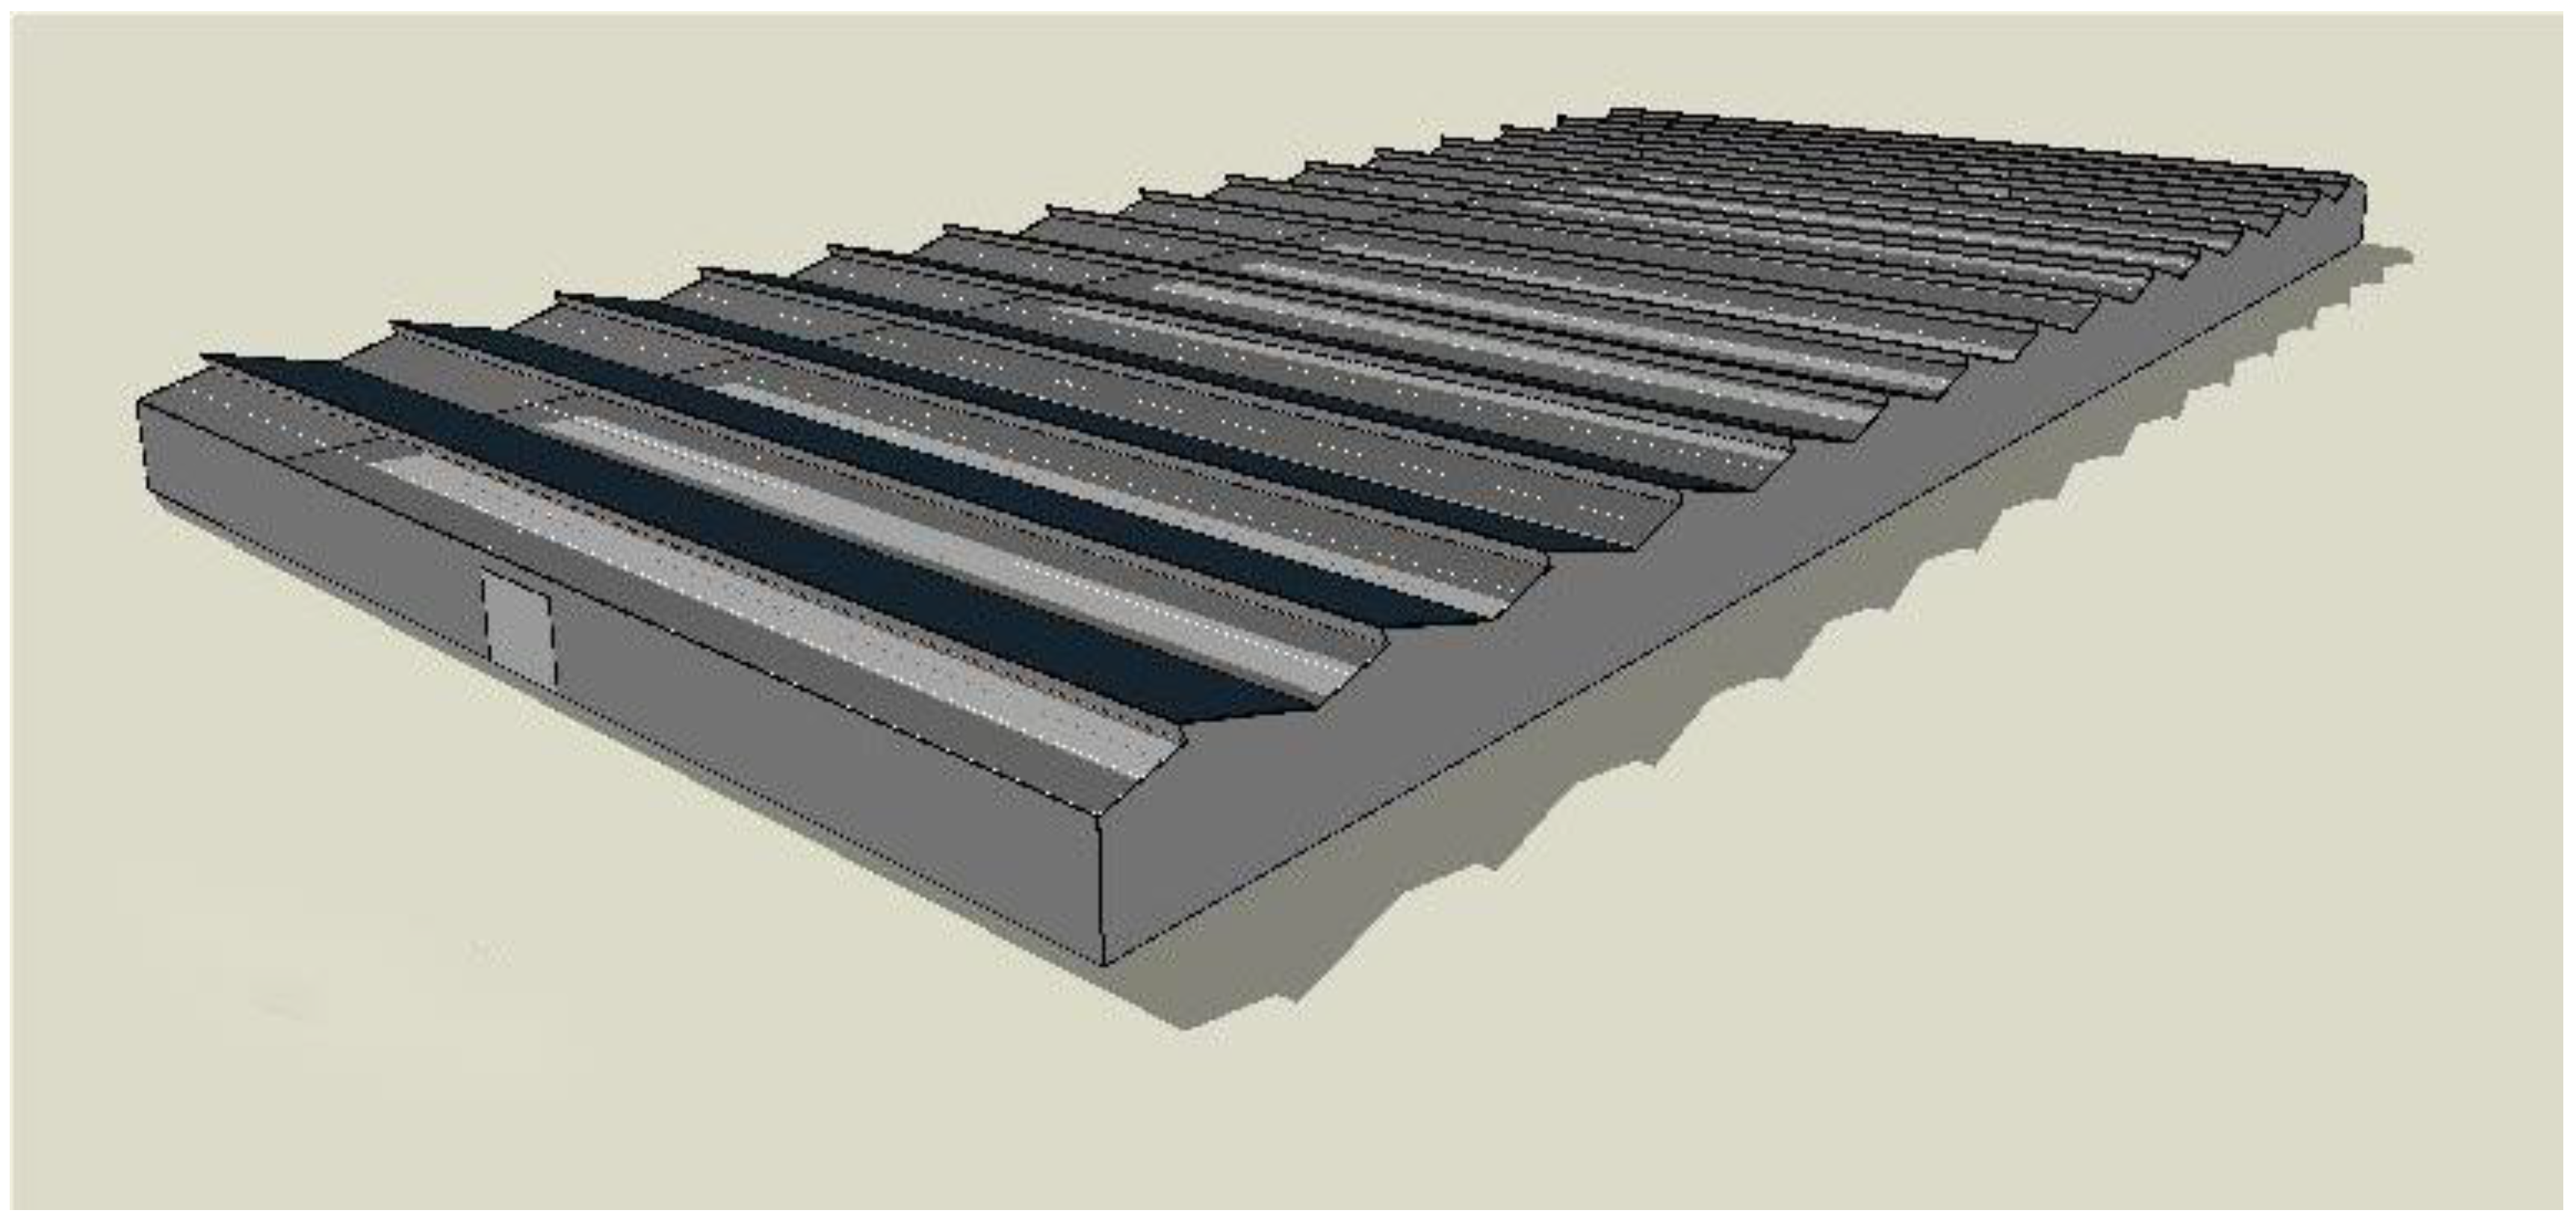
Modeling of photovoltaic greenhouses
As this simulation test mainly focused on existing photovoltaic greenhouses, 3D models were directly built in Design Builder based on the dimensions of the existing greenhouse structures. Figure 17 and Figure 18 show the single-slope and double-slope photovoltaic greenhouse models constructed in Design Builder software, respectively.
(2)
Parameter setting of photovoltaic greenhouse models
Before the modeling, it was crucial to determine the geographical location. This experiment was conducted in the Yangpu Economic Development Zone, Danzhou City, Hainan Province. However, as the software did not have meteorological data for Danzhou, Haikou City near Danzhou was selected, with CSWD-type meteorological data provided by the China Meteorological Administration.
After the models were constructed in Design Builder software based on the existing blueprints, the design parameters for different structures within the photovoltaic greenhouse were set, which included the following: (1) roof: comprising materials for the PV panels and the lighting sections; (2) facade: insect-proof screen; (3) ground: soil. The parameters for this simulation experiment were adjusted mainly based on the existing values in the system, as summarized in Table 3.
The simulated and measured monthly average light transmittance data of two types of photovoltaic greenhouses from February to January of the following year were analyzed, as shown in Figure 19. As shown, the overall trends of both simulated and measured values for the two types of greenhouses were generally consistent. For the single-slope photovoltaic greenhouse, the simulated transmittance was higher than the measured transmittance, and the measured values of February, April, August, and November were close to the simulation results. In contrast, for the double-slope photovoltaic greenhouse, the measured values from May to September were close to or equal to the simulation results. The software simulation represented the overall average inside the greenhouse, whereas the measured values represented the PAR at specific test points in the greenhouse. As the recording interval at these test points was 30 min, it would be possible that the greenhouse framework or contaminants on the covers were situated directly in line with the test points at the time of recording, casting shadows on the measurement instruments and thus affecting the measured results. Additionally, the randomness of weather and local clouds may also influence the measured values. Therefore, the measured values were generally lower than the simulated values, and the change curves were not strictly consistent. However, the overall trends in both measured and simulated values for the two types of greenhouses were similar, with an average difference within 5%. This indicated that the simulation results for the light environment were generally reliable and could be used for simulating PAR inside the photovoltaic greenhouses.

4. Discussions

The arrangement of PV panels could reduce the illumination within the greenhouse, directly affecting the photosynthesis of crops grown inside. Except for their influence on the illumination, the PV panels would also affect the temperature and humidity in the greenhouse. In summer, the PV panels can reduce high indoor temperatures. During winter, as the primary source of heat in non-heating greenhouses is sunlight, the arrangement of PV panels may also reduce the indoor temperature. Therefore, this study focused on two main parameters of light and temperature to study the serrated photovoltaic greenhouses, and the results of the research are discussed as follows:
(1)
PAR: The average PAR levels in the double-slope photovoltaic greenhouse across the four seasons were 190.97 μmol/(m2·s), 269.69 μmol/(m2·s), 122.79 μmol/(m2·s), and 76.47 μmol/(m2·s), respectively. In the single-slope photovoltaic greenhouse, the average PAR levels for the four seasons were 173.62 μmol/(m2·s), 170.53 μmol/(m2·s), 101.45 μmol/(m2·s), and 64.77 μmol/(m2·s), respectively. According to the photosynthetic saturation point and light compensation point of crops, both types of photovoltaic greenhouses were suitable for growing shade-tolerant leafy vegetables such as water spinach, pak choi, bok choy, and Chinese mustard.
(2)
Light transmittance: The annual average light transmittance of the double-slope photovoltaic greenhouse and the single-slope photovoltaic greenhouse were 23.91% and 19.17%, respectively. The roof angle of both types of photovoltaic greenhouses was 15°. According to the range of solar elevation angles in Hainan throughout the year (47~90°), the range of incident angles of the two types of photovoltaic greenhouses could be calculated to be 15~38°. When the incident angle was 0°, the reflectance would be 0, and the transmittance would reach the maximum of 90%. The decrease in light transmittance was not significant when the incident angle was smaller than 40°. Therefore, the solar elevation angle had little impact on the two types of photovoltaic greenhouses in this experiment. The comparison between simulated results and measured results also showed that the simulated values had similar trends to measured values, but the simulated values were relatively higher. The analysis of the local climatic conditions showed that summer and autumn were rainy seasons in Hainan, whereas winter and spring were dry seasons. Frequent rain during summer and autumn could enhance the growth of moss on the roof’s light-transmitting materials, thereby reducing the light transmittance to some extent. Therefore, the transmittance coefficient of the light-transmitting cover materials should be adjusted according to the actual conditions when setting up the model.
(3)
Temperature: The indoor temperatures of both types of serrated photovoltaic greenhouses were higher than that outdoors, with the largest difference occurring in summer when temperatures were high, and the smallest difference in winter when temperatures were low. The average summer temperatures of the two types of greenhouses were 30.91 °C and 30.09 °C, respectively, while the average winter temperatures were 18.94 °C and 18.88 °C, respectively. According to the temperature requirements for crop growth, the two types of serrated photovoltaic greenhouses were suitable for growing heat-tolerant leafy vegetables [29]. Vertically, the temperature in the double-slope photovoltaic greenhouse generally decreased with an increase in height. This was because the ridge of the double-slope greenhouse was covered with insect-proof screens, which could facilitate natural ventilation (due to wind pressure and thermal buoyancy) and enhance air circulation with the outside, leading to lower temperatures at higher levels. Therefore, the temperatures were slightly lower at higher elevations compared with lower ones. In contrast, single-slope photovoltaic greenhouse had reverse results. This was because the space between the PV panels and the glass panels on the roof were sealed with aluminum foil butyl tape and the ventilation openings were on one side, resulting in less vertical temperature difference compared with the double-slope greenhouse.
(4)
Relative humidity: In this experiment, the average indoor relative humidity levels in both types of serrated photovoltaic greenhouses both ranged from approximately 80 to 90% across all seasons, with a fairly uniform spatial distribution. The suitable relative humidity to grow leafy vegetables, which were tolerant to high humidity, was 85–90% [30]. Therefore, these two types of serrated photovoltaic greenhouses are quite suitable for the cultivation and year-round production of leafy vegetables.
The results of this paper showed both similarities and differences compared with existing studies. For the similarities, the annual average light transmittance levels for the double-slope and single-slope photovoltaic greenhouses were 23.91% and 19.17%, respectively. The reason is that the double-slope greenhouse used diffusive film, which has a higher transmittance than the tempered glass used in single-slope greenhouse. Additionally, the double-slope greenhouse had a shorter period of use, resulting in less degradation of the roof material [29]. The PAR measured at different locations in the greenhouse were also different. During spring and summer, which have higher PAR levels, the PAR levels obtained at the lighting surface and the middle test points were higher than those at the PV panel test points, which is consistent with the experimental conclusions obtained in an east–west-facing photovoltaic greenhouse in Italy [31]. The greater the ventilation ratio of the roof windows in a fully open greenhouse, the better the natural cooling effect during summer, which is consistent with the experimental conclusions of this study [32].

5. Conclusions

This study conducted experimental measurements and simulation studies on environmental parameters such as light, temperature, and humidity in single-slope and double-slope serrated photovoltaic greenhouses in the Yangpu Development Zone, Hainan. The ridges of both types of greenhouses run east to west, with PV panels arranged on the south-facing slopes, covering 57% of the area. The conclusions of the study are as follows:
(1)
The annual average PAR for the double-slope and single-slope photovoltaic greenhouses was 164.98 μmol/(m2·s) and 127.59 μmol/(m2·s) respectively, with a light transmittance of 23.91% and 19.17%. Under the same coverage rate (57%), the average light transmittance of the double-slope greenhouse was 4.74% higher and the average annual PAR was 37.39 μmol/(m²·s) higher than the single-slope greenhouse.
(2)
The annual average temperatures in the double-slope and single-slope photovoltaic greenhouses were 25.56 °C and 25.10 °C, respectively, with the double-slope greenhouse having an indoor temperature 0.46 °C higher than the single-slope.
(3)
The annual average relative humidity levels in the double-slope and single-slope photovoltaic greenhouses were 85.00% and 86.88%, respectively, and the indoor relative humidity of the double-slope greenhouse was a bit lower than the single-slope, with a difference of 1.88%.
(4)
The light transmittance in both types of greenhouses was simulated using Design Builder software. The results show that the simulated values were generally consistent with the measured values and were overall higher than the measured values, with an average difference within 5%.
In summary, both types of photovoltaic greenhouses are suitable for leafy vegetable production in tropical areas. The double-slope greenhouse offers higher light transmittance and more suitable relative humidity levels. It has better performance in thermal insulation during winter. Additionally, the double-slope greenhouse is featured with a symmetrical roof structure that enhances structural performance and a lower ridge that makes it more economical. Therefore, the double-slope greenhouse may be a preferred structural form. However, during sunny summer weather when the indoor temperature is higher, better ventilation and cooling measures should be taken to meet the temperature requirements for crop production.

Author Contributions

Conceptualization, J.L.; methodology, J.L.; software, Q.W.; validation, Q.W.; formal analysis, Q.W., Y.C. and Y.S.; investigation, Y.C.; resources, J.L.; data curation, Y.C.; writing—original draft, Y.C. and Q.W.; writing—review and editing, Q.W.; visualization, Y.S.; project administration, B.W.; funding acquisition, B.W. All authors have read and agreed to the published version of the manuscript.

Funding

This research was supported by the 2024 Science and Technology Commissioner Service Group’s Emergency Science and Technology Research Project for Wind Disaster Relief in Hainan Province, grant number ZDYF2024YJGG002-8.

Data Availability Statement

All data are presented in this article in the form of figures and tables.

Acknowledgments

We would like to thank the Innovation and utilization team of tropical melon crop genetic germplasm, Hainan University.

Conflicts of Interest

The authors declare no conflicts of interest.

Nomenclature

PVPhotovoltaic
DLIDaily Light Integral
PARPhotosynthetically active radiation

References

  1. Djevic, M.; Dimitrijevic, A. Energy consumption for different greenhouse constructions. Energy 2009, 34, 1325–1331. [Google Scholar]
  2. Al-Ibrahim, A.; Al-Abbadi, N.; Al-Helal, I. Photovoltaic greenhouse system, system description, performance and lesson learned. Acta Hortic. 2006, 710, 251–264. [Google Scholar]
  3. Al-Shamiry, F.; Ahmad, D.; Sharif, A.R.M.; Aris, I.; Janius, R.; Kamaruddin, R. Design and development of photovoltaic power system for tropical greenhouse cooling. Am. J. Appl. Sci. 2018, 4, 386–389. [Google Scholar]
  4. Sonneveld, P.J.; Swinkels, G.L.A.M.; Campen, J.; van Tuijl, B.A.J.; Janssen, H.J.J.; Bot, G.P.A. Performance results of a solar greenhouse combining electrical and thermal energy production. Biosyst. Eng. 2010, 106, 48–57. [Google Scholar]
  5. Yano, A.; Onoe, M.; Nakata, J. Prototype semi-transparent photovoltaic modules for greenhouse roof applications. Biosyst. Eng. 2014, 122, 62–73. [Google Scholar]
  6. Trypanagnostopoulos, G.; Kavga, A.; Souliotis, M.; Tripanagnostopoulos, Y. Greenhouse performance results for roof installed photovoltaics. Renew. Energy 2017, 111, 724–731. [Google Scholar]
  7. Yano, A.; Kadowaki, M.; Furue, A.; Tamaki, N.; Tanaka, T.; Hiraki, E.; Kato, Y.; Ishizu, F.; Noda, S. Shading and electrical features of a photovoltaic array mounted inside the roof of an east-west oriented greenhouse. Biosyst. Eng. 2010, 106, 367–377. [Google Scholar]
  8. Kadowaki, M.; Yano, A.; Ishizu, F.; Tanaka, T.; Noda, S. Effects of greenhouse photovoltaic array shading on Welsh onion growth. Biosyst. Eng. 2011, 111, 290–297. [Google Scholar]
  9. Ezzaeri, K.; Fatnassi, H.; Wifaya, A.; Bazgaou, A.; Aharoune, A.; Poncet, C.; Bekkaoui, A.; Bouirden, L. Performance of photovoltaic canarian greenhouse: A comparison study between summer and winter seasons. Sol. Energy 2020, 198, 275–282. [Google Scholar]
  10. Fatnassi, H.; Poncet, C.; Brun, R.; Muller, M.M.; Bertin, N. CFD Study of Climate Conditions under Greenhouses Equipped with Photovoltaic Panels. Acta Hortic. 2014, 1054, 63–72. [Google Scholar]
  11. Worku, W.; Skjelvåg, A.; Gislerød, H. Responses of common bean (Phaseolus vulgaris L.) to photosynthetic irradiance levels during three phenological phases. Agronomie 2004, 24, 267–274. [Google Scholar]
  12. Moretti, S.; Marucci, A. A photovoltaic greenhouse with variable shading for the optimization of agricultural and energy production. Energies 2019, 12, 2589. [Google Scholar] [CrossRef]
  13. Fu, J.; Li, C.-H.; Zhao, J.-R.; Ma, L.; Liu, T.-X. Shade-tolerance indices of maize: Selection and evaluation. Chin. J. Appl. Ecol. 2009, 20, 2705. [Google Scholar]
  14. Tani, A.; Shiina, S.; Nakashima, K.; Hayashi, M. Improvement in lettuce growth by light diffusion under solar panels. J. Agric. Meteorol. 2014, 70, 139–149. [Google Scholar]
  15. Cossu, M.; Yano, A.; Solinas, S.; Deligios, P.A.; Tiloca, M.T.; Cossu, A.; Ledda, L. Agricultural sustain ability estimation of the European photovoltaic greenhouses. Eur. J. Agron. 2020, 118, 126074. [Google Scholar]
  16. Ezzaeri, K.; Fatnassi, H.; Bouharroud, R.; Gourdo, L.; Bazgaou, A.; Wifaya, A.; Demrati, H.; Bekkaoui, A.; Aharoune, A.; Poncet, C.; et al. The effect of photovoltaic panels on the microclimate and on the tomato production under photovoltaic canarian greenhouses. Solar Energy 2018, 173, 1126–1134. [Google Scholar]
  17. Aroca-Delgado, R.; Pérez-Alonso, J.; Callejón-Ferre, Á.-J.; Díaz-Pérez, M. Morphology, yield and quality of greenhouse tomato cultivation with flexible photovoltaic rooftop panels. Sci. Hortic. 2019, 257, 108768. [Google Scholar]
  18. López-Díaz, G.; Carreño-Ortega, A.; Fatnassi, H.; Ponce, C.; Díaz-Pérez, M. The Effect of Different Levels of Shading in a Photovoltaic Greenhouse with a North–South Orientation. Appl. Sci. 2020, 10, 882. [Google Scholar] [CrossRef]
  19. Cossu, M.; Murgia, L.; Ledda, L.; Deligios, P.A.; Sirigu, A.; Chessa, F.; Pazzona, A. Solar radiation distribution inside a greenhouse with south-oriented photovoltaic roofs and effects on crop productivity. Appl. Energy 2014, 133, 89–100. [Google Scholar]
  20. Hassanien, R.H.E.; Ming, L. Influences of greenhouse-integrated semitransparent photovoltaics on microclimate and lettuce growth. Int. J. Agric. Biol. Eng. 2017, 10, 11–22. [Google Scholar]
  21. Hsiao, C.-L.; Wang, C.-Y.; Hsu, Y.-T. Effect of Simulated Photovoltaic Roofs on the Yield and Nitrate Content of Pak Choi and Rape. HortScience 2023, 58, 1297–1305. [Google Scholar] [CrossRef]
  22. Wei, D.; Zengchan, Z.; Wenxi, L.; Fengmei, T.; Shuili, L.; Jian, Z. Comparison of indoor and outdoor environmental conditions of photovoltaic greenhouse. Agric. Eng. 2015, 5, 44–48. [Google Scholar]
  23. Liu, J.; Chen, Y.; Wang, B.; Wu, X.; Na, Y. Simulation and experimental study of light and thermal environment of photovoltaic greenhouse in tropical area based on design builder. Appl. Sci. 2021, 11, 10785. [Google Scholar] [CrossRef]
  24. Amara, H.B.; Bouadila, S.; Fatnassi, H.; Arici, M.; Guizani, A.A. Climate Assessment of greenhouse equipped with south-oriented PV roofs: An experimental and computational fluid dynamics study. Sustain. Energy Technol. Assess. 2021, 45, 101100. [Google Scholar]
  25. Somov, A.; Shadrin, D.; Fastovets, I.; Nikitin, A.; Matveev, S.; Seledets, I.; Hrinchuk, O. Pervasive Agriculture: IoT-Enabled Greenhouse for Plant Growth Control. IEEE Pervasive Comput. 2018, 17, 65–75. [Google Scholar] [CrossRef]
  26. Wang, J.; Yang, D. Research progress on control methods of greenhouse environment. J. Chin. Agric. Mech. 2018, 39, 49–53. [Google Scholar] [CrossRef]
  27. Walczuch, D.; Nitzsche, T.; Seidel, T.; Schoning, J. Overview of Closed-Loop Control Systems and Artificial Intelligence Utilization in Greenhouse Farming. In Proceedings of the IEEE International Conference on Omni-Layer Intelligent Systems (COINS), Barcelona, Spain, 18 August 2022; pp. 1–6. [Google Scholar]
  28. Sun, W.; Kong, F.T.; Zhang, J.H.; Wu, J.Z.; Chai, X.; Cao, S.S. Greenhouse Intelligent Control System Based on Indoor and Outdoor Environmental Data Fusion. Earth Environ. Sci. 2020, 440, 042073. [Google Scholar] [CrossRef]
  29. Yang, L.; Chen, D. Analysis of light transmittance of different covering materials in solar greenhouse. Shaanxi J. Agric. Sci. 2018, 64, 29–31. [Google Scholar]
  30. Zou, Z.-R.; Shao, X.-H. Environmental Engineering of Facility Agriculture; China Agriculture Press: Beijing, China, 2008; pp. 54–55. [Google Scholar]
  31. Moreno, Á.; Chemisana, D.; Lamnatou, C.; Maestro, S. Energy and photosynthetic performance investigation of a semitransparent photovoltaic rooftop greenhouse for building integration. Renew. Energy 2023, 215, 118976. [Google Scholar] [CrossRef]
  32. Yu, Y. Cooling Effect and Evaluation of Greenhouse with Full Roof Window in Summer. Master’s Thesis, Shanghai Jiao Tong University, Shainghai, China, 2008; pp. 10–14. [Google Scholar]
Figure 1. Two types of photovoltaic greenhouses: (a) Single-slope photovoltaic greenhouse; (b) double-slope photovoltaic greenhouse.
Agronomy 15 00857 g001
Figure 2. Sketch of measuring points in photovoltaic greenhouse. (a): Setup of measuring points of two types of greenhouses. (b): Setup of measuring points of double-slope greenhouse (profile). (c): Setup of measuring points of double-slope greenhouse (plan). (d): Setup of measuring points of single-slope greenhouse (profile). (e): Setup of measuring points of single-slope greenhouse (plan).
Agronomy 15 00857 g002
Figure 3. Seasonal changes in PAR and light transmittance of different types of photovoltaic greenhouses. (Different letters indicate significant differences between groups, such as a status quo difference between a and b).
Agronomy 15 00857 g003
Figure 4. Horizontal distribution of PAR in the greenhouse.
Agronomy 15 00857 g004
Figure 5. Distribution of PAR under different components in the greenhouse.
Agronomy 15 00857 g005
Figure 6. Diurnal changes in PAR under typical weather in two types of greenhouses.
Agronomy 15 00857 g006
Figure 7. Seasonal changes in temperature in two types of photovoltaic greenhouses. (Different letters indicate significant differences between groups, such as a status quo difference between a and b).
Agronomy 15 00857 g007
Figure 8. Horizontal temperature distribution in the greenhouse.
Agronomy 15 00857 g008
Figure 9. Vertical temperature distribution in greenhouse.
Agronomy 15 00857 g009
Figure 10. Temperature distribution under different covers in greenhouse.
Agronomy 15 00857 g010
Figure 11. Diurnal changes in temperature under typical weather in two types of greenhouses.
Agronomy 15 00857 g011
Figure 12. Seasonal changes in relative humidity in two types of photovoltaic greenhouses. (Different letters indicate significant differences between groups, such as a status quo difference between a and b).
Agronomy 15 00857 g012
Figure 13. Horizontal distribution of relative humidity in the greenhouses.
Agronomy 15 00857 g013
Figure 14. Vertical distribution of relative humidity in the greenhouses.
Agronomy 15 00857 g014
Figure 15. Distribution of relative humidity in the greenhouses under different covers.
Agronomy 15 00857 g015
Figure 16. Diurnal changes in relative humidity in two types of greenhouses under typical weather.
Agronomy 15 00857 g016
Figure 17. Single-slope photovoltaic greenhouse model.
Agronomy 15 00857 g017
Figure 18. Double-slope photovoltaic greenhouse model.
Agronomy 15 00857 g018
Figure 19. Comparison of simulated and measured values of photovoltaic greenhouses.
Agronomy 15 00857 g019
Table 1. Annual average illuminance and transmittance of two types of photovoltaic greenhouses.
Double-Slope Photovoltaic GreenhouseSingle-Slope Photovoltaic GreenhouseOutdoor
PAR (μmol/(m2·s))164.98127.59658.69
Illuminance (Lux)8908.986890.0635,569.04
Light transmittance (%)23.9119.17
Table 2. Average annual temperature parameters of two types of photovoltaic greenhouses.
TypesDouble-Slope TemperatureSingle-Slope TemperatureOutdoor
Day temperature (°C)28.0127.2224.51
Night temperature (°C)23.1222.9820.60
Average temperature (°C)25.5625.1022.55
Table 3. Material parameters of each component of photovoltaic greenhouse.
ComponentsMaterialsParameters
Covering materialsPV panelsLight transmittance 10%, thermal conductivity 0.76 W/(m·K)
Film
Glass
Light transmittance 80%, thermal conductivity 0.17 W/(m·K)
Light transmittance 85%, thermal conductivity 0.76 W/(m·K)
40-mesh insect-proof screenLight transmittance 76.5%, porosity 53.76%
Ground of greenhouseSoilThermal conductivity 3.5 W/(m·K), specific heat 1.046 J/(kg·°C)
Disclaimer/Publisher’s Note: The statements, opinions and data contained in all publications are solely those of the individual author(s) and contributor(s) and not of MDPI and/or the editor(s). MDPI and/or the editor(s) disclaim responsibility for any injury to people or property resulting from any ideas, methods, instructions or products referred to in the content.

