
Saturated Hydraulic Conductivity of Nine Soils According to Water Quality, Soil Texture, and Clay Mineralogy
 , , , ,
  ,
,  and
and
Abstract
:1. Introduction
2. Material and Methods
2.1. Soil Sampling and Characterization
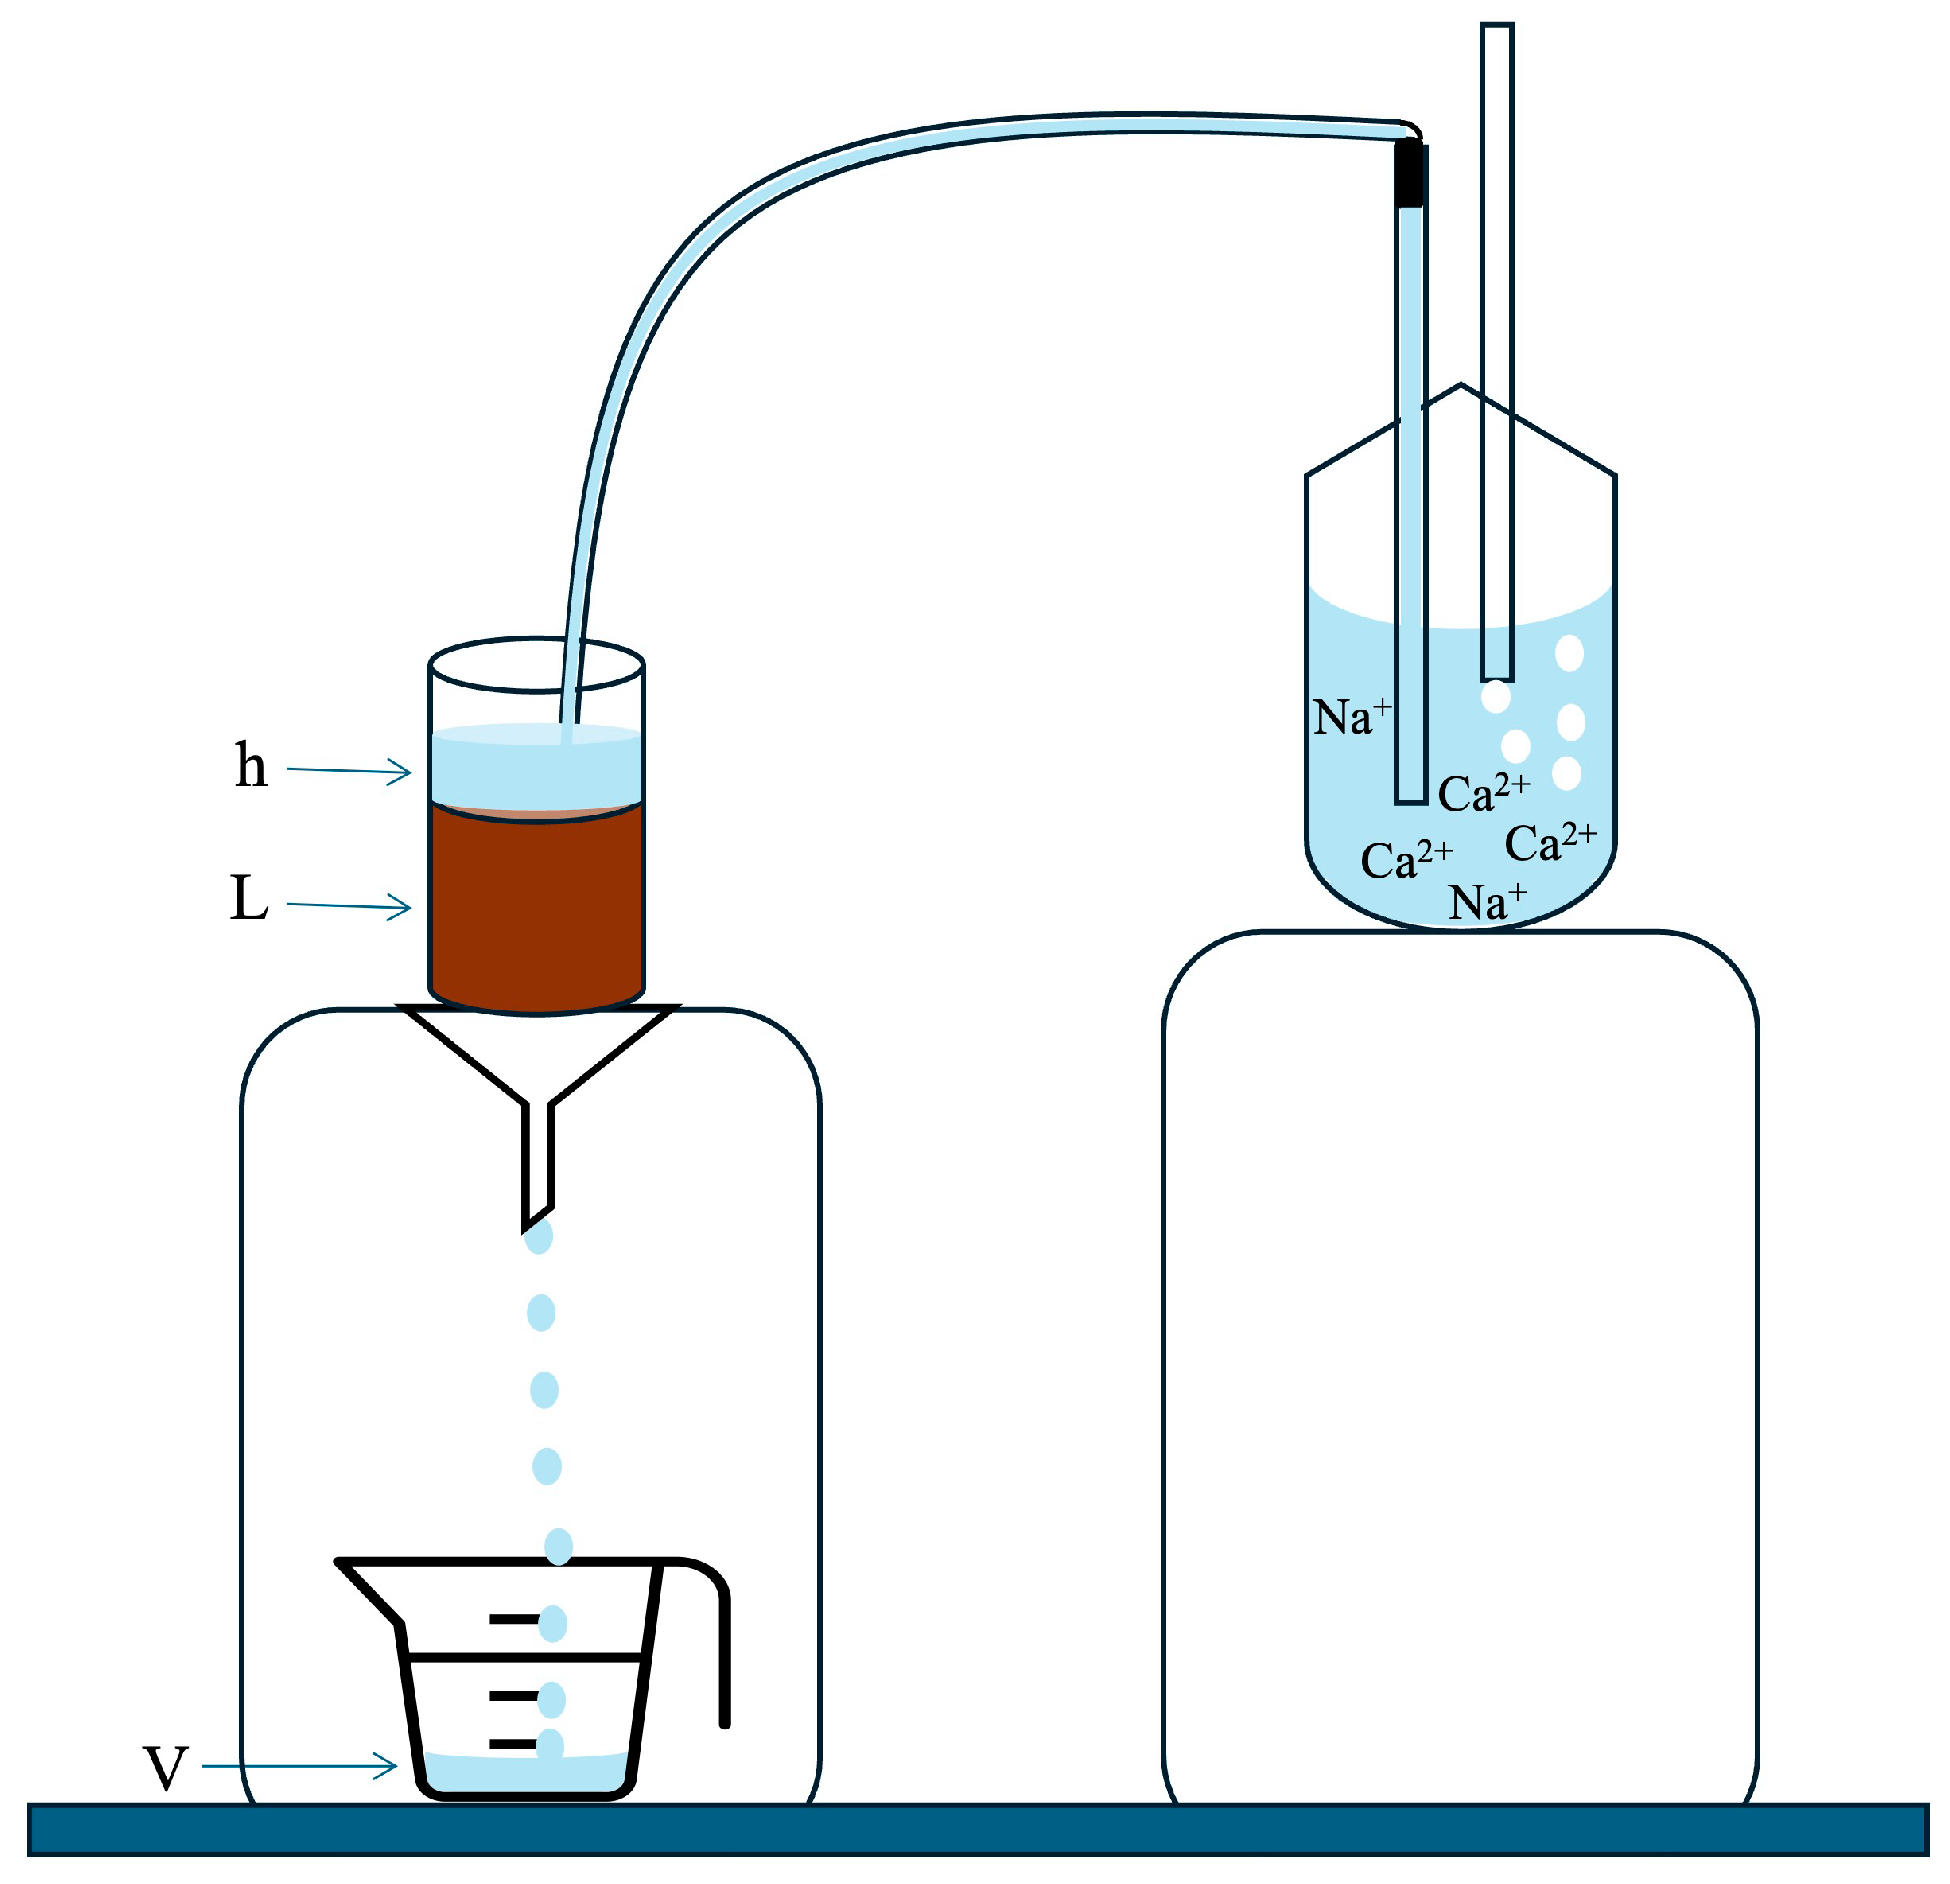
2.2. Saturated Hydraulic Conductivity Experiment
2.3. Statistical Analysis
3. Results
3.1. Saturated Hydraulic Conductivity
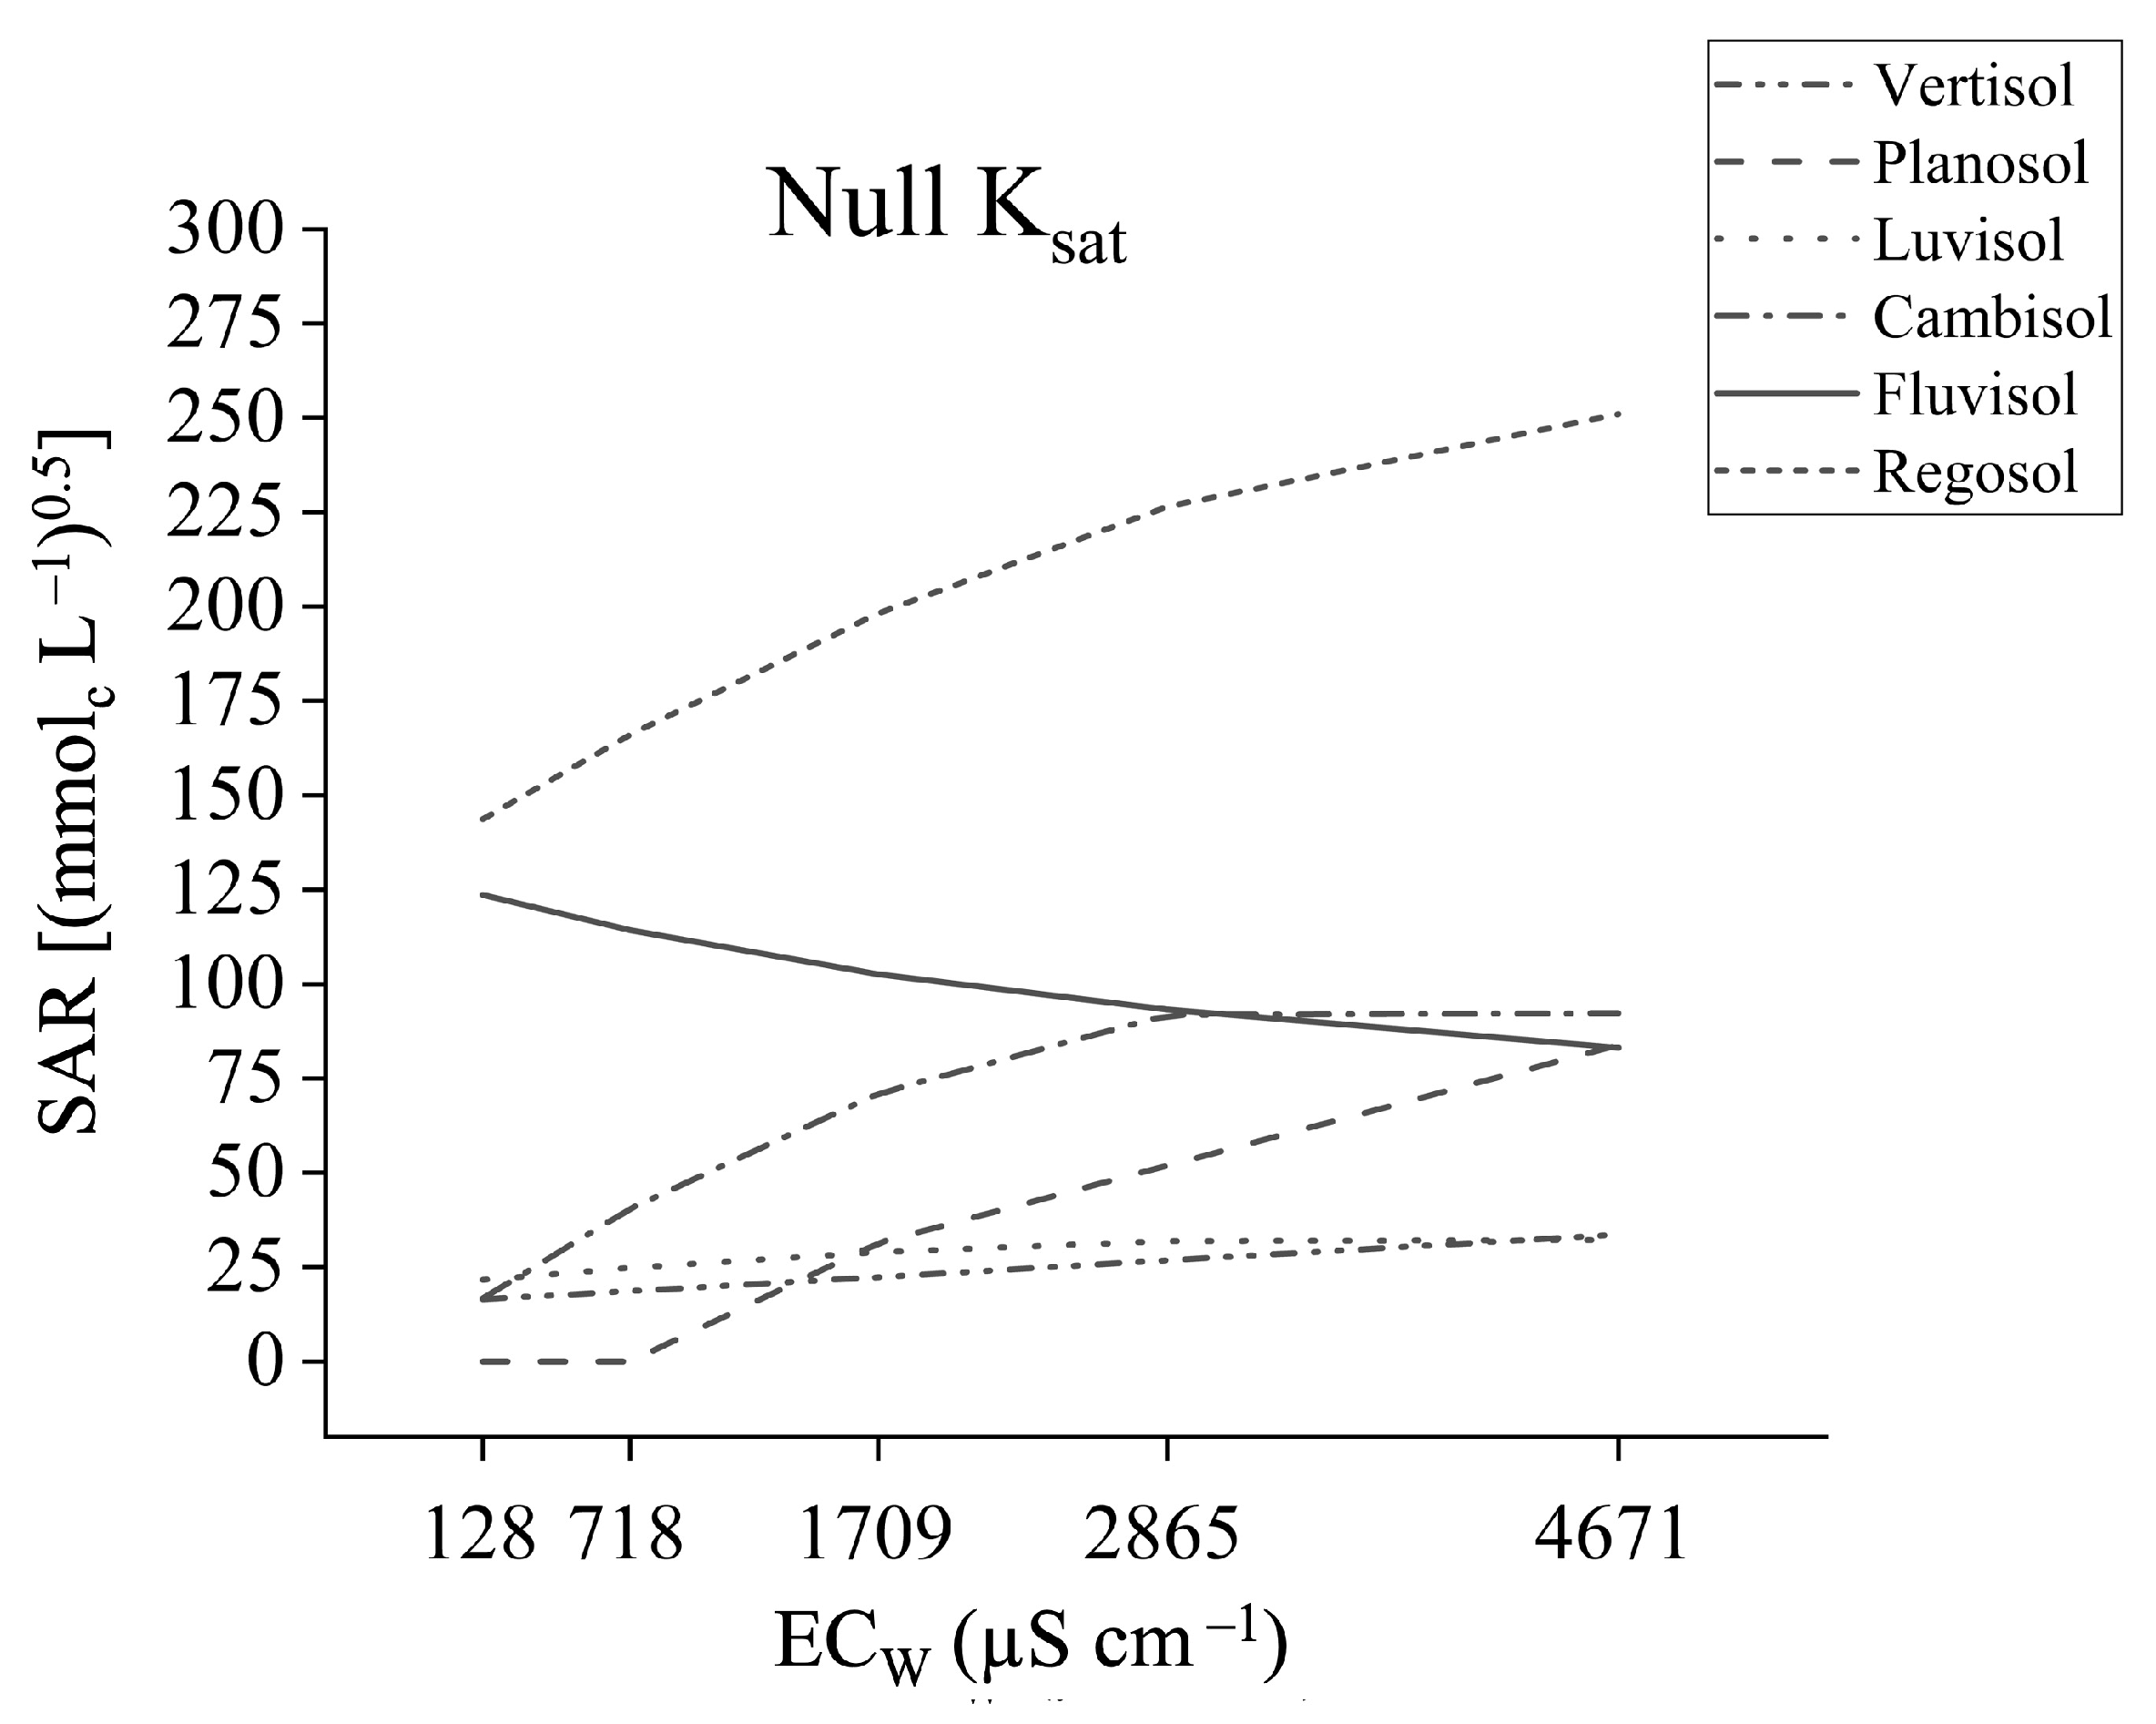
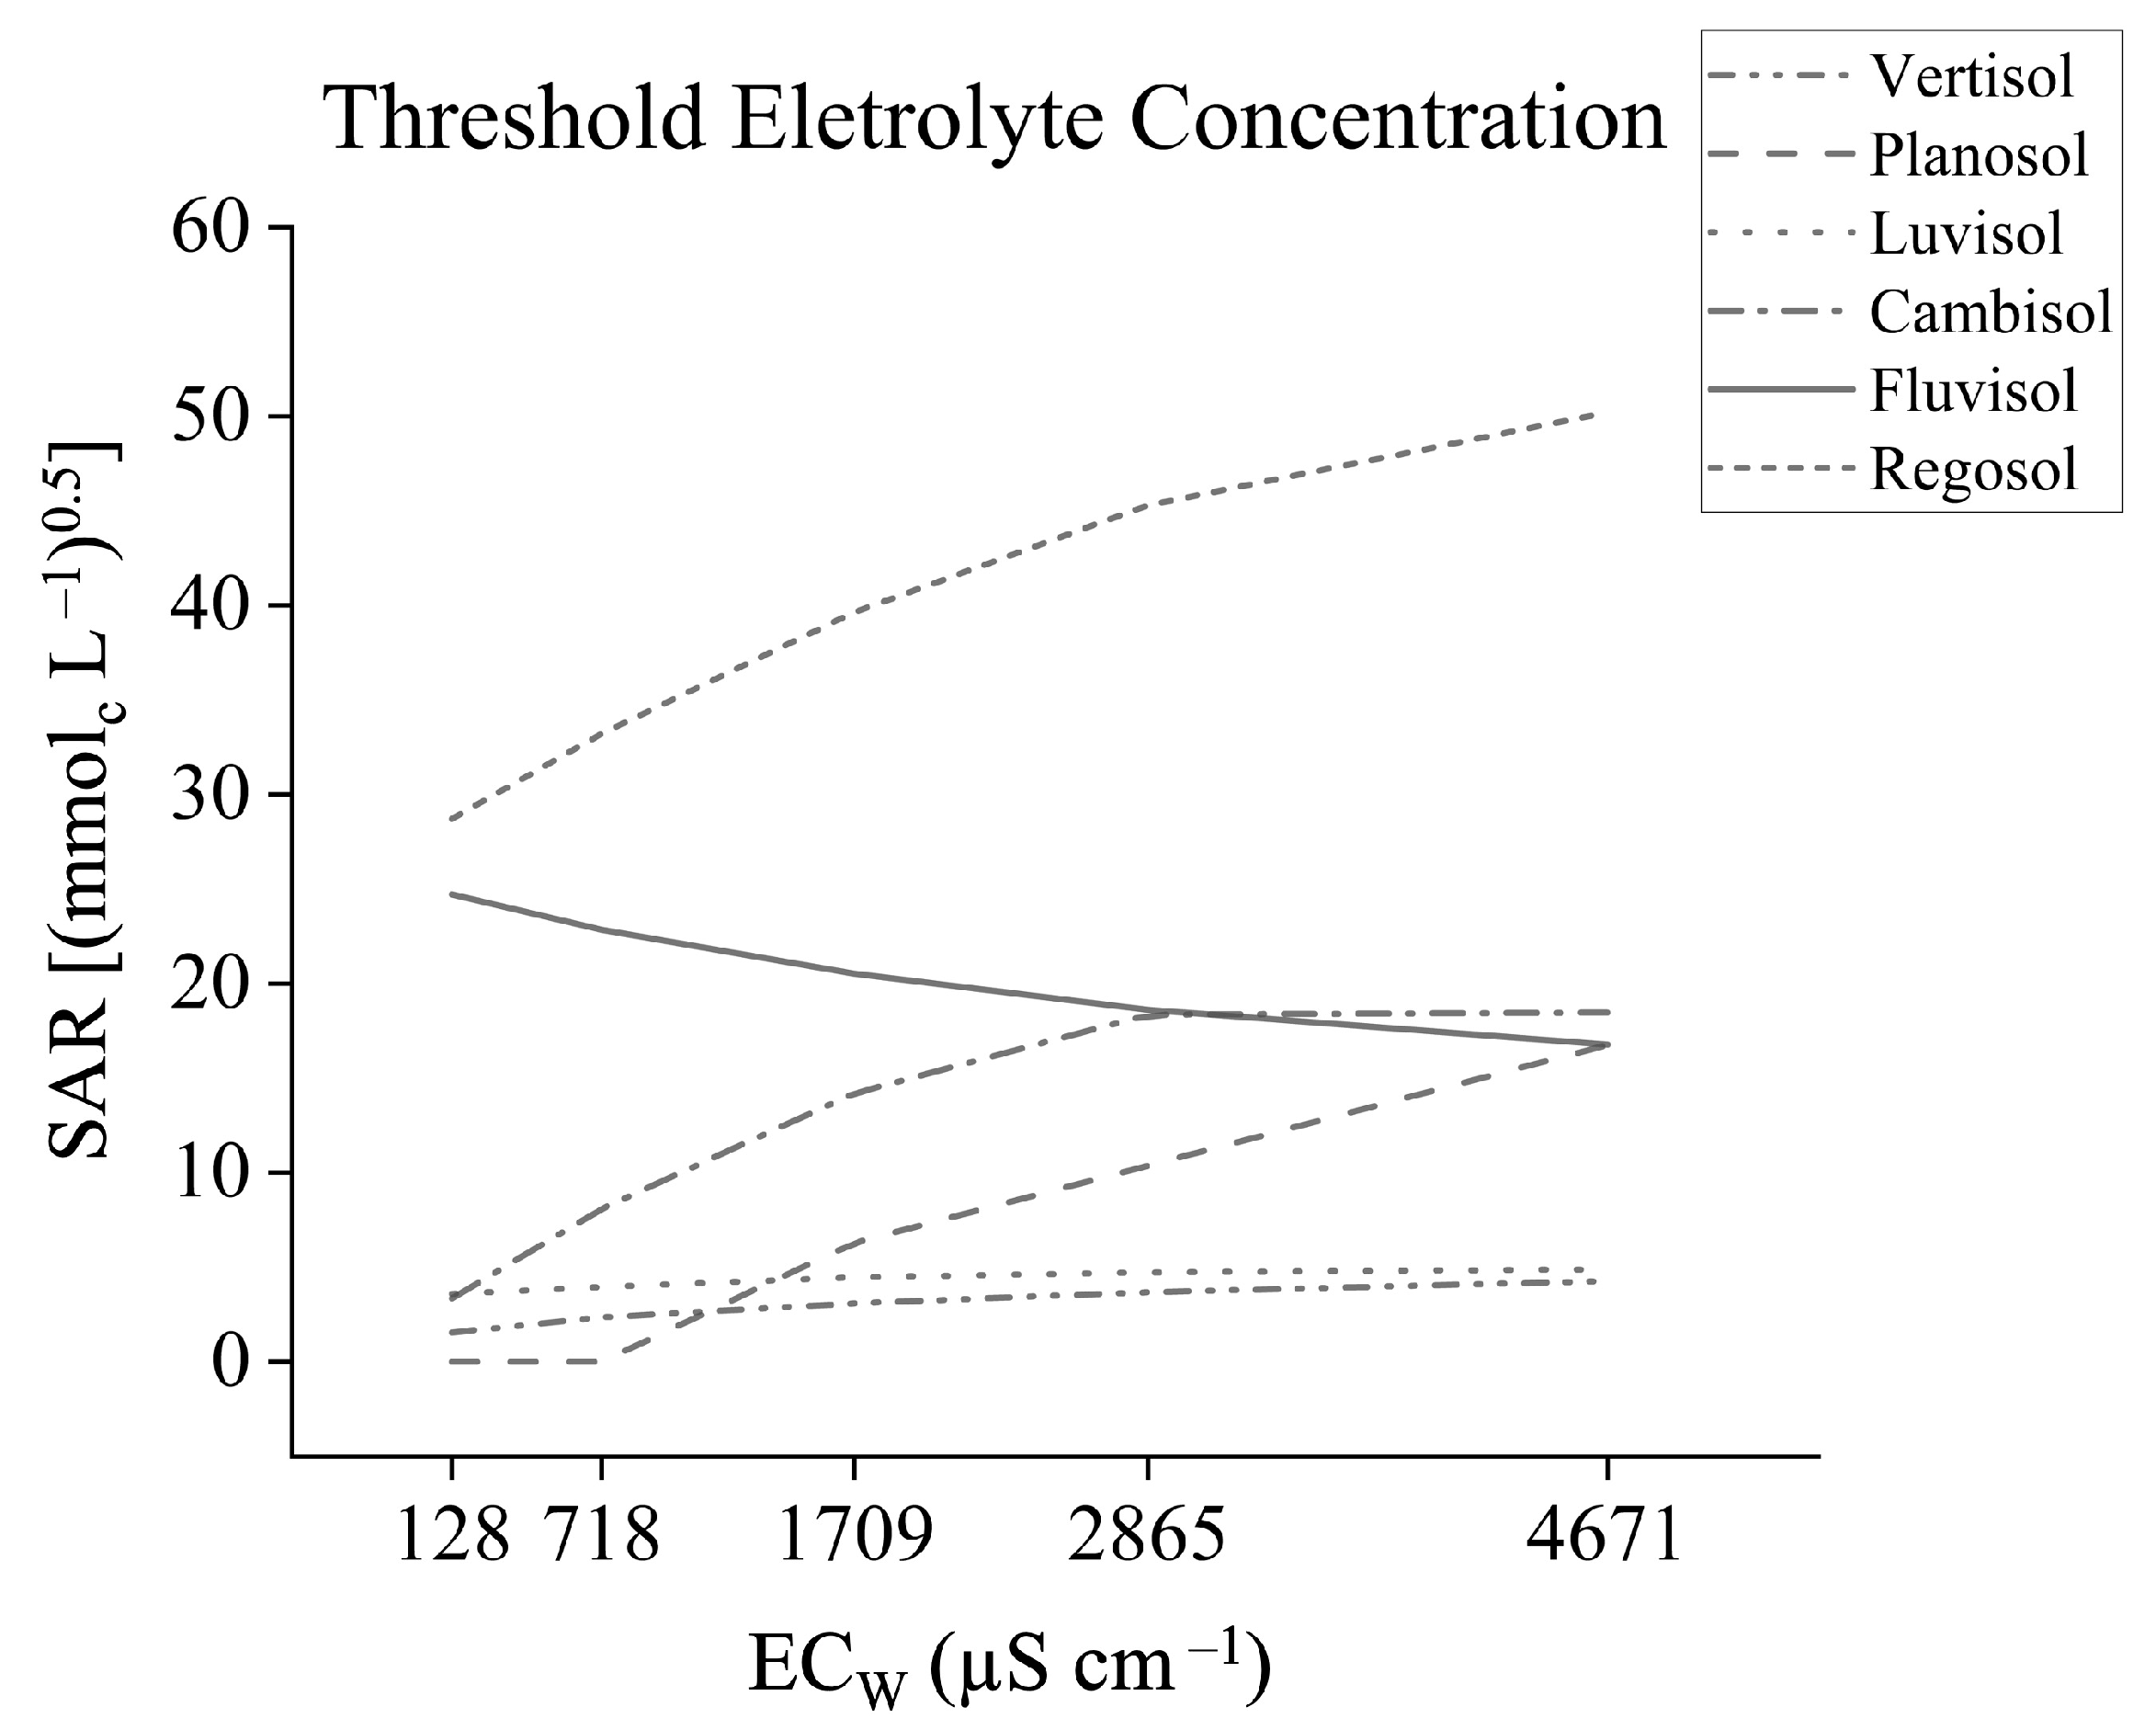
3.2. Threshold Electrolyte Concentration
4. Discussion
4.1. Saturated Hydraulic Conductivity
4.2. Threshold Electrolyte Concentration
5. Conclusions
Supplementary Materials
Author Contributions
Funding
Data Availability Statement
Acknowledgments
Conflicts of Interest
References
- Ezlit, Y.D.; Bennett, L.M.; Raine, S.R.; Smith, R.J. Modification of the McNeal Clay Swelling Model Improves Prediction of Saturated Hydraulic Conductivity as a Function of Applied Water Quality. Soil Sci. Soc. Am. J. 2013, 77, 2149–2156. [Google Scholar] [CrossRef]
- Mohanavelu, A.; Naganna, S.R.; Al-Ansari, N. Irrigation Induced Salinity and Sodicity Hazards on Soil and Groundwater: An Overview of Its Causes, Impacts and Mitigation Strategies. Agriculture 2021, 11, 983. [Google Scholar] [CrossRef]
- Yasin, M.; Muhammed, S.; Mian, S.M. Hydraulic conductivity and ESP of soils affected by sodic water. Pakistan J. Agric. Res. 1989, 10, 289–294. [Google Scholar]
- Singh, A. Soil salinization management for sustainable development: A review. J. Environ. Manag. 2021, 277, 111383. [Google Scholar] [CrossRef] [PubMed]
- Usowicz, B.; Lipiec, J. Spatial variability of saturated hydraulic conductivity and its links with other soil properties at the regional scale. Sci. Rep. 2021, 11, 8293. [Google Scholar] [CrossRef]
- Yao, R.; Yang, J.; Wu, D.; Li, F.; Gao, P.; Wang, X. Evaluation of pedotransfer functions for estimating saturated hydraulic conductivity in coastal salt-affected mud farmland. J. Soils Sediments 2015, 15, 902–916. [Google Scholar] [CrossRef]
- Blanco-Canqui, H.; Wienhold, B.; Jin, V.; Schmer, M.; Kibet, L. Long-term tillage impact on soil hydraulic properties. Soil Till. Res. 2017, 170, 38–42. [Google Scholar] [CrossRef]
- Souza, L.S.; Mafra, A.L.; Souza, L.D.; Silva, I.F.; Klein, V.A. Inter-relação entre manejo e atributos físicos. In Manejo e Conservação do Solo e da água, 1st ed.; Bertol, I., De Maria, I.C., Souza, L.S., Eds.; SBCS: Viçosa, Brazil, 2019; Volume 1, pp. 193–249. [Google Scholar]
- Zhu, Y.; Bennett, J.M.; Marchuk, A. Reduction of hydraulic conductivity and loss of organic carbon in non-dispersive soils of different clay mineralogy is related to magnesium induced disaggregation. Geoderma 2019, 349, 1–10. [Google Scholar] [CrossRef]
- Quirk, J.P. Chemistry of saline soils and their physical properties. In Salinity and Water Use; Part II; Talsma, T., Philip, J.R., Eds.; Palgrave Macmillan: London, UK, 1971; pp. 79–91. [Google Scholar]
- Qadir, M.; Ghafoor, A.; Murtaza, G. Amelioration strategies for saline soils: A review. Land Degrad. Dev. 2000, 11, 501–521. [Google Scholar] [CrossRef]
- Demattê, J.A.M.; Dotto, A.C.; Paiva, A.F.S.; Sato, M.V.; Dalmolin, R.S.D.; Araújo, M.S.B.; Silva, E.B.; Nanni, M.R.; ten Caten, A.; Noronha, N.C.; et al. The Brazilian Soil Spectral Library (BSSL): A general view, application and challenges. Geoderma 2019, 354, 113793. [Google Scholar] [CrossRef]
- Alvares, C.A.; Stape, J.L.; Sentelhas, P.C.; Gonçalves, J.L.M.; Sparovek, G. Köppen’s climate classification map for Brazil. Meteorol. Z. 2013, 22, 711–728. [Google Scholar] [CrossRef] [PubMed]
- Brasil. Centro Nacional de Monitoramento e Alertas de Desastres Naturais. Estudo do CEMADEN e do INPE identifica pela primeira vez a ocorrência de uma região árida no país. Available online: https://www.gov.br/cemaden/pt-br/assuntos/noticias-cemaden/estudo-do-cemaden-e-do-inpe-identifica-pela-primeira-vez-a-ocorrencia-de-uma-regiao-arida-no-pais (accessed on 20 February 2025).
- Santos, H.G.; Jacomine, P.K.T.; Anjos, L.H.C.; Oliveira, V.A.; Lumbreras, J.F.; Coelho, M.R.; de Almeida, J.A.; de Araujo Filho, J.C.; Oliveira, J.B.; Cunha, T.J.F. Brazilian Soil Classification System; Embrapa: Brasília, Brazil, 2018; p. 353. [Google Scholar]
- Souza, J.L.L.; Castro, F.E.; Andadre, C.V.P.A.; Ker, J.C.; Perez Filho, A. Brazilian semiarid soils formed during the last glacial maximum. Catena 2023, 233, 106899. [Google Scholar] [CrossRef]
- Pessoa, L.G.M.; Freire, M.B.G.S.; Wilcox, B.P.; Green, C.H.M.; Araújo, R.J.T.; Araújo Filho, J.C. Spectral reflectance characteristics of soils in northeastern Brazil as influenced by salinity levels. Environ. Monit. Assess. 2016, 188, 616. [Google Scholar] [CrossRef] [PubMed]
- Santos, J.C.B.; Souza Júnior, V.S.; Corrêa, M.M.; Ribeiro, M.R.; Almeida, M.C.; Borges, L.E.P. Caracterização de Neossolos Regolíticos da região semiárida do estado de Pernambuco. Rev. Bras. Cienc. Solo 2012, 36, 683–695. [Google Scholar] [CrossRef]
- Lima, G.K. Caracterização de Vertissolos do Nordeste Brasileiro. Master’s Dissertation, Federal Rural University of Pernambuco, Recife, Brazil, 2014. [Google Scholar]
- Santana, M.B. Caracterização e Classificação de Solos na Ilha de Assunção, Cabrobó–Pernambuco. Ph.D. Dissertation, Federal Rural University of Pernambuco, Recife, Brazil, 2015. [Google Scholar]
- Araújo, J.K.S.; Souza Júnior, V.S.; Marques, F.A.; Voroney, P.; Souza, R.A.S.; Corrêa, M.M.; Câmara, E.R.G. Umbric Ferralsols along a climosequence from the Atlantic coast to the highlands of northeastern Brasil: Characterization and carbon mineralization. Geoderma 2017, 293, 34–43. [Google Scholar] [CrossRef]
- Costa, E.U.C.; Santos, J.C.B.; Azevedo, A.C.; Araújo Filho, J.C.; Corrêa, M.M.; Neves, L.V.M.W.; Vidal-Torrado, P.; Souza-Júnior, V.S. Mineral alteration and genesis of Al–rich soils derived from conglomerate deposits in Cabo Basin, NE Brazil. Catena 2018, 167, 198–211. [Google Scholar] [CrossRef]
- Neves, L.V.M.W.; Santos, J.C.B.; Souza Júnior, V.S.; Corrêa, M.M.; Araújo Filho, J.C. Associations between attributes of Nitisols and the climate of the southern coast of Pernambuco. Rev. Caatinga 2018, 31, 255–263. [Google Scholar] [CrossRef]
- Sousa, J.E.S.; Santos, J.C.B.; Corrêa, M.M.; Nascimento, A.F.; Schulze, S.M.B.B.; Ferreira, T.O.; Araújo Filho, J.C.; Souza Júnior, V.S. Mineralogy and genesis of Planosols under a semi-arid climate, Borborema Plateau, NE Brazil. Catena 2020, 184, 104260. [Google Scholar] [CrossRef]
- Sousa, M.G.; Araujo, J.K.S.; Ferreira, T.O.; Andrade, G.R.P.; Araújo Filho, J.C.; Fracetto, G.G.M.; Santos, J.C.B.; Fracetto, F.J.C.; Lima, G.K.; Souza Junior, V.S. Long-term effects of irrigated agriculture on Luvisol pedogenesis in semi-arid region, northeastern Brazil. Catena 2021, 206, 105529. [Google Scholar] [CrossRef]
- Governo do Estado de Pernambuco. Atlas Eólico e Solar de Pernambuco. Available online: http://www.atlaseolicosolar.pe.gov.br/ (accessed on 20 February 2025).
- IUSS Working Group WRB. World Reference Base for Soil Resources. International Soil Classification System for Naming Soils and Creating Legends for Soil Maps, 4th ed.; International Union of Soil Sciences (IUSS): Vienna, Austria, 2022; p. 236. [Google Scholar]
- Yeomans, J.C.; Bremner, J.M. A rapid and precise method for routine determination of organic carbon in soil. Commun. Soil Sci. Plant Anal. 1988, 19, 1467–1476. [Google Scholar] [CrossRef]
- Teixeira, P.C.; Donagemma, G.K.; Fontana, A.; Teixeira, W.G. Manual de Métodos de Análise de Solo, 3rd ed.; Embrapa: Brasília, Brazil, 2017; p. 574. [Google Scholar]
- Richards, L.A. Diagnosis and Improvement of Saline and Alkali Soils; US Department of Agriculture: Washington DC, USA, 1954; Volume 78, p. 166. [Google Scholar]
- Gee, G.W.; Or, D. Particle Size Analysis. In Methods of Soil Analysis, Part 4, Physical Methods, 1st ed.; Dane, J.H., Topp, G.C., Eds.; Book Series No. 5; Soils Science Society of America: Madison, WI, USA, 2002; pp. 255–293. [Google Scholar]
- International Organization for Standardization (ISO). Soil Quality-Determination of Dry Bulk Density; International Organization for Standardization: Geneva, Switzerland, 2017. [Google Scholar]
- Flint, A.L.; Flint, L.E. Particle density. In Methods of Soil Analysis, Part 4, Physical Methods, 1st ed.; Dane, J.H., Topp, G.C., Eds.; Book Series, 5; Soils Science Society of America: Madison, WI, USA, 2002; pp. 255–293. [Google Scholar]
- Kiehl, E.J. Manual de Edafologia: Relações Solo-Planta; Agronômica Ceres: São Paulo, Brazil, 1979; p. 263. [Google Scholar]
- Mehra, O.P.; Jackson, M.L. Iron oxide removal from soils and clays by a dithionite-citrate system buffered with sodium bicarbonate. Clays Clay Miner. 1958, 7, 317–327. [Google Scholar] [CrossRef]
- Jackson, M.L. Soil chemical analysis: Advanced Course: A Manual of Methods Useful for Instruction and Research in Soil Chemistry, Physical Chemistry of Soils, Soil Fertility, and Soil Genesis; Madison Libraries: Madison, WI, USA, 1975; p. 930. [Google Scholar]
- Brown, G.; Brindley, G.W. X-ray Diffraction Procedures for clay mineral identification. In Crystal Structures of Clays Minerals and Their X-ray Identification, 1st ed.; Brindley, G.W., Brown, G., Eds.; Mineralogical Society: London, UK, 1980; pp. 305–356. [Google Scholar]
- Moore, D.M.; Reynolds, R.C. X-Ray Diffraction and Identification and Analysis of CLAY Minerals; Oxford University Press: Oxford, UK, 1989; p. 332. [Google Scholar]
- Freire, M.B.G.S.; Ruiz, H.A.; Ribeiro, M.R.; Ferreira, P.A.; Alvarez, V.H.; Freire, F.J. Condutividade hidráulica de solos de Pernambuco em resposta à condutividade elétrica e RAS da água de irrigação. Rev. Bras. Eng. Agric. Ambient. 2003, 7, 45–52. [Google Scholar] [CrossRef]
- Klute, A. Laboratory measurement of hydraulic conductivity of saturated soil. In Methods of Soil Analysis, Part 1, 1st ed.; Black, C.A., Ed.; American Society of Agronomy: Madison, WI, USA, 1965; pp. 210–221. [Google Scholar]
- Parks, G. The isoelectric points of solid oxides, solid hydroxides, and aqueous hydroxo complex systems. Chem. Rev. 1965, 65, 177–198. [Google Scholar] [CrossRef]
- Kosmulski, M. Isoelectric points and points of zero charge of metal (hydr)oxides: 50 years after Parks’ review. Adv. Colloid Interface Sci. 2016, 238, 1–61. [Google Scholar] [CrossRef] [PubMed]
- Appel, C.; Ma, L.Q.; Rhue, R.D.; Kennelley, E. Point of zero charge determination in soils and minerals via traditional methods and detection of electroacoustic mobility. Geoderma 2003, 113, 77–93. [Google Scholar] [CrossRef]
- Parks, G.A.; Bruyn, P.L. The zero point of charge of oxides. J. Phys. Chem. 1962, 66, 967–973. [Google Scholar] [CrossRef]
- Schofield, R.K.; Samson, H.R. Flocculation of kaolinite due to the attraction of oppositely charged crystal faces. Disc. Faraday Soc. 1954, 18, 135–145. [Google Scholar] [CrossRef]
- Rand, B.; Melton, I. Isoelectric point of the edge surface of kaolinite. Nature 1975, 257, 214–216. [Google Scholar] [CrossRef]
- Churchman, G.J.; Skjemstad, J.O.; Oades, J.M. Influence of clay minerals and organic matter on effects of sodicity on soils. Aust. J. Soil Res. 1993, 31, 779–800. [Google Scholar] [CrossRef]
- Mbey, J.A.; Thomas, F.; Razafitianamaharavo, A.; Caillet, C.; Villiéras, F. A comparative study of some kaolinites surface properties. Appl. Clay Sci. 2019, 172, 135–145. [Google Scholar] [CrossRef]
- Ottoni, M.V.; Teixeira, W.G.; Reis, A.M.H.; Pimentel, L.G.; Souza, L.R.; Albuquerque, J.A.; Melo, V.F.; Cavalieri-Polizeli, K.M.V.; Reichert, J.M.; Viana, J.H.M.; et al. Saturated hydraulic conductivity and steady-state infiltration rate database for Brazilian soils. Rev. Bras. Cienc. Solo. 2025, 49, e0240003. [Google Scholar] [CrossRef]
- Rosin, N.A.; Demattê, J.A.M.; Poppiel, R.R.; Silvero, N.E.Q.; Rodriguez-Albarracin, H.S.; Rosas, J.T.F.; Greschuk, L.T.; Bellinaso, H.; Minasny, B.; Gomez, C.; et al. Mapping Brazilian soil mineralogy using proximal and remote sensing data. Geoderma 2023, 432, 116413. [Google Scholar] [CrossRef]
- Pedron, F.A.; Deobald, G.A.; Gubiani, P.I.; Santos, L.A.C.; Azevedo, A.C.; Reichert, J.M.; Dambroz, A.P.B. Soil hydraulic properties, mineralogical alteration and pore formation in Regosols from southern Brazil. Rev. Bras. Cienc. Solo. 2024, 48, e0240013. [Google Scholar] [CrossRef]
- Thomas, F.; Michot, L.J.; Vantelon, D.; Montargès, E.; Prélot, B.; Cruchaudet, M.; Delon, J.F. Layer charge and electrophoretic mobility of smectites. Colloids Surf. A Physicochem. Eng. Asp. 1999, 159, 351–358. [Google Scholar] [CrossRef]
- Morris, G.E.; Zbik, M.S. Smectite suspension structural behaviour. Int. J. Miner. Process 2009, 93, 20–25. [Google Scholar] [CrossRef]
- Kaufhold, S.; Dohrmann, R. The variable charge of dioctahedral smectites. J. Colloid Interface Sci. 2013, 390, 225–233. [Google Scholar] [CrossRef]
- Jing, Y.; Ding, W.; Liu, X. Saturated hydraulic conductivities in saline-alkali soil dependent on electrostatic repulsion between particles considering polarization effects. J. Soils Sediments 2025, 1–11. [Google Scholar] [CrossRef]
- Fetzer, J.; Holzner, M.; Plötzer, M.; Furrer, G. Clogging of an Alpine streambed by silt-sized particles e Insights from laboratory and field experiments. Water Res. 2017, 126, 60–69. [Google Scholar] [CrossRef]
- Hussain, N.; Hassan, G.; Arshadullah, M.; Mujeeb, F. Evaluation of Amendments for the Improvement of Physical Properties of Sodic Soil. Int. J. Agric. Biol. 2001, 3, 319–322. [Google Scholar]
- Vasconcelos, R.R.A.; Barros, M.F.C.; Silva, E.F.F.; Graciano, E.S.A.; Fontenele, A.J.P.B.; Silva, N.M.L. Características físicas de solos salino-sódicos do semiárido pernambucano em função de diferentes níveis de gesso. Rev. Bras. Eng. Agric. Ambient. 2013, 17, 1318–1325. [Google Scholar] [CrossRef]
- Arora, N.K.; Chaudhari, S.K.; Yadav, R.K.; Sharma, P.C. Saturated hydraulic conductivity, dispersion index and water retention changes in salt affected soils under different quality water irrigation. J. Soil Salin. Water Qual. 2019, 11, 1–9. [Google Scholar]
- Cucci, G.; Lacolla, G.; Rubino, P. Irrigation with saline-sodic water: Effects on soil chemical-physical properties. Afr. J. Agric. Res. 2013, 8, 358–365. [Google Scholar] [CrossRef]
- Yan, S.; Zhang, T.; Zhang, B.; Feng, H. A revised saline water quality assessment method considering including Mg2+/Na+ as a new indicator for an arid irrigated area. J. Hydrol. 2024, 639, 131619. [Google Scholar] [CrossRef]
- Chaudhari, S.K. Saturated hydraulic conductivity, dispersion, swelling, and exchangeable sodium percentage of different textured soils as influenced by water quality. Commun. Soil Sci. Plant Anal. 2001, 32, 2439–2455. [Google Scholar] [CrossRef]
- Menezes, H.R.; Almeida, B.G.; Almeida, C.D.G.C.; Bennett, J.M.; Silva, E.M.; Freire, M.B.G.S. Use of threshold electrolyte concentration analysis to determine salinity and sodicity limit of irrigation water. Rev. Bras. Eng. Agric. Ambient. 2014, 18, 53–58. [Google Scholar] [CrossRef]
- Ali, A.; Biggs, A.J.W.; Marchuk, A.; Bennett, J.M. Effect of irrigation water pH on saturated hydraulic conductivity and electrokinetic properties of acidic, neutral, and alkaline soils. Soil Sci. Soc. Am. J. 2019, 83, 1671–1681. [Google Scholar] [CrossRef]
- Bennett, J.M.; Marchuk, A.; Marchuk, S.; Raine, S.R. Towards predicting the soil-specific threshold electrolyte concentration of soil as a reduction in saturated hydraulic conductivity: The role of clay net negative charge. Geoderma 2019, 337, 122–131. [Google Scholar] [CrossRef]
- Adeyemo, T.; Kramer, I.; Levy, G.J.; Mau, Y. Salinity and sodicity can cause hystereses in soil hydraulic conductivity. Geoderma 2022, 413, 115765. [Google Scholar] [CrossRef]
- Centeno, L.N.; Timm, L.C.; Reichardt, K.; Beskow, S.; Caldeira, T.L.; Oliveira, L.M.; Wendroth, O. Identifying regionalized co-variate driving factors to assess spatial distributions of saturated soil hydraulic conductivity using multivariate and state-space analyses. Catena 2020, 191, 104583. [Google Scholar] [CrossRef]
- Lins, C.M.T.; Souza, E.R.; Souza, T.E.M.S.; Paulino, M.K.S.S.; Monteiro, D.R.; Souza Júnior, V.S.; Dourado, P.R.M.; Rego Junior, F.E.A.; Silva, Y.J.A.; Schaffer, B. Influence of vegetation cover and rainfall intensity on soil attributes in an area undergoing desertification in Brazil. Catena 2023, 221, 106751. [Google Scholar] [CrossRef]
- Khataar, M.; Mosaddeghi, M.R.; ·Chayjan, R.A.; Mahboubi, A.A. Prediction of water quality effect on saturated hydraulic conductivity of soil by artificial neural networks. Paddy Water Environ. 2018, 16, 631–641. [Google Scholar] [CrossRef]
- Pessoa, L.G.M.; Freire, M.B.G.S.; Santos, R.L.; Freire, F.J.; Miranda, M.F.A.; Santos, P.R. Saline water irrigation in semiarid region: I—effects on soil chemical properties. Aust. J. Croup Sci. 2019, 13, 1169–1176. [Google Scholar] [CrossRef]
- Quirk, J.P.; Schofield, R.K. The effect of electrolyte concentration on soil permeability. Aust. J. Soil Res. 1955, 6, 163–178. [Google Scholar] [CrossRef]
- Dang, A.; Bennett, J.M.; Marchuk, A.; Biggs, A.; Raine, R.S. Quantifying the aggregation-dispersion boundary condition in terms of saturated hydraulic conductivity reduction and the threshold electrolyte concentration. Agric. Water Manag. 2018, 203, 172–178. [Google Scholar] [CrossRef]
- Rengasamy, P. Importance of calcium in irrigation with saline-sodic water—A viewpoint. Agric. Water Manag. 1987, 12, 207–219. [Google Scholar] [CrossRef]
- Hasnain, M.; Abideen, Z.; Ali, F.; Hasanuzzaman, M.; El-Keblawy, A. Potential of Halophytes as Sustainable Fodder Production by Using Saline Resources: A Review of Current Knowledge and Future Directions. Agronomy 2023, 12, 2150. [Google Scholar] [CrossRef]


| Soil Classification WRB | Depth 1 (cm) | Climate | Geographic Coordinates |
|---|---|---|---|
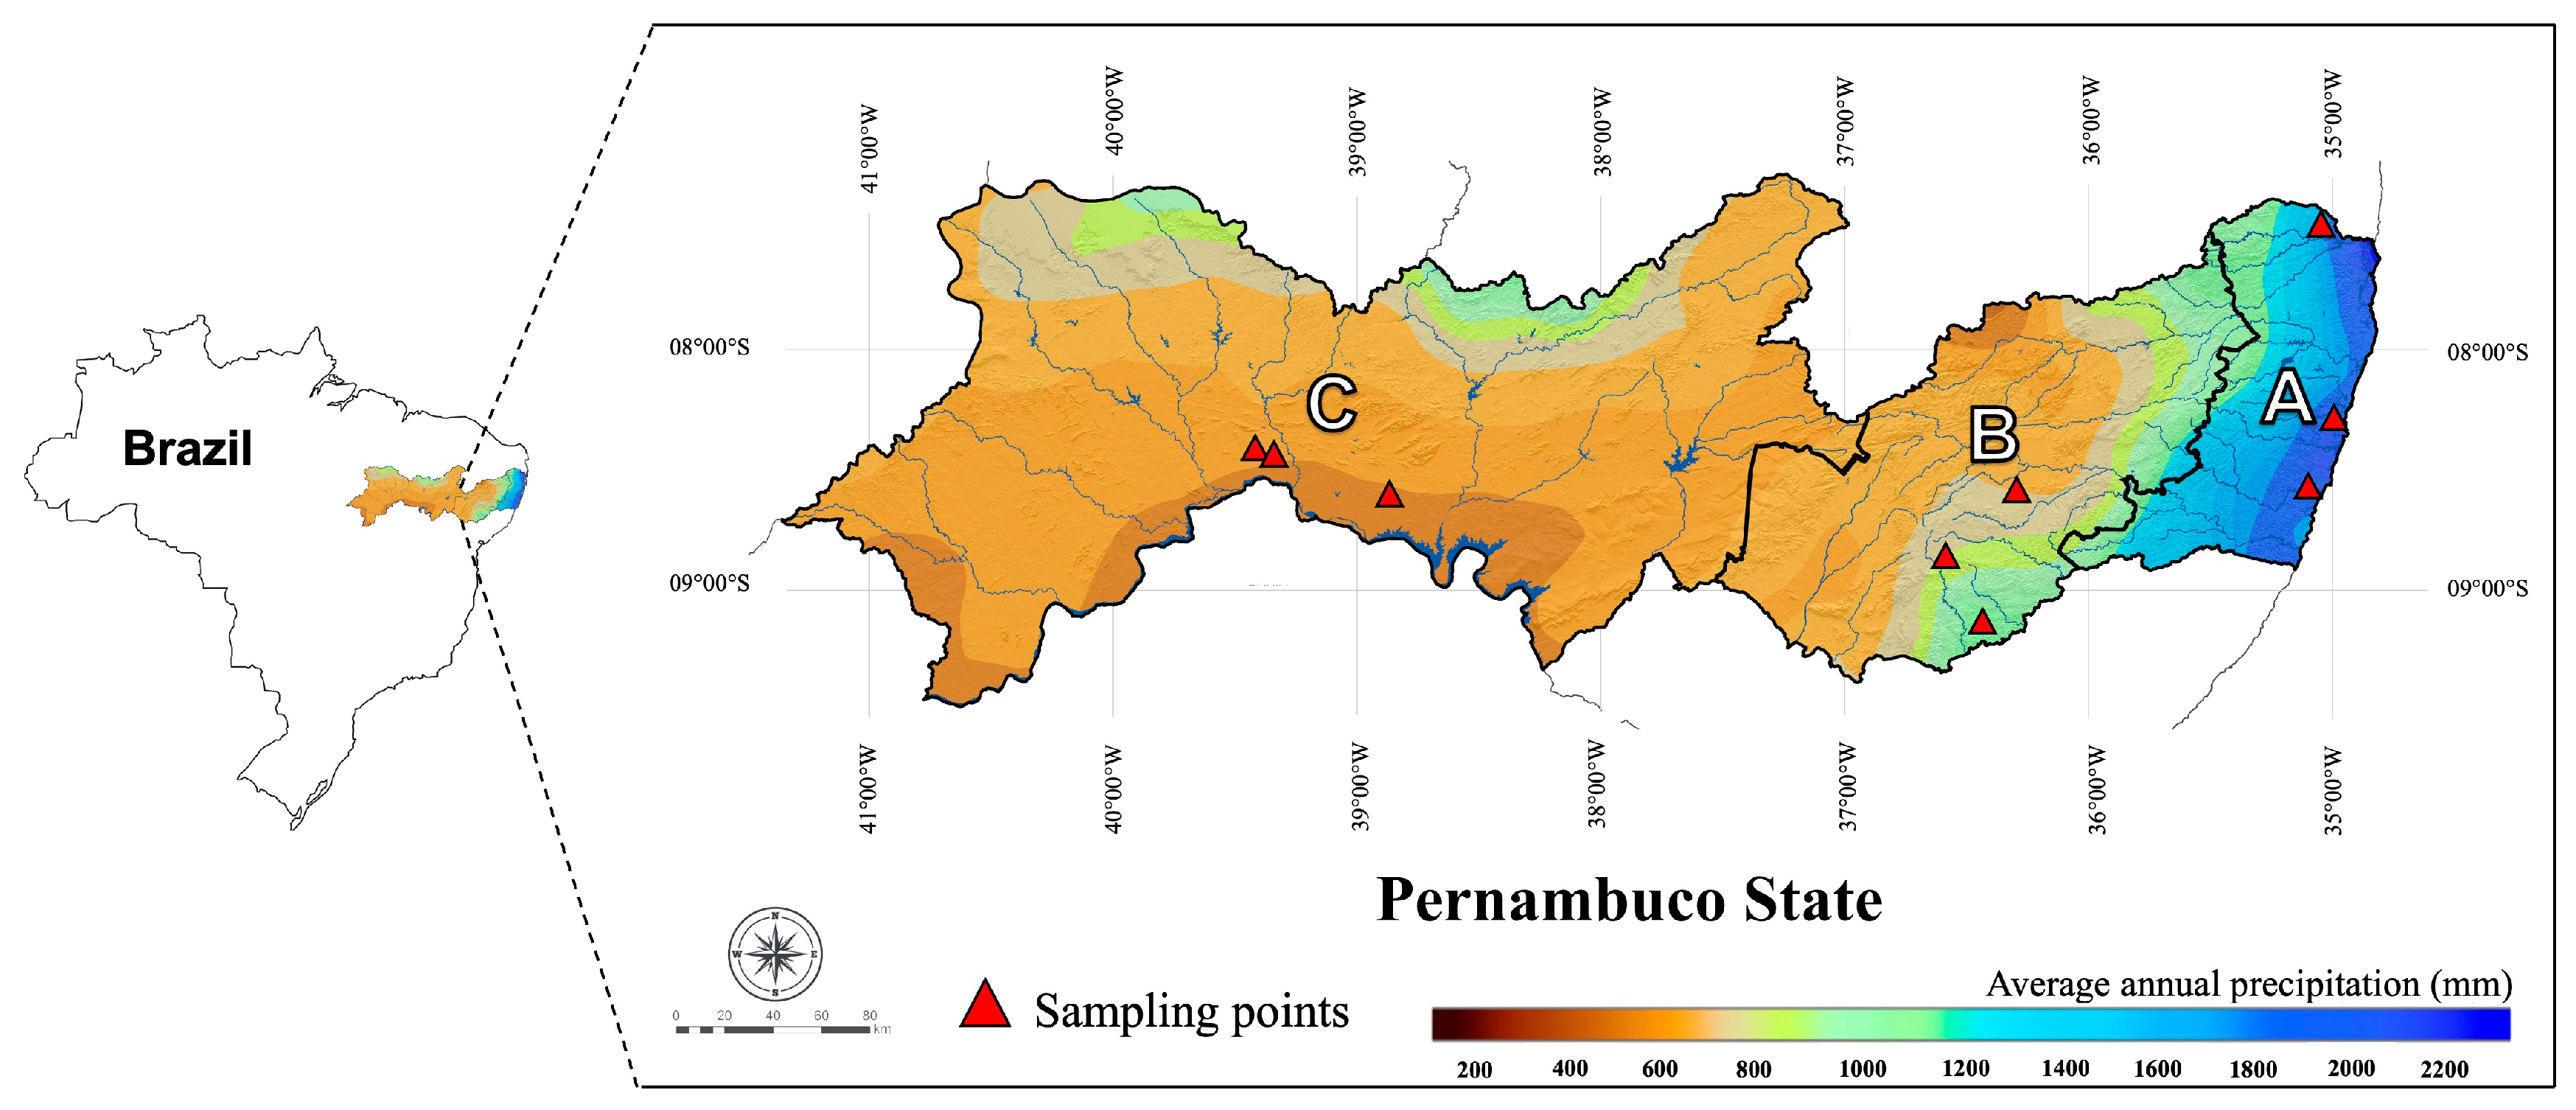
| Umbric Ferralsol | 155–200 | Tropical—humid/hot | 7°25′23.2″ S 35°10′51.5″ W |
| Ferralic Nitisol | 50–90 | Tropical—humid/hot | 8°35′30″ S 35°6′59″ W |
| Haplic Lixisol | 50–70 | Tropical—humid/hot | 8°18′′0″ S 35°01′26″ W |
| Eutric Regosol | 0–20 | Tropical—sub-humid/hot | 8°29′50″ S 36°14′28″ W |
| Pellic Vertisol | 20–68 | Tropical—sub-humid/hot | 08°29′53″ S 36°14′25″ W |
| Albic Planosol | 80–110 | Tropical—sub-humid/hot | 9°8′29.8″ S 36°28′38,8″ W |
| Chromic Luvisol | 20–40 | Semiarid | 8°44′26.1″ S 38°51′29.9″ W |
| Fluvic Cambisol | 26–66 | Semiarid | 8°30′45″ S 39°22′59″ W |
| Eutric Fluvisol | 0–20 | Semiarid | 8°30′56″ S 39°23′06″ W |
| Soluble Cations | ||||||
|---|---|---|---|---|---|---|
| Soil | ECe | Ca2+ | Mg2+ | Na+ | K+ | SAR |
| dS m−1 | mmolc L−1 | (mmolc L−1)0.5 | ||||
| Umbric Ferralsol | 0.25 | 0.37 | 0.67 | 1.46 | 0.04 | 2.02 |
| Ferralic Nitisol | 0.22 | 0.26 | 0.28 | 1.01 | 0.08 | 1.93 |
| Haplic Lixisol | 0.17 | 0.30 | 0.09 | 0.94 | 0.05 | 2.14 |
| Eutric Regosol | 0.42 | 0.73 | 0.34 | 0.92 | 0.40 | 1.26 |
| Pellic Vertisol | 1.00 | 1.23 | 1.83 | 6.71 | 0.12 | 5.42 |
| Albic Planosol | 3.72 | 2.77 | 5.28 | 33.43 | 0.27 | 16.66 |
| Chromic Luvisol | 0.67 | 2.38 | 1.85 | 3.21 | 0.03 | 2.21 |
| Fluvic Cambisol | 22.35 | 70.89 | 62.21 | 196.20 | 0.25 | 24.05 |
| Eutric Fluvisol | 2.79 | 17.09 | 5.08 | 2.10 | 3.04 | 0.63 |
| Soil | pH | ΔpH 2 | Ca2+ | Mg2+ | Na+ | K+ | Al3+ | H+Al | CEC | AI | BS | AlS | ESP | TOC | |
|---|---|---|---|---|---|---|---|---|---|---|---|---|---|---|---|
| Water 1 | KCl | cmolc kg−1 | % | g kg−1 | |||||||||||
| Umbric Ferralsol | 4.65 | 4.00 | −0.65 | 1.15 | 0.52 | 0.07 | 0.07 | 1.46 | 4.50 | 6.31 | 8.82 | 28.68 | 44.64 | 1.09 | 4.45 |
| Ferralic Nitisol | 4.73 | 3.95 | −0.78 | 2.00 | 0.46 | 0.04 | 0.12 | 4.99 | 8.79 | 11.41 | 23.69 | 22.96 | 65.57 | 0.34 | 6.15 |
| Haplic Lixisol | 4.83 | 3.87 | −0.96 | 0.58 | 0.32 | 0.13 | 0.18 | 12.02 | 16.30 | 17.50 | 35.23 | 6.91 | 90.85 | 0.80 | 7.83 |
| Eutric Regosol | 5.82 | 5.05 | −0.77 | 1.22 | 0.35 | 0.00 | 0.10 | 0.00 | 0.72 | 2.39 | N/A3 | 69.87 | 0.00 | 0.00 | 5.39 |
| Pellic Vertisol | 8.78 | 6.49 | −2.28 | 18.08 | 12.42 | 1.12 | 0.44 | 0.00 | 0.00 | 32.06 | 75.44 | 100 | 0.00 | 3.48 | 5.09 |
| Albic Planosol | 6.79 | 5.14 | −1.65 | 5.55 | 8.86 | 2.21 | 0.47 | 0.00 | 1.12 | 18.21 | 43.71 | 93.85 | 0.00 | 12.15 | 2.63 |
| Chromic Luvisol | 7.00 | 5.56 | −1.44 | 10.46 | 6.70 | 0.18 | 0.20 | 0.00 | 1.06 | 18.60 | 61.75 | 94.30 | 0.00 | 0.97 | 5.28 |
| Fluvic Cambisol | 6.07 | 5.53 | −0.53 | 5.08 | 2.82 | 1.33 | 0.14 | 0.00 | 0.60 | 9.97 | 43.19 | 93.98 | 0.00 | 13.31 | 2.58 |
| Eutric Fluvisol | 7.39 | 6.99 | −0.40 | 8.82 | 1.79 | 0.05 | 0.84 | 0.00 | 0.43 | 11.93 | N/A3 | 96.40 | 0.00 | 0.42 | 16.23 |
| Soil | Sand | Silt | Clay | FI | SBD | SPD | TP | Texture | Mineralogical Assembly 1 | |
|---|---|---|---|---|---|---|---|---|---|---|
| Coarse | Fine | |||||||||
| g kg−1 | % | g cm−3 | % | |||||||
| Umbric Ferralsol | 124.40 | 67.78 | 92.21 | 715.60 | 100 | 1.45 | 2.68 | 52.30 | Clay | K, Gh |
| Ferralic Nitisol | 247.01 | 89.60 | 162.73 | 481.53 | 100 | 1.33 | 2.85 | 56.37 | Clay | K, Hm, Gh |
| Haplic Lixisol | 191.24 | 110.04 | 202.95 | 496.68 | 100 | 1.32 | 2.75 | 59.10 | Clay | HIS, K, Gh |
| Eutric Regosol | 697.72 | 179.12 | 94.94 | 28.22 | 29 | 1.67 | 2.76 | ND 2 | Loamy Clay | I, K, Fd |
| Pellic Vertisol | 181.35 | 127.76 | 266.13 | 424.98 | 95 | 1.65 | 2.69 | ND 2 | Clay | S, Tc |
| Albic Planosol | 365.67 | 127.76 | 89.98 | 416.59 | 22 | 1.71 | 2.68 | 43.20 | Clay | S, I, K |
| Chromic Luvisol | 278.50 | 293.00 | 127.26 | 301.23 | 63 | 1.95 | 2.87 | 45.97 | Sandy Clay Loam | S, I, K, Gh, Hm |
| Fluvic Cambisol | 73.53 | 348.41 | 347.24 | 230.82 | 93 | 1.67 | 2.71 | 41.22 | Loam | S, I, K |
| Eutric Fluvisol | 50.15 | 531.10 | 298.77 | 119.97 | 68 | 1.31 | 2.55 | 56.39 | Sandy Loam | S, I, K |
| Soil | Horizon | Fed | Feo | Feo/Fed |
|---|---|---|---|---|
| g kg−1 | ||||
| Umbric Ferralsol | Bw | 26.69 | 0.36 | 0.01 |
| Ferralic Nitisol | Bt1 | 122.77 | 2.46 | 0.02 |
| Haplic Lixisol | Bt | 8.40 | 2.79 | 0.33 |
| Eutric Regosol | A | 0.83 | 0.24 | 0.29 |
| Pellic Vertisol | Biv | 6.14 | 1.36 | 0.22 |
| Albic Planosol | Btg | 10.76 | 1.18 | 0.11 |
| Chromic Luvisol | Btvnz | 25.22 | 1.76 | 0.07 |
| Fluvic Cambisol | Binz1 | 20.56 | 2.24 | 0.11 |
| Eutric Fluvisol | Ap | 7.44 | 1.37 | 0.18 |
| Soil | Equation | R 2 | CV 1 |
|---|---|---|---|
| Umbric Ferralsol | sat = 2.7459 | - | 25.03 |
| Ferralic Nitisol | sat = 6.0558 | - | 29.20 |
| Haplic Lixisol | sat = 3.3313 | - | 15.982 |
| Eutric Regosol | sat = 6.03167 + 0.0017991 ** EC − 0.000000160069EC 2,° − 0.0435899SAR ** | 0.7209 | 20.61 |
| Pellic Vertisol | sat = 0.372869 + 0.000358036 *** EC − 0.0487104 *** SAR + 0.00152272 *** SAR 2 − 0.0000114532 *** EC SAR | 0.9231 | 11.762 |
| Albic Planosol | sat = −0.0181408 + 0.0000662413 *** CE – 0.00561443 ° RAS + 0.000229691 * RAS 2 – 0.00000204295 *** EC SAR | 0.7815 | 4.502 |
| Chromic Luvisol | sat = 0.969163 + 0.000571572 *** EC − 0.0000000694489 ** EC 2 − 0.0609834 *** SAR + 0.0014585 *** SAR 2 − 0.000017605 * CE SAR + 0.00000000225938 ° EC 2 SAR | 0.9332 | 28.44 |
| Fluvic Cambisol | sat = 0.02733608 + 0.000111962 *** EC − 0.0000000147655 *** EC 2 − 0.0024721 *** SAR | 0.9306 | 25.66 |
| Eutric Fluvisol | sat = 2.44341 + 0.000192643 *** EC − 0.0193937 *** SAR − 0.00000446051 ** EC SAR | 0.8964 | 9.41 |
Disclaimer/Publisher’s Note: The statements, opinions and data contained in all publications are solely those of the individual author(s) and contributor(s) and not of MDPI and/or the editor(s). MDPI and/or the editor(s) disclaim responsibility for any injury to people or property resulting from any ideas, methods, instructions or products referred to in the content. |
© 2025 by the authors. Licensee MDPI, Basel, Switzerland. This article is an open access article distributed under the terms and conditions of the Creative Commons Attribution (CC BY) license (https://creativecommons.org/licenses/by/4.0/).
Share and Cite
Vieira, C.B.; Silva, G.H.M.C.; Almeida, B.G.d.; Pessoa, L.G.M.; Freire, F.J.; de Souza Junior, V.S.; Melo, H.F.d.; Lima, L.G.G.d.; Paiva, R.F.d.N.; Ferreira, J.F.d.S.; et al. Saturated Hydraulic Conductivity of Nine Soils According to Water Quality, Soil Texture, and Clay Mineralogy. Agronomy 2025, 15, 864. https://doi.org/10.3390/agronomy15040864
Vieira CB, Silva GHMC, Almeida BGd, Pessoa LGM, Freire FJ, de Souza Junior VS, Melo HFd, Lima LGGd, Paiva RFdN, Ferreira JFdS, et al. Saturated Hydraulic Conductivity of Nine Soils According to Water Quality, Soil Texture, and Clay Mineralogy. Agronomy. 2025; 15(4):864. https://doi.org/10.3390/agronomy15040864
Chicago/Turabian StyleVieira, Clarissa Buarque, Gabriel Henrique Maximo Clarindo Silva, Brivaldo Gomes de Almeida, Luiz Guilherme Medeiros Pessoa, Fernando José Freire, Valdomiro Severino de Souza Junior, Hidelblandi Farias de Melo, Luara Gabriella Gomes de Lima, Rodrigo Francisco do Nascimento Paiva, Jorge Freire da Silva Ferreira, and et al. 2025. "Saturated Hydraulic Conductivity of Nine Soils According to Water Quality, Soil Texture, and Clay Mineralogy" Agronomy 15, no. 4: 864. https://doi.org/10.3390/agronomy15040864
APA StyleVieira, C. B., Silva, G. H. M. C., Almeida, B. G. d., Pessoa, L. G. M., Freire, F. J., de Souza Junior, V. S., Melo, H. F. d., Lima, L. G. G. d., Paiva, R. F. d. N., Ferreira, J. F. d. S., & Freire, M. B. G. d. S. (2025). Saturated Hydraulic Conductivity of Nine Soils According to Water Quality, Soil Texture, and Clay Mineralogy. Agronomy, 15(4), 864. https://doi.org/10.3390/agronomy15040864