Abstract
Crop rotation and microbial driving force significantly influence soil phosphorus (P) bioavailability and crop yield. However, differences in underlying microbial mechanisms in rotations remain unclear. We examined rice yield, P uptake, soil and microbial P contents, enzyme activity, and P functional genes over six years (2016–2022) to elucidate microbial mechanisms driving rice yield in rice–wheat (RW) and rice–oilseed rape (RO) rotations. RO significantly increased rice yield and plant P uptake by 9.17% and 20.70%, respectively, compared to RW. Soil total (TP) and available (AP) P contents were significantly lower (4.83% and 18.31%, respectively) under RO than RW, whereas microbial biomass phosphorus (MBP) and acid phosphatase activity (EP) were greater (39.40% and 128.45%, respectively). PICRUSt2 results revealed that RO increased phoA phoB (alkaline phosphatase), phnX (phosphonoacetaldehyde hydrolase [EC:3.11.1.1]), gcd (Quinoprotein glucose dehydrogenase [EC:1.1.5.2]), and ppaC (manganese-dependent inorganic pyrophosphatase) and decreased phnD (phosphonate transport system substrate-binding protein), ugpE (sn-glycerol 3-phosphate transport system permease protein), ugpA (sn-glycerol 3-phosphate transport system permease protein), and phnO ((aminoalkyl)phosphonate N-acetyltransferase [EC:2.3.1.280]) abundance. Random forest analysis showed that ppaC, phnD, gcd, and phnX were important for rice yield and plant P uptake. Partial least squares analysis revealed that RO indirectly increased rice yield by influencing MBP and affecting plant P uptake through P functional genes. Overall, RO improves rice yield and P bioavailability by altering P functional genes (ppaC, phnD, gcd, and phnX), providing new perspectives on crop–microorganism interactions and resource use efficiency.
1. Introduction
Diversification of agricultural crops can increase rice production [1]. Crop rotation, as an important diversification method, enhances soil health and food production [2]. Rice is an important crop that facilitates food security worldwide [3], and a substantial potential for increasing rice production exists [4]. Rice–oilseed rape (RO) and rice–wheat (RW) rotations are the most common paddy–upland rotations worldwide [5], especially in Southeast Asia. During the rotation cycle, oilseed rape can improve soil fertility and benefit subsequent crops [6,7], and many studies have shown that rice yield is greater under an RO rotation than under an RW rotation [8,9]. However, the research to determine why RO rotations promote crop yield is limited, and the mechanisms underlying yield enhancement remain unclear.
In paddy–upland cropping systems such as the RO and RW rotation systems, phosphorus (P) availability is reduced due to alternating wetting and drying cycles [10]. In southeastern China, owing to the alternating dry and wet conditions, the forms of iron and aluminium ions present in the soil change, and soil P is fixed via iron and aluminium oxides/hydroxides [11]. Soil pH is a key factor controlling P availability, as it influences the solubility of phosphate compounds and their interactions with soil minerals [12,13]. Rice yield depends significantly on soil P availability, and rice yield decreases with increasing soil P deficiency [14]. P is a major nutrient limiting crop production in paddy–upland cropping systems [15,16]. However, few studies on improving soil P availability have focused on comparing different paddy–upland cropping systems. RO rotation involves crop rotations of Gramineae and cruciferous crops. RW rotation involves crop rotations of Gramineae crops. RO rotation not only increases the abundance of microbial populations related to inorganic P solubilization [17] but also increases the abundance of root-secreted organic acids, which reduces the soil pH and increases the amount of available P in the soil [18]. Genotypic differences in root morphology and P uptake between Gramineae and cruciferous crops may cause variations in soil P availability [19,20]. However, the different mechanisms affecting soil P availability in RO and RW rotations remain unclear.
Soil microorganisms play important roles in determining soil P availability and plant P uptake [21,22,23]. Crop rotation affects soil microbial biomass and soil enzyme activity [17,24] and alters the soil microbial community and P cycling functional genes [25]. Microbial biomass P (MBP) is a dynamic P pool that regulates P availability [26,27]. P released from the MBP pool is highly effective for plants and significantly contributes to crop growth [28,29]. Soil phosphatases play important roles in organic P cycling and plant P uptake [30]. In low-P soils, increased phosphatase activity promotes plant growth and P uptake [31]. In other words, soil microorganisms can encourage soil phosphorus activation. Rapid advances in high-throughput sequencing technologies have facilitated research on P functional genes and the mechanisms of soil P cycling. At the gene level, the microbial genes involved in soil P cycling include four groups, namely, (1) genes involved in inorganic P solubilization, e.g., gcd, ppa, ppaC, and ppx; (2) genes involved in organic P mineralization, e.g., phoA, phnX, and phoD; (3) genes involved in P transport, e.g., pit, phnD, and pst; and (4) regulatory genes, e.g., phoR [25,32,33,34]. Crop rotation systems can influence soil P availability and soil P cycling functional genes [35]. However, it is unclear how microbial activation of soil P and differences in P cycling genes mediate plant–microbial P utilization in RO and RW rotation systems (Figure 1).
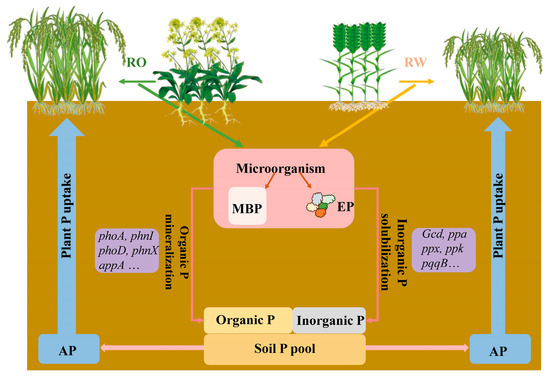
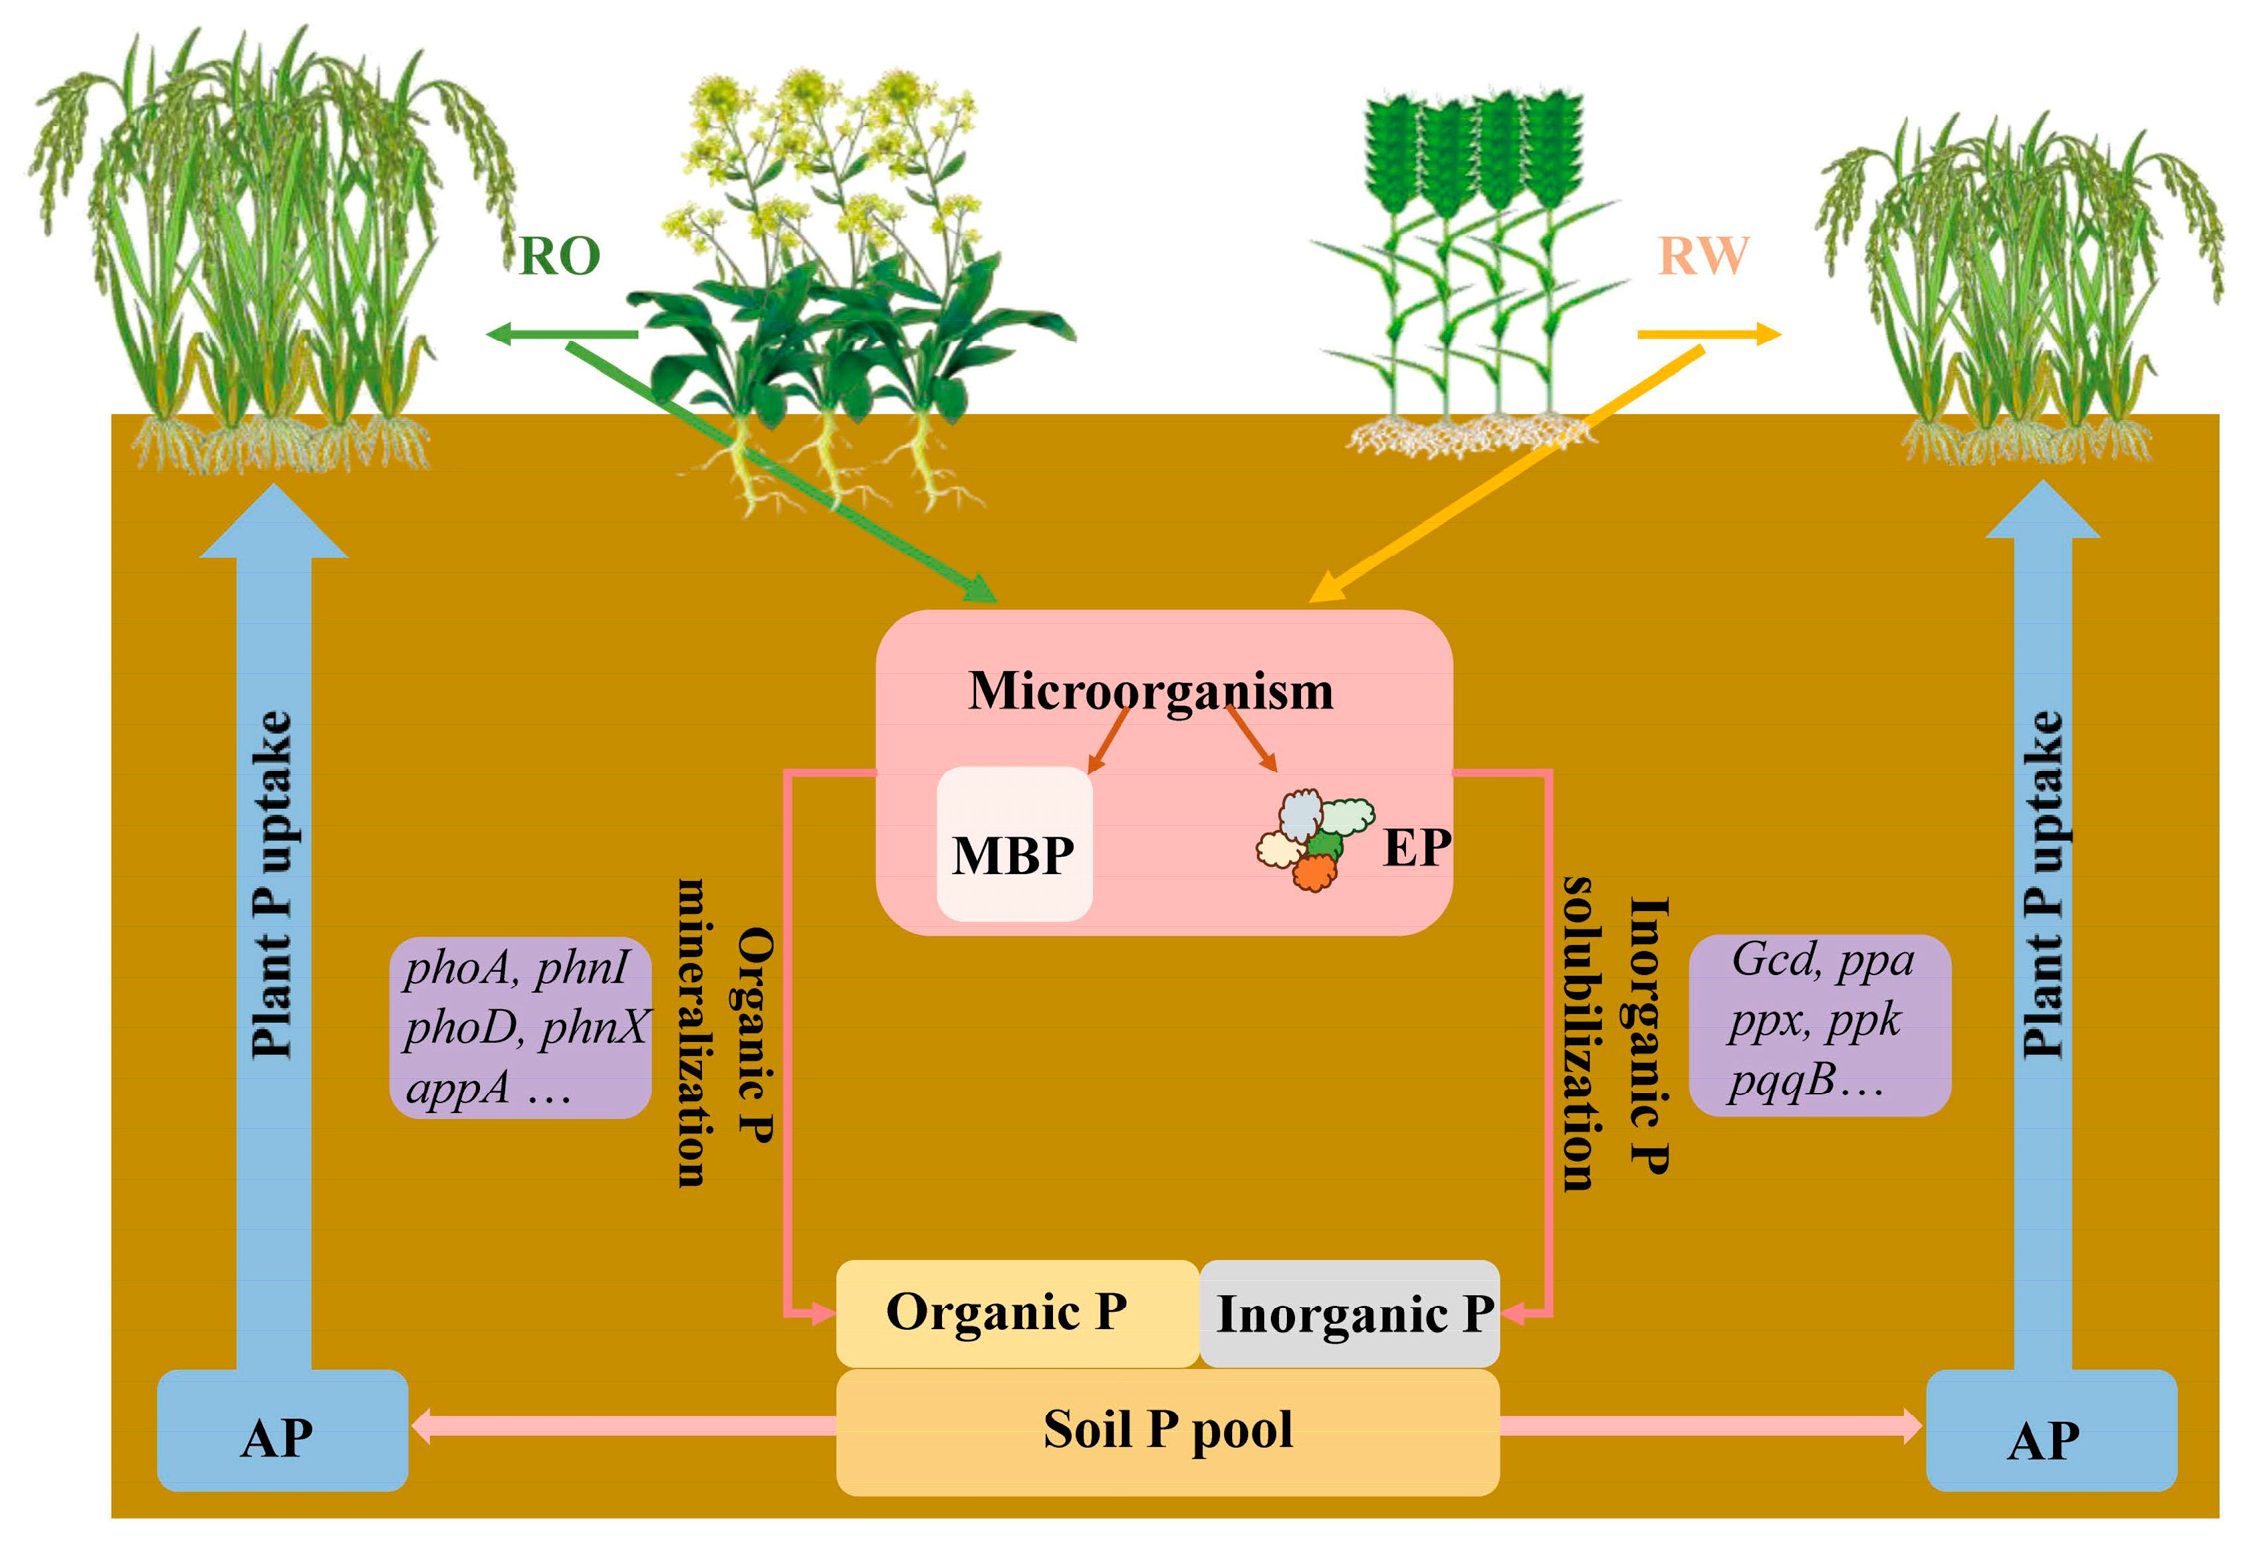
Figure 1.
Transformation and utilization of phosphorus in a plant–soil–microbial system under the rice–oilseed rape rotation and rice–wheat rotation treatments. RO, rice–oilseed rape rotation; RW, rice–wheat rotation; P, phosphorus; MBP, microbial biomass phosphorus; EP, acid phosphatase activity; AP, available phosphorus.
Therefore, located RO and RW rotation systems were investigated in this study. Amplicon sequencing and PICRUSt2 analysis were used to clarify how RO rotation improves rice yield via soil bacterial functions. We hypothesized that soil P is the key factor controlling crop–soil–microbial nutrient transport systems and that RO rotation can increase soil P bioavailability and promote plant P uptake, which is related to changes in P functional genes that affect microbial P utilization. By assessing the above hypothesis, we aimed to investigate the differences between RO and RW rotations in terms of (1) rice P uptake and soil P supply capacity, (2) soil bacterial communities and P functional genes, and (3) bacteria contributions to plant P uptake and rice yield levels. In this study, we aimed not only to bridge the gaps in our understanding of the mechanisms underlying differences between RO and RW rotations in terms of plant P uptake and soil P supply capacity, soil bacterial communities and P functional genes, and bacterial contributions to plant P uptake and rice yield levels, but also to provide valuable insights into sustainable rice production strategies. These findings have broad implications for crop management practices, soil fertility maintenance, and advances in precision agriculture, contributing to global food security and environmental sustainability efforts.
2. Materials and Methods
2.1. Experimental Site and Materials
The experiment was initiated in 2016 in the National Agricultural Hi-Tech Zone in Shucheng County, Anhui Province, China (31°32′ N, 116°59′ E), which has a subtropical temperate monsoon climate. The average annual temperature in the region is 15.6 °C. The average annual rainfall is 1171 mm. The monthly average temperature and precipitation from 2017 to 2022 are shown in Figure 2. The soil type is Hydragric Anthrosol [36]. The soil organic carbon content at the beginning of the experiment was 13.6 g kg−1, the total nitrogen content was 1.4 g kg−1, the available P content was 6.9 mg kg−1, the available potassium content was 101.0 mg kg−1, and the pH of the soil was 5.7. The soil bulk density was 1.26 g cm−3 [37] (Bu et al., 2024).
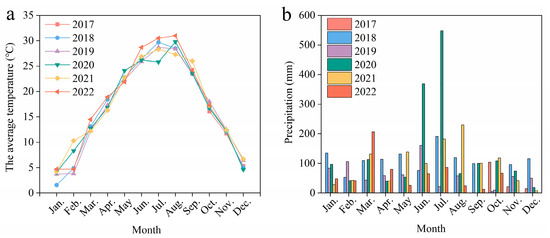
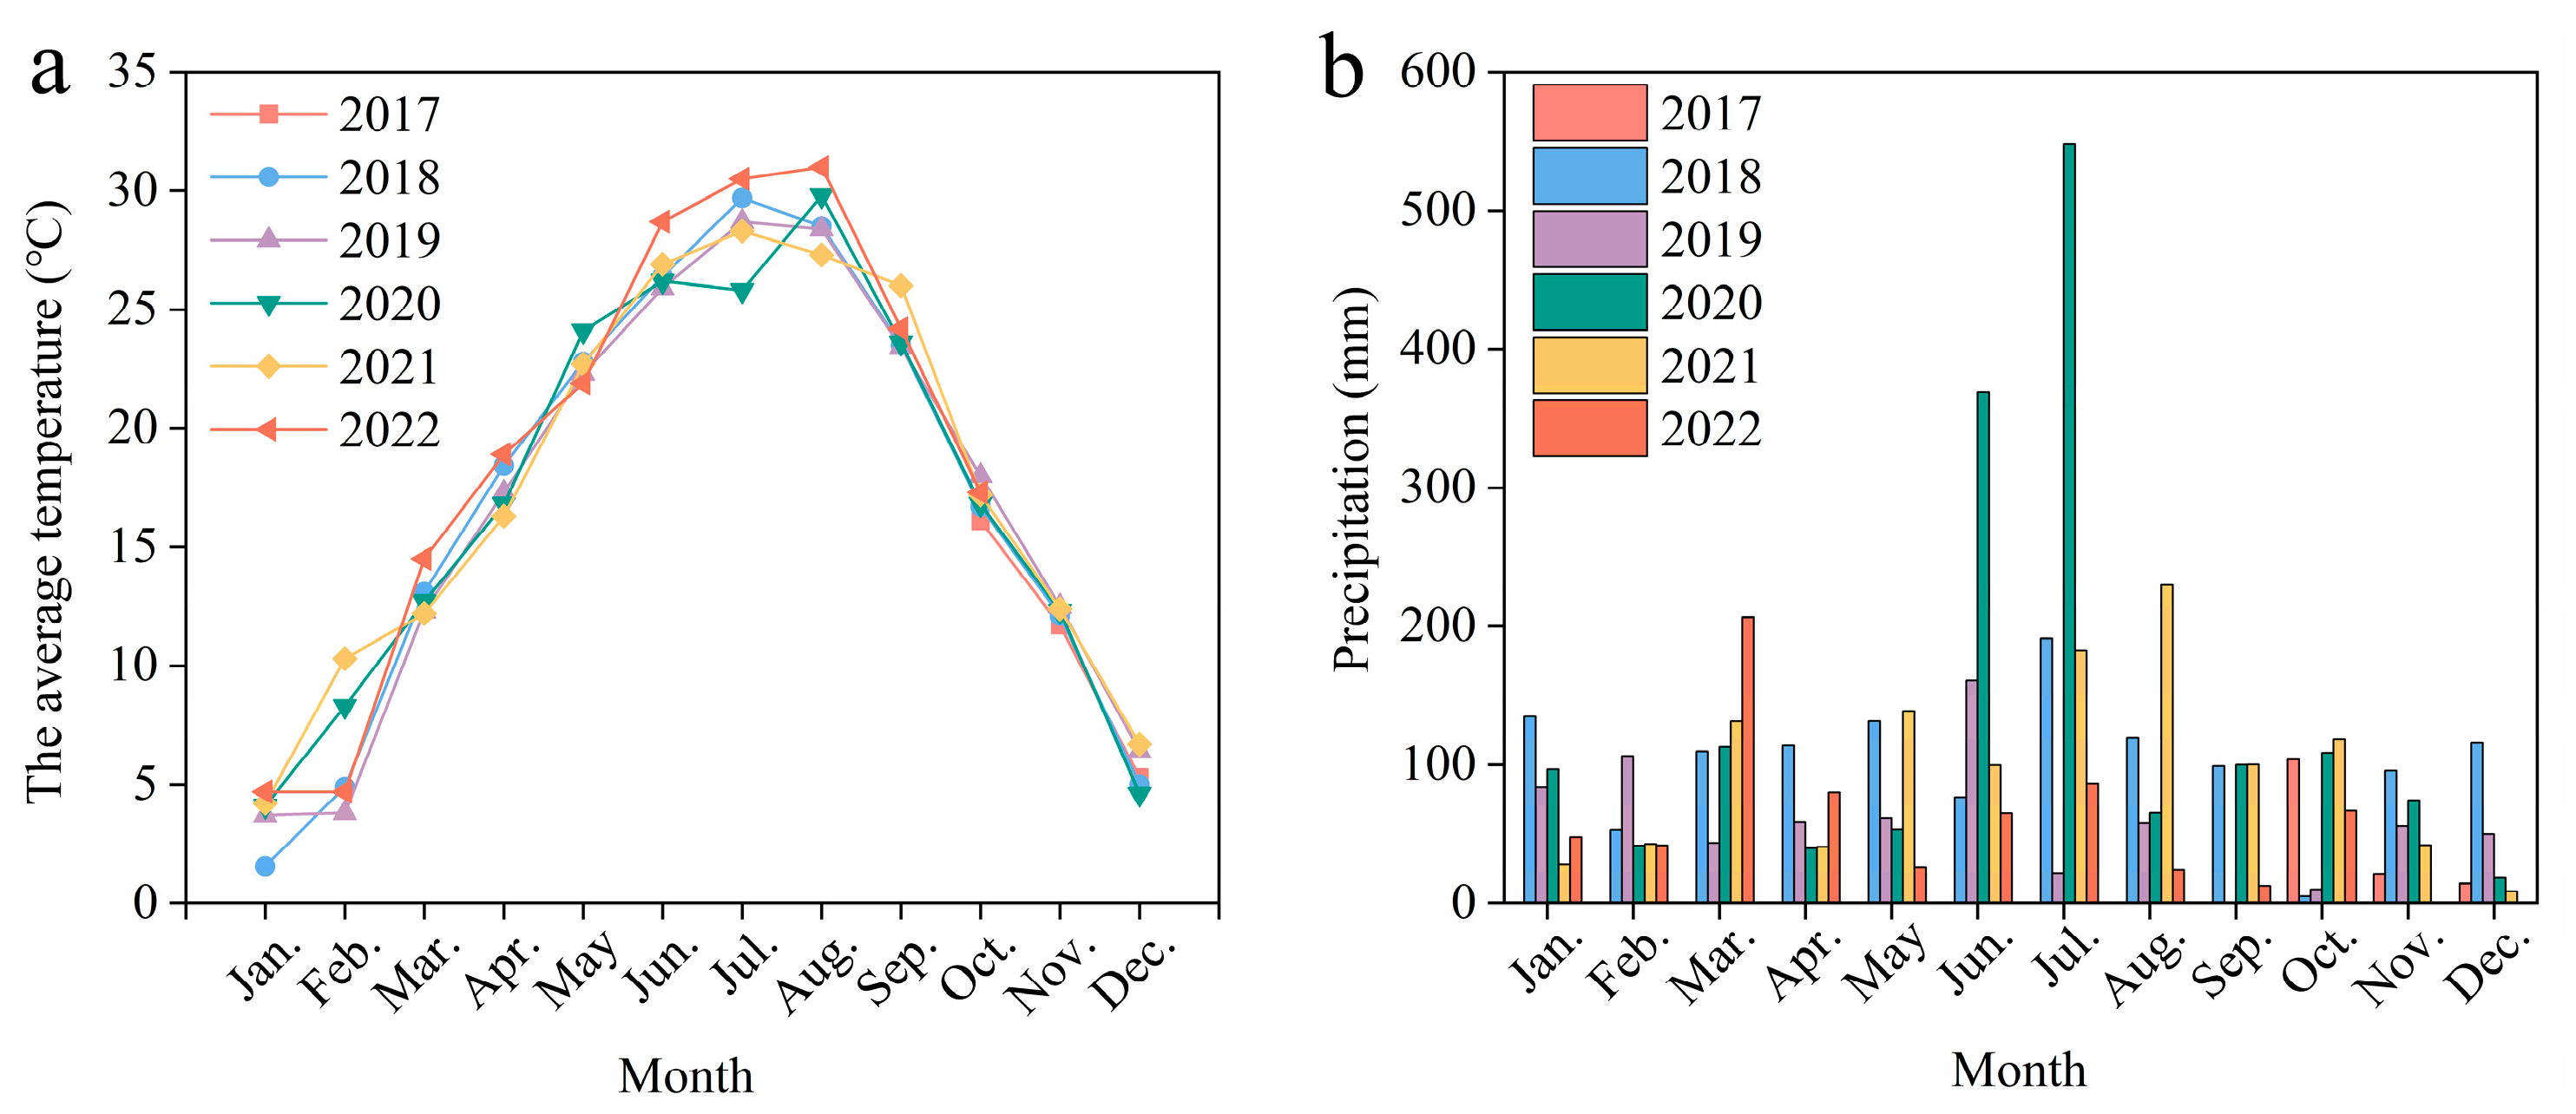
Figure 2.
Monthly average temperature (a) and precipitation (b) during 2017–2022 at the experimental site.
The experiment included two crop rotation systems (RO and RW rotation systems), three fertilization treatments (no fertilizer (CK), chemical fertilizer (F), and chemical fertilizer with straw return (FS)), and three replicates, with a total of 18 plots randomly arranged in the field. The area of each plot was 40 m2 (5 m × 8 m). Each plot was separated by a concrete wall. The rice, oilseed rape, and wheat varieties used were Guangxianfu 4, Dehezayou 8, and Yangmai 25, respectively.
During the rice season, 210 kg N ha−1, 75 kg P2O5 ha−1, and 120 kg K2O ha−1 were applied. During the wheat and oilseed rape seasons, 180 kg N ha−1, 75 kg P2O5 ha−1, and 90 kg K2O ha−1 were applied, with 15 kg ha−1 borax addition. The fertilization rates were based on local fertilization practices. All straw was removed except in the FS treatment, in which straw was returned to the FS plot.
2.2. Soil and Plant Sampling
Soil and plant samples were collected in September 2022 after rice harvest, and the soil samples were collected using a stainless-steel soil sampler with an internal diameter of 5 cm at soil depths ranging from 0 to 20 cm in each plot in an S-shaped sampling pattern. Replicate soil samples were collected from each plot to obtain composite samples. The soil samples were placed in incubators and immediately transported to the laboratory for subsequent processing. The samples were passed through a 2 mm sieve to remove roots, crop residues, and stones and then divided into three parts: (1) one part was preserved at −20 °C for microbial abundance and enzyme activity analysis, (2) a second part was naturally air-dried to determine soil physicochemical properties, and (3) a third part was preserved at −80 °C for amplicon sequencing. The mature rice samples were divided into stalks and seeds and dried in an oven at 60 °C until a stable weight was reached. The samples were subsequently ground and passed through a 0.25 mm sieve. The rice yield per plot was recorded for the different treatments from 2017 to 2022.
2.3. Analysis of Soil Properties and Plant P Contents
The soil moisture content was determined after oven-drying to a constant weight at 105 ± 2 °C. Soil pH was measured in a 1:2.5 mass/volume soil–water suspension via a pH meter. The soil organic carbon (SOC) and total nitrogen (TN) contents were determined via an elemental analyser (EA3100 Elemental Analyser, Eu-Italia, Roma, Italy). Soil NH4+-N and NO3−-N were extracted with a 2 mol L−1 KCl solution (1:10 mass/volume) and then measured via a continuous-flow autoanalyser (Skalar Analytical B.V., Breda, The Netherlands). Soil available nitrogen (AN) was expressed as the sum of NH4+-N and NO3−-N. Total P was extracted with NaOH and analysed via the molybdenum blue method. Available P was extracted with a 0.5 mol L−1 NaHCO3 solution and determined via the molybdenum blue method [38]. Acid phosphatase activity was obtained via the fluorogenic methylumbelliferone-based substrate method (SynergyH1M, BioTek, Winooski, VT, USA) [39]. Microbial BP was measured by the chloroform fumigation method, and the subsequent determination method was same as AP [40]. Plant P content was expressed as the sum of the straw total P and grain total P contents. The plant samples were digested in H2SO4-H2O2, and the plant P content was determined via the molybdenum blue colorimetric method [41].
2.4. Soil Microbial Community Characterization
Soil DNA was extracted from 0.50 g of fresh soil via a Fast DNA Spin Kit following the manufacturer’s instructions. The extracted DNA was sent to BGI Genetics for sequencing. The primers 338F (ACTCCTACGGGGAGGCAGCAG)/806R (GGACTACHVGGGGTWTCTAAT) were selected for amplification of the bacterial 16SrDNA V3-V4 region. The bacterial sequence data were deposited in the NCBI Sequence Read Archive database (PRJNA1136655).
Operational taxonomic units (OTUs) were generated by clustering at 97% sequence similarity. Spliced tags were clustered into OTUs via USEARCH software (v7.0.1090). The main processes were as follows: (1) clustering was performed by using UPARSE at 97% similarity to obtain the representative OTU sequences; (2) chimaeras generated by polymerase chain reaction (PCR) amplification were removed from the representative OTU sequences by using UCHIME (v4.2.40); and (3) all tags were compared to the representative OTU sequences via the usearch_global method to obtain abundance statistics of the OTUs for each sample.
Functional genes were predicted via PICRUSt2 analysis (https://github.com/picrust/picrust2 (accessed on 20 September 2023)) [42] (Caicedo et al., 2020). The P functional genes in this study were selected on the basis of information in the relevant literature, and the gene names, functional properties and Enzyme Commission (EC) numbers of related enzymes were determined from the Kyoto Encyclopedia of Genes and Genomes (KEGG) database. The identified P functional genes were used as the basis for screening. Forty-three functional genes were identified according to the literature (Table S1), and 41 P functional genes were identified according to the PICRUSt2 results in this study (Table S2).
2.5. Analysis of Soil P Mineralization
Air-dried soil samples (30 g per treatment) that had been passed through a 2 mm sieve were incubated in a 250 mL bottle. Ultrapure water was added to each bottle until the soil became saturated. All bottles were incubated in an artificial climate chamber (temperature, 25 °C; humidity, 70%). During incubation, air-permeable membranes were placed on all the bottles to keep the contents aerated, and ultrapure water was added to the soil every three days to maintain soil saturation. Soil AP was analysed after 1 and 27 days.
2.6. Statistical Analysis
Analysis of variance (ANOVA) was performed with IBM SPSS Statistics 27 to determine whether the differences between the treatments were significant (p < 0.05). Post hoc comparisons were conducted using Duncan’s multiple range test at p < 0.05. One-way ANOVA was conducted to examine whether the differences in the rice yield, plant P uptake, soil properties, and bacterial α diversity among the different fertilization treatments within the same crop rotation system were significant. Moreover, two-way ANOVA was employed to assess whether observed differences in rice yield, plant P uptake, soil properties, bacterial α diversity, relative abundance of the top 10 bacterial species, and relative abundance of the P functional genes were significant under different crop rotation and fertilization treatments and under the interaction between these two factors. Data variability is reported as standard deviation (SD) in both figures and tables. Correlation analyses were performed in ChiPlot (https://www.chiplot.online/ (accessed on 25 July 2024)) between the relative abundance of P functional genes and the relative abundance of bacteria, crop yield, plant P uptake, and soil P. ChiPlot was used to perform linear correlation analysis and construct histograms, line graphs, and correlation coefficient diagrams. Random forest analysis was employed to analyse the importance of five functional genes and the top 20 bacterial phyla related to rice yield and plant P uptake via the randomForest R package in R (v. 4.3.1). Partial least squares analysis was conducted to clarify the effects of P functional genes (gcd, phnD, ppaC, and phnX) on MBP, AP, plant P uptake, and rice yield via the plspm R package in R (v. 4.3.1), with the data subjected to log-transformation.
3. Results
3.1. Rice Yield and Nutrient Uptake
We determined the influences of the rotation systems on average rice yield and P uptake on the basis of soil and plant sampling conducted during our field experiment. The average rice yield under the RO rotation from 2017 to 2022 was 9.17% greater than that under the RW rotation (Figure 3). Moreover, for each year, the rice yields were significantly greater under the RO rotation than under the RW rotation (Table S3). The average rice yield under the RO rotation was 15.42%, 5.99%, and 7.90% greater than that under the CK, F, and FS treatments, respectively.
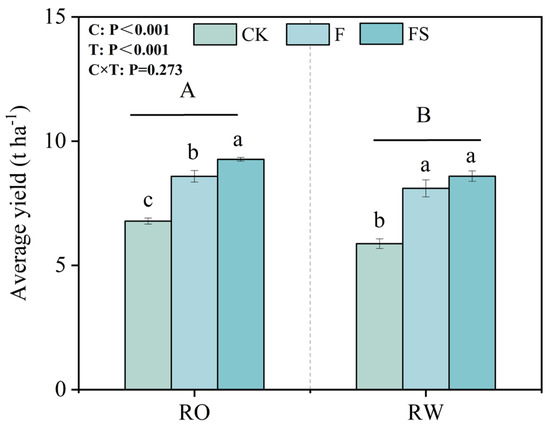
Figure 3.
Average rice yield from 2017 to 2022 under the different fertilization treatments in the RO and RW crop rotation systems. The capital letters indicate significant differences between the RO and RW rotation systems. The lowercase letters indicate significant differences between the different fertilization treatments in the same crop rotation system (p < 0.05). Error bars represent the standard deviation. C, crop rotation; T, fertilization treatment; C × T, interaction effect between crop rotation and fertilization treatment; RO, rice–oilseed rape rotation; RW, rice–wheat rotation; CK, no fertilizer; F, chemical fertilizer; FS, chemical fertilizer with straw return.
RO rotation promoted grain, straw, and plant P uptake (Table 1). Plant P uptake was 20.70% greater under the RO rotation than under the RW rotation. The plant P uptake was 3.57%, 22.24%, and 32.23% greater in the CK, F, and FS treatments, respectively, under RO rotation than under RW rotation.

Table 1.
Phosphorus uptake in grain, straw, and plants in the different crop rotation systems and under different fertilization practices.
3.2. Variations in Soil Properties
We determined the soil abiotic and biotic property indices to identify changes in the soil between the two crop rotation systems. Soil pH, SOC, TN, and AN did not differ significantly between the two crop rotation systems (Table 2), whereas soil P did. The total P content under the RO rotation was significantly lower than that under the RW rotation by 4.83% and 12.78%, 2.19%, and 1.77% under the CK, F, and FS treatments, respectively (Figure 4a). Moreover, the available P content under the RO rotation was significantly lower than that under the RW rotation by 18.31% and 11.36%, 34.59%, and 7.87% under the CK, F, and FS treatments, respectively (Figure 4b). These data indicate that RO rotation may lead to greater decreases in soil TP and AP levels than RW rotation. The MBP content under RO rotation was significantly greater than that under RW rotation by 39.40% and −15.28%, 97.82%, and 69.88% under the CK, F, and FS treatments, respectively (Figure 4c). In addition, EP under the RO rotation was significantly greater than that under the RW rotation by 128.45% and 66.12%, 163.73%, and 195.24% under the CK, F, and FS treatments, respectively (Figure 4d). These data indicate that RO rotation yielded greater MBP and EP levels in the soil than RW rotation.
Table 2.
Soil abiotic properties across the crop rotation and fertilization treatments.
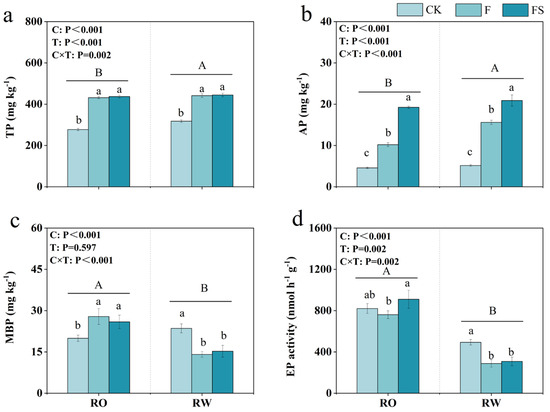
Figure 4.
Soil total P content (TP, (a)), available P content (AP, (b)), microbial biomass P (MBP, (c)), and acid phosphatase activity (EP, (d)) in the RO and RW crop rotation systems. The capital letters indicate significant differences between the RO and RW rotation systems. The lowercase letters indicate significant differences between the different fertilization treatments in the same crop rotation system (p < 0.05). Error bars represent the standard deviation. C, crop rotation; T, fertilization treatment; C × T, interaction effect between crop rotation and fertilization treatment; RO, rice–oilseed rape rotation; RW, rice–wheat rotation; CK, no fertilizer; F, chemical fertilizer; FS, chemical fertilizer with straw return.
In addition to the soil nutrient content, nutrient turnover affects crop nutrient uptake. Soil mineralization can convert organic nutrients into inorganic nutrients, making them available for plant uptake and thereby promoting plant growth. In order to determine the difference in soil P mineralization ability between the two rotations, the mineralization experiment was carried out for 27 days. The incubation results revealed that although there was no significant difference on the first day, the AP content under the RO rotation was significantly greater than that under the RW rotation by 4.74% and 3.03%, 11.34%, and 0.37% greater under the CK, F, and FS treatments, respectively, after 27 days (Figure 5).
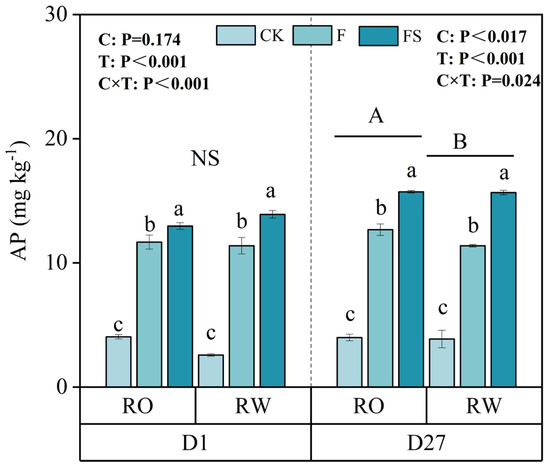
Figure 5.
Contents of available P (AP) in the soil mineralization test in the RO and RW crop rotation systems. The capital letters indicate significant differences between the RO and RW rotation systems. NS indicates no significant differences between the RO and RW rotation systems. The lowercase letters indicate significant differences between the different fertilization treatments in the same crop rotation system (p < 0.05). Error bars represent the standard deviation. D1 and D27 indicate days 1 and 27, respectively, of the soil phosphate mineralization incubation time. C, crop rotation; T, fertilization treatment; C × T, interaction effect between crop rotation and fertilization treatment; RO, rice–oilseed rape rotation; RW, rice–wheat rotation. CK, no fertilizer; F, chemical fertilizer; FS, chemical fertilizer with straw return.
3.3. Soil Microbial Community and P Functional Genes
To determine the effects of the two rotation systems on soil microbial community composition and P cycle functional genes, the soil bacterial community diversity, species composition, and functional genes were analysed via amplicon sequencing. The relative abundances of the top 10 phyla were similar under the two rotation systems. The bacteria included Actinobacteria, Proteobacteria, Chloroflexi, Acidobacteriota, Firmicutes, Myxococcota, Planctomycetota, Desulfobacterota, Gemmatimonadota, and Nitrospirota. However, the relative abundance of Planctomycetota increased, whereas that of Myxococcota decreased under RO rotation compared with that under RW rotation (Table S4). The bacterial α and β diversity levels did not significantly differ between the two rotation systems (Table S5 and Figure S1). At the gene level, crop rotation affected the abundance of P functional genes, among which the abundances of the gcd, phoA phoB, ppaC, and phnX genes were 28.68%, 5.87%, 11.16%, and 28.77% greater, respectively, whereas those of the phnD, ugpE, ugpA, and phnO genes were 5.36%, 6.23%, 5.78%, and 56.26% lower, respectively, under RO rotation than under RW rotation (Figure 6).
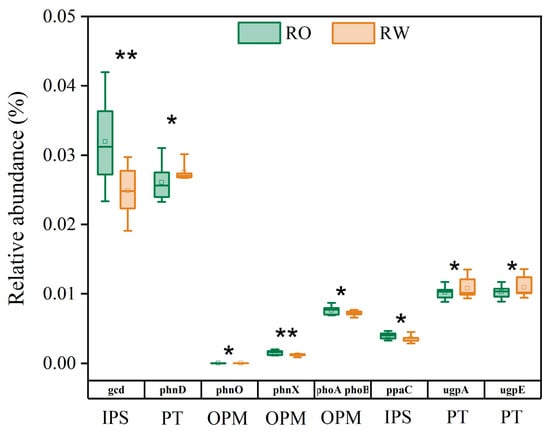
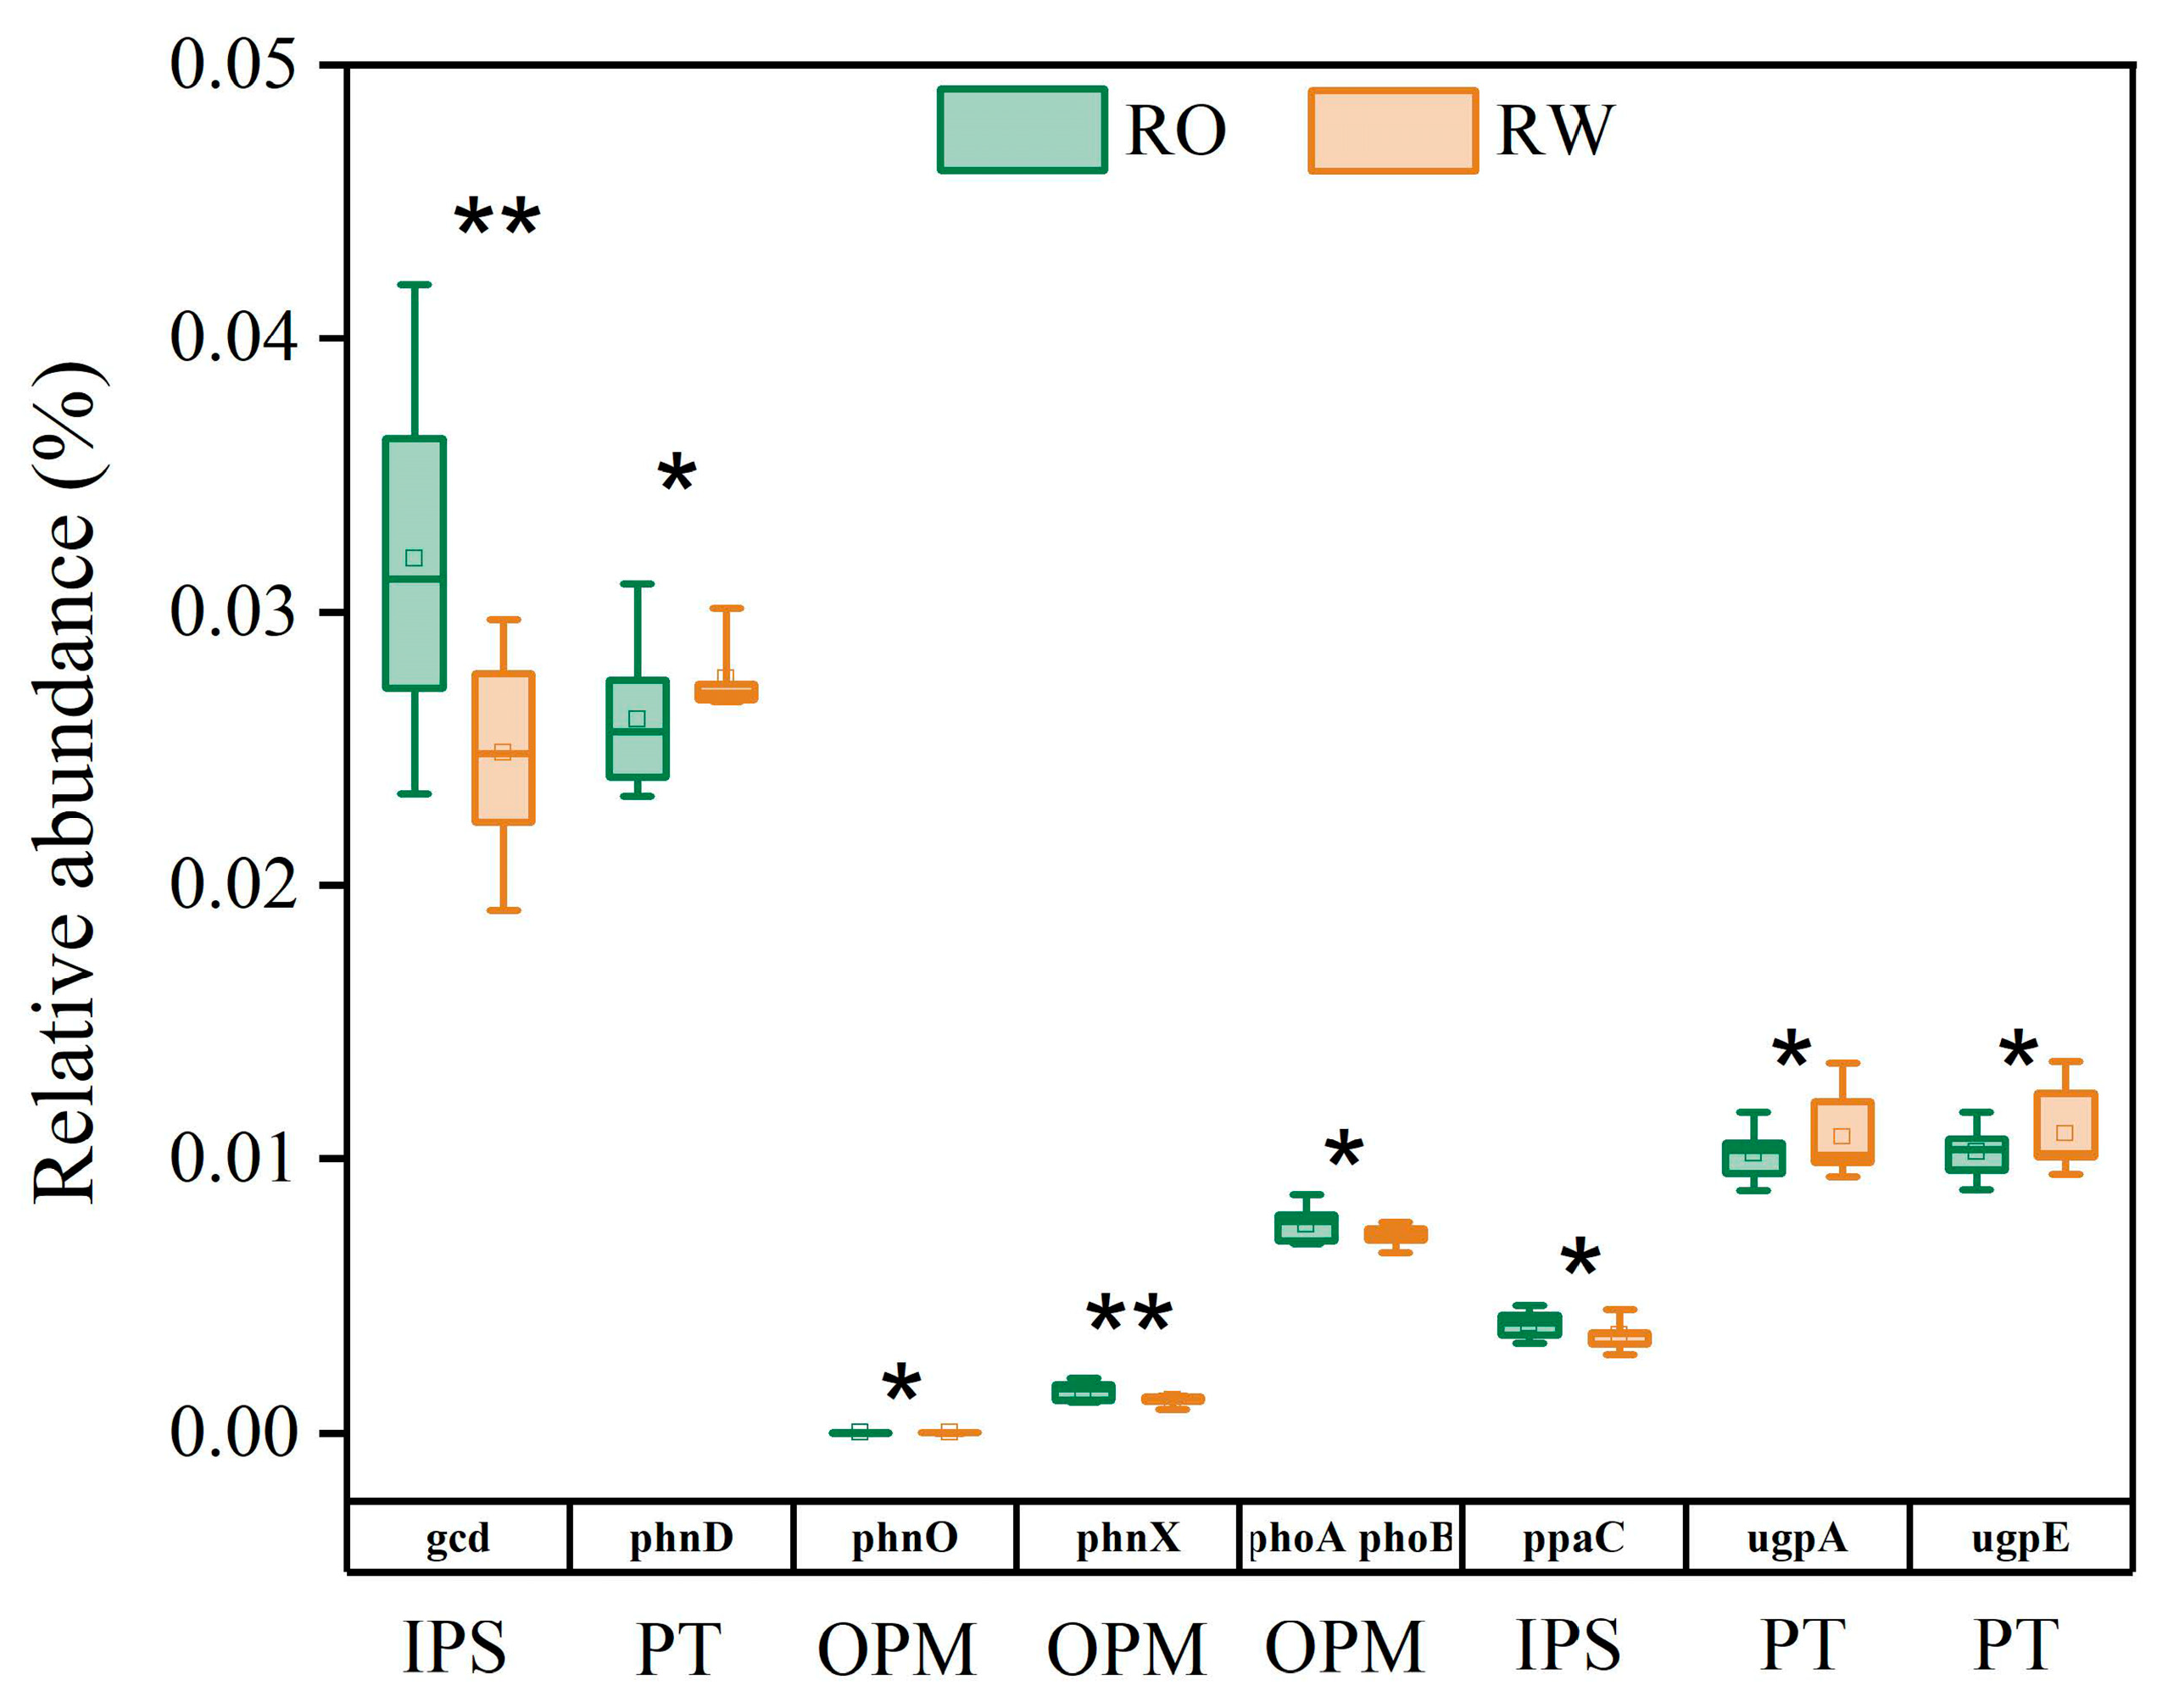
Figure 6.
Relative abundance of P functional genes in the RO and RW rotation systems. * indicates p < 0.05, ** indicates p < 0.01. Error bars represent the standard deviation. IPS, inorganic P solubilization; PT, P transport; OPM, organic P mineralization. RO, rice–oilseed rape rotation; RW, rice–wheat rotation.
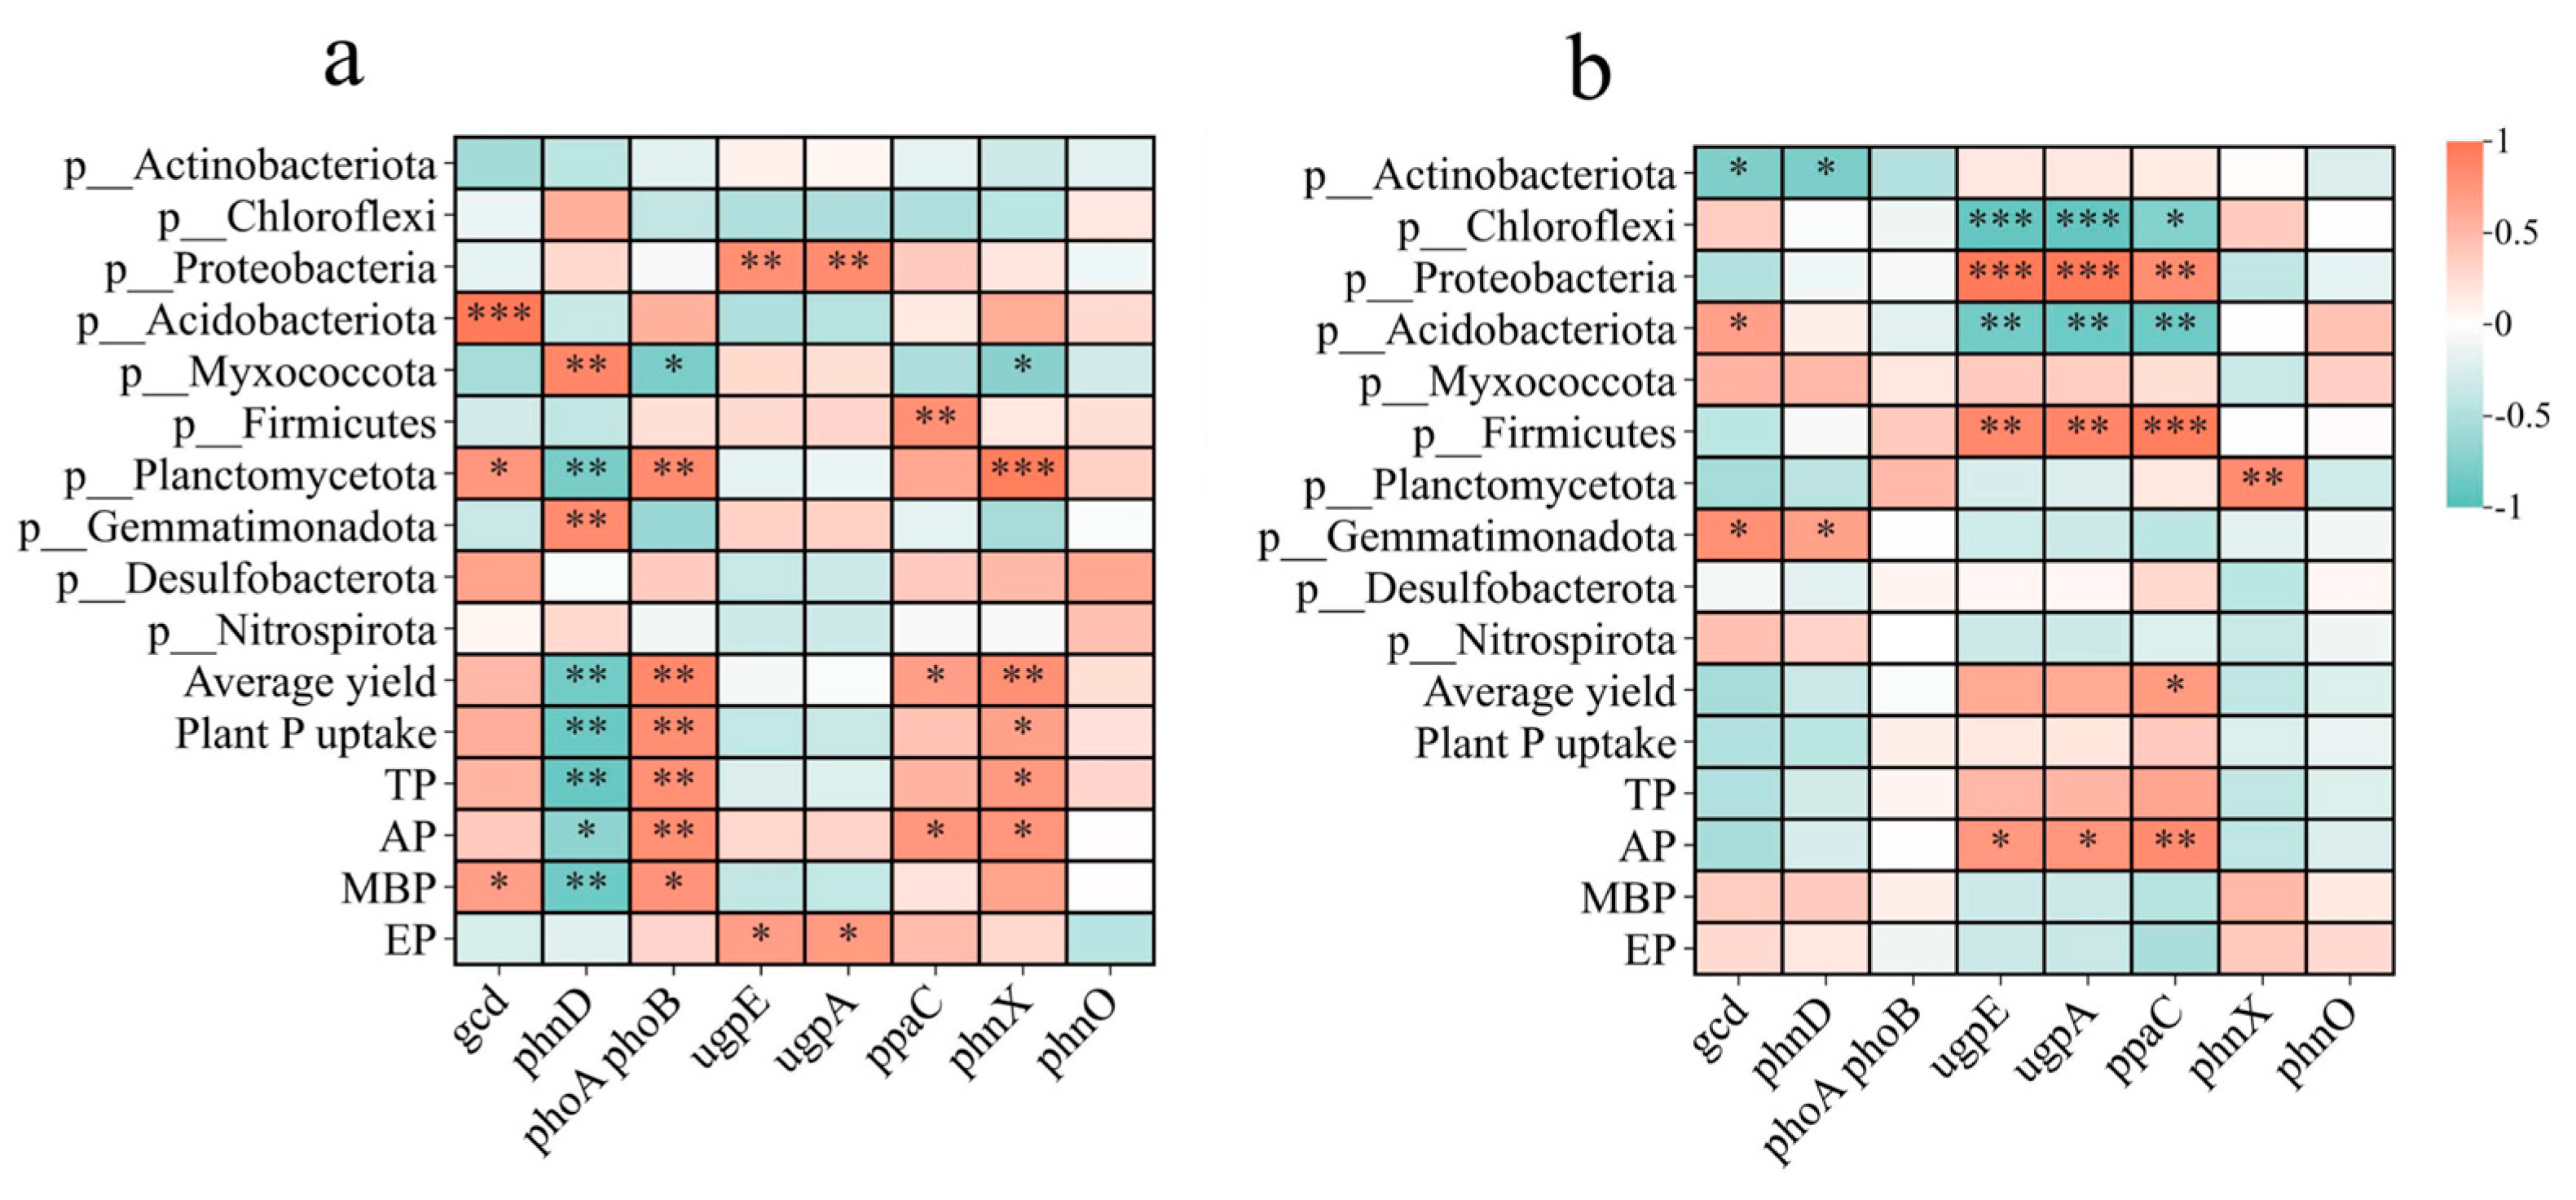
The relationships of Planctomycetota and Myxococcota with P functional genes differed between the two rotation systems (Figure 7). Planctomycetota was significantly positively correlated with gcd, phoA phoB, and phnX and negatively correlated with phnD, whereas Myxococcota was significantly positively correlated with phnD and negatively correlated with gcd, phoA phoB, and phnX in the RO rotation system. In the RW rotation system, only Planctomycetota was correlated with phnX, whereas Myxococcota was not correlated with any P functional genes. P functional genes and these two bacterial phyla showed a relatively close relationship in the RO rotation system.
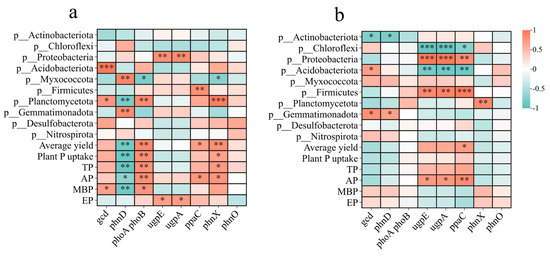
Figure 7.
Correlations between P functional genes and the relative abundance of bacteria, yield, and plant and soil P. (a) RO crop rotation. (b) RW crop rotation. Red and blue denote positive and negative relationships, respectively. The r values are in Table S6. * indicates p < 0.05, ** indicates p < 0.01, *** indicates p < 0.001. RO, rice–oilseed rape rotation; RW, rice–wheat rotation; P, phosphorus; TP, soil total phosphorus; AP, soil available phosphorus; MBP, microbial biomass phosphorus; EP, acid phosphatase activity.
3.4. Effects of Soil Properties and Microorganisms on Rice Yield
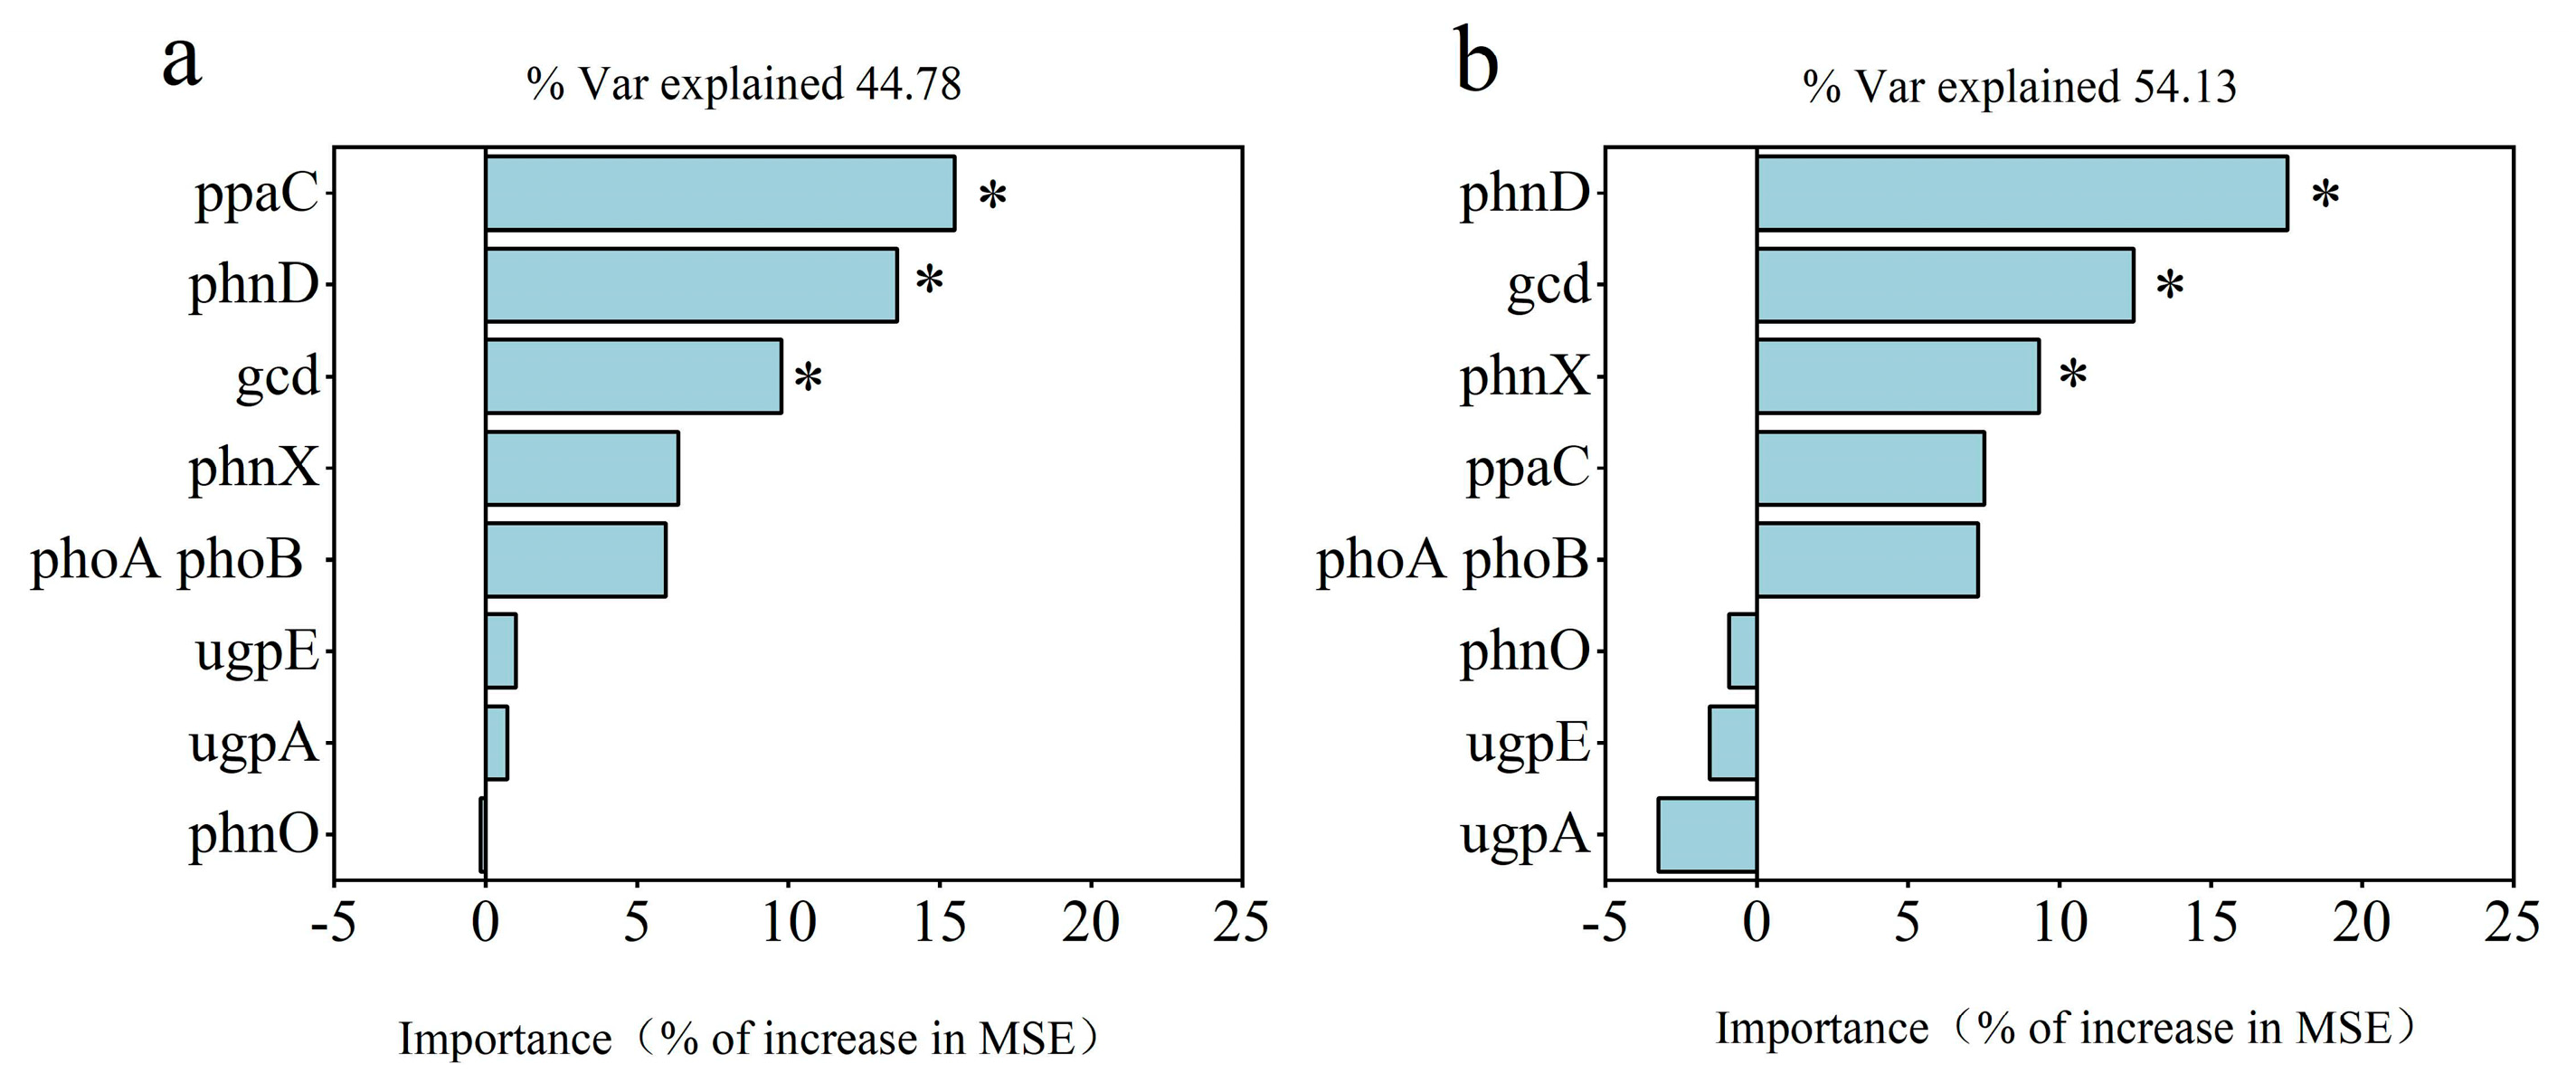
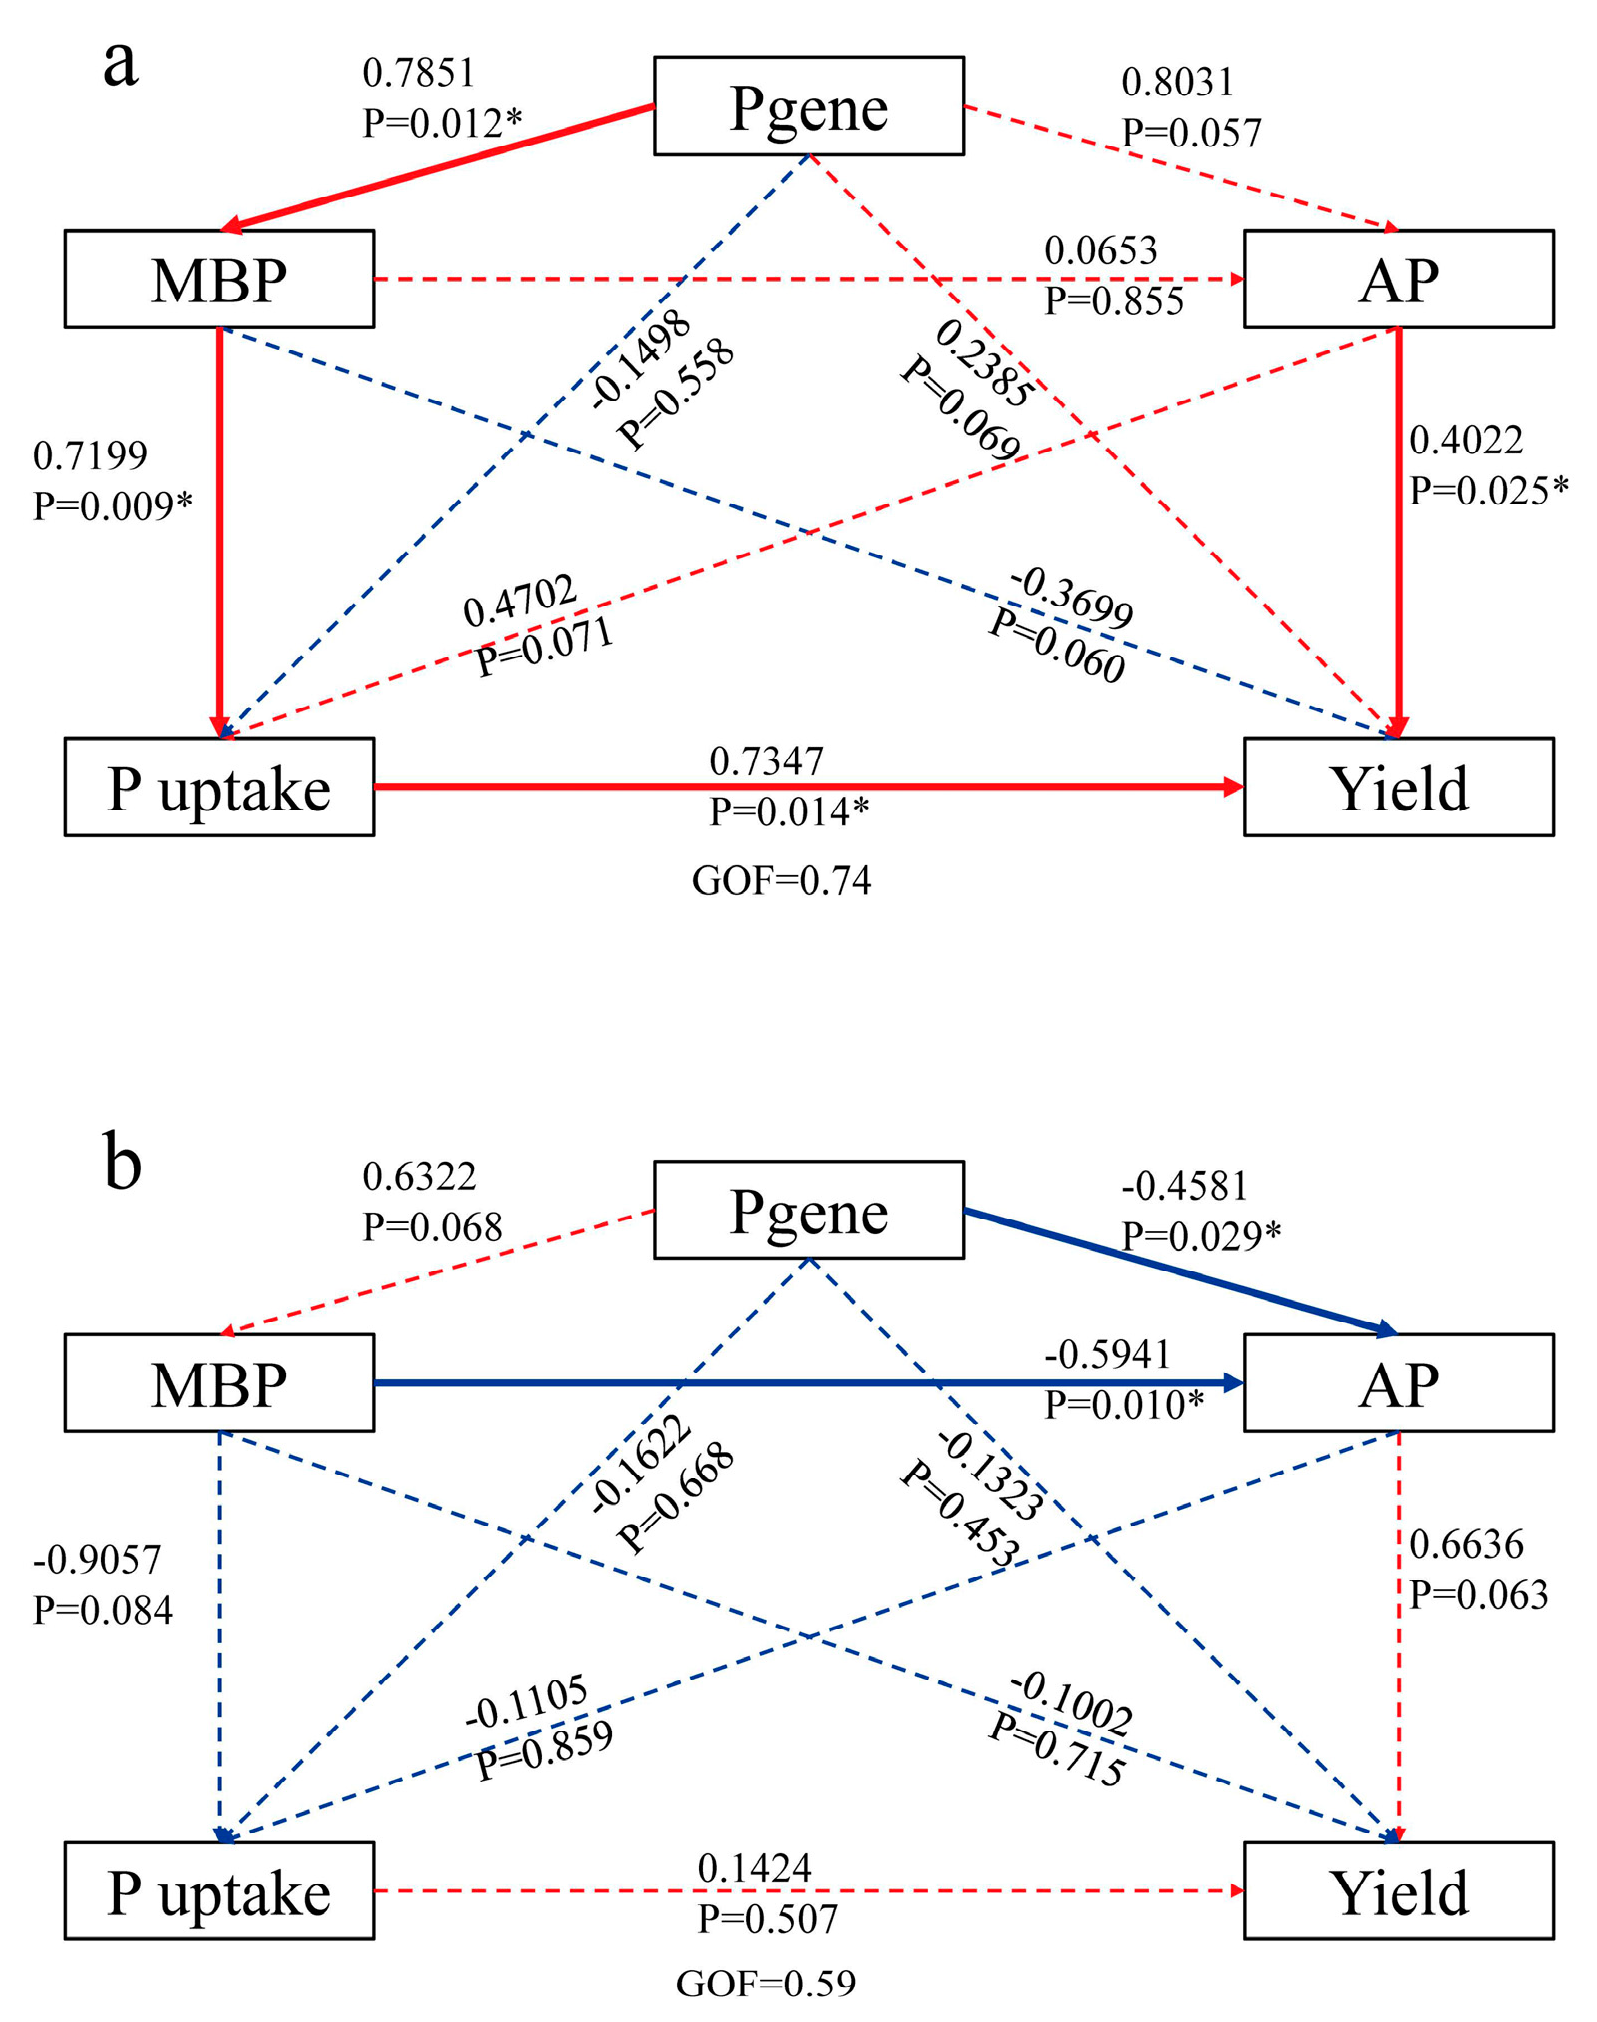
The random forest model for analysing the RO and RW rotation systems revealed that ppaC, phnD, and gcd were significant for the rice yield (Figure 8a) and that phnD, gcd, and phnX were significant for P uptake (Figure 8b). In the RO rotation system, gcd was positively related to MBP; phnD was negatively related to yield, plant P uptake, TP, AP, and MBP; ppaC was positively related to yield and AP; phnX was positively related to yield, TP, AP, and MBP; and the four P functional genes were not related to EP (Figure 7a). However, rice yield, plant P uptake, TP, AP, MBP, and EP were not significantly correlated with gcd, phnD, or phnX, and only ppaC presented a positive relationship with yield in the RW rotation system (Figure 7b). According to the above relationships between the four P functional genes (gcd, phnD, ppaC, and phnX) and plant P uptake, rice yield, and soil properties, several indicators were selected for partial least squares (PLS) analysis. PLS analysis indicated that P functional genes (gcd, phnD, ppaC, and phnX) did not directly affect MBP but indirectly affected plant P uptake and rice yield under RO rotation (Figure 9a), whereas P functional genes had no direct or indirect effects on plant P uptake or rice yield under RW rotation (Figure 9b).
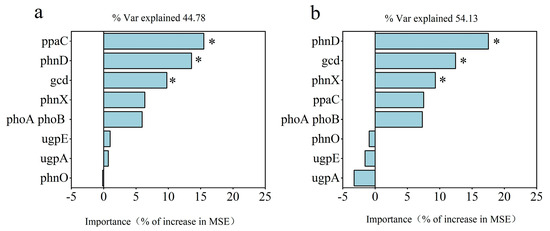
Figure 8.
Predicted importance (percentage of increase in the mean square error, MSE) of soil P functional genes as drivers of the rice yield (a) and plant P uptake (b) via the random forest model. * indicates p < 0.05.
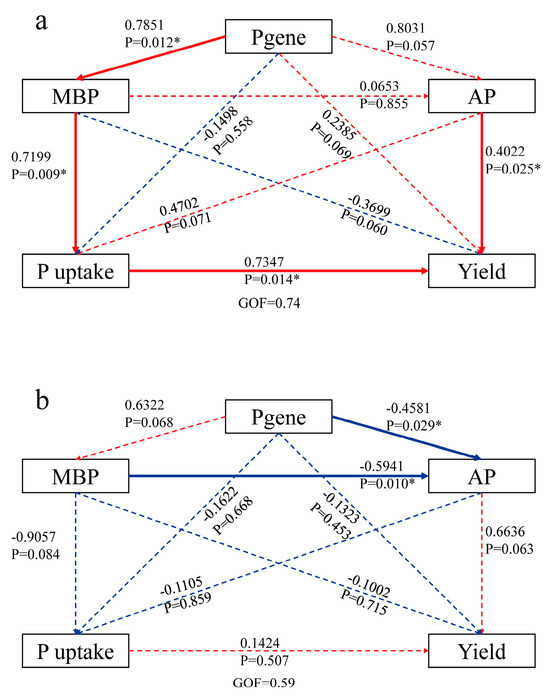
Figure 9.
PLS analysis results for the effects of soil biotic factors and P functional genes on plant P uptake and rice yield in the RO (a) and RW (b) crop rotation systems. The numbers in each pathway indicate the correlation coefficient. Red indicates a positive relationship, and blue indicates a negative relationship. * indicates p < 0.05. RO, rice–oilseed rape rotation; RW, rice–wheat rotation; MBP, microbial biomass phosphorus; AP, available phosphorus; P uptake: plant P uptake; yield: average yield.
4. Discussion
4.1. RO Rotation Activates Soil P and Promotes Plant P Uptake
Crop rotation significantly affected soil P mineralization and plant P uptake capacity. According to the incubation experiments, the available P content was much greater under RO rotation than under RW rotation (Figure 5). This finding indicated that the ability of microbes to mineralize P was greater under the RO rotation than under the RW rotation. Previous studies have also demonstrated that the nutrient mineralization capacity under RO rotation is greater than that under RW rotation [37,43]. However, the AP contents in paddy soils decreased from the RW to RO rotation systems (Figure 4a,b) because plant P uptake was greater in the RO rotation system (Table 1), and greater plant P uptake resulted in a lower AP content in RO soils after rice harvest. This result is similar to that of other studies, revealing that even at a lower initial P content, RO rotation provides more P for rice growth and for yield enhancement [44,45]. Fang et al. (2021) reported that RO rotation improved the nutrient supply capacity of soils [8]. In other words, more organic P is mineralized under RO rotation than under RW rotation, which improves crop P uptake.
4.2. Soil MBP Affects P Bioavailability in the RO Rotation System
Soil P bioavailability is associated with microbial factors [31]. The MBP content was significantly greater under RO rotation than under RW rotation (Figure 4), and there was a significant positive relationship between the MBP content and plant P uptake, which was not observed under RW rotation (Figure 9). These findings indicate that crop yield, plant P uptake, and soil P availability are closely related to the soil microorganisms in the RO rotation system. Therefore, although there is competition between plants and microorganisms for P, an increase in soil microbial P can stimulate plant P uptake [26]. This result is comparable to that obtained by Zhang et al. (2023), who reported that soil fertility and crop yield increased under RO rotation through soil microbiome and physicochemical property relationships [7]. The turnover of microbial biomass strongly influences soil P availability [27] and plant P uptake [29]. RO rotation combined with straw return can improve soil P availability by regulating microbial biomass carbon (MBC) and MBP levels [27]. Compared with the RW rotation, the RO rotation increased the turnover of microbial P and enhanced the microbial contribution to yield enhancement in plant–soil–microbial P transport processes.
4.3. Relationships Between Microbial P Functional Genes and Rice Yield in the RO Rotation System
Soil microorganisms play a key role in the transformation and cycling of soil P and can increase soil P availability through the mineralization of organic P and the solubilization of inorganic P to improve plant P supply [46]. Liu et al. (2024) reported that PHOSPHATESTARVATION RESPONSE 2 (OsPHR2) can increase phosphorus use in rice through root exudate-mediated recruitment of Pseudomonas [47]. Firmicutes and Proteobacteria are phosphate-solubilizing bacteria; their relative abundances did not differ between the two crop rotation systems in our study, while Planctomycetota and Myxococcota varied significantly (Table S4). Moreover, according to the random forest model, Planctomycetota and Myxococcota contributed the most to rice yield and plant P uptake (Figure S2). Furthermore, these two phyla were significantly linearly correlated with rice yield and plant P uptake under RO rotation but not under RW rotation (Figure S3).
Through phosphorus functional genes, microorganisms improve the efficiency of plant P uptake and utilization [48]. Wang et al. (2023) reported that the composition of crop rhizosphere metabolites, which also affect P functional genes, significantly varies in different rotation systems and is closely associated with the microbiome [17]. Differences in the root exudates of oilseed rape and wheat also lead to differences in rhizosphere microorganisms and soil nutrient utilization. In our study, RO rotation resulted in an increase in the abundance of genes related to organic P mineralization (phnX) and inorganic P solubilization (gcd and ppaC) but a decrease in the abundance of phnD (phosphonate transporter), ugpE, and ugpA (phosphate transport) genes (Figure 6). Therefore, the changes in the P functional genes may stem from differences in nutrient return between the RO and RW rotation systems and from variations in root exudates between oilseed rape and wheat. The gcd, phnD, ppaC, and phnX genes contributed the most to rice yield and plant P uptake (Figure 8). Previous studies have shown that gcd, which encodes glucose dehydrogenase, is a key gene that promotes the solubilization of insoluble P and is an important predictor of soil AP and microbial phosphate solubility [34,49], thereby promoting plant P uptake and growth [50].
The correlations between Planctomycetota and Myxococcota and P functional genes were greater in the RO rotation system than in the RW rotation system (Figure 7). In the RO rotation system, Planctomycetota was significantly positively correlated with genes involved in the mineralization of organic P and solubilization of inorganic P, whereas Myxococcota was significantly positively correlated with genes involved in phosphate transport. Planctomycetota is related to P functional genes [51]. RO rotation may regulate the expression of P functional genes through a pathway that increases the relative abundance of Planctomycetota and decreases the relative abundance of Myxococcota. An increase in the relative abundance of Planctomycetota was accompanied by an increase in genes related to P mineralization and inorganic P solubilization; a decrease in the relative abundance of Myxococcota was accompanied by a decrease in the abundance of genes encoding P transporter proteins (Figure 7), which may explain the greater ability of soil microbes to mineralize P in the RO rotation system than in the RW rotation system and may allow for increased P acquisition in both rice plants and microorganisms in the RO rotation system, but this relationship was not found in the RW rotation system.
Although the results of this study revealed a correlation between Planctomycetota and Myxococcota and P functional genes, as well as their potential role in the two crop rotation systems on the basis of correlation analysis, these findings do not directly reveal an association between microbial species and P functional genes. Although the relative abundances of Planctomycetota and Myxococcota are correlated with the expression of P functional genes, the specific regulatory mechanisms involved are unclear, and further molecular and physiological analyses are required. In future studies, experiments can be conducted to study specific microorganisms to observe their direct effects on P functional gene expression and P utilization efficiency, and the mechanism of microbial functional changes due to root exudation can also be analysed, which may provide more convincing evidence. However, long-term RO rotation may lead to a continuous decline in the soil AP content, affecting the productivity of oilseed rape and rice.
4.4. Practical Implications for Phosphorus Management and Crop Rotation
As a sustainable agricultural practice, the RO rotation system has great potential to improve soil P bioavailability compared with RW rotation. The RO rotation can increase the relative abundance of inorganic phosphate mineralization genes and organophosphorus dissolved genes (Figure 6), as well as MBP and EP (Figure 4). The change in microbial functional genes promoted microbial phosphorus utilization, which results in a 20.70% increase in plant P uptake and 9.17% higher rice yield compared to RW rotation (Table 1 and Figure 3 and Figure 9). RO rotation may help farmers improve crop productivity with lower fertilization input costs, contributing to more environmentally friendly farming practices.
Although the results show that RO rotation can improve soil P bioavailability, the soil TP and AP of RO rotation are lower than that of RW rotation (Figure 4). Over time, continuous P uptake by crops may lead to soil P depletion [52]. Therefore, RO rotation is also faced with the risk of soil P depletion while increasing rice yield. Regular testing of soil properties and long-term monitoring of soil nutrients are important to maintain soil fertility and avoid nutrient depletion [53], which will help agricultural managers adjust fertilization strategies [54], optimize soil nutrient management, and improve sustainable crop production.
In this study, based only on Amplicon and Picrust2 data, the deep relationships among P functional genes, microbiota, and crop productivity were not fully elucidated, thus limiting the interpretation of biological significance. In the future, multi-omics analysis can explore the mechanisms of microbiome-driven P cycle and crop P uptake: (1) metagenomics can comprehensively analyse microbial species and P functional genes and identify their associations, (2) quantitative polymerase chain reaction (qPCR) can quantify the abundance of key functional genes to enhance the reliability of gene abundance data, and (3) transcriptome analysis can determine the true level of gene expression and explore the effect of key functional genes on soil properties. This study also lacks the dynamic changes in soil P and the succession trends of microbial functions under long-term rotation. Future research should consider (1) long-term monitoring of soil P dynamics under different crop rotations to assess the risk of P depletion, (2) the changes in soil microbial species and functional genes under long-term crop rotations, and (3) long-term change in P bioavailability in crop rotation systems in combination with the perspective of the plant–soil–microorganism system and abiotic and biological factors.
5. Conclusions
The AP and TP contents in paddy soils decreased from the RW rotation system to the RO rotation system. The RO rotation system indirectly increased crop yield by altering the relative abundance of P functional genes (ppaC, phnD, gcd, and phnX), promoting microbial P utilization activity and increasing MBP, all of which promoted plant P uptake. These findings significantly advance our understanding of how crop rotation systems increase yields and show that the RO rotation system could result in high soil P bioavailability. From the perspective of agricultural production, the RO rotation system is a promising rotation pattern, which can enhance P use efficiency and crop productivity. This study improves our understanding of the P management strategies in paddy–upland crop rotation systems and sustainable agricultural production.
Supplementary Materials
The following supporting information can be downloaded at: https://www.mdpi.com/article/10.3390/agronomy15040866/s1. Figure S1: Bacterial β diversity. Figure S2: Predicted importance (percentage increase in the mean square error, MSE) of the relative abundance of bacteria as a driver of the rice yield. Figure S3: Linear relationship between the abundance of bacteria and rice yield in the RO (a,b) and RW rotation systems (c,d). Figure S4: Linear relationship between the abundance of p__Planctomycetota and p__Myxococcota in the RO (a) and RW rotation systems (b). Table S1: Microbial phosphorus-cycling genes. Table S2: Differences in the relative abundance of phosphorus-cycling genes between the RO and RW rotation systems. Table S3: Rice yield under the different fertilization treatments between the RO and RW crop rotation systems from 2017 to 2022. Table S4: Soil abiotic properties across the crop rotation and fertilization treatments. Table S5: Relative abundance of the major soil bacterial phyla in the RO and RW rotation systems. Table S6: Soil bacterial alpha diversity across the crop rotation and fertilization treatments.
Author Contributions
Conceptualization, Q.Z. and C.L.; methodology, Q.Z., M.L., W.C. and C.L.; software, Q.Z., W.Y., S.H. and Y.J.; validation, Q.Z., G.L. and W.Y.; formal analysis, Q.Z.; investigation, Q.Z., M.L., W.C. and J.W.; resources, C.L.; data curation, Q.Z., M.L. and J.W.; writing—original draft preparation, Q.Z.; writing—review and editing, G.L. and C.L.; visualization, Y.J.; supervision, C.L.; project administration, C.L.; funding acquisition, C.L. All authors have read and agreed to the published version of the manuscript.
Funding
This research was funded by the National Key Research and Development Program of China (2023YFD1901505) and the China Agriculture Research System (CARS-12).
Data Availability Statement
All data are available in the main text or in the Supporting Information, and the raw data are available upon request from the corresponding author. The bacterial sequence data were deposited in the NCBI Sequence Read Archive database (PRJNA1136655).
Acknowledgments
We are thankful for support from the National Agricultural Hi-Tech Zone in Shucheng County during field sampling. We also thank Wu Ji, Li Min, Bu Rongyan, and Cheng Wenlong for their help with soil and plant sampling.
Conflicts of Interest
The authors declare no conflicts of interest. The funders had no role in the design of the study; in the collection, analyses, or interpretation of data; in the writing of the manuscript; or in the decision to publish the results.
References
- He, X.; Batáry, P.; Zou, Y.; Zhou, W.; Wang, G.; Liu, Z.; Bai, Y.; Gong, S.; Zhu, Z.; Settele, J.; et al. Agricultural Diversification Promotes Sustainable and Resilient Global Rice Production. Nat. Food 2023, 4, 788–796. [Google Scholar] [CrossRef] [PubMed]
- Yang, X.; Xiong, J.; Du, T.; Ju, X.; Gan, Y.; Li, S.; Xia, L.; Shen, Y.; Pacenka, S.; Steenhuis, T.S.; et al. Diversifying Crop Rotation Increases Food Production, Reduces Net Greenhouse Gas Emissions and Improves Soil Health. Nat. Commun. 2024, 15, 198. [Google Scholar] [CrossRef]
- Van Dijk, M.; Morley, T.; Rau, M.L.; Saghai, Y. A Meta-Analysis of Projected Global Food Demand and Population at Risk of Hunger for the Period 2010–2050. Nat. Food 2021, 2, 494–501. [Google Scholar] [CrossRef] [PubMed]
- Yuan, S.; Linquist, B.A.; Wilson, L.T.; Cassman, K.G.; Stuart, A.M.; Pede, V.; Miro, B.; Saito, K.; Agustiani, N.; Aristya, V.E.; et al. Sustainable Intensification for a Larger Global Rice Bowl. Nat. Commun. 2021, 12, 7163. [Google Scholar] [CrossRef]
- Ladha, J.K.; Dawe, D.; Pathak, H.; Padre, A.T.; Yadav, R.L.; Singh, B.; Singh, Y.; Singh, Y.; Singh, P.; Kundu, A.L.; et al. How Extensive Are Yield Declines in Long-Term Rice–Wheat Experiments in Asia? Field Crops Res. 2003, 81, 159–180. [Google Scholar] [CrossRef]
- Weiser, C.; Fuß, R.; Kage, H.; Flessa, H. Do Farmers in Germany Exploit the Potential Yield and Nitrogen Benefits from Preceding Oilseed Rape in Winter Wheat Cultivation? Arch. Agron. Soil Sci. 2018, 64, 25–37. [Google Scholar] [CrossRef]
- Zhang, H.; Luo, G.; Wang, Y.; Fei, J.; Xiangmin, R.; Peng, J.; Tian, C.; Zhang, Y. Crop Rotation-Driven Change in Physicochemical Properties Regulates Microbial Diversity, Dominant Components, and Community Complexity in Paddy Soils. Agric. Ecosyst. Environ. 2023, 343, 108278. [Google Scholar] [CrossRef]
- Fang, Y.; Ren, T.; Zhang, S.; Liu, Y.; Liao, S.; Li, X.; Cong, R.; Lu, J. Rotation with Oilseed Rape as the Winter Crop Enhances Rice Yield and Improves Soil Indigenous Nutrient Supply. Soil Tillage Res. 2021, 212, 105065. [Google Scholar] [CrossRef]
- Zhu, Y.; Liao, S.P.; Liu, Y.; Li, X.K.; Ren, T.; Cong, R.H.; Lu, J.W. Differences of annual nutrient budgets between rapeseed–rice and wheat–rice rotations in the Yangtze River Basin. J. Plant Nutr. Fertil. 2019, 25, 64–73. [Google Scholar] [CrossRef]
- Kong, F.; Zhang, X.; Zhu, Y.; Yang, H.; Li, F. Alternate Wetting and Drying Irrigation Reduces P Availability in Paddy Soil Irrespective of Straw Incorporation. Agronomy 2022, 12, 1718. [Google Scholar] [CrossRef]
- Igwe, C.A.; Zarei, M.; Stahr, K. Fe and Al Oxides Distribution in Some Ultisols and Inceptisols of Southeastern Nigeria in Relation to Soil Total Phosphorus. Environ. Earth Sci. 2010, 60, 1103–1111. [Google Scholar] [CrossRef]
- Von Tucher, S.; Hörndl, D.; Schmidhalter, U. Interaction of Soil pH and Phosphorus Efficacy: Long-Term Effects of P Fertilizer and Lime Applications on Wheat, Barley, and Sugar Beet. Ambio 2018, 47, 41–49. [Google Scholar] [CrossRef]
- Jin, J.; Fang, Y.; Liu, C.; Eltohamy, K.M.; He, S.; Li, F.; Lu, Y.; Liang, X. Reduced Colloidal Phosphorus Release from Paddy Soils: A Synergistic Effect of Micro-/Nano-Sized Biochars and Intermittent Anoxic Condition. Sci. Total Environ. 2023, 905, 167104. [Google Scholar] [CrossRef]
- Lan, Z.M.; Lin, X.J.; Wang, F.; Zhang, H.; Chen, C.R. Phosphorus Availability and Rice Grain Yield in a Paddy Soil in Response to Long-Term Fertilization. Biol. Fertil. Soils 2012, 48, 579–588. [Google Scholar] [CrossRef]
- Hou, E.; Luo, Y.; Kuang, Y.; Chen, C.; Lu, X.; Jiang, L.; Luo, X.; Wen, D. Global Meta-Analysis Shows Pervasive Phosphorus Limitation of Aboveground Plant Production in Natural Terrestrial Ecosystems. Nat. Commun. 2020, 11, 637. [Google Scholar] [CrossRef]
- Wang, Y.; Zhao, X.; Wang, L.; Zhao, P.-H.; Zhu, W.-B.; Wang, S.-Q. Phosphorus Fertilization to the Wheat-Growing Season Only in a Rice–Wheat Rotation in the Taihu Lake Region of China. Field Crops Res. 2016, 198, 32–39. [Google Scholar] [CrossRef]
- Wang, Y.; Zhang, H.; Zhang, Y.; Fei, J.; Xiangmin, R.; Peng, J.; Luo, G. Crop Rotation-Driven Changes in Rhizosphere Metabolite Profiles Regulate Soil Microbial Diversity and Functional Capacity. Agric. Ecosyst. Environ. 2023, 358, 108716. [Google Scholar] [CrossRef]
- Lyu, Y.; Tang, H.; Li, H.; Zhang, F.; Rengel, Z.; Whalley, W.R.; Shen, J. Major Crop Species Show Differential Balance between Root Morphological and Physiological Responses to Variable Phosphorus Supply. Front. Plant Sci. 2016, 7, 1939. [Google Scholar] [CrossRef]
- Łukowiak, R.; Grzebisz, W.; Sassenrath, G.F. New Insights into Phosphorus Management in Agriculture—A Crop Rotation Approach. Sci. Total Environ. 2016, 542, 1062–1077. [Google Scholar] [CrossRef]
- Xu, X.; Mao, X.; Van Zwieten, L.; Niazi, N.K.; Lu, K.; Bolan, N.S.; Wang, H. Wetting-Drying Cycles during a Rice-Wheat Crop Rotation Rapidly (Im)Mobilize Recalcitrant Soil Phosphorus. J. Soils Sediments 2020, 20, 3921–3930. [Google Scholar] [CrossRef]
- De Vries, F.T.; Griffiths, R.I.; Knight, C.G.; Nicolitch, O.; Williams, A. Harnessing Rhizosphere Microbiomes for Drought-Resilient Crop Production. Science 2020, 368, 270–274. [Google Scholar] [CrossRef] [PubMed]
- Rawat, P.; Das, S.; Shankhdhar, D.; Shankhdhar, S.C. Phosphate-Solubilizing Microorganisms: Mechanism and Their Role in Phosphate Solubilization and Uptake. J. Soil Sci. Plant Nutr. 2021, 21, 49–68. [Google Scholar] [CrossRef]
- Singh, B.K.; Trivedi, P.; Egidi, E.; Macdonald, C.A.; Delgado-Baquerizo, M. Crop Microbiome and Sustainable Agriculture. Nat. Rev. Microbiol. 2020, 18, 601–602. [Google Scholar] [CrossRef]
- Song, D.; Dai, X.; Guo, T.; Cui, J.; Zhou, W.; Huang, S.; Shen, J.; Liang, G.; He, P.; Wang, X.; et al. Organic Amendment Regulates Soil Microbial Biomass and Activity in Wheat-Maize and Wheat-Soybean Rotation Systems. Agric. Ecosyst. Environ. 2022, 333, 107974. [Google Scholar] [CrossRef]
- Liu, Y.; Liu, R.; Ghimire, R.; Zhang, N.; Zhou, S.; Zhao, F.; Wang, J. Linking Soil Phosphorus Fractions to Associated Microbial Functional Profiles under Crop Rotation on the Loess Plateau of China. Soil Tillage Res. 2023, 233, 105809. [Google Scholar] [CrossRef]
- Peng, Y.; Duan, Y.; Huo, W.; Xu, M.; Yang, X.; Wang, X.; Wang, B.; Blackwell, M.S.A.; Feng, G. Soil Microbial Biomass Phosphorus Can Serve as an Index to Reflect Soil Phosphorus Fertility. Biol. Fertil. Soils 2021, 57, 657–669. [Google Scholar] [CrossRef]
- Wang, K.; Ren, T.; Yan, J.; Zhu, D.; Liao, S.; Zhang, Y.; Lu, Z.; Cong, R.; Li, X.; Lu, J. Straw Returning Mediates Soil Microbial Biomass Carbon and Phosphorus Turnover to Enhance Soil Phosphorus Availability in a Rice-Oilseed Rape Rotation with Different Soil Phosphorus Levels. Agric. Ecosyst. Environ. 2022, 335, 107991. [Google Scholar] [CrossRef]
- Raymond, N.S.; Gómez-Muñoz, B.; Van Der Bom, F.J.T.; Nybroe, O.; Jensen, L.S.; Müller-Stöver, D.S.; Oberson, A.; Richardson, A.E. Phosphate-solubilising Microorganisms for Improved Crop Productivity: A Critical Assessment. New Phytol. 2021, 229, 1268–1277. [Google Scholar] [CrossRef] [PubMed]
- Zhang, D.; Kuzyakov, Y.; Zhu, H.; Alharbi, H.A.; Li, H.; Rengel, Z. Increased Microbial Biomass and Turnover Underpin Efficient Phosphorus Acquisition by Brassica Chinensis. Soil Tillage Res. 2022, 223, 105492. [Google Scholar] [CrossRef]
- Hummel, C.; Boitt, G.; Santner, J.; Lehto, N.J.; Condron, L.; Wenzel, W.W. Co-Occurring Increased Phosphatase Activity and Labile P Depletion in the Rhizosphere of Lupinus Angustifolius Assessed with a Novel, Combined 2D-Imaging Approach. Soil Biol. Biochem. 2021, 153, 107963. [Google Scholar] [CrossRef]
- Lu, J.; Jia, P.; Feng, S.; Wang, Y.; Zheng, J.; Ou, S.; Wu, Z.; Liao, B.; Shu, W.; Liang, J.; et al. Remarkable Effects of Microbial Factors on Soil Phosphorus Bioavailability: A Country-scale Study. Glob. Change Biol. 2022, 28, 4459–4471. [Google Scholar] [CrossRef] [PubMed]
- Dai, Z.; Liu, G.; Chen, H.; Chen, C.; Wang, J.; Ai, S.; Wei, D.; Li, D.; Ma, B.; Tang, C.; et al. Long-Term Nutrient Inputs Shift Soil Microbial Functional Profiles of Phosphorus Cycling in Diverse Agroecosystems. ISME J. 2020, 14, 757–770. [Google Scholar] [CrossRef] [PubMed]
- Wang, S.; Song, M.; Wang, C.; Dou, X.; Wang, X.; Li, X. Mechanisms Underlying Soil Microbial Regulation of Available Phosphorus in a Temperate Forest Exposed to Long-Term Nitrogen Addition. Sci. Total Environ. 2023, 904, 166403. [Google Scholar] [CrossRef]
- Wu, X.; Rensing, C.; Han, D.; Xiao, K.-Q.; Dai, Y.; Tang, Z.; Liesack, W.; Peng, J.; Cui, Z.; Zhang, F. Genome-Resolved Metagenomics Reveals Distinct Phosphorus Acquisition Strategies between Soil Microbiomes. mSystems 2022, 7, e01107-21. [Google Scholar] [CrossRef] [PubMed]
- Wang, H.; Chen, J.; Ruan, Y.; Sun, W.; Wang, S.; Wang, H.; Zhang, Y.; Guo, J.; Wang, Y.; Guo, H.; et al. Metagenomes Reveal the Effect of Crop Rotation Systems on Phosphorus Cycling Functional Genes and Soil Phosphorus Avail–Ability. Agric. Ecosyst. Environ. 2024, 364, 108886. [Google Scholar] [CrossRef]
- IUSS Working Group WRB. World Reference Base for Soil Resources 2022: International Soil Classification System for Naming Soils and Creating Legends for Soil Maps, 4th ed.; International Union of Soil Sciences: Vienna, Austria, 2022; ISBN 979-8-9862451-1-9. [Google Scholar]
- Bu, R.; Han, S.; Cheng, W.; Wu, Y.; Tang, S.; Li, M.; Wang, H.; Ge, Z.; Wu, J. Deciphering the Role of Particulate Organic Matter in Soil Nitrogen Transformation in Rice–Rapeseed and Rice–Wheat Rotation Systems. Appl. Soil Ecol. 2024, 193, 105146. [Google Scholar] [CrossRef]
- Olsen, S.R. Estimation of Available Phosphorus in Soils by Extraction with Sodium Bicarbonate; No. 939; Circular/United States Department of Agriculture: Washington, DC, USA, 1954.
- Bell, C.W.; Fricks, B.E.; Rocca, J.D.; Steinweg, J.M.; McMahon, S.K.; Wallenstein, M.D. High-Throughput Fluorometric Measurement of Potential Soil Extracellular Enzyme Activities. JoVE 2013, 81, 50961. [Google Scholar] [CrossRef]
- Wu, J.; Joergensen, R.G.; Pommerening, B.; Chaussod, R.; Brookes, P.C. Measurement of Soil Microbial Biomass C by Fumigation-Extraction—An Automated Procedure. Soil Biol. Biochem. 1990, 22, 1167–1169. [Google Scholar] [CrossRef]
- Thomas, R.L.; Sheard, R.W.; Moyer, J.R. Comparison of Conventional and Automated Procedures for Nitrogen, Phosphorus, and Potassium Analysis of Plant Material Using a Single Digestion1. Agron. J. 1967, 59, 240–243. [Google Scholar] [CrossRef]
- Caicedo, H.H.; Hashimoto, D.A.; Caicedo, J.C.; Pentland, A.; Pisano, G.P. Overcoming Barriers to Early Disease Intervention. Nat. Biotechnol. 2020, 38, 669–673. [Google Scholar] [CrossRef]
- Ryan, M.H.; Kirkegaard, J.A.; Angus, J.F. Brassica Crops Stimulate Soil Mineral N Accumulation. Soil Res. 2006, 44, 367. [Google Scholar] [CrossRef]
- Yang, B.; Zhang, K.; Jin, X.; Yan, J.; Lu, S.; Shen, Q.; Guo, L.; Hong, Y.; Wang, X.; Guo, L. Acylation of Non-specific Phospholipase C4 Determines Its Function in Plant Response to Phosphate Deficiency. Plant J. 2021, 106, 1647–1659. [Google Scholar] [CrossRef]
- Yang, B.; Li, J.; Yan, J.; Zhang, K.; Ouyang, Z.; Lu, Y.; Wei, H.; Li, Q.; Yao, X.; Lu, S.; et al. Non-specific Phospholipase C4 Hydrolyzes Phosphosphingolipids and Phosphoglycerolipids and Promotes Rapeseed Growth and Yield. J. Integr. Plant Biol. 2023, 65, 2421–2436. [Google Scholar] [CrossRef]
- Richardson, A.E.; Simpson, R.J. Soil Microorganisms Mediating Phosphorus Availability Update on Microbial Phosphorus. Plant Physiol. 2011, 156, 989–996. [Google Scholar] [CrossRef] [PubMed]
- Liu, J.; Xu, W.; Zhang, Q.; Liao, W.; Li, L.; Chen, S.; Yang, J.; Wang, Z.; Xu, F. OsPHR2-Mediated Recruitment of Pseudomonadaceae Enhances Rice Phosphorus Uptake. Plant Commun. 2024, 5, 100930. [Google Scholar] [CrossRef]
- Liu, J.; Li, F.Y.; Liu, J.; Wang, S.; Liu, H.; Ding, Y.; Ji, L. Grazing Promotes Soil Phosphorus Cycling by Enhancing Soil Microbial Functional Genes for Phosphorus Transformation in Plant Rhizosphere in a Semi-Arid Natural Grassland. Geoderma 2023, 430, 116303. [Google Scholar] [CrossRef]
- Liu, S.; Zeng, J.; Yu, H.; Wang, C.; Yang, Y.; Wang, J.; He, Z.; Yan, Q. Antimony Efflux Underpins Phosphorus Cycling and Resistance of Phosphate-Solubilizing Bacteria in Mining Soils. ISME J. 2023, 17, 1278–1289. [Google Scholar] [CrossRef] [PubMed]
- Rasul, M.; Yasmin, S.; Suleman, M.; Zaheer, A.; Reitz, T.; Tarkka, M.T.; Islam, E.; Mirza, M.S. Glucose Dehydrogenase Gene Containing Phosphobacteria for Biofortification of Phosphorus with Growth Promotion of Rice. Microbiol. Res. 2019, 223–225, 1–12. [Google Scholar] [CrossRef]
- Shi, Y.; Delgado-Baquerizo, M.; Li, Y.; Yang, Y.; Zhu, Y.-G.; Peñuelas, J.; Chu, H. Abundance of Kinless Hubs within Soil Microbial Networks Are Associated with High Functional Potential in Agricultural Ecosystems. Environ. Int. 2020, 142, 105869. [Google Scholar] [CrossRef]
- He, J.; He, J.; Li, H.; Yu, Y.; Qian, L.; Tang, L.; Zheng, Y.; Xiao, J. Continuous Intercropping Increases the Depletion of Soil Available and Non-Labile Phosphorus. Agronomy 2024, 14, 1121. [Google Scholar] [CrossRef]
- Nerger, R.; Klüver, K.; Cordsen, E.; Fohrer, N. Intensive Long-Term Monitoring of Soil Organic Carbon and Nutrients in Northern Germany. Nutr. Cycl. Agroecosyst. 2020, 116, 57–69. [Google Scholar] [CrossRef]
- Fischer, P.; Pöthig, R.; Venohr, M. The Degree of Phosphorus Saturation of Agricultural Soils in Germany: Current and Future Risk of Diffuse P Loss and Implications for Soil P Management in Europe. Sci. Total Environ. 2017, 599–600, 1130–1139. [Google Scholar] [CrossRef] [PubMed]


Disclaimer/Publisher’s Note: The statements, opinions and data contained in all publications are solely those of the individual author(s) and contributor(s) and not of MDPI and/or the editor(s). MDPI and/or the editor(s) disclaim responsibility for any injury to people or property resulting from any ideas, methods, instructions or products referred to in the content. |
© 2025 by the authors. Licensee MDPI, Basel, Switzerland. This article is an open access article distributed under the terms and conditions of the Creative Commons Attribution (CC BY) license (https://creativecommons.org/licenses/by/4.0/).