Abstract
Soil barrenness and a poor stability of organic carbon are important factors restricting sustainable agricultural development. The effects of straw incorporation and nitrogen (N) fertilization on soil aggregates, soil organic carbon (SOC) functional groups, iron (Fe) oxides, and SOC sequestration were evaluated in saline–alkali soil. In this study, we established six treatments involving the combined addition of straw and N in saline–alkali soil in the Yellow River Delta, China, to investigate the changes in SOC. A field experiment was conducted with two N levels (N1, 270 kg N ha−1; N2, 210 kg N ha−1) and three C treatments (S0, 0 kg ha−1; S1, 5000 kg ha−1; S2, 10,000 kg ha−1). Compared with S0 treatments, straw incorporation and N application significantly increased the proportion of small macro-aggregates, and the mean weight diameter (MWD) was increased by 8.3–18.6%. Under the N2 treatment, with an increase in straw incorporation, the contents of organically complexed Fe oxides (Fep), especially small macro-aggregates and micro-aggregates, increased significantly. Meanwhile, polysaccharides-C and aromatic-C were mainly distributed in small macro-aggregates, forming aromatic Fe complexes with Fep and remaining at the aggregate interface. Compared with the N1S0 treatment, SOC storage increased by 3.94% and 5.12% in the N2S1 and N2S2 treatments, respectively. This could primarily be attributed to an improvement in soil structure, the optimization of OC functional group composition, and the formation of organo-Fe complexes. Straw incorporation and N application were optimal management measures and improved C stability and sequestration capacity. A halved straw incorporation and a reduced N application were the best treatment options for saline–alkali soil.
1. Introduction
The carbon (C) content in saline–alkaline soil has always been low [1], and the rate of C retention is sluggish [2]. Straw incorporation is considered an efficient method of improving salinized soil conditions, as it contributes to enhancing the composition of soil [3], regulating the soil microbial community [4], and increasing agricultural productivity [5]. Straw incorporation can also maintain and increase the content of soil organic carbon (SOC) [6]. However, due to the differences in local climatic conditions, soil properties, and straw management, the effects of straw incorporation on soil C stock are contradictory under different amounts of straw incorporation [7,8]. Therefore, studying the impact of straw returning on C sequestration and soil productivity in saline–alkali areas is of great significance.
Approximately 90% of the sequestration of SOC occurs within aggregates, and SOC is unevenly distributed in aggregates of different sizes [9]. Soil aggregate stability plays an important part in assessing the accumulation and mineralization of SOC [10]. The amount of SOC present in each aggregate particle size varies and may be influenced by agricultural practices (such as the incorporation of straw, biochar, and manure), which are frequently used and are effective methods for promoting the development of aggregates and pores in soil structures [11,12]. Soil macro-aggregates exhibit a strong ability to protect SOC, and an increase in macro-aggregate levels is significantly associated with the content of SOC [13]. Simultaneously, the addition of straw contributes to enhancing the formation of soil aggregates and increases the OC content in larger aggregates [14]. Therefore, it is crucial to evaluate the impact of straw addition on the distribution of OC within aggregates in saline–alkali soil.
C cycling in soil is closely related to C sequestration and is regulated by many factors, such as mineral type and carbon functional group type [15,16]. More and more evidence suggests that iron (Fe) has a substantial influence on the process of C transformation in soil [17], including mineralization [18] and its non-biological counterparts, such as Fe oxide-mediated oxidation [19]. In certain types of soil and soil layers, the presence of iron oxide minerals has been found to be essential for the preservation of SOC, as it helps to form complexes between iron and SOC in soil [20,21,22,23]. Fe oxides with a short-range order (SRO-Fe) exhibit an enhanced surface area and increased reactivity, promoting the formation of organo-mineral complexes and enhancing SOC stability [3,24]. However, the complex interaction between organic compounds and iron minerals involves a combination of organic and mineral components. [25]. Therefore, a comprehensive study of the correlation between Fe oxides and soil C sequestration elucidating their potential mechanisms and influential factors in C cycling is of great significance for enhancing C utilization efficiency and maintaining C balance in saline–alkaline soil.
In the Yellow River Delta, an excessive nitrogen (N) application is around 50 kg ha−1 in saline–alkali soil, and a reduction of 15–25% in N input does not affect crop yield [26]. The integration of straw and N can enhance soil structure and promote aggregate stability [27], and the combination of SOC and SRO-Fe is considered a promoter of soil aggregates [28]. The response of C stability sequestration to the complexation of organic carbon (OC) and Fe oxides in saline–alkali soil after straw incorporation and N fertilization has not been widely studied [29]. The objectives of this study were as follows: (i) to explore the proportion of SOC and its functional groups in characteristic saline–alkali soil aggregates under different straw incorporation and N application treatments; (ii) to ascertain the impact of SRO-Fe oxide formation and distribution on soil aggregate stability; and (iii) to clarify the relationship between OC functional groups in saline–alkali soil and the impact of SRO-Fe oxides on C sequestration. We hypothesized that the combination of straw addition and N application could enhance the accumulation of SRO-Fe oxides and change SOC’s chemical makeup, especially in aggregates. It was postulated that the combination of straw incorporation and N application would enhance the buildup of SRO-Fe oxides and alter the chemical makeup of SOC, particularly within aggregates, which play a key role in enhancing the stability and sequestration of C in saline–alkali soil.
2. Materials and Methods
2.1. Site Description
The experiment was established in October 2021 in Yellow River delta, China (37.309722° N, 118.655556° E), with an altitude of −1.2 m. The annual precipitation usually amounts to 555.9 mm, and the highest precipitation occurs from early June to mid-September. The annual average sunshine duration is 2234.0 h, and the average daily temperature is 12.3 °C. It is situated within the warm temperate region and falls under a conventional monsoonal climatic pattern. The soil composition in this region is characterized by the presence of saline-alkali elements, which is loam clay with a relatively uniform texture and a slightly alkaline.
Detailed information about the soil characteristics of the study site before the start of the experiment in 2021 is shown in Table 1. From 2021 to 2023, two times of winter wheat and two times of summer maize have been planted. Summer maize is sowed in Mid-June harvested in October, while the growth stage of winter wheat is from mid-October to the next early June.

Table 1.
Soil properties before the establishment of the experiment in 2021.
2.2. Experimental Design
In the wheat season, 6 treatments were designed, which included two N levels (N1, traditional N application, 270.0 kg N ha−1; N2, reduced N application, 210.0 kg N ha−1) and three C treatments (S0, no returning, 0.0 kg straw ha−1, 0.0 kg C ha−1; S1, half return of straw, 10,752.7 kg straw ha−1, 5000.0 kg C ha−1; S2, total return of straw, 21,505.4 kg straw ha−1, 10,000.0 kg C ha−1), respectively. Each treatment had 3 replicates, and there were 18 plots in total, which were in completely random block arrangement. Except N fertilizer, all the treatments used equal amounts of K fertilizer and P fertilizer, as 135 kg K2O ha−1 and 105 kg P2O5 ha−1, respectively. In the maize season, two N levels (traditional N1 application, 210.0 kg N ha−1; reduced N2 application, 180.0 kg N ha−1) were also designed, besides that, equal amounts of phosphorus and potassium fertilizer (105 kg P2O5 ha−1 and 135 kg K2O ha−1) were applied for each treatment. During the maize season, all wheat stalks were returned to the field without the application of additional interventions. Each plot was 8.0 m in width and 6.0 m in length, resulting in a total area of 48.0 m2. Additionally, the isolation rows measuring of 1.0 m were established around each individual plot.
The phosphate was superphosphate (P2O5 12%), N fertilizer applied was urea (N 46%), and potassium was potassium sulfate (K2O 52%). All fertilizers are ploughed into the soil. For N fertilizer application, 70% was applied as basal dressing, with the remaining 30% topdressed at the wheat greening stage (Zadoks growth stage GS25-29) [30]. The wheat variety was “Jimai 22”, the sowing of which was mechanized with a row spacing of 18.0 cm. The sowing amount was 300.0 kg ha−1. According to the soil moisture content, seeds were sown around the middle of October each year. The straw is chopped into 5–10 cm pieces, the straw is turned deep into the soil (15–30 cm) using a turning plow, and suppressed with the compaction machinery after sowing to ensure soil contact and ensure wheat germination rate. Irrigation water used groundwater with spray irrigation, without herbicides and pesticides. Specific sampling of crops is performed artificially at physiological maturity (wheat: 20–25% grain moisture; Corn: Milk line disappeared). Harvest in the designated plots (≥3 repetitions per treatment) and separate the grains and stalks, dry and weigh.
2.3. Soil Sampling and Soil Aggregate Sieving
After maize harvest in October 2023, soil sampling (0–20 cm) involving the six treatments were carried out using diagonal sampling. Five soil samples were collected with a soil drill (2.7 cm in diameter) in each plot, the 5 samples in the same plot were mixed into a composite sample. The soil samples that were obtained were separated into two portions: one soil sample was promptly stored at a temperature of 4 °C, and the other part was air-dried. Some of the air-dried samples were used for direct screening of soil aggregates and the determination of SOC fractions, while the other samples were screened by 0.25 mm and 2.00 mm to determine soil pH, TN, AP and other physical and chemical properties.
Soil aggregates were measured as described [31]. The plastic box is utilized to enclose the soil profile (0–20 cm), preventing compression, vibration, and preserving the inherent structure of the soil in its natural state. After undergoing natural air-drying, the soil sample was delicately fractured at its inherent fracture point to assess the categorization of soil aggregates while ensuring minimal disruption to the soil structure. The soil is passed through three sieves in sequence (2 mm, 0.25 mm and 0.053 mm). The soil is divided into four different parts: (i) large macro-aggregates (>2 mm); small macro-aggregates (2–0.25 mm); (iii) microaggregates (0.25–0.053 mm) and silt + clay (<0.053 mm). The 3 sieves corresponding to these size categories were arranged in vertical order. Place 200.0 g of soil sample in the first sieve in the bucket and leave it to moisten for 10 min. At the end of wet screening, the soil remaining on each sieve was individually gathered and subjected to drying at 55 °C for further analysis [32]. Soil aggregate stability was quantified using the mean weight diameter (MWD) [11].
The average weight diameter (MWD, mm) was calculated by the following formula:
Xi represents the average diameter of the four different fractions of aggregates; Wi means the proportion of aggregate fractions that remain on each sieve.
2.4. Soil Chemical Analysis
The conductivity meter (EC) (DDS-11A, Shanghai, China) and pH meter (Mettler-Toledo FE 20, Greifensee, Switzerland) were used to measure EC and pH, respectively,
The Kjeldahl digestion method was employed to analyze the content of TN. The AP was obtained using a 0.5 M solution of NaHCO3 [2]. The AK content was obtained using 1.0 M NH4OAC as the extracting agent. An aluminum box was employed to determine soil bulk density (BD). The dithionite-citrate bicarbonate (DCB) method was employed to extract Fe oxides (Fed) [22]. The extraction of Feo, which refered to the oxides with poor crystallinity, was carried out utilizing the ammonium oxalate technique [29]. The fraction of Fe oxides (Fep) bound in an organic manner was extracted by employing sodium pyrophosphate [14].
2.5. Fourier Transform Infrared (FTIR) Spectroscopy
Fourier transform infrared spectroscopy (FTIR) was used to analyze soil components and C functional groups in soil aggregates (Bruker, Hamburg, Germany). The KBr pellets required for the experiment were prepared by combining dried and ground composite samples (particle size less than 0.15 mm) with powdered KBr, using a ratio of 1.0 mg sample per 100.0 mg−1 KBr. These samples were pulverized using a mortar made of agate and subjected to drying for 24 h at a temperature of 105 °C. The spectra were recorded by averaging 32 scans, encompassing a spectral range of 400 to 4000 cm−1 with a resolution of 4.0 cm−1. A semi-quantitative analysis was conducted to investigate the functional groups linked with OC [33]. The OPUS 8.5 spectrometer software (Bruker) was utilized to integrate the areas of the FTIR spectral absorption bands.
2.6. Calculation and Data Analysis
All statistical analysis was performed using the SPSS 18.0 software package specifically developed for Windows (SPSS Inc., Chicago, IL, USA). The variability across various aggregate size fractions was evaluated through a two-factor analysis of variance, while the assessment of differences in variability among various treatments was conducted through t-test. The associations between SOC and Fe oxides in aggregate samples were examined using Pearson’s correlations. The Canoco 5 software was utilized to conduct Redundancy analysis (RDA).
3. Results
3.1. Soil Physical and Chemical Properties
Compared with S0 treatment, under N1 level, the content of soil TN in S1 and S2 was increased by 2.1% and 14.7%, respectively, while under N2 level, it was increased by 12.4% and 18.0%, respectively (p < 0.001, Table 2). Under both N1 and N2 levels, there was a positive correlation between soil AP content and the amount of straw returning (p < 0.05, Table 2). Under N2 level, in comparison to S0 treatment, soil EC in S1 and S2 exhibited a decrease of 5.7% and 5.1%, respectively (p < 0.05, Table 2). Simultaneously, within S1 treatments, when compared with N1 level, the EC value in N2 level was reduced by 5.9% (p < 0.05, Table 2). While soil pH remained consistent across all treatments, while compared with N1 level, it showed a decreasing tendency under N2 level. Soil BD showed a similar trend as pH, which showed no significant differences among the 6 treatments.
Table 2.
Results of two-way ANOVA for soil physiochemical properties.
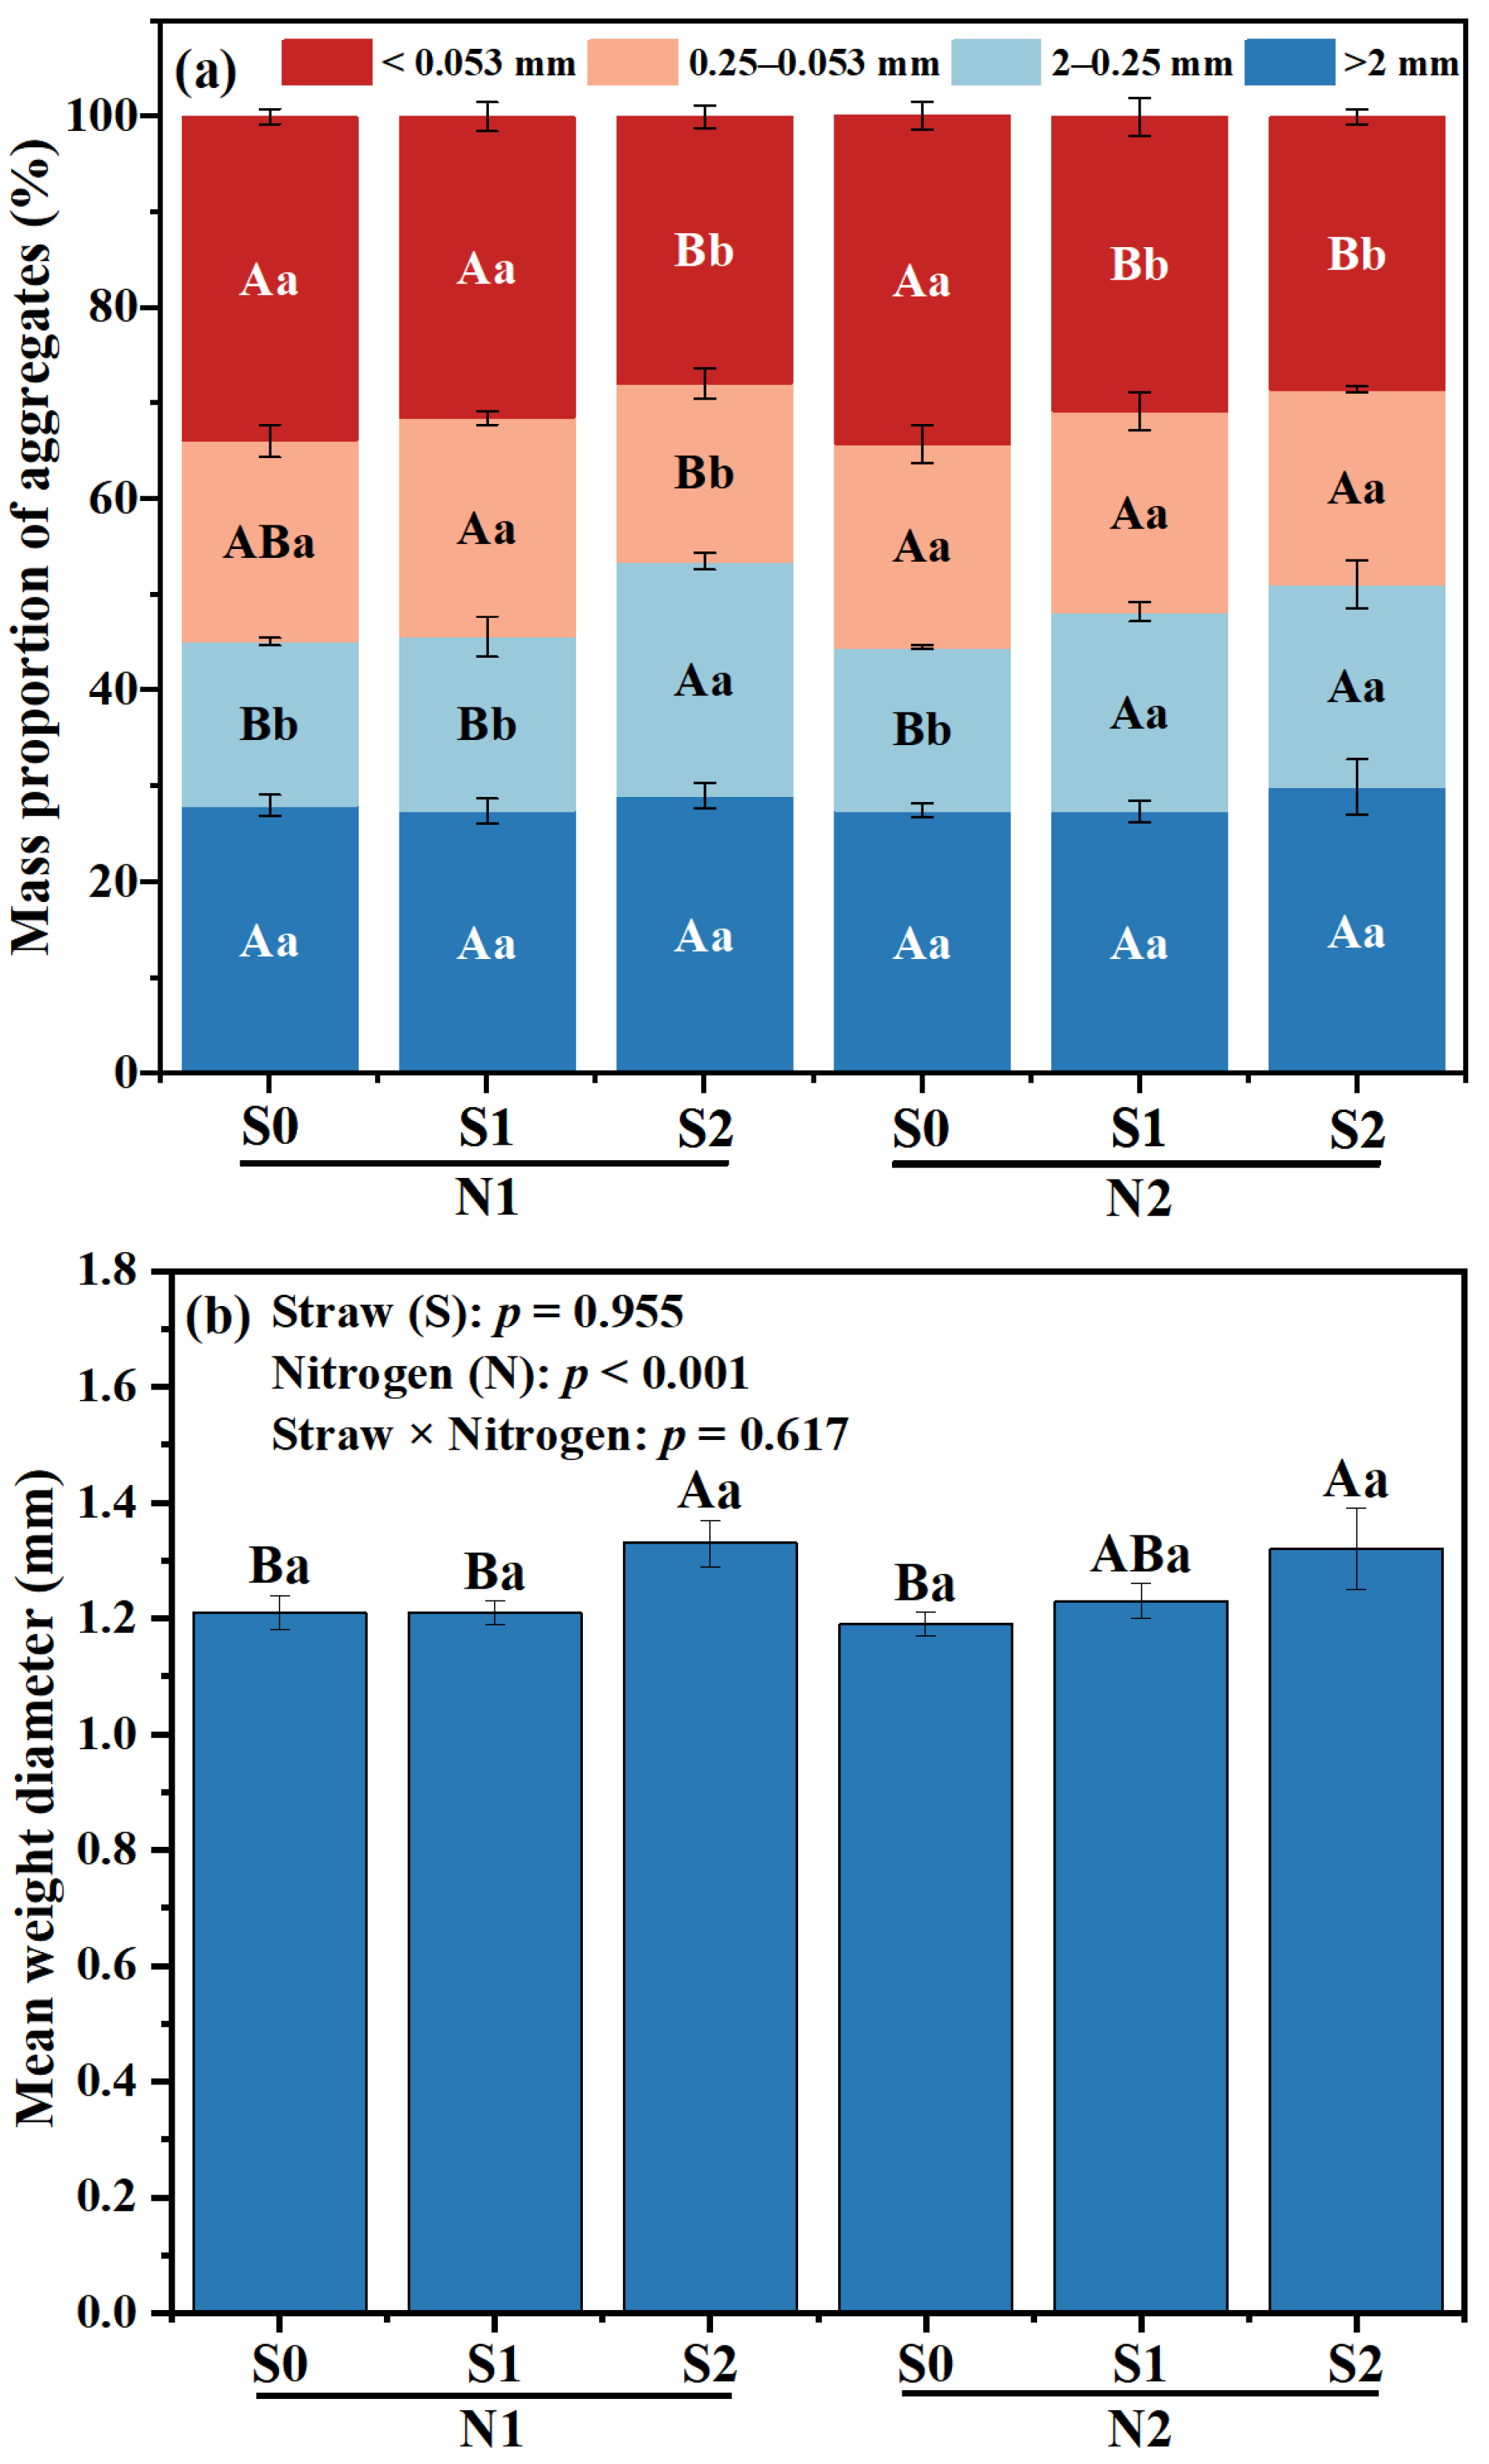
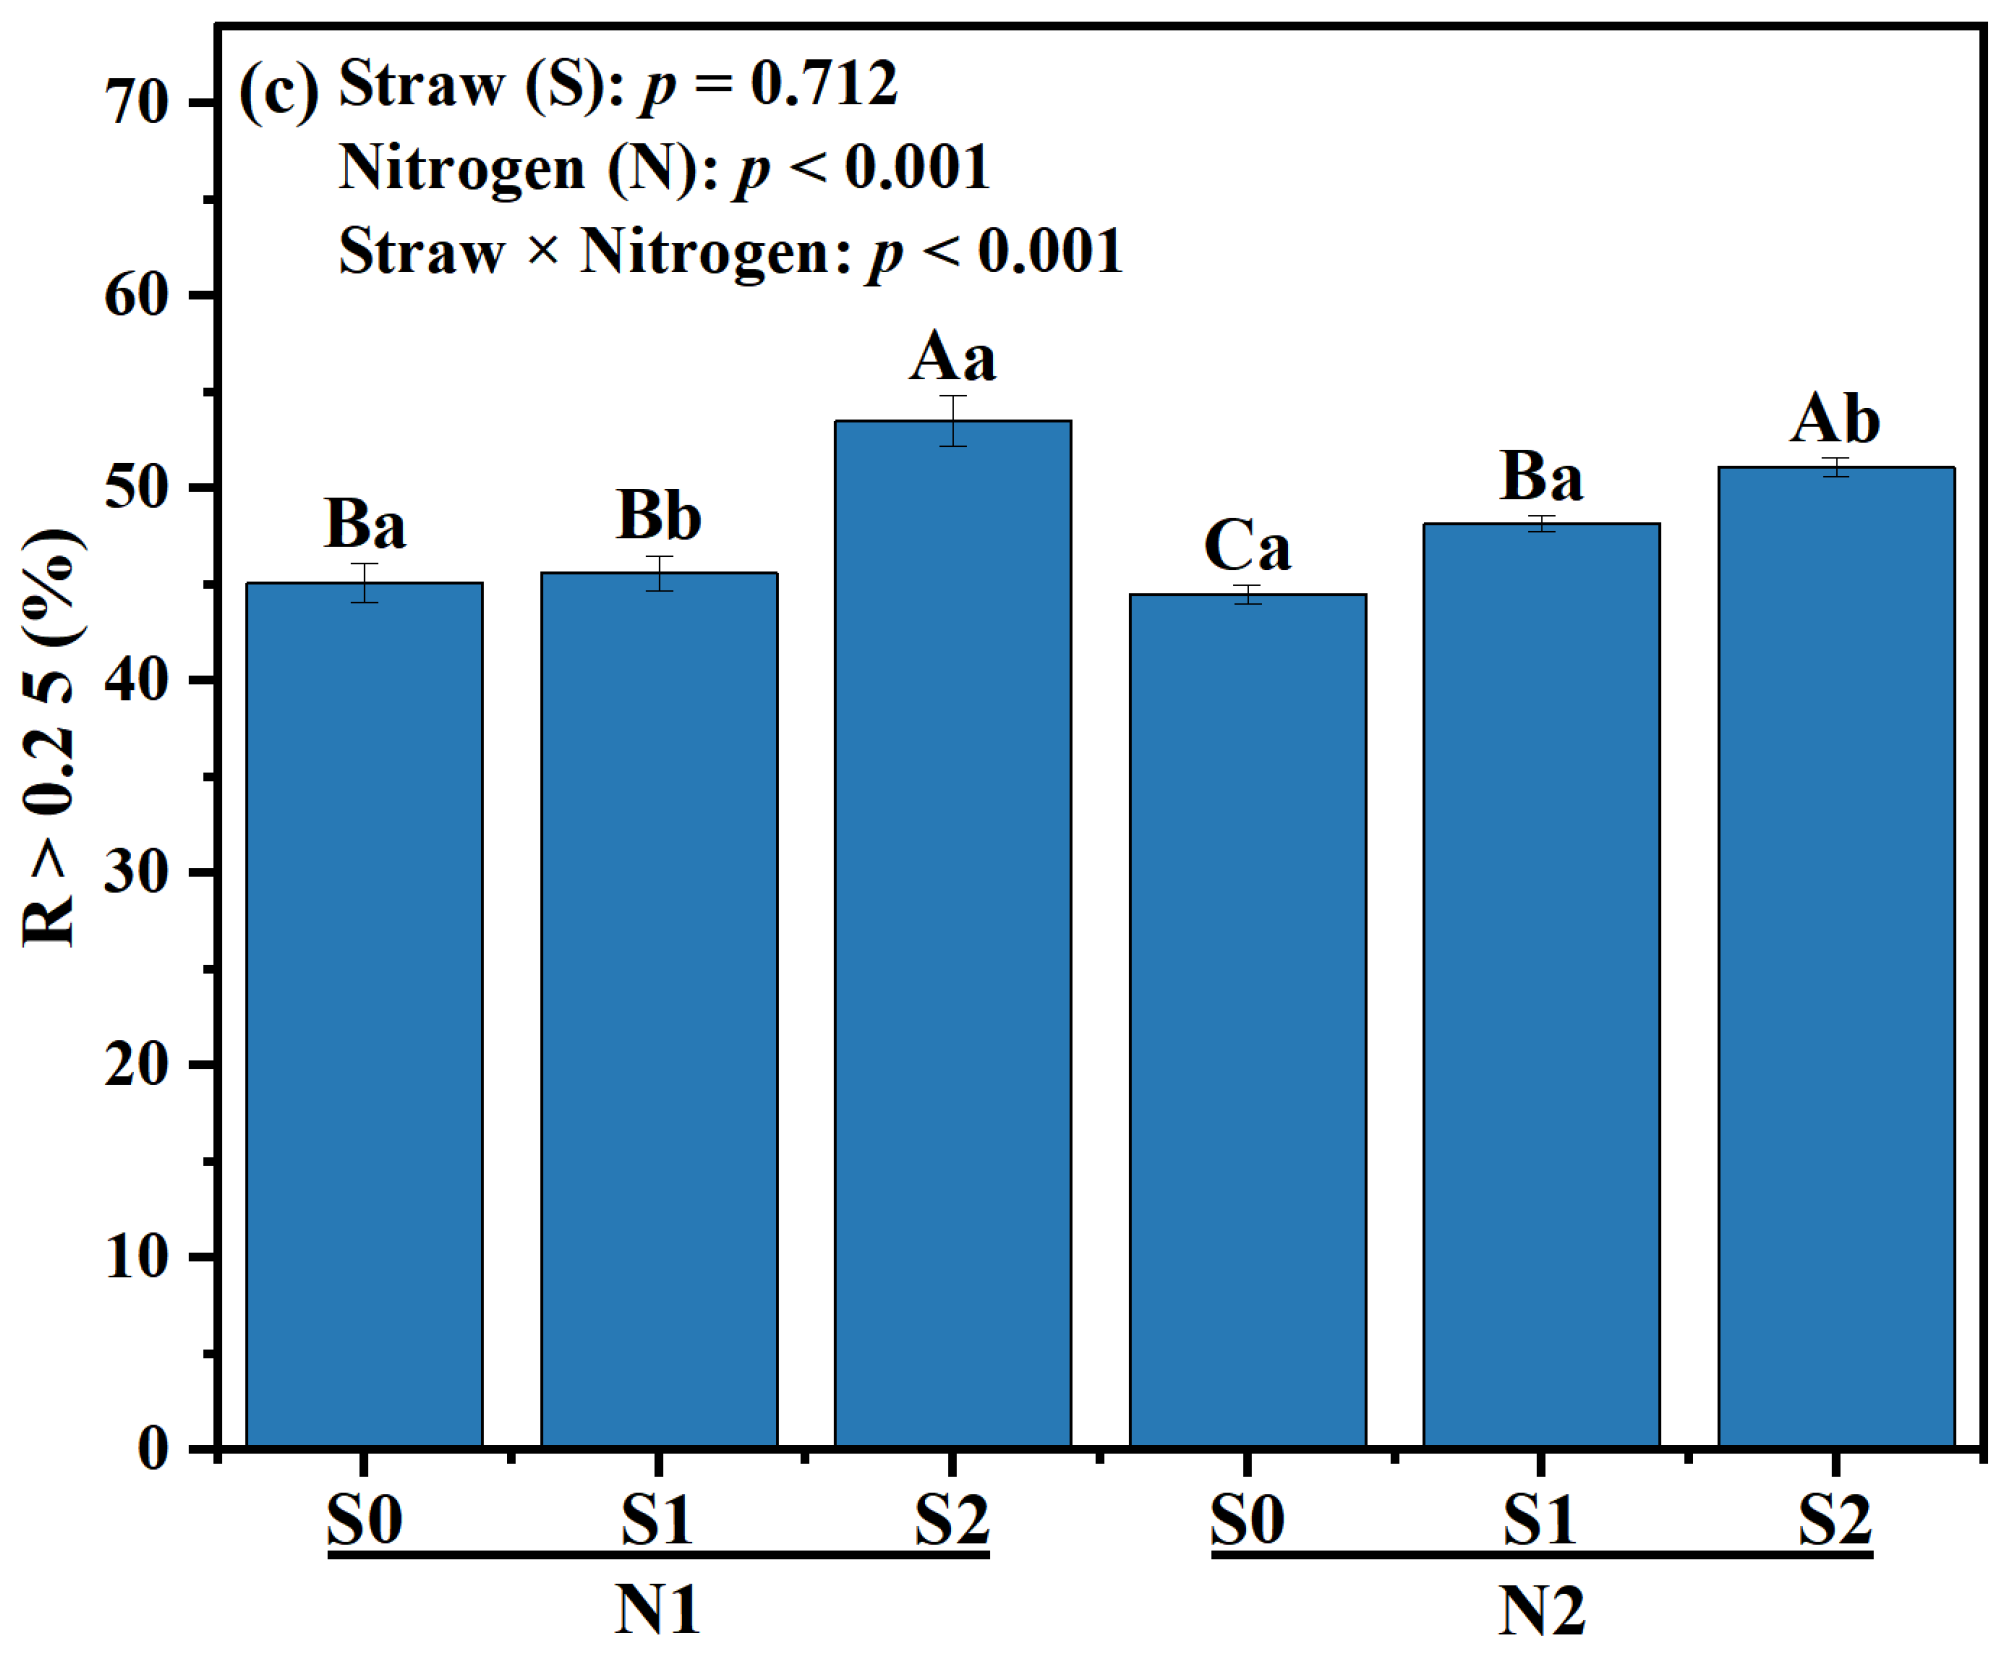
Under the same N level, no significant differences in the formation of large macro-aggregates were observed among the various straw returning treatments (Figure 1). The percentage of small macro-aggregates in S1 and S2 was higher than that in S0 treatment (p < 0.05), while there was a reduction in the proportion of micro-aggregates, as well as silt and clay fractions (Figure 1a). Within the two N levels, the proportion of small macro-aggregates in S1 treatment was higher than that in S0 treatment, whereas S2 treatment showed the highest proportion of micro-aggregates (p < 0.05). Under the same N level, the increase in the proportion of macro-aggregates and micro-aggregates was observed in both S1 and S2 treatments, indicating a significant change (p < 0.05).
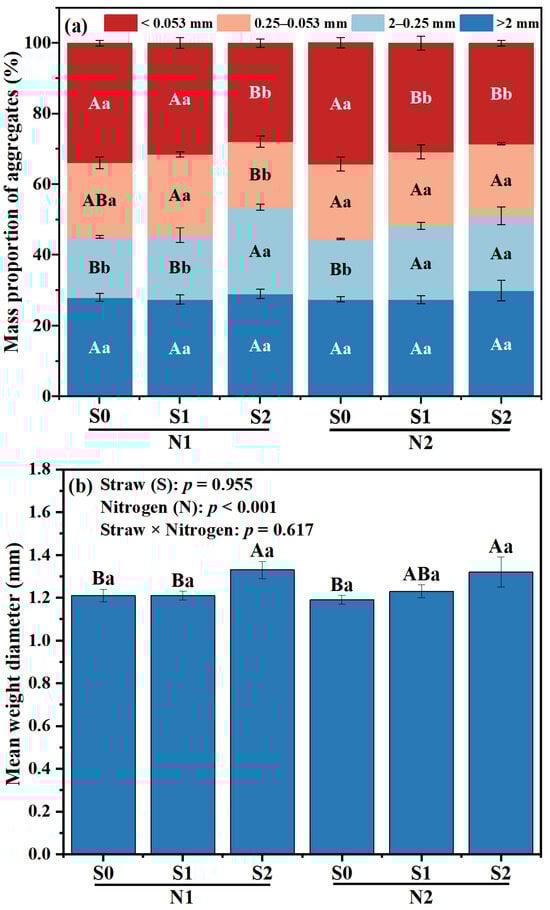

Figure 1.
Effects of different fertilizer regimes on saline alkaline soils (a) aggregate size distribution, (b) mean weight diameter, and (c) R > 0.25. The different capital letters indicate significant difference among straw input amounts of the same N application at p < 0.05. Different lowercase letters indicated a significant difference among N application amounts of the same straw input at p < 0.05. N1 and N2 referred to N fertilization at 270 and 210 kg N ha−1, respectively. S0, S1 and S2 refer to straw returning levels at 0, 5000 and 10,000 kg C ha−1. MWD, mean weight diameter; R > 0.25, percentage of water-stable aggregates that were greater than 0.25 mm.
Compared with N2S0, the MWD of N2S1 and N2S2 was increased by 3.36% and 10.92%, respectively (p < 0.05, Figure 1b). Under N1 level, the proportion of R > 0.25 mm aggregates in S2 treatment was the highest, which was increased by 18.63%, compared with S0 treatment. Under N2 level, the proportion of R > 0.25 mm aggregates in S1 and S2 significantly increased, which was 8.31% and 14.83% higher than that in S0 treatment, respectively (p < 0.01, Figure 1c). Compared to N1S2, the proportion of R > 0.25 mm aggregates in N2S2 treatment was decreased by 4.49% (p < 0.05, Figure 1c).
3.2. The Content of SOC in Soil Aggregates
Out of the six treatments, silt and clay particles exhibited the least amount of SOC content Among the six treatments, the lowest SOC content was found in silt and clay fractions (p < 0.05, Table 3). The OC content of macro-aggregates and micro-aggregates showed an upward trend with the application of straw incorporation below N1 level (p < 0.05, Table 3). While under N2 level, the content of OC in the above two aggregate fraction was highest in S1 treatment. Within S1 treatment, compared with N1 level, the OC content in large macro-aggregates, small macro-aggregates and micro-aggregates in N2 treatment increased by 35.95%, 14.55% and 11.06%, respectively (p < 0.05).
Table 3.
Effects of straw incorporation and N application on SOC content and stock.
3.3. OC Functional Groups
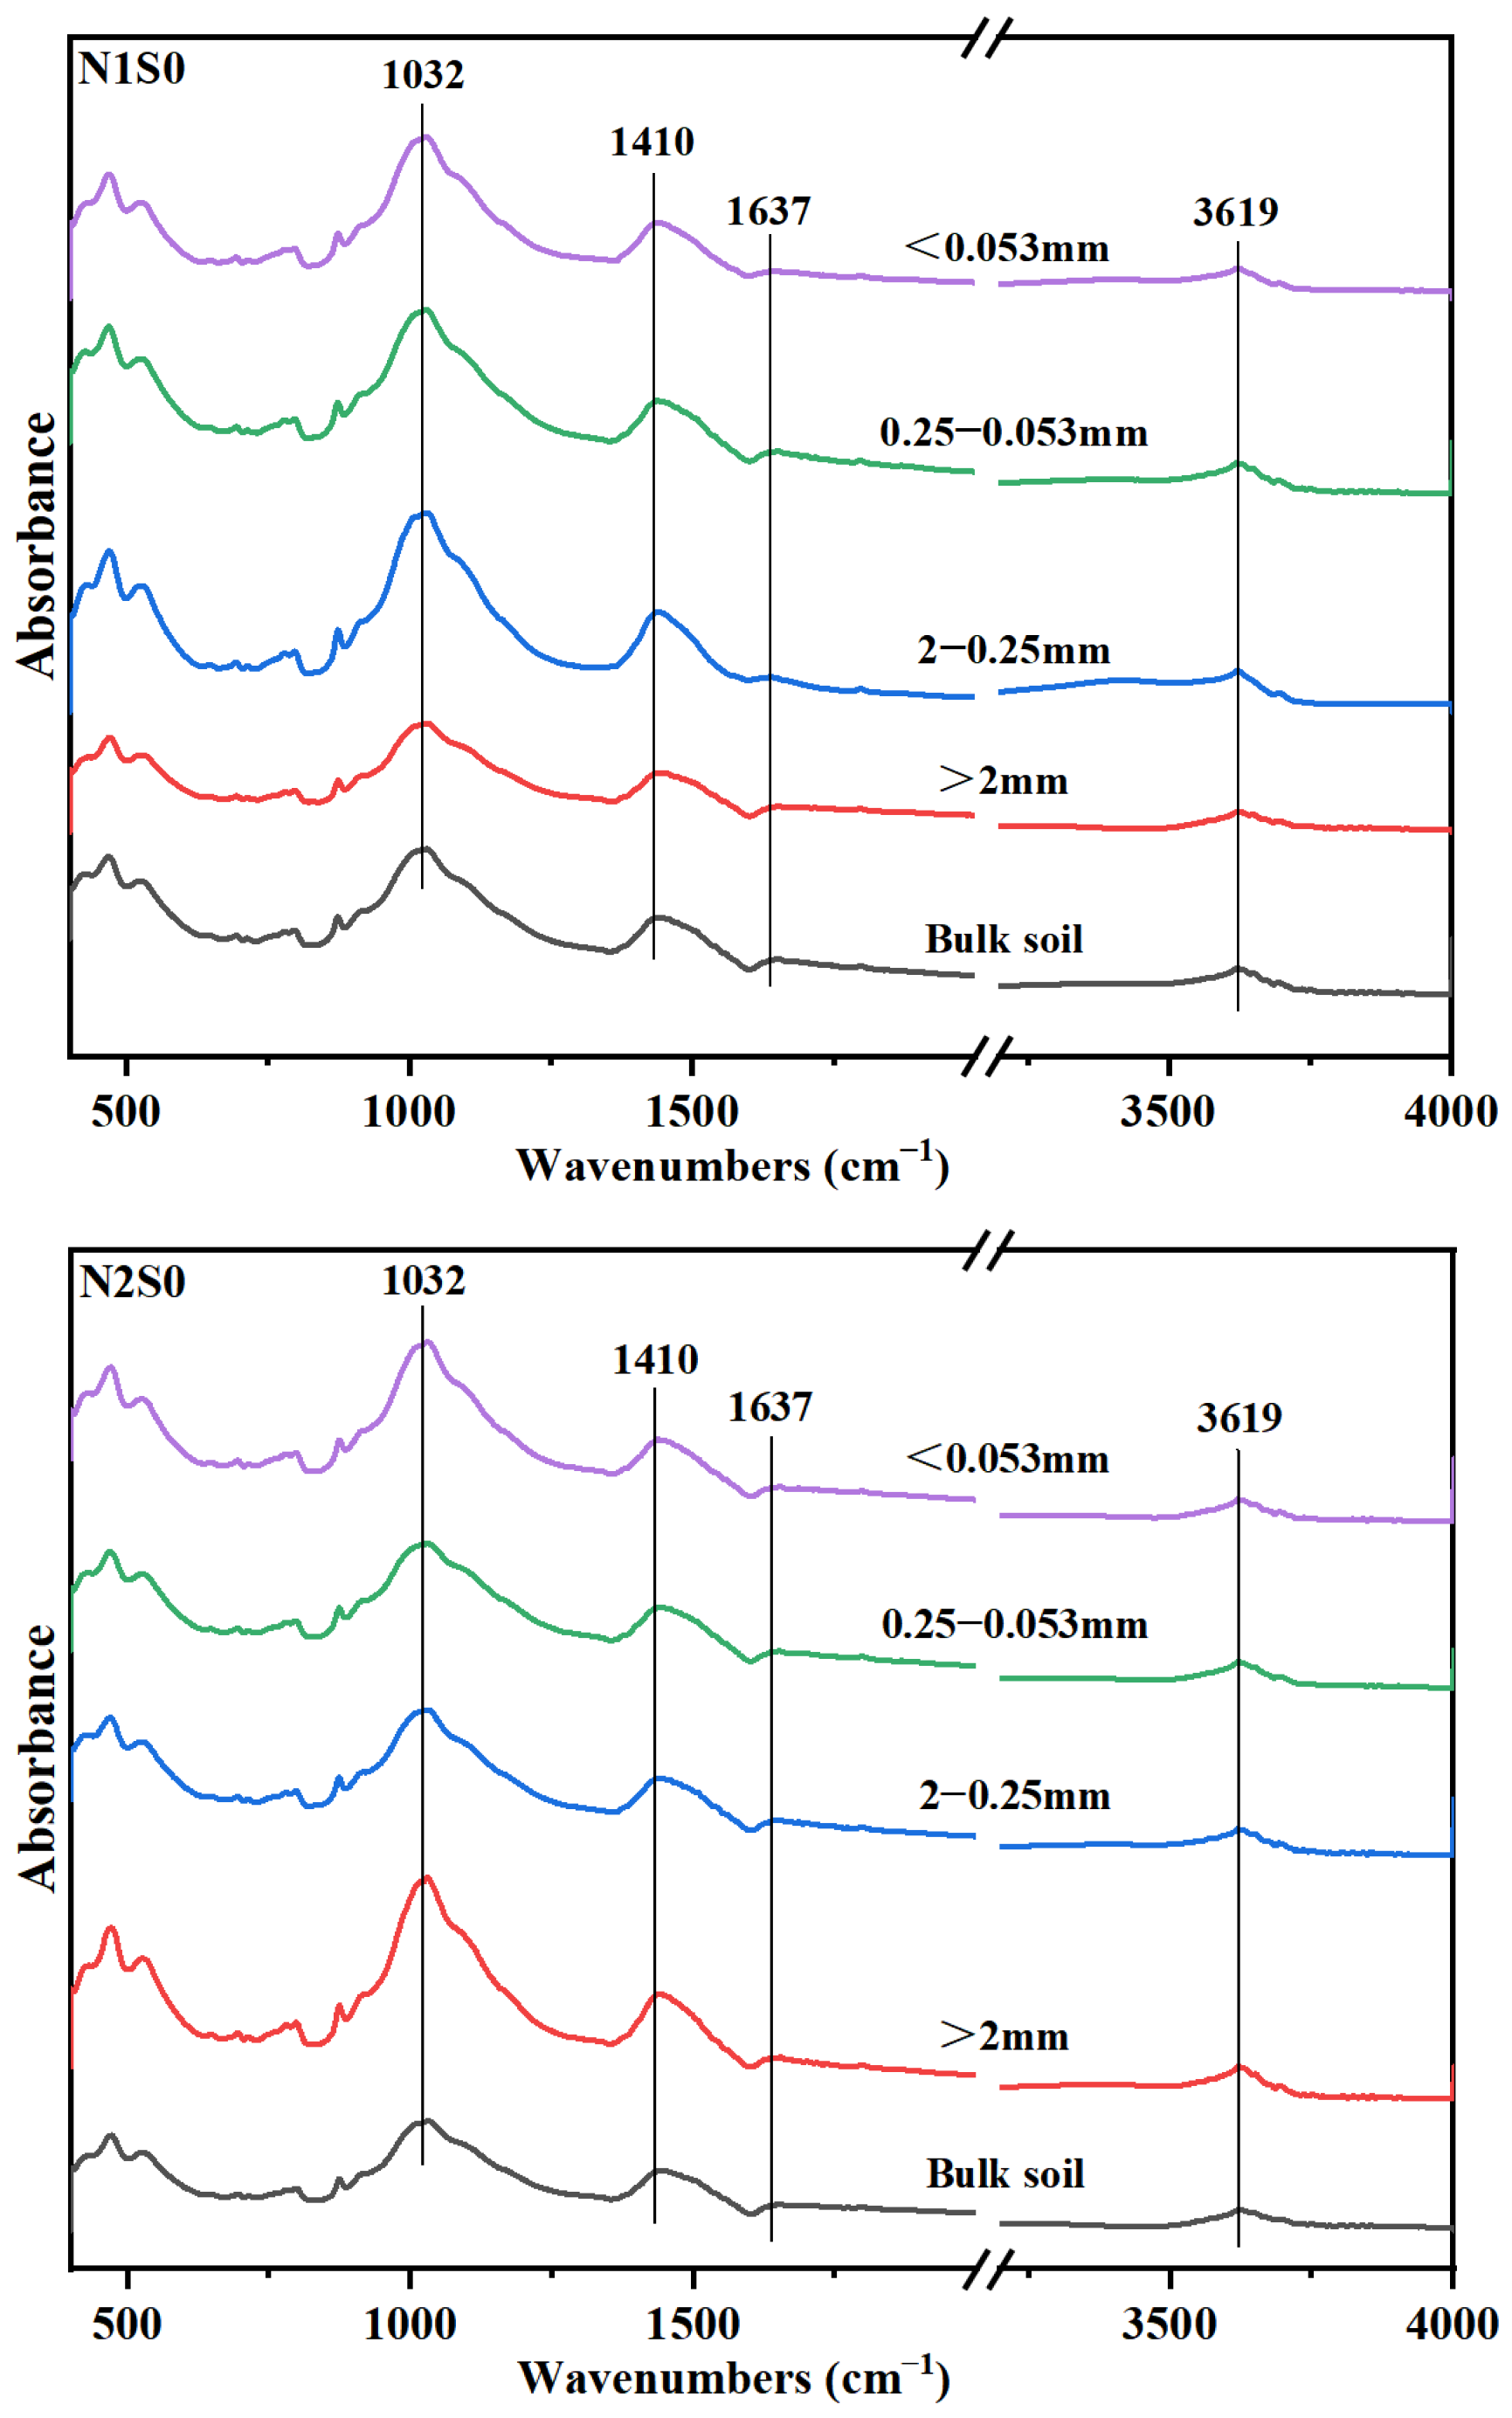
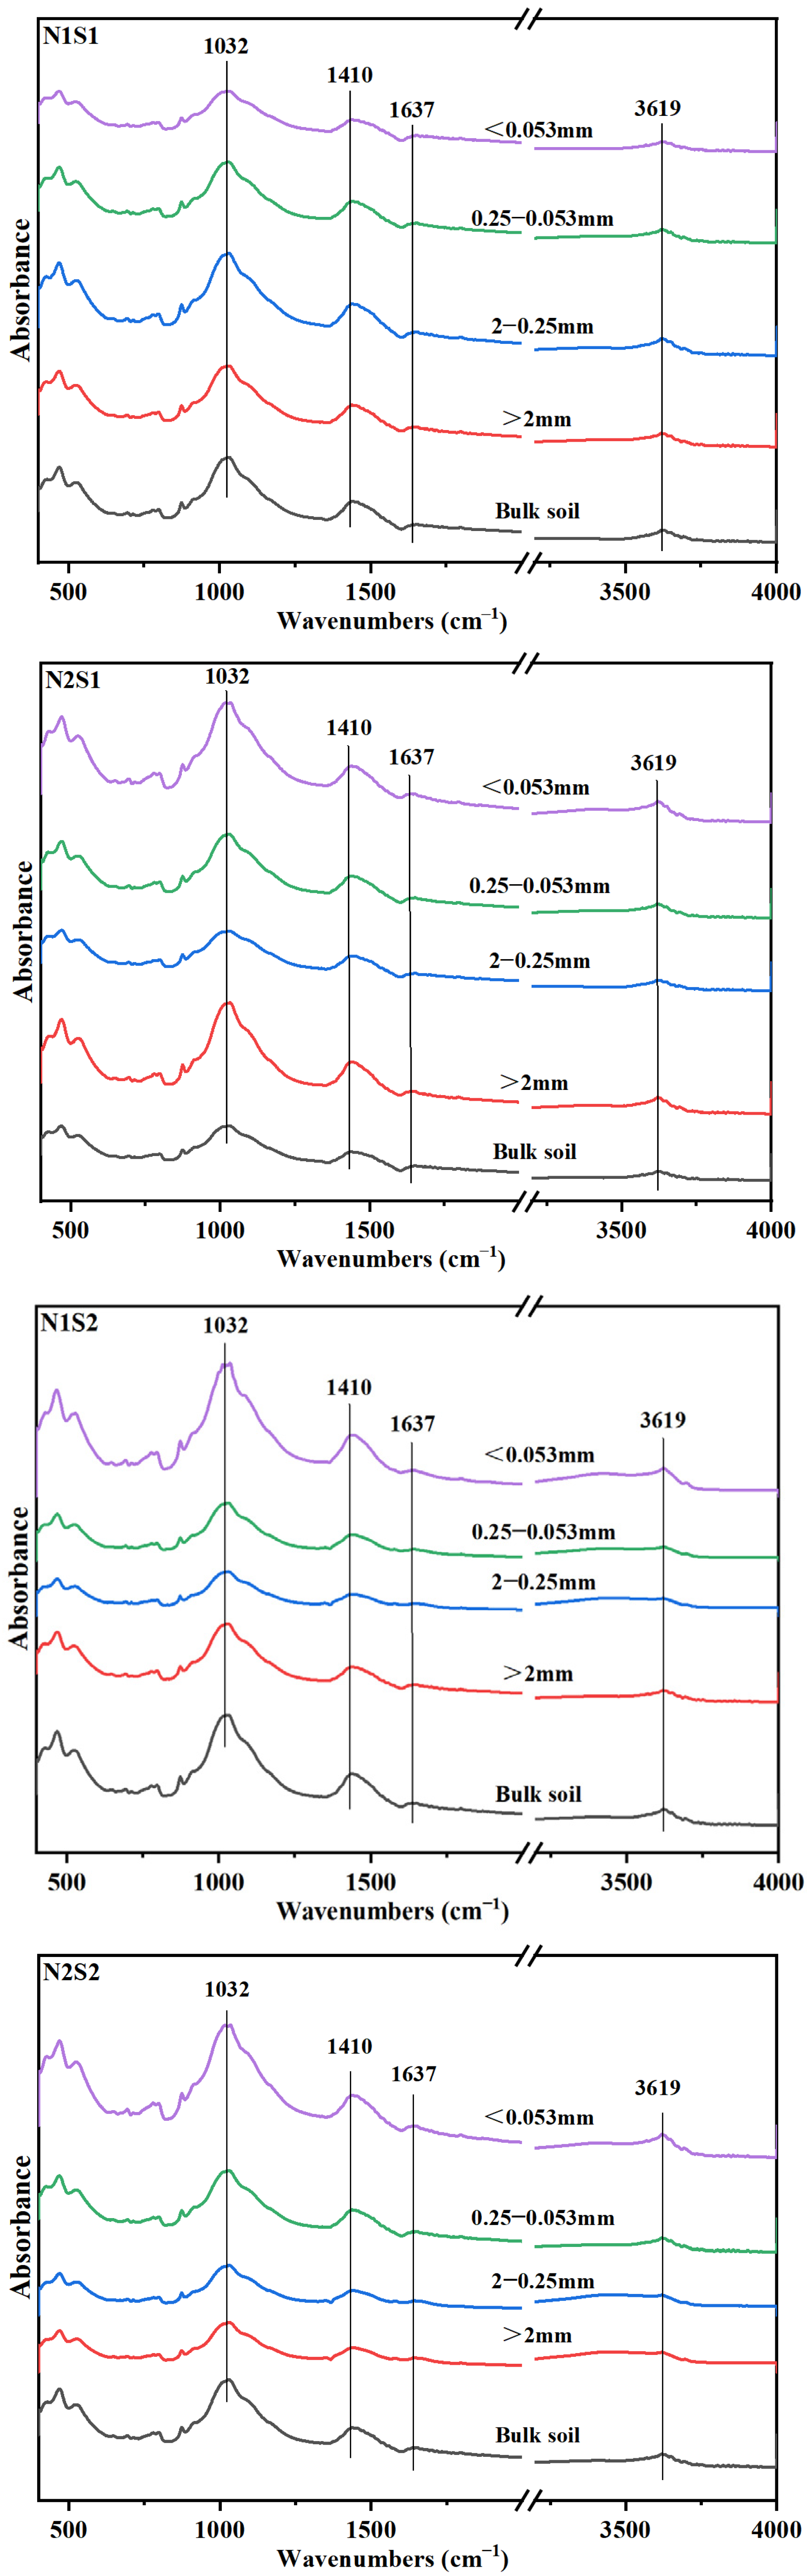
Fourier-transform infrared (FTIR) spectra showed that, the predominant organic carbon functional group in different aggregates was polysaccharides-C, and the followed was carboxylic-C, OH-C and aromatic-C (Figure 2). Under the same N level, except Silt and clay particles, the absorption peaks of polysaccharides-C in other three aggregates particles were increased (Table 4), which suggested that polysaccharides-C was crucial to the formation of larger aggregates. The distribution of both aromatic-C and OH-C in aggregates increased with the increase of straw incorporation. Under N1 level, the amount of aromatic-C in small macro-aggregates was increased with straw returning. However, for N2 level, there was no notable distinction between S0 and S1 treatments. Interestingly though, under S2 treatment conditions, there was a considerable decrease of 42.35% observed in the content of aromatic-C. The content of aromatic-C in small macro-aggregates in N2S1 treatment was increased by 18.43% compared with that in N1S1 treatment. Under the same N level, the carboxylic-C in large macro-aggregates was decreased with straw returning. Between the two N levels, carboxylic-C content in N1 level was significantly higher than that in N2 level, in which it was decreased by 14.67%, 8.70% and 17.12% in S0, S1 and S2 treatments, respectively.
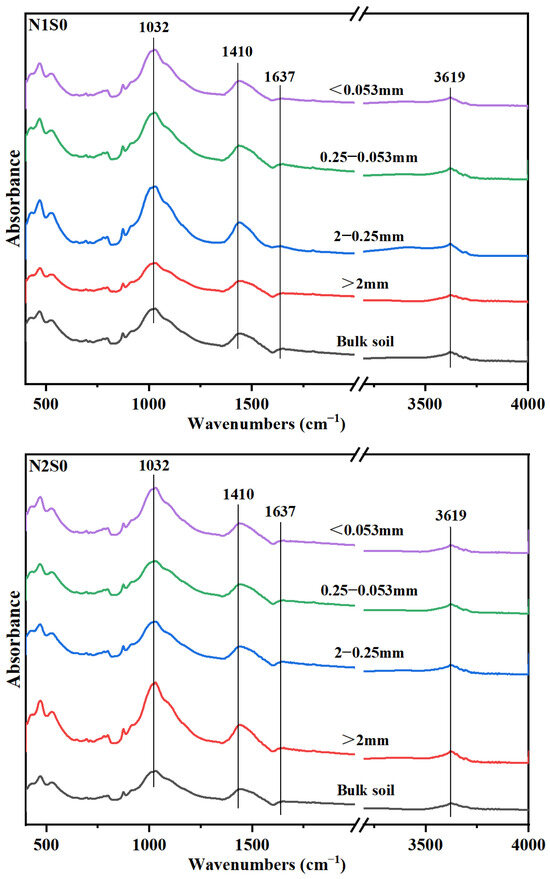
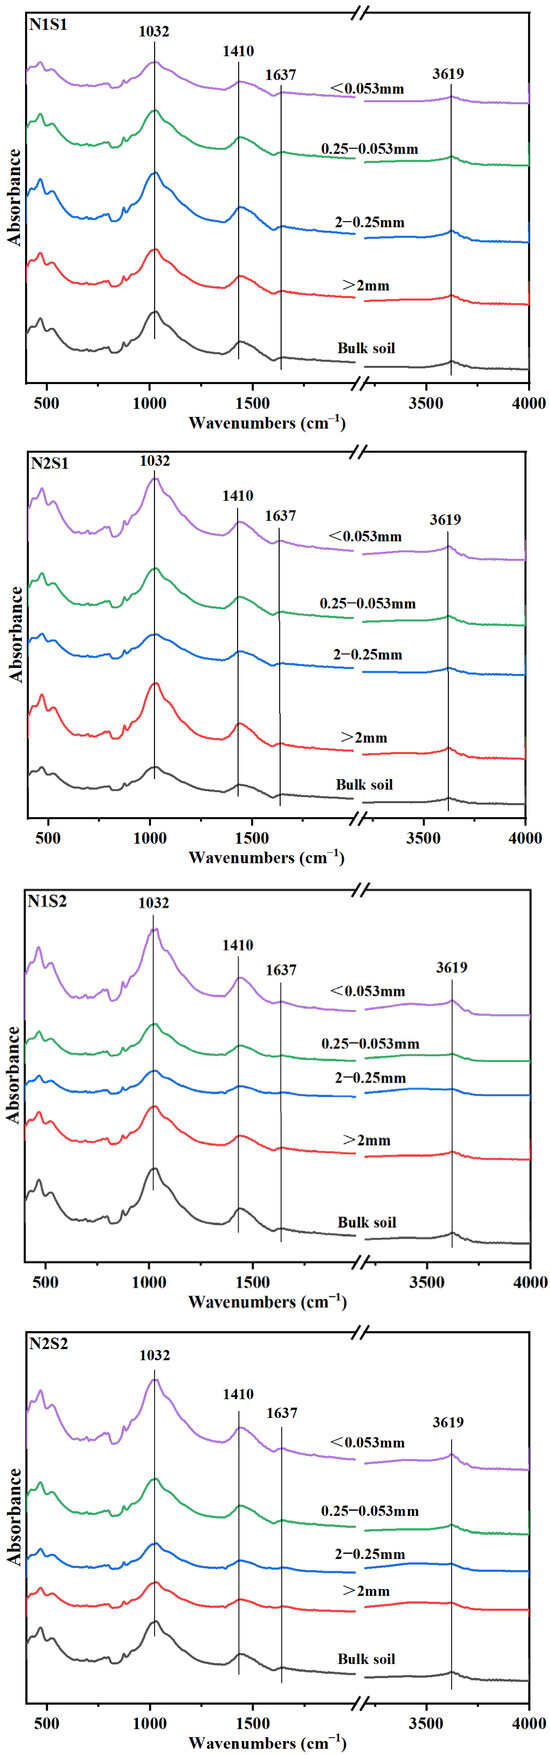
Figure 2.
Fourier transform infrared spectra of bulk soil and aggregates for the six treatments. N1 and N2 referred to N fertilization at 270 and 210 kg N ha−1, respectively. S0, S1 and S2 refer to straw returning levels at 0, 5000 and 10,000 kg C ha−1.
Table 4.
Effects of straw return and N fertilizer on soil and aggregate organic carbon functional group.
3.4. Fe Oxide Content in Aggregates
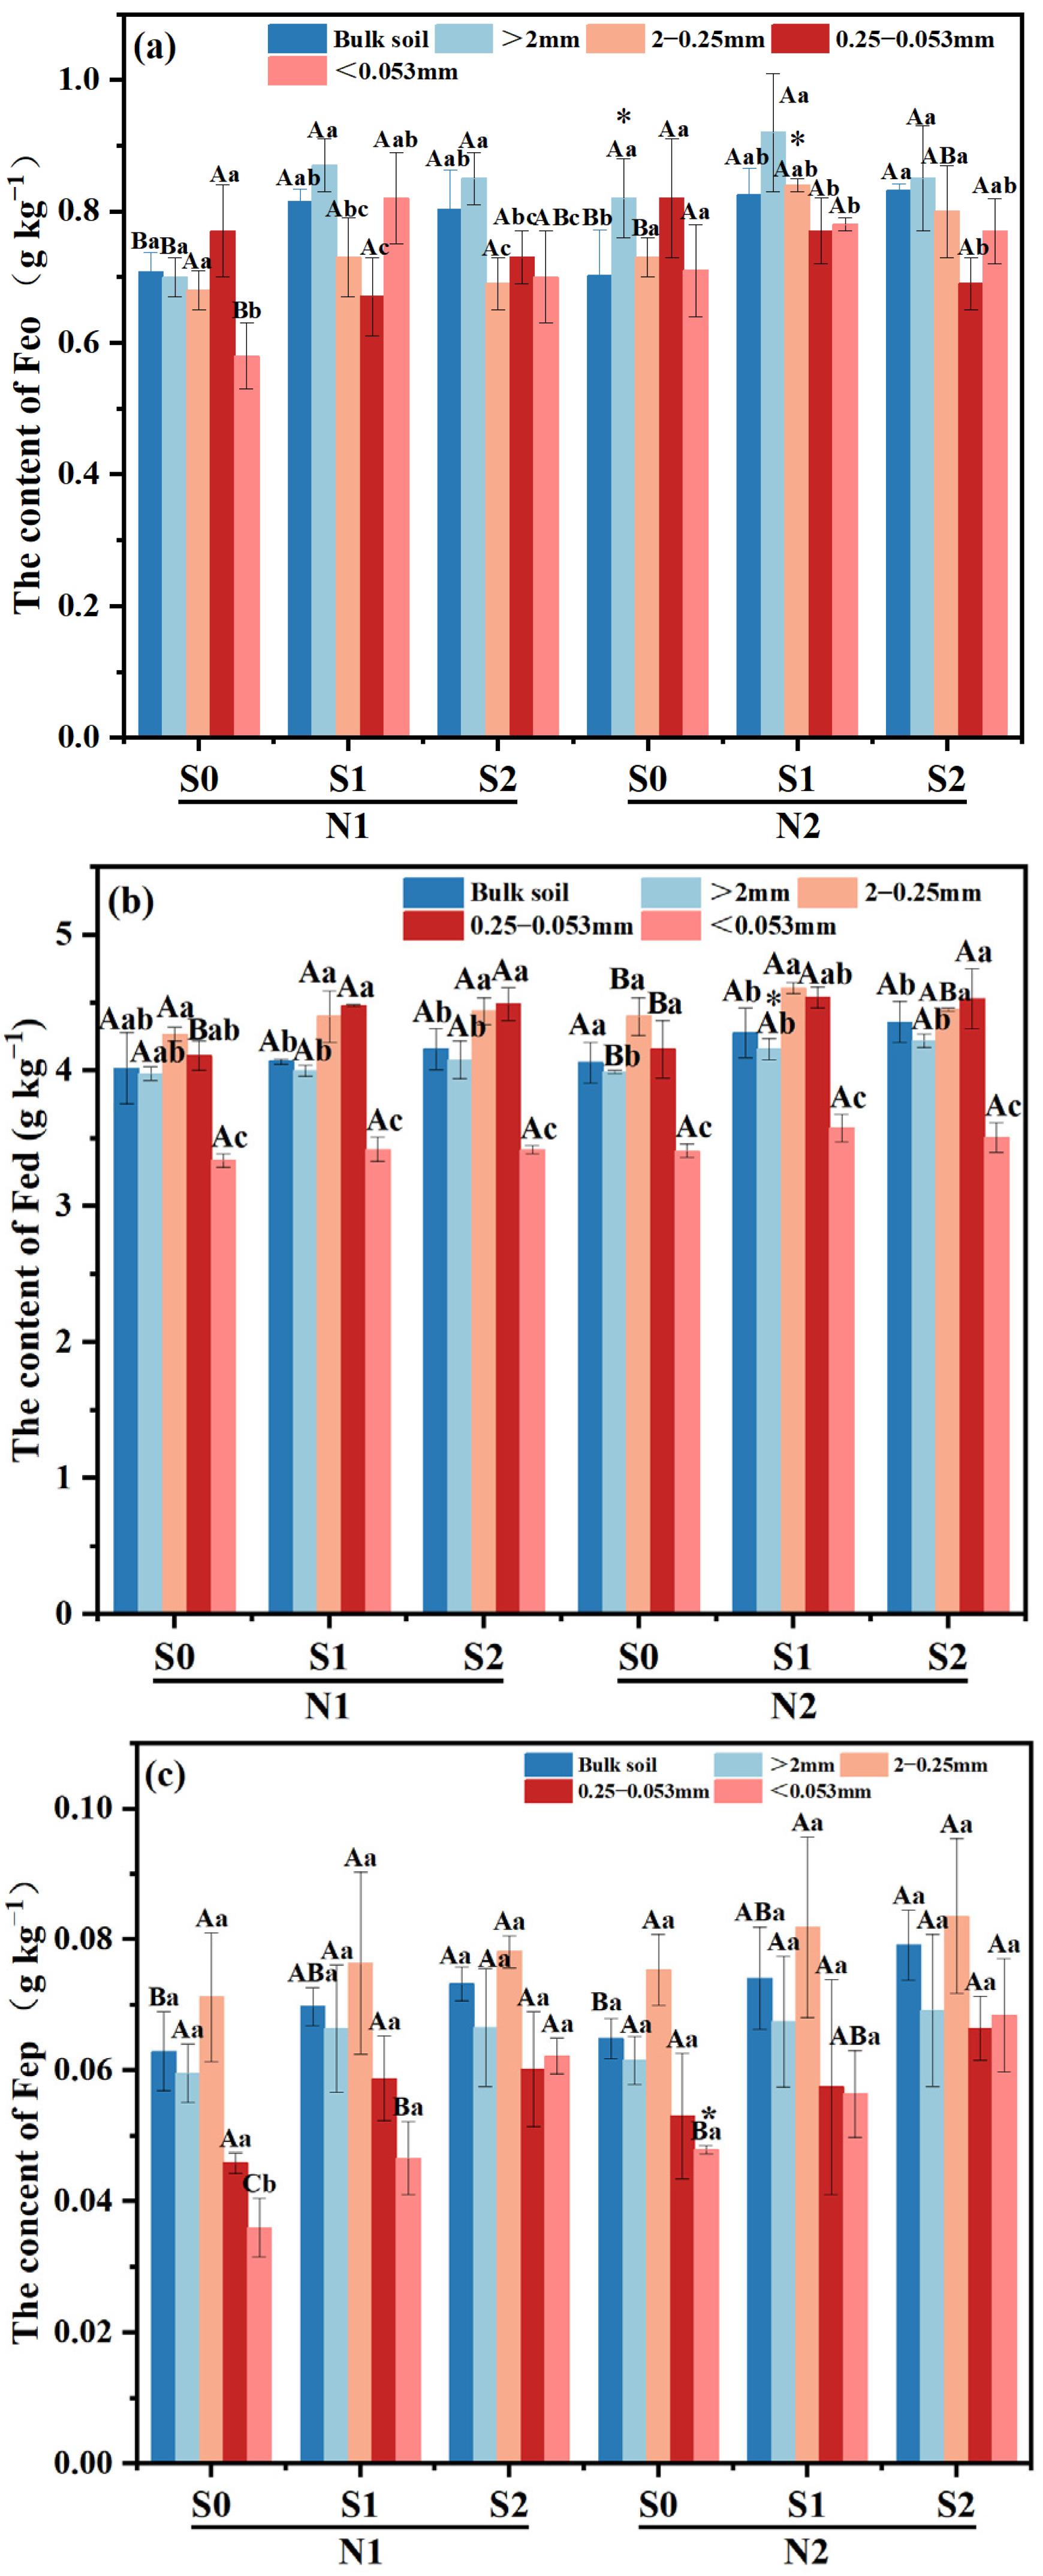
Large macro-aggregates exhibited the highest Feo content compared to other treatments, with a subsequent decrease observed as the particle size of the aggregates decreased (Figure 3a). In both N levels, Feo content within large macro-aggregates was increased with the presence of straw incorporation, and the highest was observed in S1 treatment (p < 0.05). And the same trend was also found in silt and clay particles under N1 level (p < 0.05). Meanwhile, compared to N1S1, the Feo content of tiny macro-aggregates increased by 15.07% in N2S1 treatment. (p < 0.05).
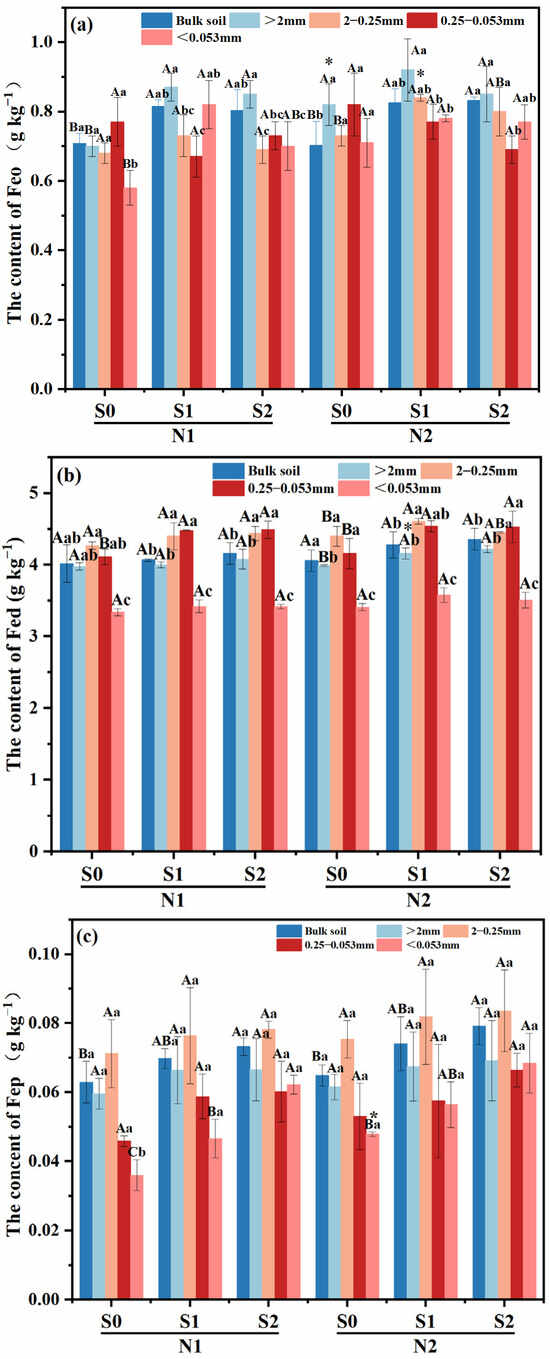
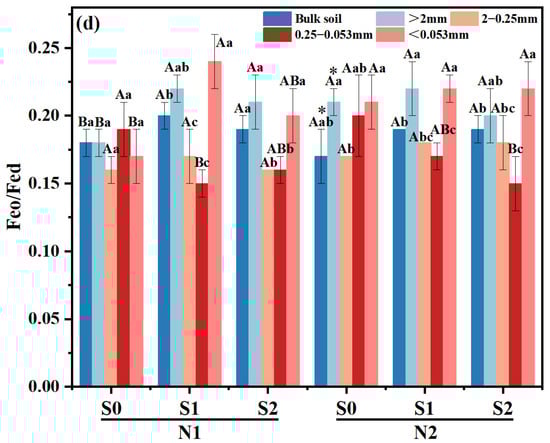
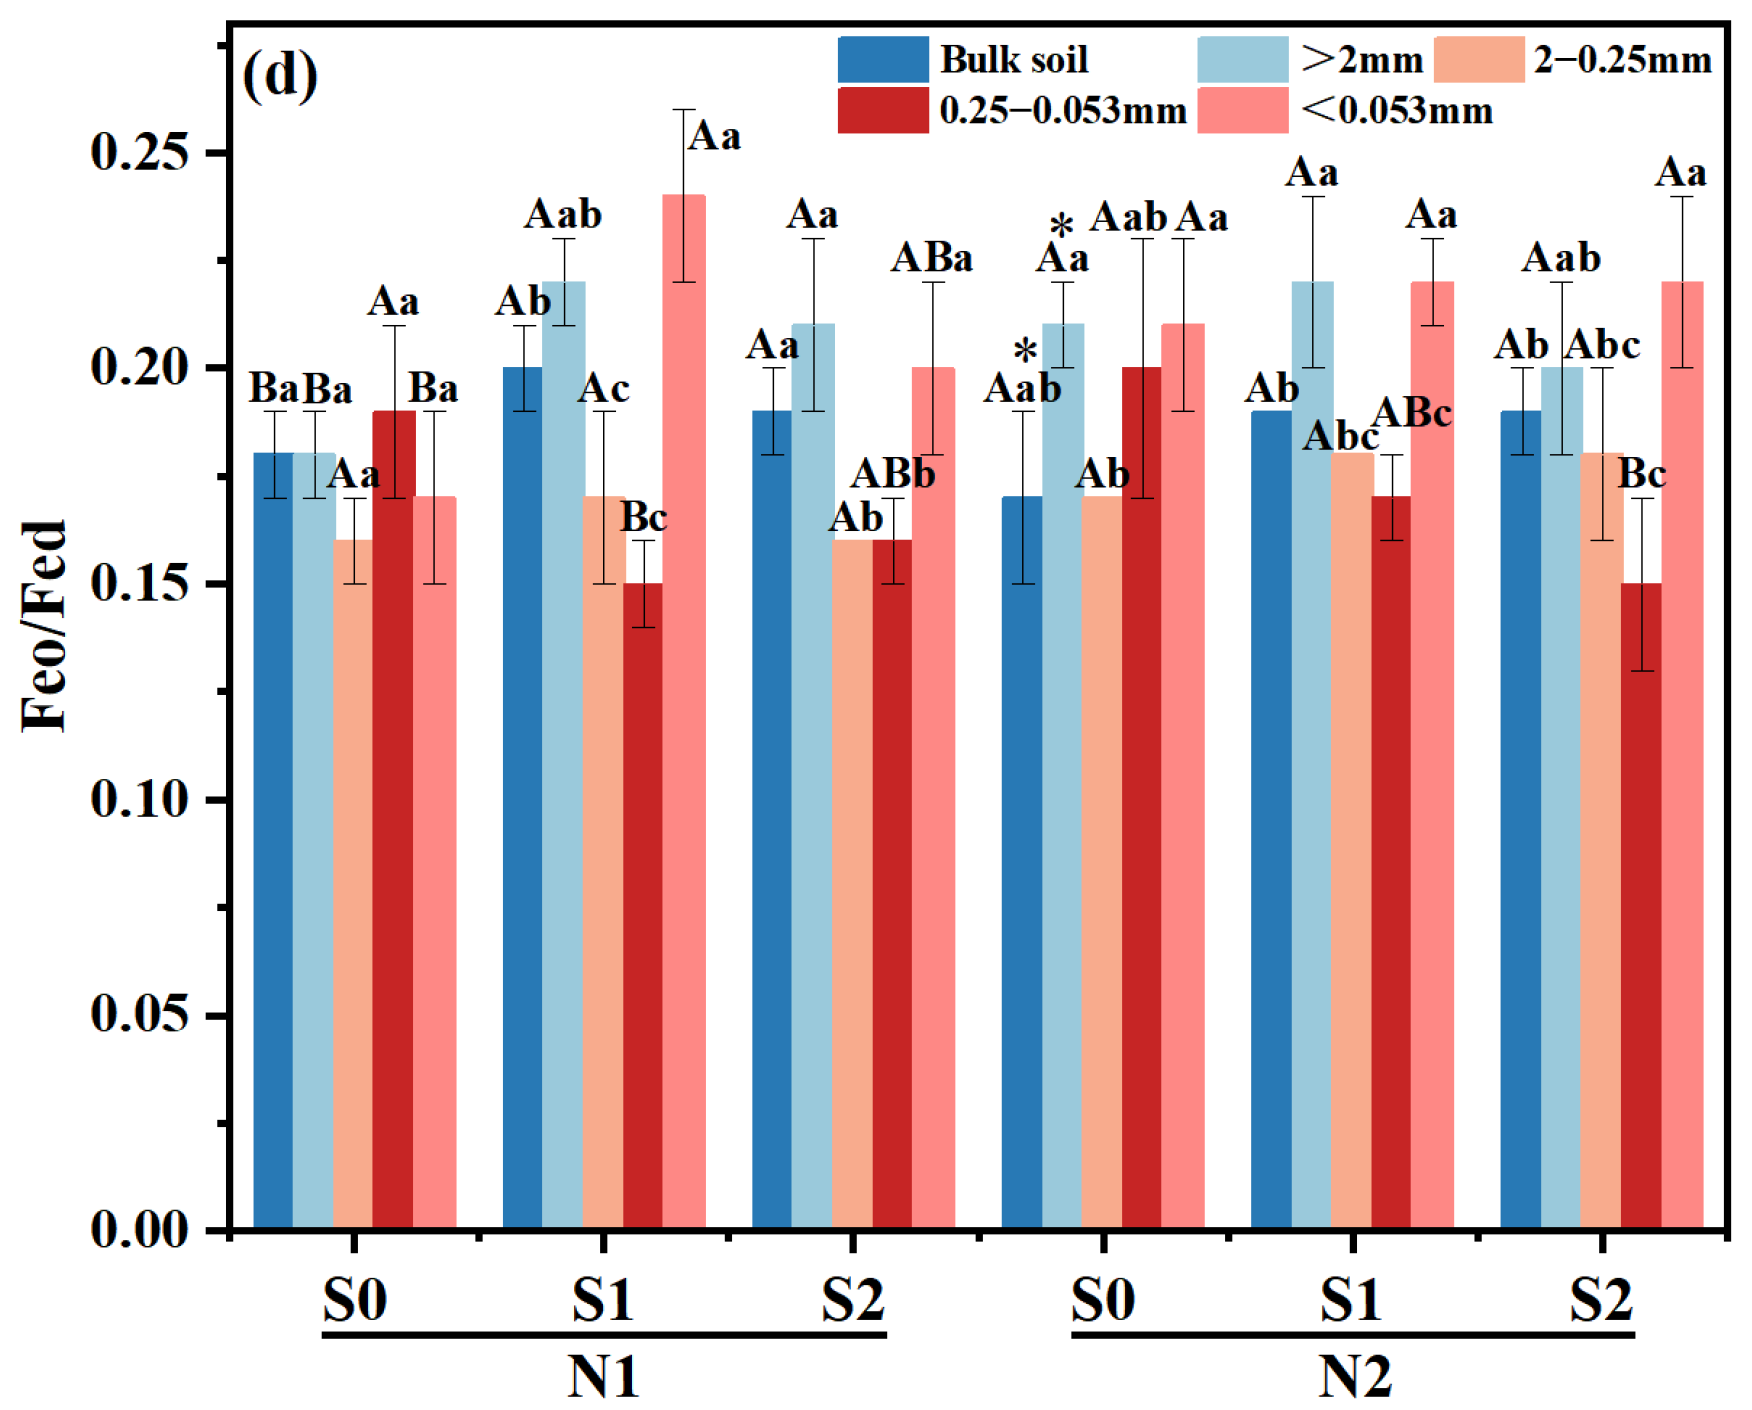
Figure 3.
Effects of different fertilizer regimes on saline alkaline soils (a) the content of Feo, (b) the content of Fed, (c) the content of Fep and (d) Feo/Fed. The different capital letters indicate significant difference among straw input amounts of the same N application at p < 0.05. Different lowercase letters indicated a significant difference among different aggregate components of the same treatment at p < 0.05. * indicates significant differences in N application rates for the same straw input at p < 0.05. N1 and N2 referred to N fertilization at 270 and 210 kg N ha−1, respectively. S0, S1 and S2 refer to straw returning levels at 0, 5000 and 10,000 kg C ha−1. Abbreviations: Feo, poorly crystalline iron oxides; Fed, dithionite-extractable iron oxides; Fep, complex iron oxides.
Under N1 level, as straw returning amount increased, Fed content in macro-aggregates and micro-aggregates showed an upward trend, compared with S0 treatment, it was increased by 0.50–3.98% and 9.00–9.25% in S1 and S2 treatments, respectively. The change trend of Fed content in different aggregates under N2 level was similar as that in N1 level, which increased by 4.26–5.76%, 1.14–4.77% and 8.89–9.13%, respectively. Simultaneously, the Fed content of large macro-aggregates in N2S1 treatment increased by 5.59% compared with that in N1S1 treatment (Figure 3b).
Compared to micro-aggregates and silt and clay particles, macro-aggregates exhibited a higher Fep content among the various aggregates of all treatments (Figure 3c). With the increase of straw incorporation, the Fep content in silt and clay particles was increased within the same N level (p < 0.05), in which it was increased by 33.3% in N2S0 treatment compared with that in N1S0 treatment.
At N1 level, Feo/Fed of macro-aggregates was significantly increased with the increase of straw returning amount (p < 0.05), while Feo/Fed in micro-aggregates decreased significantly (Figure 3d). Under N2 level, compared with S0, Feo/Fed ratios of micro-aggregates in S1 and S2 treatment decreased by 15.26–22.22%, respectively. Meanwhile, there was a notable discrepancy in the Feo/Fed ratio of bulk soil between N2 and N1 level at S1 treatment.
3.5. SOC Content and Stock in Bulk Soil
Compared with N1S0, SOC content in N1S1 and N1S2 treatments increased by 4.03% and 6.45%, respectively (p < 0.05, Figure 4a). Under identical S treatment, there was no notable disparity observed between the two N levels. However, the SOC content of S1 and S2 exhibited an increase of 3.43% and 1.08%, respectively.
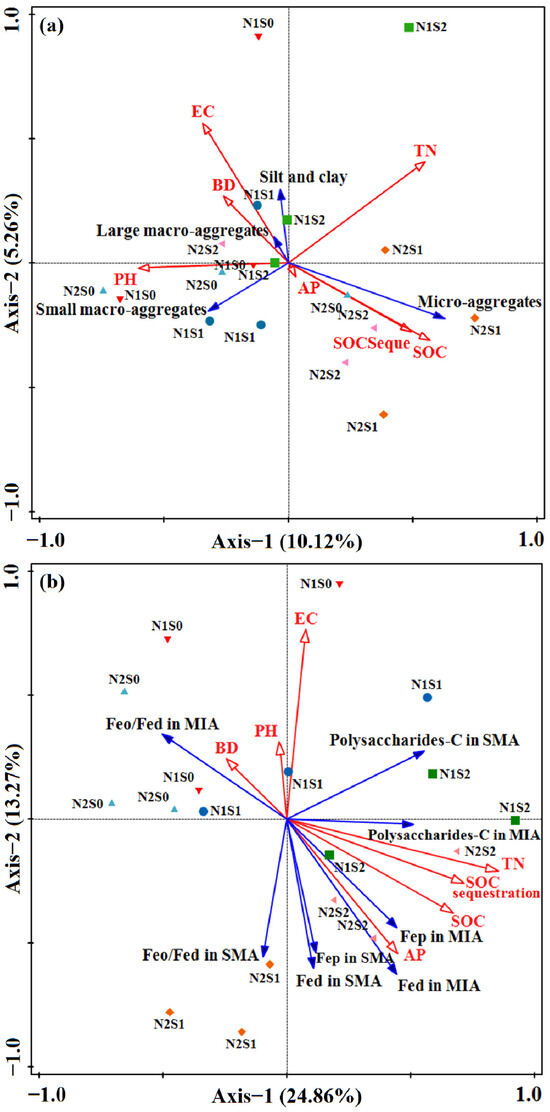
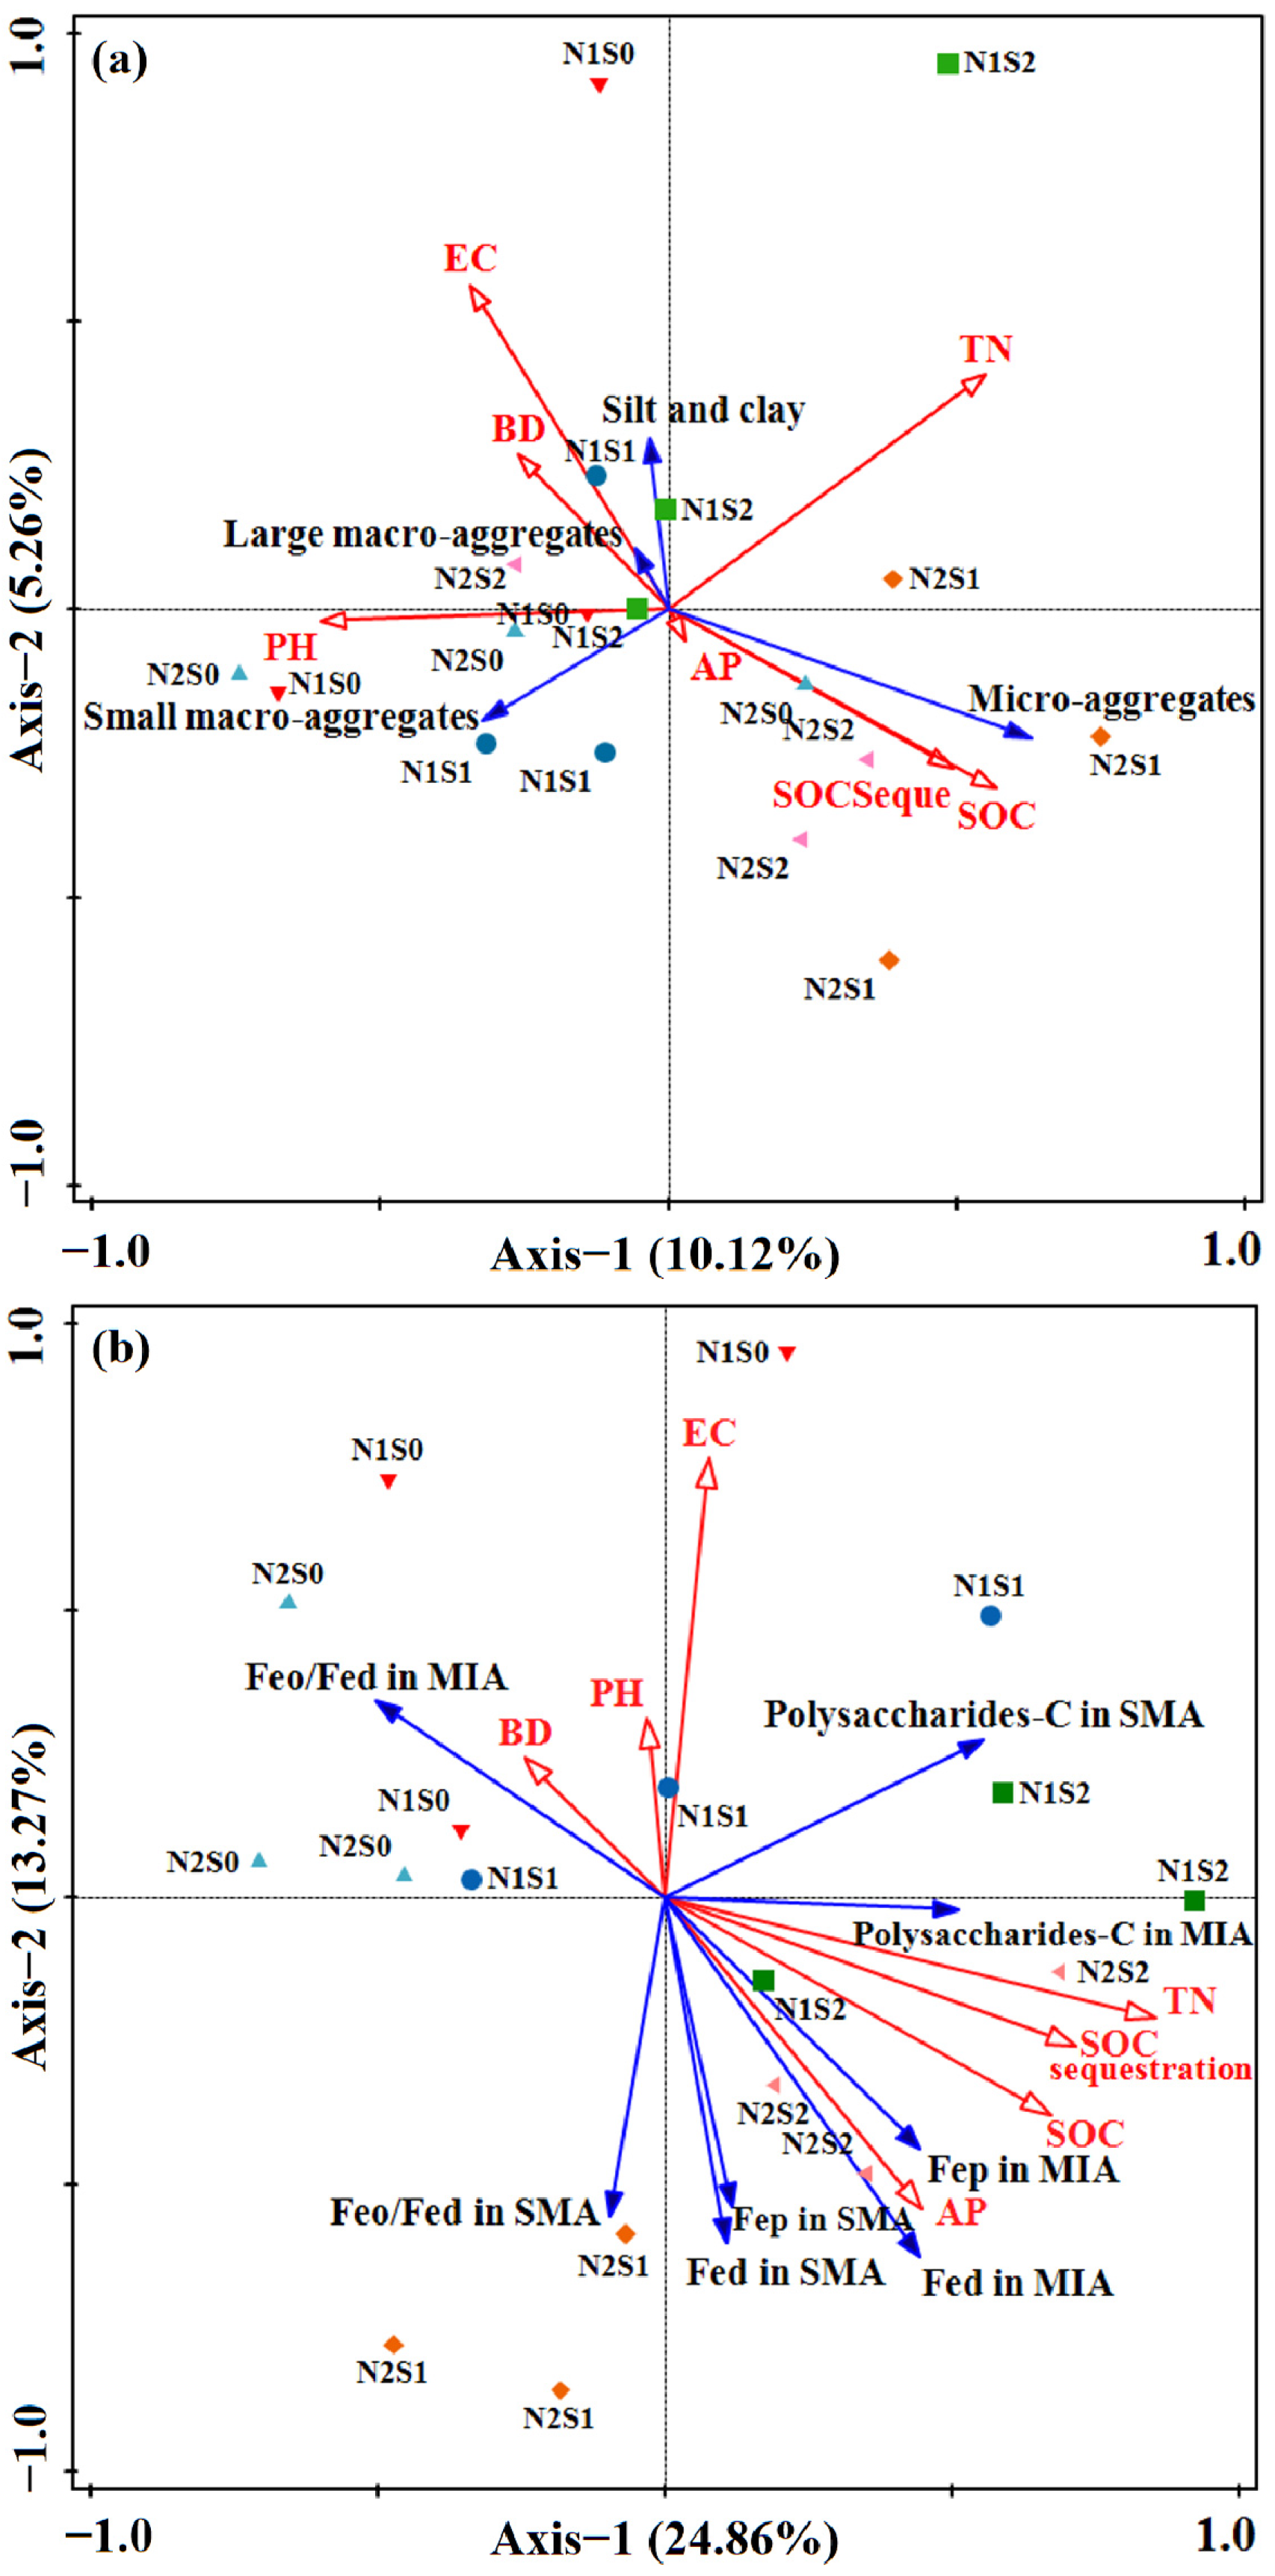
Figure 4.
RDA of aggregate size classes (a) and cementing agents (b) as explained by soil properties variables and fertilization. The explanatory variables followed by asterisks significant variables that explained the observed patterns. The large arrow showed the direction of soil property changes by application of organic fertilizers. >2 mm, large macro-aggregates, LMA; 0.25–2 mm, small macro-aggregates, SMA; 0.053–0.2 mm, micro-aggregates; <0.053 mm, silt and clay; MWD, mean weight diameter; AN, available N; AP, available P; AK, available K; BD, bulk density; EC, electrical conductivity.
The SOC stock and distribution exhibited similarity across various treatments. In comparison to S0, the SOC stock in S1 and S2 was increased by 3.94–5.95% and 5.51–7.14%, respectively, under different N levels (Figure 4b). With the same S treatment, compared with N1S1 and N1S2, the SOC stock in N2S1 and N2S2 increased by 1.14% and 0.75%.
3.6. Relationship Between Soil Properties and Cementing Agents
From the Pearson correlation coefficient, a positive relationship was found between SOC and SOC stock (p < 0.01, r = 0.990), Fep (p < 0.01, r = 0.629), polysaccharides-C (p < 0.05, r = 0.688), R > 0.25 (p < 0.05, r = 0.542), while showing a negative correlation with BD (p < 0.05, r = −0.509). The MWD showed a significant positive correlation with Fed (p < 0.05, r = 0.476), Fep (p < 0.05, r = 0.535), polysaccharides-C (p < 0.05, r = 0.618), R > 0.25 (p < 0.01, r = 0.866), and exhibited a negative correlation with carboxylic-C (p < 0.05, r = −0.495) (Table 5). Meanwhile, the content of Fed in micro-aggregates (p < 0.05, r = 0.490) and Fep (p < 0.05, r = 0.572) in large macro-aggregates were positively correlated with MWD, respectively (Table S1). The cumulative percentage of variance explained for soil aggregate structure was 15.38%, which came from 5.26% of axis 2 and 10.12% of RDA axis 1. (Figure 4a). The RDA results demonstrated that the proportion of micro-aggregates was positively correlated with SOC, SOC stock and AP, while it was negatively related with EC and BD. The cumulative percentage of variance explained for cementing agents was 38.13%, with axis 1 and 2 accounting for 24.86% and 13.27%, respectively (Figure 4b). The content of Fed, Fep and polysaccharides-C in small macro-aggregate and micro-aggregates was increased proportionally with TN, AP, SOC, and SOC stock while being negatively related to BD and pH. Conversely, Feo/Fed in macro-aggregates exhibited an opposite trend.
Table 5.
Pearson correlation coefficients (r) between pH, EC, R > 0.25, BD, MWD, SOC, SOC stock, Feo, Fed, Fep, Feo/Fed, Aromatic-C, Carboxylic-C, Polysaccharides-C in bulk soil (n = 14).
4. Discussion
4.1. Straw Incorporation and N Application Facilitated the Soil Aggregates Formation and Stability
The improvement of soil fertility and quality heavily relies on soil aggregates structure [34]. Straw incorporation and N application can enhance soil humus and OC functional groups, as well as other cementing agents, thereby facilitating the establishment of soil aggregates, particularly large macro-aggregates [14]. In this study, the percentage of macro-aggregates in S1 and S2 exhibited a significant increase compared with that in S0 within the same N level (Figure 1c). Conversely, the N2S1 treatment and N2S2 treatment exhibited similar content of macro-aggregates, while the N2 level demonstrated a significantly higher value compared to the N1 level (Figure 1a). The results showed that straw returning and N fertilization could promote the transformation of small and medium-sized aggregates into macro-aggregates in saline-alkali soil [35].
MWD is a pivotal indicator for assessing soil aggregates [36]. In this study, an increase in straw incorporation and N application led to an elevation in MWD (Figure 1b). This could be attributed to two factors: (i) continuous straw incorporation and N application augmented SOC content (Table 3) [37], (ii) the calcium and iron ions brought by straw formed larger and more stable soil aggregates through particle rearrangement [20]. RDA analysis showed that Feo/Fed, Fep and polysaccharide-C in macro-aggregates and micro-aggregates were key factors affecting SOC content and sequestration (Figure 4b). In addition, the Pearson correlation coefficient revealed a positive relationship (p < 0.05) between MWD and stable OC functional groups (specifically polysaccharides-C), while also indicating a negative relationship (p < 0.01) with unstable OC functional groups (carboxylic-C). This suggested that the presence of OC functional groups could effectively enhance the development of large aggregates in saline-alkali soil. In contrast to the exclusive use of chemical fertilizers, incorporating straw back into the soil along with N fertilizer not only enhanced the durability of soil aggregates but also facilitated the interaction between mineral oxides and OC functional groups within these aggregates [34]. Straw incorporation can provide a rich source of carbon for the soil, and appropriate application of N fertilizer can promote the decomposition of straw [38]. As the straw decomposes, it generates organic compounds that form mineral complexes with soil minerals, ultimately enhancing soil aggregates stability [39]. In this study, a positive correlation was observed between MWD and Fed as well as Fep content (Table 5), revealing that the presence of Fe oxides might enhance soil aggregate stability. The research highlighted the essential functions carried out by both mineral oxides and OC functional groups in molding soil aggregates.
4.2. Response of OC Functional Groups to Straw Incorporation and N Application
Saline-alkali soil experiences a reduction in its SOC content due to the dissolution of organic matter caused by either flocculation or dispersion of soil particles [40]. Straw incorporation and N application not only serves as a C source for the soil, but also enhances the buildup of SOC [41]. In this research, the addition of straw and N application significantly (p < 0.05) promoted the increase of organic carbon in saline-alkali soil (Table 3). On the one hand, straw incorporation increased the amount of crop residues and the OC content in soil aggregates (Table 4). On the other hand, reduced N application reduced the decomposition of SOC and changed the distribution of OC in soil aggregates (Table 6), especially in large and small macro-aggregates (Table 3), which led to an increase in SOC stock in saline-alkali soil. This outcome aligns with prior research indicating that the introduction of straw and N fertilization has the potential to enhance SOC accumulation in saline-alkali soil [3].
Table 6.
Statistical significance (p value) of straw returning, N application, aggregate size class, and their interaction on the concerned variables.
The carbon input is a key determinant that greatly influences the composition of functional groups in soil [42]. It has been reported that straw returning and N application increase the content of more stable C in the soil [8]. In this research, the distribution of C functional groups in soil aggregates was found to be significantly influenced by the application of N fertilizer and the practice of straw returning (Table 6). This could be because (i) combined straw returning and N application increased the content of SRO-Fe oxides and their specific surface area, leading to the accumulation of aromatic-C on the surface of soil particles [31], (ii) polysaccharides-C acted as a binder in soil aggregates, mainly existing in macro-aggregates [43]. This supports our results that straw incorporation under reduced N application significantly increased the proportion of polysaccharides-C and aromatic-C, especially in macro-aggregates (Table 4). Polysaccharides-C and aromatic-C may be the main binders of macro-aggregates in saline-alkali soil [10]. Concurrently, the ratio of carboxy-C in N2 level was decreased, particularly in small macro-aggregates (Table 4), indicating that SOC was unstable after reduction of N application, because carboxy-C is easier to degrade in soil [44], while excessive N application increased the carboxy-C ratio [45].
4.3. Role of Straw Incorporation and N Application on SOC Stability and Sequestration
The stability of SOC has an impact on the breakdown and retention of soil carbon, which plays a crucial role in maintaining soil quality [45]. The addition of straw and N fertilizer caused considerable changes in the distribution of Fe oxide in soil aggregates, which led to higher levels of Fed and Fep (Figure 3). Moreover, MWD was positively correlated with Fed (p < 0.05, r = 0.476) and Fep (p < 0.05, r = 0.535), respectively (Table S1), indicating that Fed and Fep could enhance the stability of aggregates. This was due to the potential role of Fe present in the Fe oxides as an acceptor of electrons during microbial respiration with the straw and N application [29]. Changes in Fed and Fep increase the specific surface area of aggregates, promote the organic-Fe complexes formation, protect organic materials from further decomposition by microorganisms and form short-range-ordered-Fe (SRO-Fe) phases [17]. This supports our research findings that straw incorporation and N application can form organic-Fe complexes, thereby promoting aggregates stability. Furthermore, the development of soil aggregates was significantly positively affected by straw returning and N application (Figure 1), which in turn promoted OC sequestration through physical protection of macro-aggregates. Consequently, this mechanism facilitated the protection of SOC by enclosing it within macro-aggregates. This indicates that the soil aggregates can resist the loss of SOC through physical protection by straw incorporation and N application [46]. Specifically, microorganisms in the soil decompose straw residues into low molecular weight acids, thereby promoting the transformation of crystalline minerals into short-range-ordered minerals and further developing organic-mineral complexes that prevent subsequent recrystallization [9,47,48].
Crop straw, as the input of exogenous C, is the main influencing factor of soil C pool [49]. 10 years of exogenous C addition increased SOC reserves by 628–1381 kg C·ha−1 per year on average [50]. The results showed that 3-year straw incorporation and N application increased SOC storage, and N2S1 and N2S2 treatments increased by 5.95% and 7.14% compared with N2S0, respectively (Table 3). This could be because (i) under the physical shield of stable soil aggregates, SOC loss is decreased (Figure 1); (ii) the formation of aromatic-Fe complexes led to an increased C storage [47]. However, excessive C inputs result in a rise in the concentration of soluble organic C within the soil, potentially leading to an elevated occurrence of C leaching, particularly in saline-alkali soils [51]. In this investigation, the SOC storage did not exhibit a noteworthy disparity between S1 and S2 treatments under identical N levels (Table 3), potentially attributable to increased leaching of dissolved organic carbon. Meanwhile, SOC stock of N2S1 and N2S2 was higher than that of N1S1 and N1S2 treatments, which may be due to the fact that excessive N addition accelerated the activity of microorganisms in the soil, thus reducing SOC storage [52]. Therefore, half straw incorporation and reduced N application were the best management measures for saline-alkali soil.
5. Conclusions
After 3 years of straw incorporation and N application, the increased mean weight diameter (MWD) indicates that the stability of the soil aggregates has improved under this short-term regime. The redox transformation of Fed and Fep promoted the accumulation of short-range-ordered Fe (SRO-Fe) oxides, especially in macroaggregates, which was positively correlated with MWD. Compared with S0, the proportions of aromatic-C and polysaccharides-C in S1 and S2 was significantly increased (p < 0.05), among which, aromatic-C was mainly distributed in large macro-aggregates, while polysaccharides-C was found in micro-aggregates. The proportion of polysaccharides-C and aromatic-C in macro-aggregates did not significantly change between the S1 and S2 treatments. The correlation between polysaccharides-C and Fed as well as Fep suggests that the formation of polysaccharides-Fe complexes enables preferential retention of polysaccharides-C compounds at aggregate interfaces. Meanwhile, the proportion of aromatic-C is higher at N2 levels than at N1 levels, especially in large macro-aggregates. The results showed that the reduction of nitrogen fertilizer increased the stable carbon functional groups in the short term, and the soil organic carbon was more stable, thus increasing the soil carbon storage. Therefore, half straw incorporation and reduced N application could enhance soil aggregate stability in the short term, regulate the chemical composition of SOC, and encourage the creation of organic-Fe complexes, thus significantly improving the stability and sequestration of SOC in saline-alkali soil.
Supplementary Materials
The following supporting information can be downloaded at: https://www.mdpi.com/article/10.3390/agronomy15040871/s1, Table S1: Bivariate correlation between mean weight diameter (MWD) and binding agents in soil aggregates.
Author Contributions
Conceptualization, Z.J.; formal analysis, Z.J.; funding acquisition, X.D. and S.L.; investigation, Z.J. and Z.S.; methodology, X.D., Z.L. and S.L.; project administration, S.Z. and Z.L.; resources, X.D. and S.L.; software, Z.J. and Z.S.; supervision, X.D., S.Z. and S.L.; writing-original draft, Z.J.; writing-review and editing, S.Z., Z.S. and Z.L. All authors have read and agreed to the published version of the manuscript.
Funding
This research was funded by the National Key Research and Development Project, China, grant number 2023YFD1902702-1; Modern Agricultural Industrial Technology System, China, grant number SDAIT-17-05.
Data Availability Statement
Data are contained within the article.
Conflicts of Interest
The authors declare no competing interests.
References
- Liu, D.; Zhang, S.; Fei, C.; Ding, X. Impacts of straw returning and N application on NH4+-N loss, microbially reducible Fe(III) and bacterial community composition in saline-alkaline paddy soils. Appl. Soil Ecol. 2021, 168, 104115. [Google Scholar] [CrossRef]
- Chen, M.; Zhang, S.; Liu, L.; Wu, L.; Ding, X. Combined organic amendments and mineral fertilizer application increase rice yield by improving soil structure, P availability and root growth in saline-alkaline soil. Soil Tillage Res. 2021, 212, 105060. [Google Scholar] [CrossRef]
- Dong, L.; Wang, H.; Shen, Y.; Wang, L.; Zhang, H.; Shi, L.; Lu, C.; Shen, M. Straw type and returning amount affects SOC fractions and Fe/Al oxides in a rice-wheat rotation system. Appl. Soil Ecol. 2023, 183, 104736. [Google Scholar] [CrossRef]
- Wang, E.; Lin, X.; Tian, L.; Wang, X.; Ji, L.; Jin, F.; Tian, C. Effects of Short-Term Rice Straw Return on the Soil Microbial Community. Agriculture 2021, 11, 561. [Google Scholar] [CrossRef]
- Zhao, H.; Shar, A.G.; Li, S.; Chen, Y.; Shi, J.; Zhang, X.; Tian, X. Effect of straw return mode on soil aggregation and aggregate carbon content in an annual maize-wheat double cropping system. Soil Tillage Res. 2018, 175, 178–186. [Google Scholar] [CrossRef]
- Su, Y.; Kwong, R.W.M.; Tang, W.; Yang, Y.; Zhong, H. Straw return enhances the risks of metals in soil? Ecotoxicol. Environ. Saf. 2021, 207, 111201. [Google Scholar] [CrossRef]
- Zou, C.; Li, Y.; Huang, W.; Zhao, G.; Pu, G.; Su, J.; Coyne, M.S.; Chen, Y.; Wang, L.; Hu, X.; et al. Rotation and manure amendment increase soil macro-aggregates and associated carbon and nitrogen stocks in flue-cured tobacco production. Geoderma 2018, 325, 49–58. [Google Scholar] [CrossRef]
- Berhane, M.; Xu, M.; Liang, Z.; Shi, J.; Wei, G.; Tian, X. Effects of long-term straw return on soil organic carbon storage and sequestration rate in North China upland crops: A meta-analysis. Glob. Chang. Biol. 2020, 26, 2686–2701. [Google Scholar] [CrossRef]
- Qi, J.-Y.; Zhao, X.; He, C.; Virk, A.L.; Jing, Z.-H.; Liu, Q.-Y.; Wang, X.; Kan, Z.-R.; Xiao, X.-P.; Zhang, H.-L. Effects of long-term tillage regimes on the vertical distribution of soil iron/aluminum oxides and carbon decomposition in rice paddies. Sci. Total Environ. 2021, 776, 145797. [Google Scholar] [CrossRef]
- Xue, B.; Huang, L.; Li, X.; Lu, J.; Gao, R.; Kamran, M.; Fahad, S. Effect of Clay Mineralogy and Soil Organic Carbon in Aggregates under Straw Incorporation. Agronomy 2022, 12, 534. [Google Scholar] [CrossRef]
- Fungo, B.; Lehmann, J.; Kalbitz, K.; Thiongo, M.; Okeyo, I.; Tenywa, M.; Neufeldt, H. Aggregate size distribution in a biochar-amended tropical Ultisol under conventional hand-hoe tillage. Soil Tillage Res. 2017, 165, 190–197. [Google Scholar] [CrossRef]
- Ghorbani, M.; Amirahmadi, E. Insights into soil and biochar variations and their contribution to soil aggregate status—A meta-analysis. Soil Tillage Res. 2024, 244, 106282. [Google Scholar] [CrossRef]
- Even, R.J.; Francesca Cotrufo, M. The ability of soils to aggregate, more than the state of aggregation, promotes protected soil organic matter formation. Geoderma 2024, 442, 116760. [Google Scholar] [CrossRef]
- Xue, B.; Huang, L.; Huang, Y.; Ali Kubar, K.; Li, X.; Lu, J. Straw management influences the stabilization of organic carbon by Fe (oxyhydr)oxides in soil aggregates. Geoderma 2020, 358, 113987. [Google Scholar] [CrossRef]
- Zhang, J.; Zhang, F.; Yang, L. Continuous straw returning enhances the carbon sequestration potential of soil aggregates by altering the quality and stability of organic carbon. J. Environ. Manag. 2024, 358, 120903. [Google Scholar] [CrossRef]
- Cheng, Z.; Guo, J.; Jin, W.; Liu, Z.; Wang, Q.; Zha, L.; Zhou, Z.; Meng, Y. Responses of SOC, labile SOC fractions, and amino sugars to different organic amendments in a coastal saline-alkali soil. Soil Tillage Res. 2024, 239, 106051. [Google Scholar] [CrossRef]
- Yin, Y.; Wang, L.; Liang, C.; Xi, F.; Pei, Z.; Du, L. Soil Aggregate Stability and Iron and Aluminium Oxide Contents Under Different Fertiliser Treatments in a Long-Term Solar Greenhouse Experiment. Pedosphere 2016, 26, 760–767. [Google Scholar] [CrossRef]
- Lang, D.; Zhou, R.; Hao, F.; Zhu, Z.; Zhang, P. Effect of Wheat Straw Addition on Organic Carbon Mineralisation and Bacterial Community in Orchard Soil. J. Soil Sci. Plant Nutr. 2023, 23, 4328–4341. [Google Scholar] [CrossRef]
- Slimani, I.; Barker, X.-Z.; Lazicki, P.; Horwath, W. Reviews and syntheses: Iron—A driver of nitrogen bioavailability in soils? Biogeosciences 2023, 20, 3873–3894. [Google Scholar] [CrossRef]
- Huang, X.; Tang, H.; Kang, W.; Yu, G.; Ran, W.; Hong, J.; Shen, Q. Redox interface-associated organo-mineral interactions: A mechanism for C sequestration under a rice-wheat cropping system. Soil Biol. Biochem. 2018, 120, 12–23. [Google Scholar] [CrossRef]
- Chen, Y.; Liu, K.; Hu, N.; Lou, Y.; Wang, F.; Wang, Y. Biochemical composition of soil organic matter physical fractions under 32-year fertilization in Ferralic Cambisol. Carbon Res. 2023, 2, 1. [Google Scholar] [CrossRef]
- You, M.; Zhu-Barker, X.; Doane, T.A.; Horwath, W.R. Decomposition of carbon adsorbed on iron (III)-treated clays and their effect on the stability of soil organic carbon and external carbon inputs. Biogeochemistry 2021, 157, 259–271. [Google Scholar] [CrossRef]
- Chen, M.; Zhang, S.; Liu, L.; Ding, X. Influence of organic fertilization on clay mineral transformation and soil phosphorous retention: Evidence from an 8-year fertilization experiment. Soil Tillage Res. 2023, 230, 105702. [Google Scholar] [CrossRef]
- Kramer, M.G.; Chadwick, O.A. Climate-driven thresholds in reactive mineral retention of soil carbon at the global scale. Nat. Clim. Chang. 2018, 8, 1104–1108. [Google Scholar] [CrossRef]
- Jiang, Y.; Zhang, S.; Gao, B.; Wei, R.; Ding, X. Fe(II)-OM Complexes Formed by Straw Returning Combined with Optimized Nitrogen Fertilizer Could Be Beneficial to Nitrogen Storage in Saline-Alkaline Paddy Soils. Agronomy 2022, 12, 2295. [Google Scholar] [CrossRef]
- Zhang, D.; Li, W.; Xin, C.; Tang, W.; Eneji, A.E.; Dong, H. Lint yield and nitrogen use efficiency of field-grown cotton vary with soil salinity and nitrogen application rate. Field Crops Res. 2012, 138, 63–70. [Google Scholar] [CrossRef]
- Shaaban, M.; Wu, Y.; Nunez-Delgado, A.; Kuzyakov, Y.; Peng, Q.A.; Lin, S.; Hu, R. Enzyme activities and organic matter mineralization in response to application of gypsum, manure and rice straw in saline and sodic soils. Environ. Res. 2023, 224, 115393. [Google Scholar] [CrossRef]
- Gu, W.; Wang, Y.; Sun, Y.; Liu, Z.; Wang, W.; Wu, D.; Zhang, Y.; Sun, W.; Wang, X.; Feng, Z.; et al. Assessing the formation and stability of paddy soil aggregate driven by organic carbon and Fe/Al oxides in rice straw cyclic utilization strategies: Insight from a six-year field trial. Sci Total Environ. 2024, 951, 175607. [Google Scholar] [CrossRef]
- Jiang, Y.; Zhang, S.; Ding, X. Exogenous Organic Carbon Strongly Affected the Coupling of Nitrate-dependent Fe(II) Oxidation in Coastal Saline-alkaline Paddy Soil. J. Soil Sci. Plant Nutr. 2023, 23, 1286–1296. [Google Scholar] [CrossRef]
- Zadoks, J.C.; Chang, T.T.; Konzak, C.F. A decimal code for the growth stages of cereals. Weed Res. 2006, 14, 415–421. [Google Scholar] [CrossRef]
- Huang, X.; Jiang, H.; Li, Y.; Ma, Y.; Tang, H.; Ran, W.; Shen, Q. The role of poorly crystalline iron oxides in the stability of soil aggregate-associated organic carbon in a rice–wheat cropping system. Geoderma 2016, 279, 1–10. [Google Scholar] [CrossRef]
- Zeng, Q.; Chen, Z.; Tan, W. Plant litter quality regulates soil eco-enzymatic stoichiometry and microbial nutrient limitation in a citrus orchard. Plant Soil 2021, 466, 179–191. [Google Scholar] [CrossRef]
- Chen, M.; Wang, X.; Ding, X.; Liu, L.; Wu, L.; Zhang, S. Effects of organic fertilization on phosphorus availability and crop growth: Evidence from a 7-year fertilization experiment. Arch. Agron. Soil Sci. 2022, 69, 2092–2103. [Google Scholar] [CrossRef]
- Zheng, W.; Zhao, Z.; Lv, F.; Wang, R.; Wang, Z.; Zhao, Z.; Li, Z.; Zhai, B. Assembly of abundant and rare bacterial and fungal sub-communities in different soil aggregate sizes in an apple orchard treated with cover crop and fertilizer. Soil Biol. Biochem. 2021, 156, 108222. [Google Scholar] [CrossRef]
- Ji, X.; Jiang, J.; Wang, Y.; Colinet, G.; Feng, W. Small straw addition enhances straw decomposition and carbon stabilized in soil aggregates over time. Soil Tillage Res. 2024, 238, 106022. [Google Scholar] [CrossRef]
- Peng, X.; Yan, X.; Zhou, H.; Zhang, Y.Z.; Sun, H. Assessing the contributions of sesquioxides and soil organic matter to aggregation in an Ultisol under long-term fertilization. Soil Tillage Res. 2015, 146, 89–98. [Google Scholar] [CrossRef]
- Fei, C.; Zhang, S.; Zhang, L.; Ding, X. Straw is more effective than biochar in mobilizing soil organic phosphorus mineralization in saline-alkali paddy soil. Appl. Soil Ecol. 2023, 186, 104848. [Google Scholar] [CrossRef]
- Meng, F.; Dungait, J.A.J.; Xu, X.; Bol, R.; Zhang, X.; Wu, W. Coupled incorporation of maize (Zea mays L.) straw with nitrogen fertilizer increased soil organic carbon in Fluvic Cambisol. Geoderma 2017, 304, 19–27. [Google Scholar] [CrossRef]
- Ren, L.; Yang, H.; Li, J.; Zhang, N.; Han, Y.; Zou, H.; Zhang, Y. Organic fertilizer enhances soil aggregate stability by altering greenhouse soil content of iron oxide and organic carbon. J. Integr. Agric. 2024, 24, 306–321. [Google Scholar] [CrossRef]
- Chen, M.; Zhang, S.; Liu, L.; Liu, J.; Ding, X. Organic fertilization increased soil organic carbon stability and sequestration by improving aggregate stability and iron oxide transformation in saline-alkaline soil. Plant Soil 2022, 474, 233–249. [Google Scholar] [CrossRef]
- Li, R.; Gao, Y.; Chen, Q.; Li, Z.; Gao, F.; Meng, Q.; Li, T.; Liu, A.; Wang, Q.; Wu, L.; et al. Blended controlled-release nitrogen fertilizer with straw returning improved soil nitrogen availability, soil microbial community, and root morphology of wheat. Soil Tillage Res. 2021, 212, 105045. [Google Scholar] [CrossRef]
- Liu, Y.; Ge, T.; Zhu, Z.; Liu, S.; Luo, Y.; Li, Y.; Wang, P.; Gavrichkova, O.; Xu, X.; Wang, J.; et al. Carbon input and allocation by rice into paddy soils: A review. Soil Biol. Biochem. 2019, 133, 97–107. [Google Scholar] [CrossRef]
- Hansen, V.; Müller-Stöver, D.; Munkholm, L.J.; Peltre, C.; Hauggaard-Nielsen, H.; Jensen, L.S. The effect of straw and wood gasification biochar on carbon sequestration, selected soil fertility indicators and functional groups in soil: An incubation study. Geoderma 2016, 269, 99–107. [Google Scholar] [CrossRef]
- Ge, Z.; Li, S.; Bol, R.; Zhu, P.; Peng, C.; An, T.; Cheng, N.; Liu, X.; Li, T.; Xu, Z.; et al. Differential long-term fertilization alters residue-derived labile organic carbon fractions and microbial community during straw residue decomposition. Soil Tillage Res. 2021, 213, 105120. [Google Scholar] [CrossRef]
- Li, H.; Dai, M.; Dai, S.; Dong, X. Current status and environment impact of direct straw return in China’s cropland—A review. Ecotoxicol. Environ. Saf. 2018, 159, 293–300. [Google Scholar] [CrossRef]
- Chen, P.; Zheng, X.; Cheng, W. Biochar combined with ferrous sulfate reduces nitrogen and carbon losses during agricultural waste composting and enhances microbial diversity. Process Saf. Environ. Prot. 2022, 162, 531–542. [Google Scholar] [CrossRef]
- Huang, X.; Kang, W.; Guo, J.; Wang, L.; Tang, H.; Li, T.; Yu, G.; Ran, W.; Hong, J.; Shen, Q. Highly reactive nanomineral assembly in soil colloids: Implications for paddy soil carbon storage. Sci. Total Environ. 2020, 703, 134728. [Google Scholar] [CrossRef]
- Yu, G.-H.; Kuzyakov, Y. Fenton chemistry and reactive oxygen species in soil: Abiotic mechanisms of biotic processes, controls and consequences for carbon and nutrient cycling. Earth-Sci. Rev. 2021, 214, 103525. [Google Scholar] [CrossRef]
- Meng, X.; Zhang, X.; Li, Y.; Jiao, Y.; Fan, L.; Jiang, Y.; Qu, C.; Filimonenko, E.; Jiang, Y.; Tian, X.; et al. Nitrogen fertilizer builds soil organic carbon under straw return mainly via microbial necromass formation. Soil Biol. Biochem. 2024, 188, 109223. [Google Scholar] [CrossRef]
- Huang, X.; Jia, Z.; Guo, J.; Li, T.; Sun, D.; Meng, H.; Yu, G.; He, X.; Ran, W.; Zhang, S.; et al. Ten-year long-term organic fertilization enhances carbon sequestration and calcium-mediated stabilization of aggregate-associated organic carbon in a reclaimed Cambisol. Geoderma 2019, 355, 113880. [Google Scholar] [CrossRef]
- Wang, K.; Ren, T.; Yan, J.; Zhu, D.; Liao, S.; Zhang, Y.; Lu, Z.; Cong, R.; Li, X.; Lu, J. Straw returning mediates soil microbial biomass carbon and phosphorus turnover to enhance soil phosphorus availability in a rice-oilseed rape rotation with different soil phosphorus levels. Agric. Ecosyst. Environ. 2022, 335, 107991. [Google Scholar] [CrossRef]
- Bei, S.; Li, X.; Kuyper, T.W.; Chadwick, D.R.; Zhang, J. Nitrogen availability mediates the priming effect of soil organic matter by preferentially altering the straw carbon-assimilating microbial community. Sci. Total Environ. 2022, 815, 152882. [Google Scholar] [CrossRef]
Disclaimer/Publisher’s Note: The statements, opinions and data contained in all publications are solely those of the individual author(s) and contributor(s) and not of MDPI and/or the editor(s). MDPI and/or the editor(s) disclaim responsibility for any injury to people or property resulting from any ideas, methods, instructions or products referred to in the content. |
© 2025 by the authors. Licensee MDPI, Basel, Switzerland. This article is an open access article distributed under the terms and conditions of the Creative Commons Attribution (CC BY) license (https://creativecommons.org/licenses/by/4.0/).