Plant Growth Regulators Reduce Flower and Pod Shedding and Optimize Pod Distribution in Soybean in Northwest China

 ,
, 
Abstract
1. Introduction
2. Materials and Methods
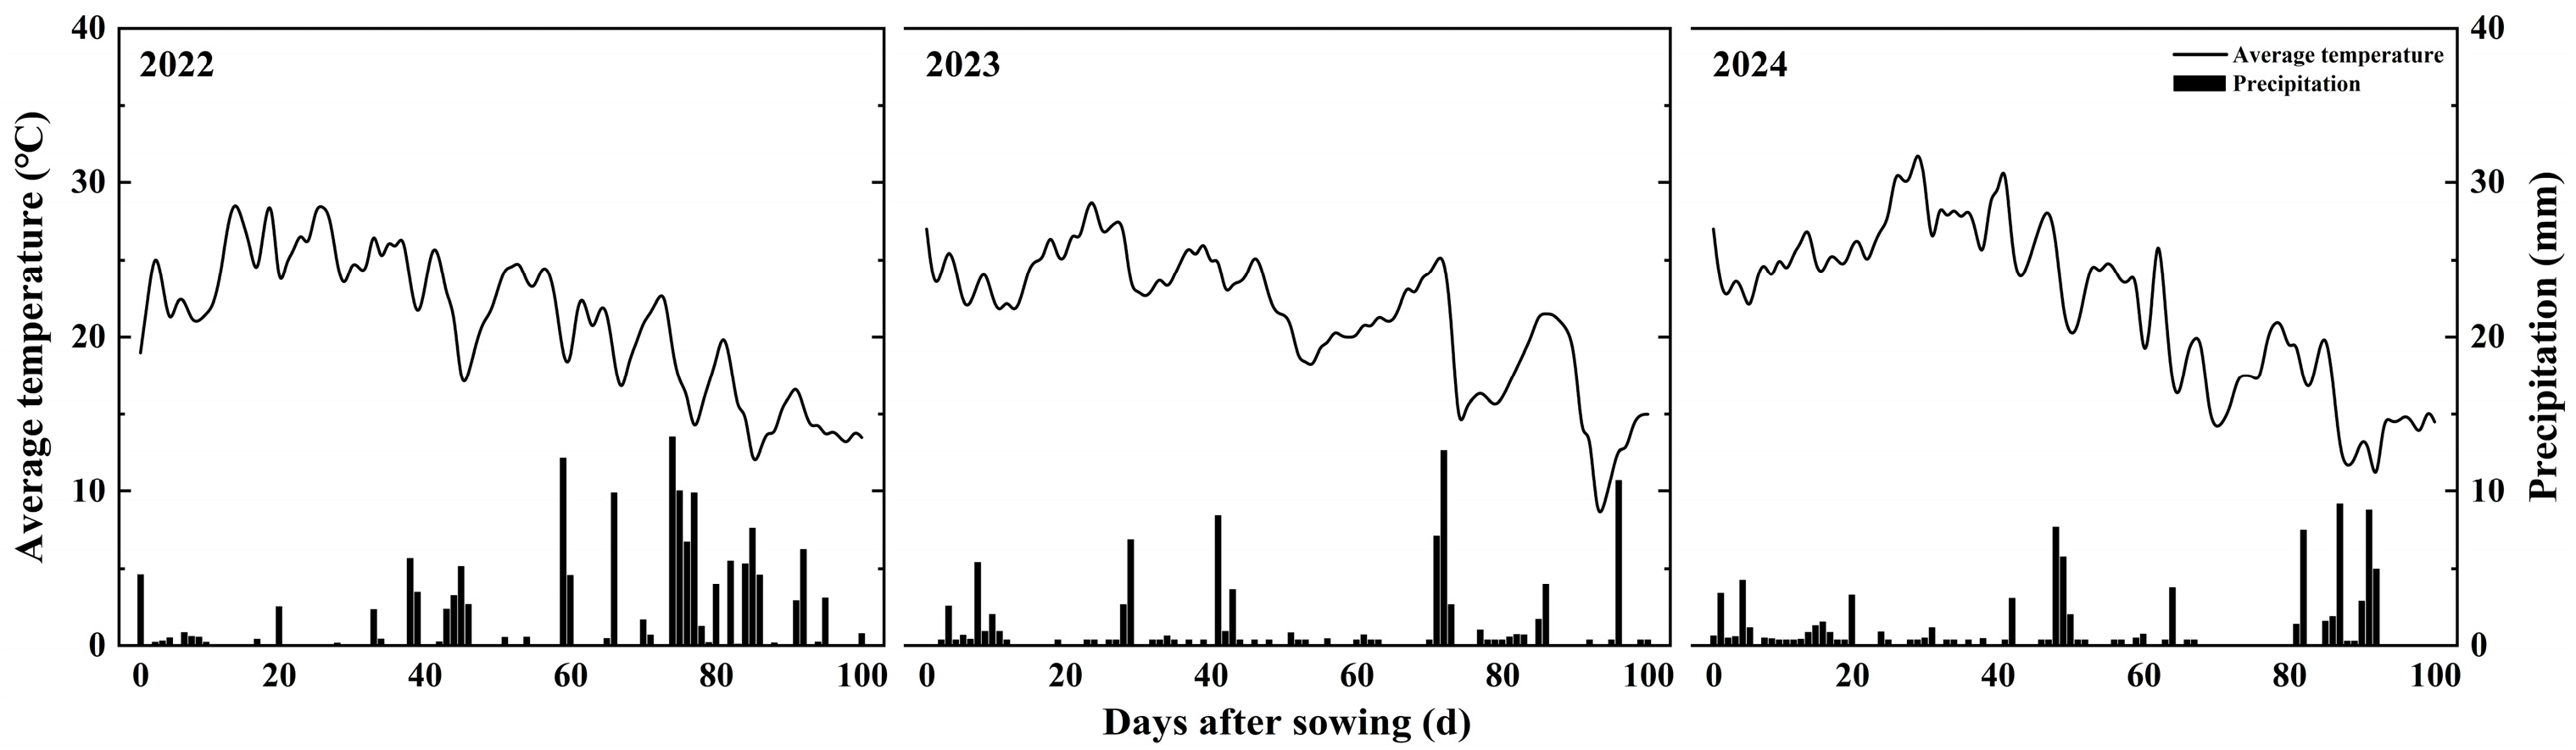
2.1. Experimental Site
2.2. Experimental Design and Management
2.3. Data Collection
2.3.1. Growth Stage Surveys
2.3.2. Investigation of Flower and Pod
2.4. Statistical Analysis
3. Results
3.1. Growth Stages
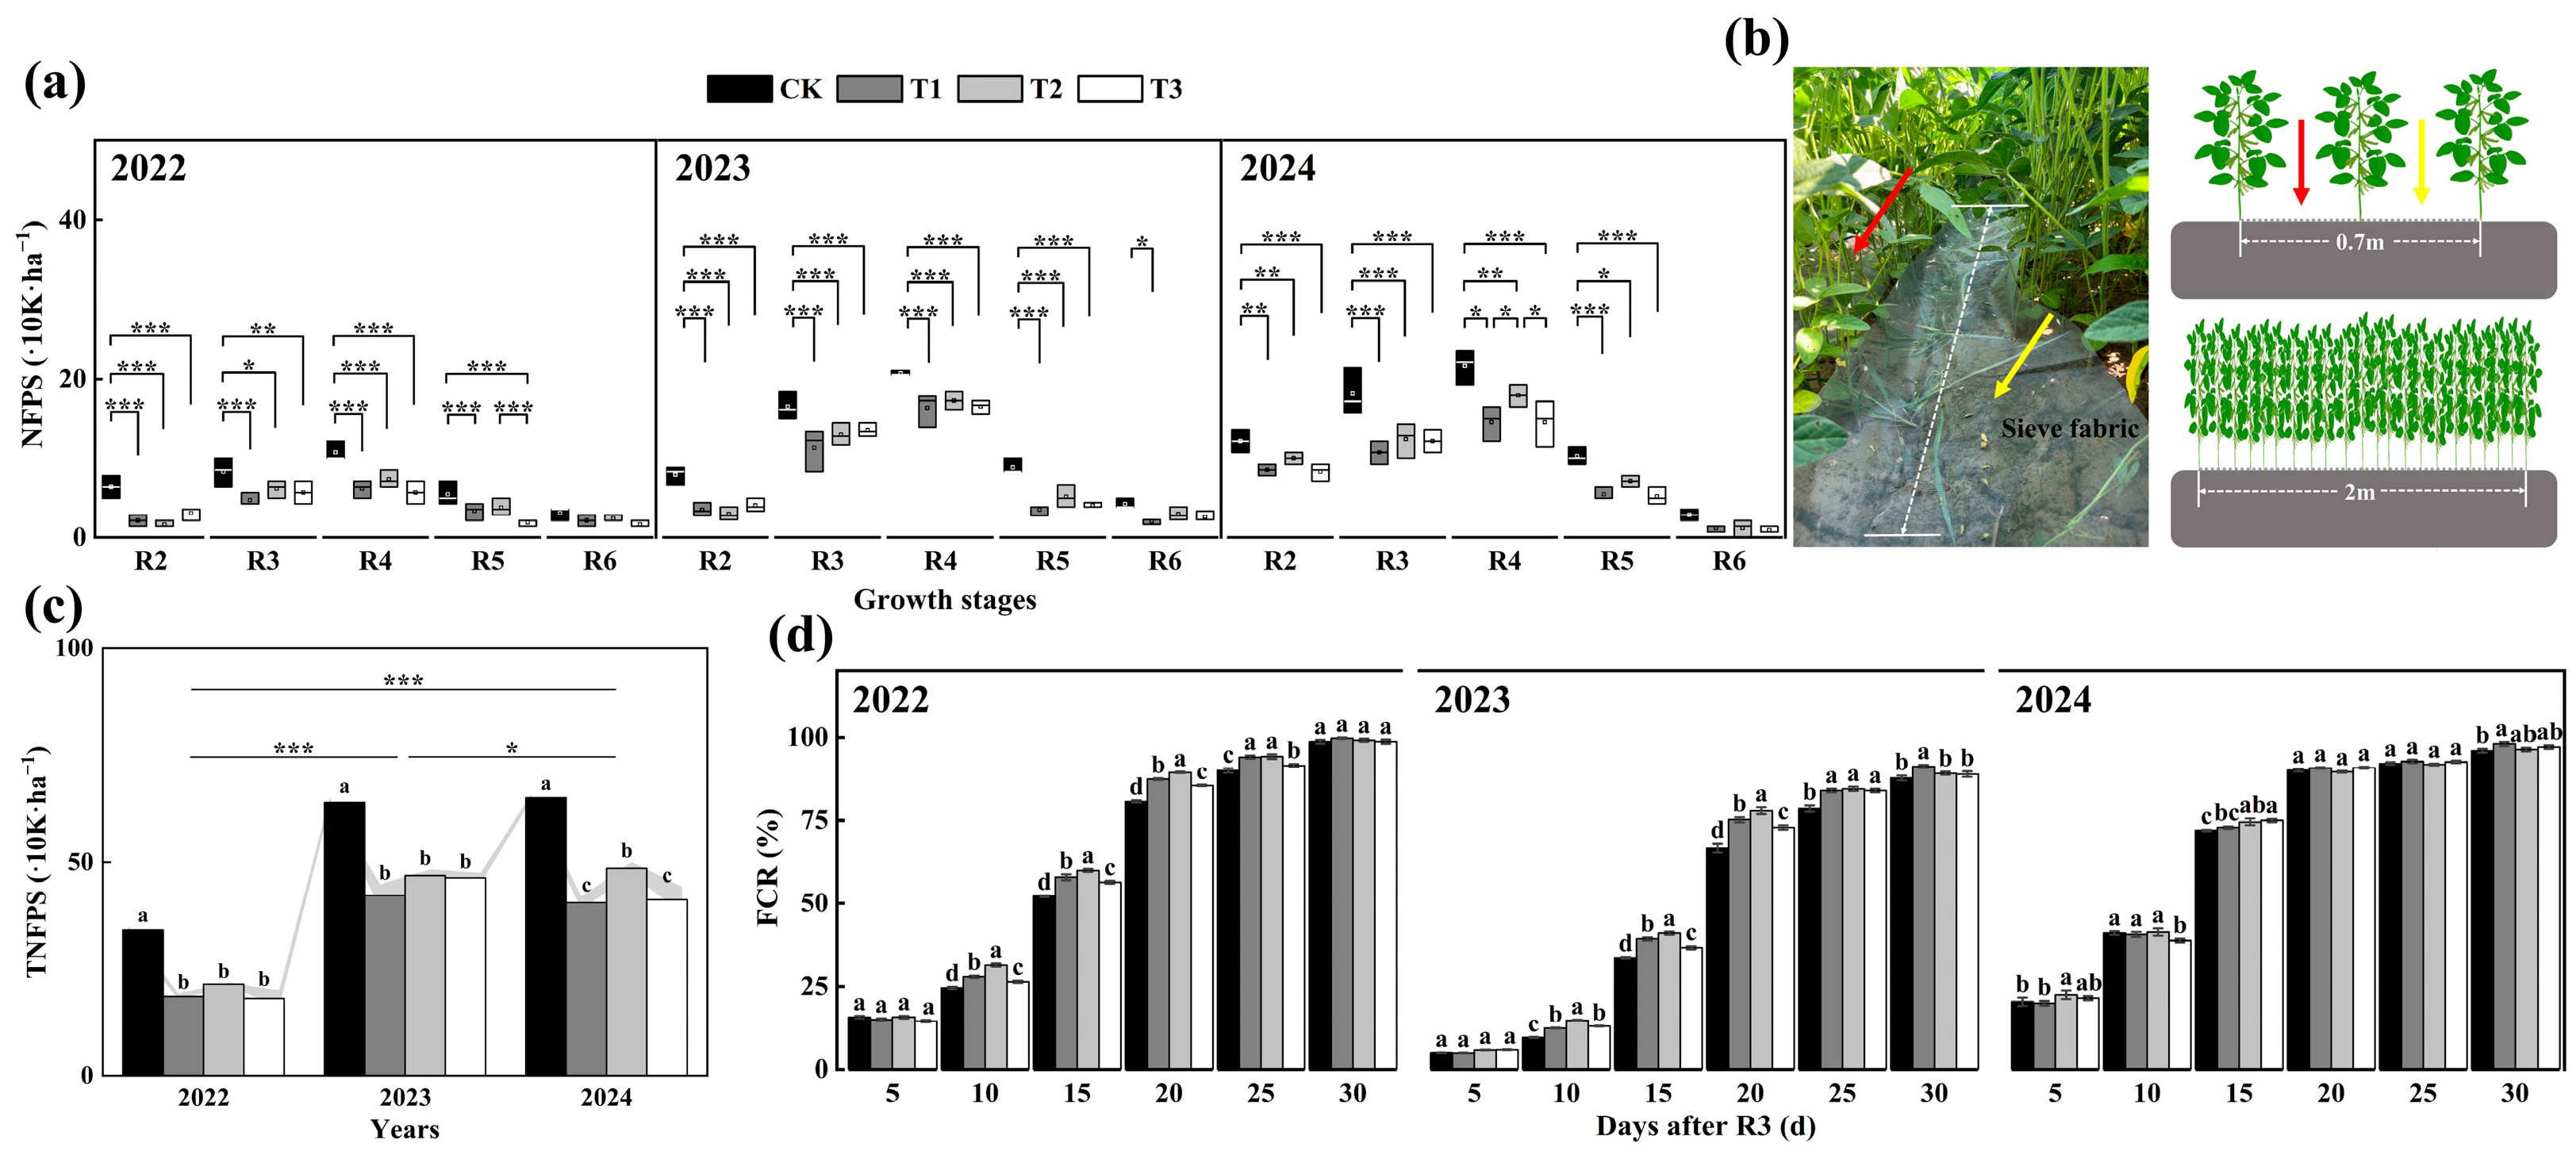
3.2. NFPS and FCR
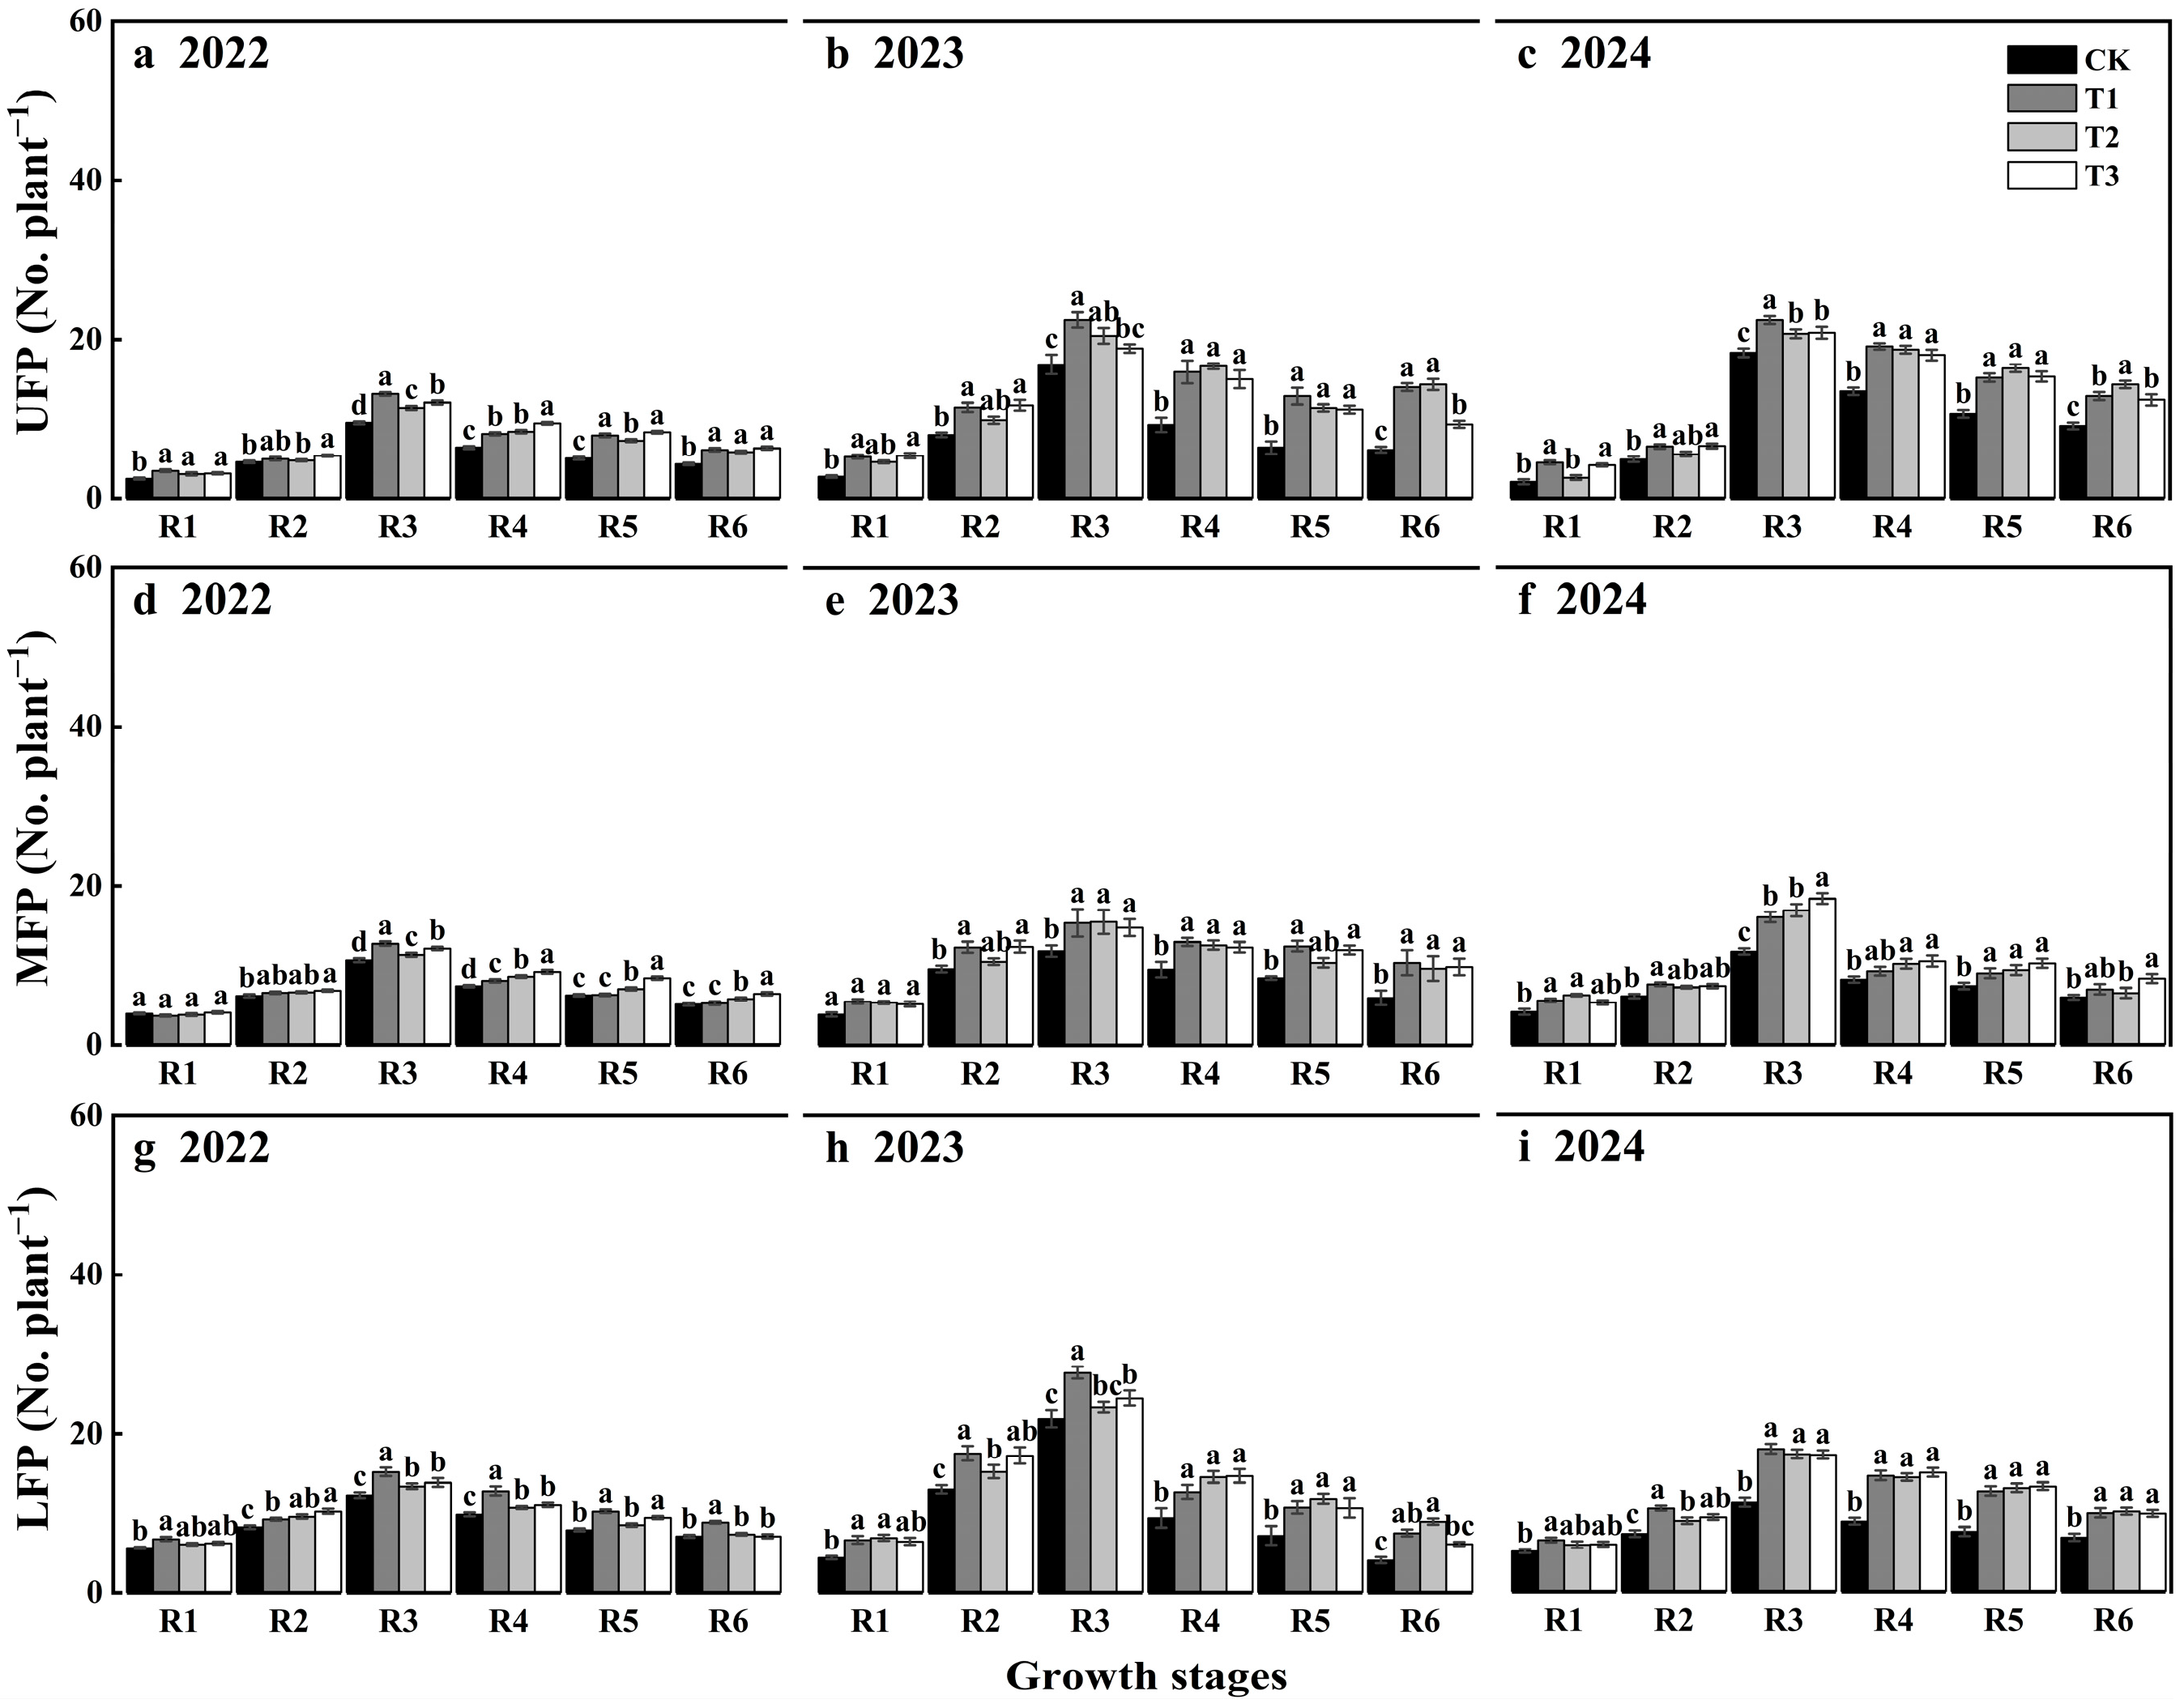
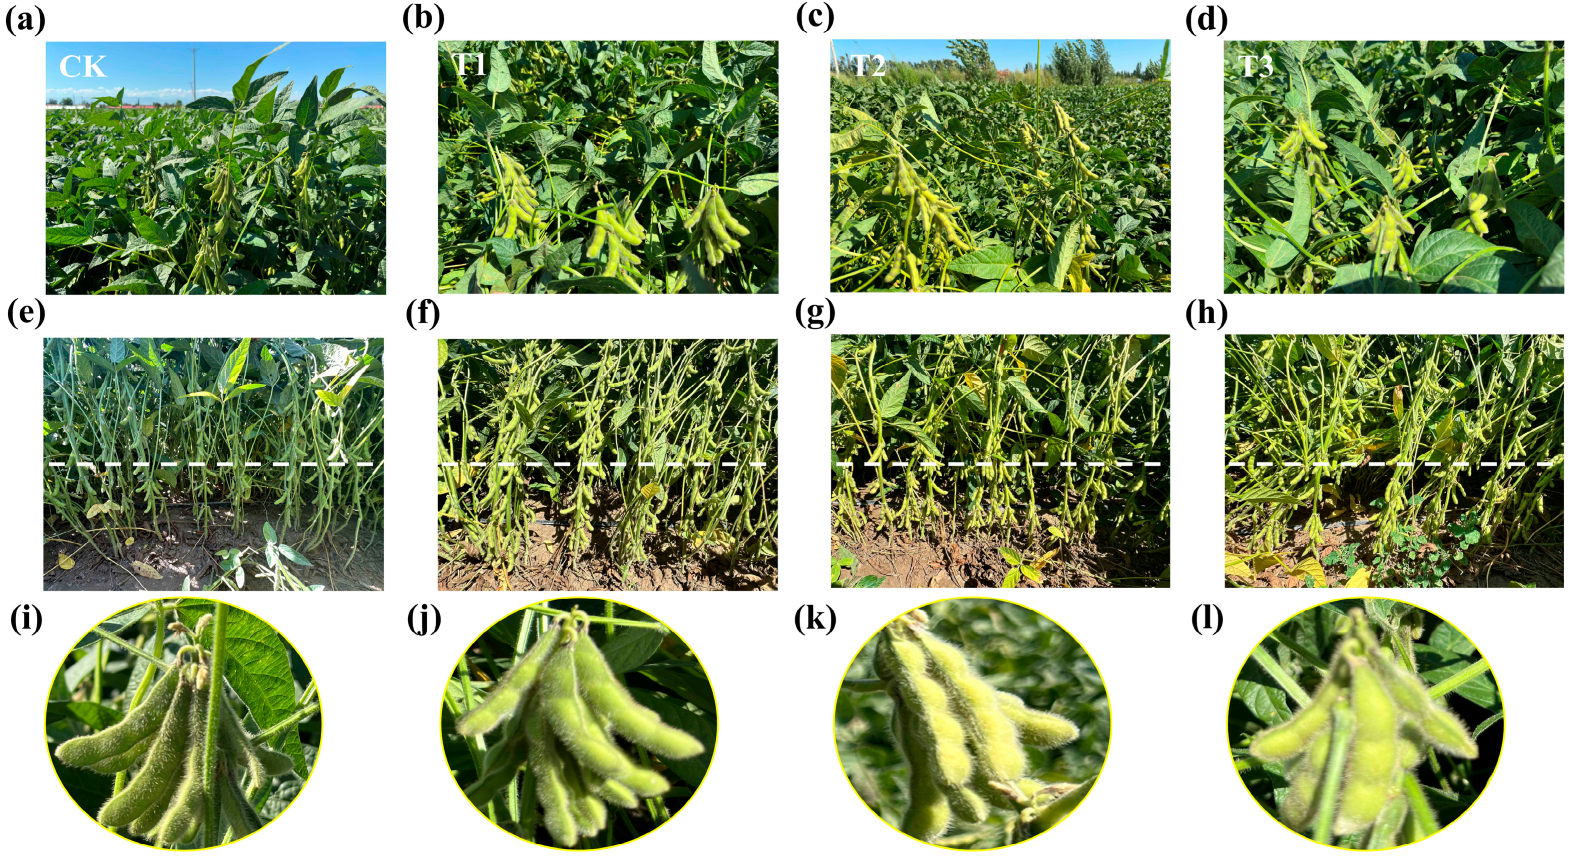
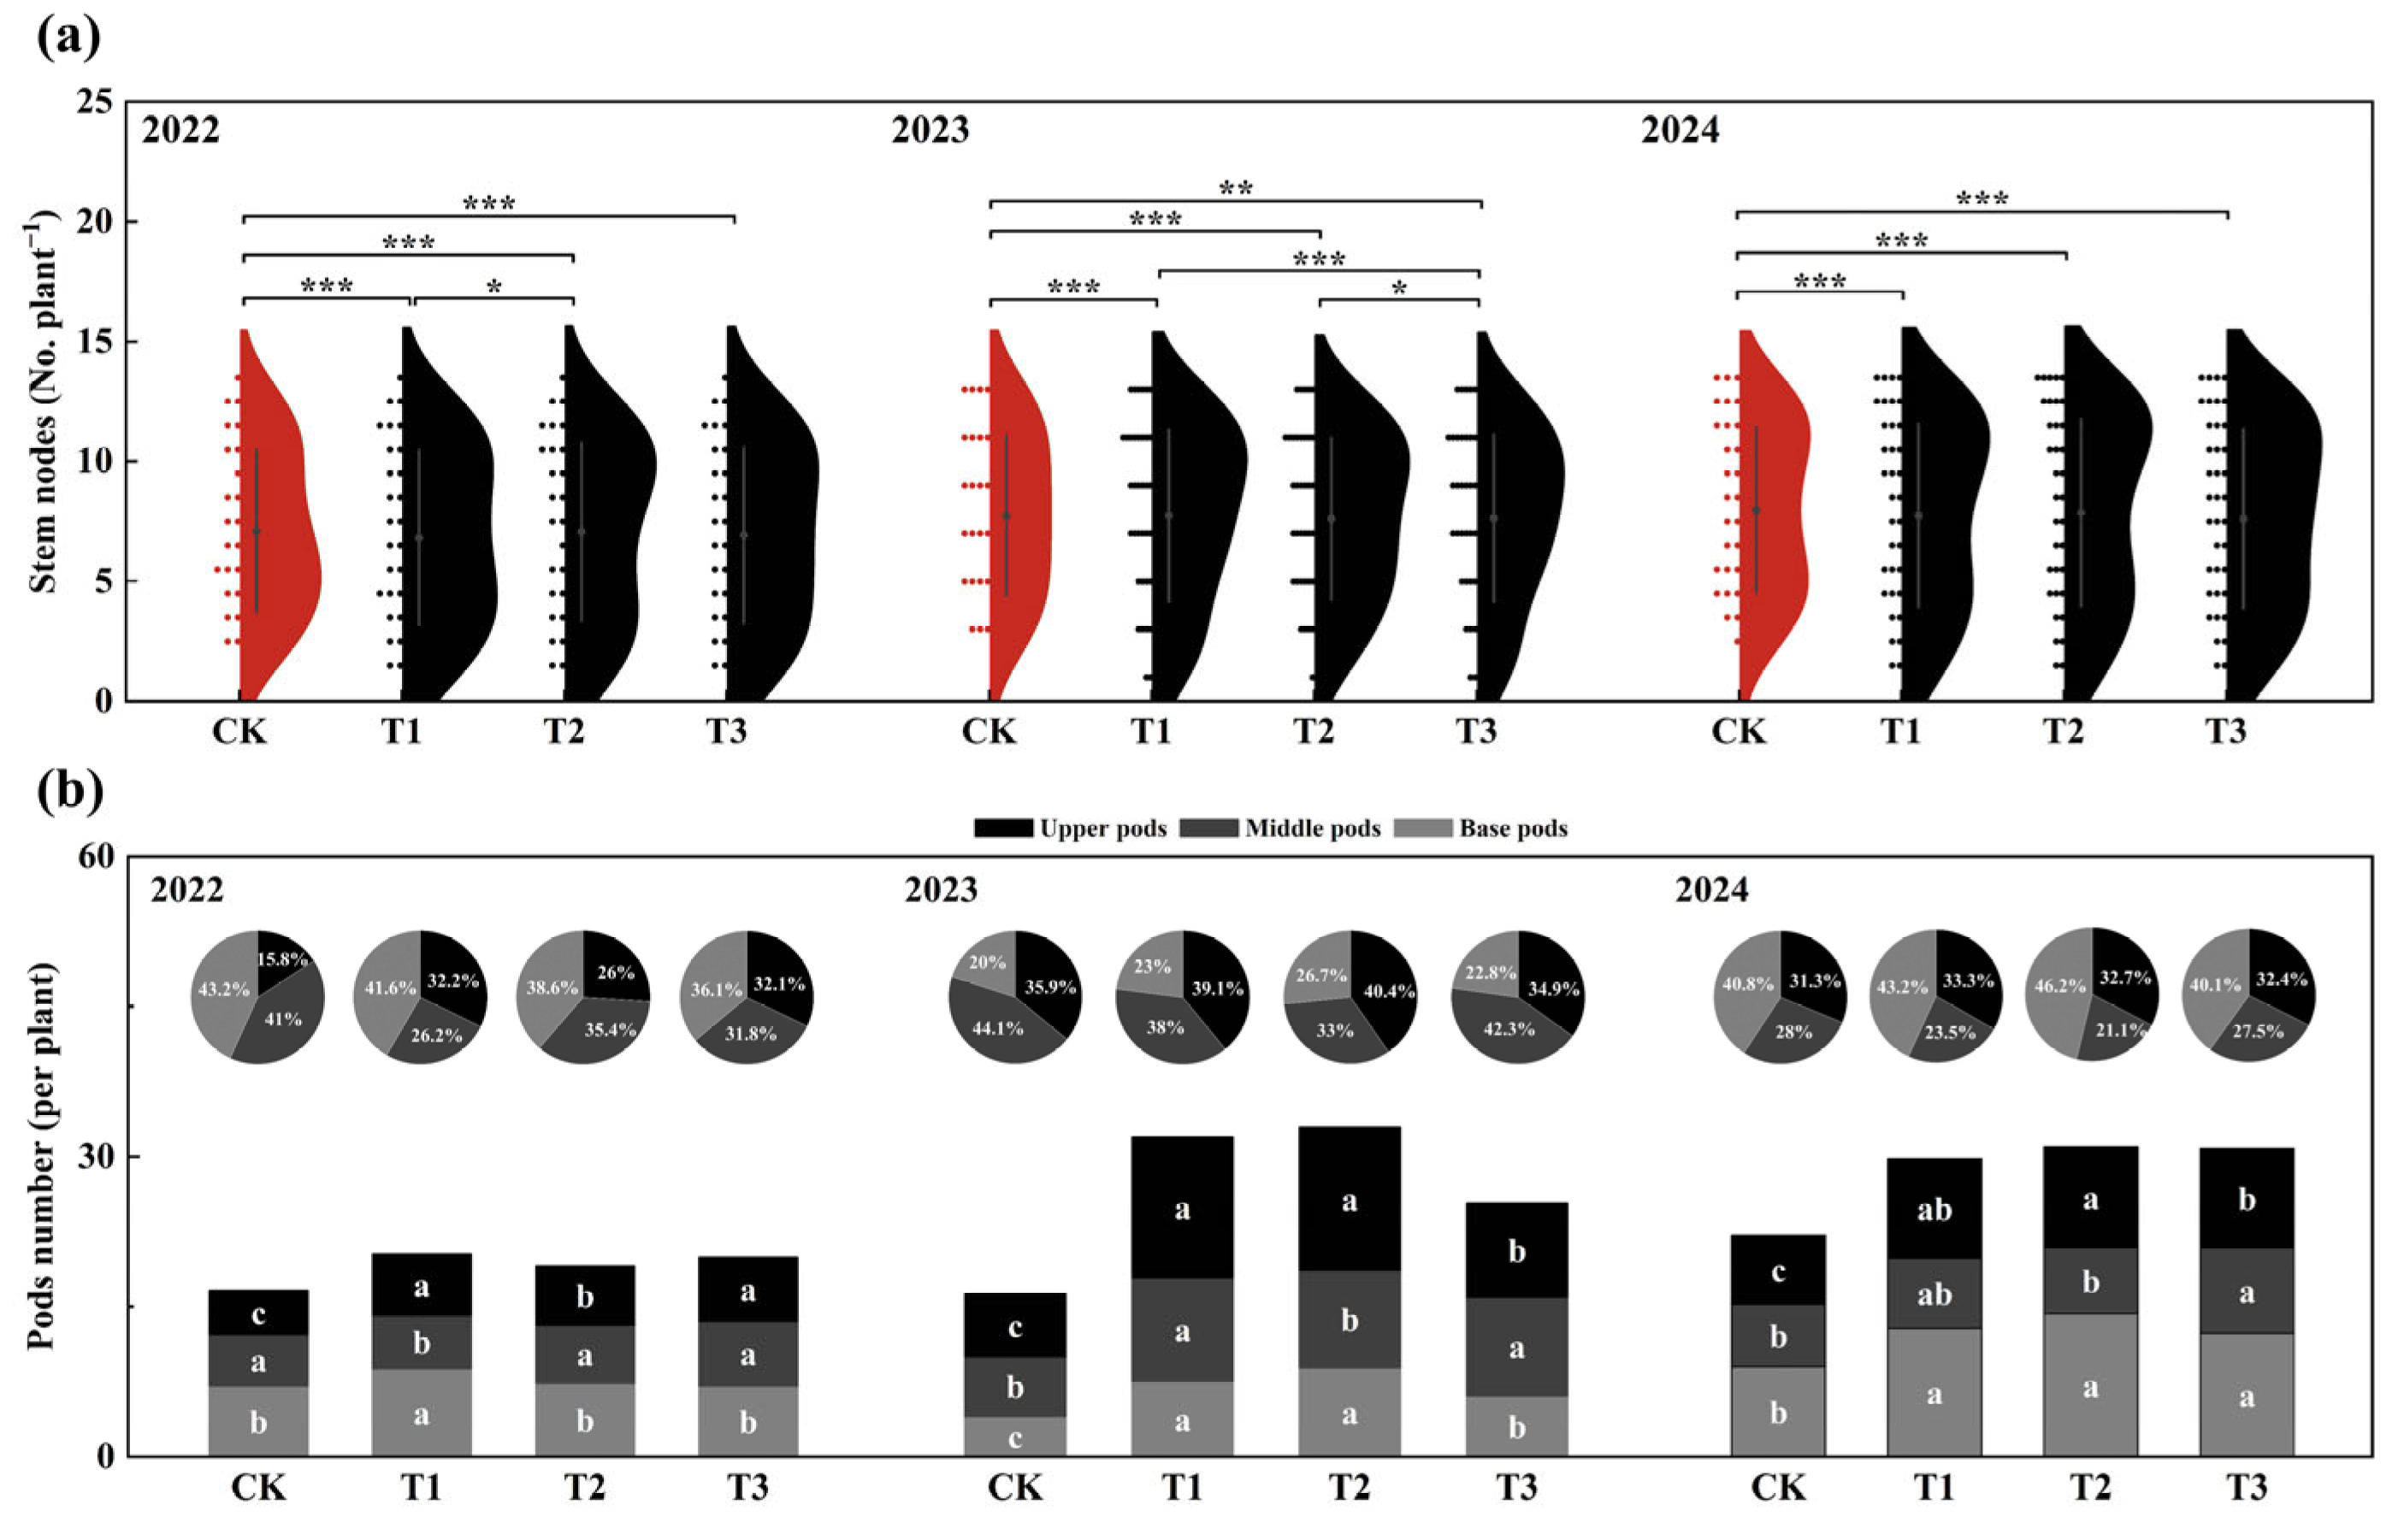
3.3. Temporal and Spatial Distribution of Flowers and Pods
3.4. Quantifying the Contribution of PGRs to Soybean Yield
4. Discussion
5. Conclusions
Author Contributions
Funding
Institutional Review Board Statement
Informed Consent Statement
Data Availability Statement
Acknowledgments
Conflicts of Interest
References
- Bouthayna, E.; Fatema, M.; Abdelhadi, A.; Ahmed, B.; Lhoussaine, M.; Abdallah, O. Physiological and agronomic effects of regulated-deficit irrigation on soybean grown under arid climatic conditions. Crop J. 2025, 13, 281–291. [Google Scholar]
- Di, Y.; You, N.; Dong, J.; Liao, X.; Song, K.; Fu, P. Recent soybean subsidy policy did not revitalize but stabilize the soybean planting areas in Northeast China. Eur. J. Agron. 2023, 147, 126841. [Google Scholar] [CrossRef]
- Aiman, S.; Aitezaz, S.; Ullah, I.; Rashida, H.; Adeel, A.; Sidra, B.; Faisal, S.; Usman, Z.; Prasad, P.; Ivica, D. Traversing the heat-A review on heat stress untangling the modern approaches in soybean (Glycine max. L). Plant Stress 2025, 15, 100731. [Google Scholar]
- Feng, L.; Wan, S.; Zhang, Y.; Dong, H. Xinjiang cotton: Achieving super-high yield through efficient utilization of light, heat, water, and fertilizer by three generations of cultivation technology systems. Field Crop. Res. 2024, 312, 109401. [Google Scholar] [CrossRef]
- Li, N.; Lin, H.; Wang, T.; Li, Y.; Liu, Y.; Chen, X.; Hu, X. Impact of climate change on cotton growth and yields in Xinjiang, China. Field Crop. Res. 2020, 247, 107590. [Google Scholar] [CrossRef]
- WNBS; PRC. Website of National Bureau of Statistics of the People’s Republic of China. Available online: https://data.stats.gov.cn/english/easyquery.htm?cn=E0103 (accessed on 10 October 2024).
- David, S.; Cesar, A.; Iker, A. Additive effects of heatwave and water stresses on soybean seed yield is caused by impaired carbon assimilation at pod formation but not at flowering. Plant Sci. 2022, 321, 111320. [Google Scholar]
- Quijano, A.; Morandi, E. Leaf area reduction during the pod set period changes the photomorphogenic light balance and increases the pod number and yield in soybean canopies. Field Crop. Res. 2023, 303, 109148. [Google Scholar] [CrossRef]
- Rolando, G.; Moraglio, S.; Caratti, A.; Cordero, C.; Borreani, G.; Tavella, L. Quantitative and qualitative damage caused by Halyomorpha halys (Hemiptera: Pentatomidae) on soybean crop at different growth stages. Crop Prot. 2025, 187, 106987. [Google Scholar] [CrossRef]
- Sankarapillai, L.; Adhikari, B.; Bista, M.; Shrestha, A.; Stetina, S.; Reddy, K.; Bheemanahalli, R. High night temperature disrupts the assimilate utilization and yield potential in soybean. Plant Stress 2025, 100826. [Google Scholar] [CrossRef]
- Di Mauro, G.; Rotundo, J. Lodging dynamics and seed yield for two soybean genotypes with contrasting lodging-susceptibility. Eur. J. Agron. 2025, 163, 127445. [Google Scholar] [CrossRef]
- Komaljeet, G.; Pankaj, K.; Shivanti, N.; Rajnish, S.; Ajay, K.; Ivan, I.; Ekaterina, A. Physiological perspective of plant growth regulators in flowering, fruit setting and ripening process in citrus. Sci. Hortic. 2023, 309, 111628. [Google Scholar]
- Loseke, B.; Read, P.; Blankenship, E. Preventing spring freeze injury on grapevines using multiple applications of Amigo Oil and naphthaleneacetic acid. Sci. Hortic. 2015, 193, 294–300. [Google Scholar] [CrossRef]
- Cai, W.; Gao, Y.; Liu, H.; Zhang, H.; Zhou, X.; Zhang, Y.; Shen, Z. The synergistic effect of EDTA-Fe and 1-naphthaleneacetic acid on the growth and carbohydrate content of Scenedesmus obliquus. Algal Res. 2023, 69, 102921. [Google Scholar] [CrossRef]
- Xing, X.; Cao, C.; Li, S.; Wang, H.; Xu, Z.; Qi, Y.; Wang, X. α-naphthaleneacetic acid positively regulates soybean seed germination and seedling establishment by increasing antioxidant capacity, triacylglycerol mobilization and sucrose transport under drought stress. Plant Physiol. Biochem. 2023, 201, 107890. [Google Scholar] [CrossRef]
- Nakayama, I.; Kobayashi, M.; Kamiya, Y.; Abe, H.; Sakurai, A. Effects of a plant-growth regulat or, prohexadione-calcium (BX-112), on the endogenous levels of gibberellins in rice. Plant Cell Physiol. 1992, 33, 59–62. [Google Scholar]
- Luis, A.; Simó, A.; Ramon, M. Effect of paclobutrazol, prohexadione-Ca, deficit irrigation, summer pruning and root pruning on shoot growth, yield, and return bloom, in a ‘Blanquilla’ pear orchard. Sci. Hortic. 2007, 113, 142–148. [Google Scholar]
- Kim, H.; Lee, H.; Kang, J.; Hwang, S. Prohexadione-calcium application during vegetative growth affects growth of mother plants, runners, and runner plants of Maehyang strawberry. Agronomy 2019, 9, 155. [Google Scholar] [CrossRef]
- Feng, N.; Yu, M.; Li, Y.; Zheng, D. Prohexadione-calcium alleviates saline-alkali stress in soybean seedlings by improving the photosynthesis and up-regulating antioxidant defense. Ecotoxicol. Environ. Saf. 2021, 220, 112369. [Google Scholar] [CrossRef]
- Skłodowska, M.; Mielczarz, K.; Chojak-Koźniewska, J.; Naliwajski, M.; Żyźniewska, M.; Góralczyk-Bińkowska, A. Antioxidant response of cucumber leaf tissues treated with prohexadione-Ca to infection with Pseudomonas syringae pv. lachrymans. Sci. Hortic. 2021, 289, 110452. [Google Scholar] [CrossRef]
- Zhou, W.; Chen, J.; Zhou, R.; Xiao, J.; Li, Y.; Ren, Y.; Li, B. Evaluation of Iron Chlorin e6 disappearance and hydrolysis in soil and garlic using salting-out assisted liquid-liquid extraction coupled with high-performance liquid chromatography and ultraviolet-visible detection. Food Chem. 2024, 447, 138960. [Google Scholar] [CrossRef]
- Ahmed, I.; Ali, E.; Gad, A.; Bardisi, A.; El-Tahan, A.; Abd Esadek, O.; Gendy, A. Impact of plant growth regulators spray on fruit quantity and quality of pepper (Capsicum annuum L.) cultivars grown under plastic tunnels. Saudi J. Biol. Sci. 2022, 29, 2291–2298. [Google Scholar] [CrossRef] [PubMed]
- Cokuraj, M.; Manokari, M.; Mohammad, F.; Alatar, A.; Shekhawat, M. Synergistic effects of growth regulators and silicon nanoparticles on enhancing morpho-structural stability in Vitex agnus-castus L. plantlets. S. Afr. J. Bot. 2025, 177, 500–509. [Google Scholar]
- Musacchi, S.; Sheick, R.; Mia, M.; Serra, S. Studies on physiological and productive effects of multi-leader training systems and Prohexadione-Ca applications on apple cultivar ‘WA 38’. Sci. Hortic. 2023, 312, 111850. [Google Scholar] [CrossRef]
- Ishfaq, S.; Ding, Y.; Liang, X.; Guo, W. Advancing lodging resistance in maize: Integrating genetic, hormonal, and agronomic insights for sustainable crop productivity. Plant Stress 2025, 15, 100777. [Google Scholar] [CrossRef]
- Dubey, A.; Malla, M.; Kumar, A.; Khan, M.; Kumari, S. Seed bio-priming with ACC deaminase-producing bacterial strains alleviates impact of drought stress in Soybean (Glycine max (L.) Merr.). Rhizosphere 2024, 30, 100873. [Google Scholar] [CrossRef]
- Huang, X.; Zheng, D.; Feng, N.; Huang, A.; Zhang, R.; Meng, F.; Zhou, H. Effects of prohexadione calcium spraying during the booting stage on panicle traits, yield, and related physiological characteristics of rice under salt stress. PeerJ 2023, 11, e14673. [Google Scholar] [CrossRef]
- Ibrahim, H.; Ali, B.; El-Keblawy, A.; Ksiksi, T.; El-Esawi, M.; Jośko, I.; Sheteiwy, M. Effect of source–sink ratio manipulation on growth, flowering, and yield potential of soybean. Agriculture 2021, 11, 926. [Google Scholar] [CrossRef]
- Villafañe, D.; Maldonado, R.; Bianchi, J.; Kurth, D.; Gramajo, H.; Chiesa, M.; Rodríguez, E. Streptomyces N2A, an endophytic actinobacteria that promotes soybean growth and increases yield and seed quality under field conditions. Plant Sci. 2024, 343, 112073. [Google Scholar] [CrossRef]
- Cabral, I.; Araujo, A.; Bonifácio, A.; Costa, M.; Araujo, F. Secondary metabolites of Urochloa ruziziensis on growth, nodulation, and spectral responses of soybean. Plant Stress 2024, 11, 100335. [Google Scholar] [CrossRef]
- Shehzad, M.; Munir, M.; Nazim, M.; Tahir, M.; Maqbool, M.; Nawaz, M.; Javeed, H.; Al-Ghamdi, A. Evaluating the impact of phyto-hormones on the morpho-biochemical traits of soybean through seed treatment and foliar application. J. King Saud Univ. Sci. 2024, 36, 103446. [Google Scholar] [CrossRef]
- Barrera, W.; Morbidini, F.; Zammarchi, L.; Ghinassi, G.; Maucieri, C.; Borin, M.; Marta, A.; Verdi, L. Assessing the impacts of regulated deficit irrigation on soybean using AquaCrop. Ital. J. Agron. 2024, 19, 100023. [Google Scholar] [CrossRef]
- Merwe, R.; Labuschagne, M.; Smit, A. Cultivar variability and stability of vegetable-type soybean for seed yield and pod shattering. S. Afr. J. Bot. 2024, 166, 106–115. [Google Scholar] [CrossRef]
- Sarkar, M.; Sarkar, A.; Roy, S. Fertigation of NaCl-stressed lentil and soybean plants with silica nanoparticles improves seed yield and nutritional attributes. Plant Nano Biol. 2024, 8, 100068. [Google Scholar] [CrossRef]
- Charnobay, A.; Rondina, A.; Balbinot Junior, A.; Hungria, M.; Nogueira, M. Soil microbial attributes and soybean yield response to off-season crop diversification in an Oxisol in Southern Brazil. Appl. Soil Ecol. 2025, 209, 106040. [Google Scholar] [CrossRef]


Disclaimer/Publisher’s Note: The statements, opinions and data contained in all publications are solely those of the individual author(s) and contributor(s) and not of MDPI and/or the editor(s). MDPI and/or the editor(s) disclaim responsibility for any injury to people or property resulting from any ideas, methods, instructions or products referred to in the content. |
© 2025 by the authors. Licensee MDPI, Basel, Switzerland. This article is an open access article distributed under the terms and conditions of the Creative Commons Attribution (CC BY) license (https://creativecommons.org/licenses/by/4.0/).
Share and Cite
Cheng, H.; Xu, Q.; Ding, C.; Meng, Z.; Zhao, F.; Gan, Y.; Song, X.; Zhao, Q. Plant Growth Regulators Reduce Flower and Pod Shedding and Optimize Pod Distribution in Soybean in Northwest China. Agronomy 2025, 15, 924. https://doi.org/10.3390/agronomy15040924
Cheng H, Xu Q, Ding C, Meng Z, Zhao F, Gan Y, Song X, Zhao Q. Plant Growth Regulators Reduce Flower and Pod Shedding and Optimize Pod Distribution in Soybean in Northwest China. Agronomy. 2025; 15(4):924. https://doi.org/10.3390/agronomy15040924
Chicago/Turabian StyleCheng, Hao, Qinglan Xu, Chenfang Ding, Ziyi Meng, Feifei Zhao, Yuchen Gan, Xinghu Song, and Qiang Zhao. 2025. "Plant Growth Regulators Reduce Flower and Pod Shedding and Optimize Pod Distribution in Soybean in Northwest China" Agronomy 15, no. 4: 924. https://doi.org/10.3390/agronomy15040924
APA StyleCheng, H., Xu, Q., Ding, C., Meng, Z., Zhao, F., Gan, Y., Song, X., & Zhao, Q. (2025). Plant Growth Regulators Reduce Flower and Pod Shedding and Optimize Pod Distribution in Soybean in Northwest China. Agronomy, 15(4), 924. https://doi.org/10.3390/agronomy15040924