Article

Biochar and Mulch: Hydrologic, Erosive, and Phytotoxic Responses Across Different Application Strategies and Agricultural Soils

by
João N. G. V. Canedo
1,*,
Luísa Coelho
1,
Livian Castro
2,
Frank G. A. Verheijen
3 and
Sergio Prats
1,4
1
MED—Mediterranean Institute for Agriculture, Environment and Development, Universidade de Évora, Núcleo da Mitra Gab, 206, Edifício dos Regentes Agrícolas, Apartado 94, 7006-554 Évora, Portugal
2
Universidade do Estado do Amapá, CamTerritório dos Lagos, Av. Pres. Vargas, 650—Central, Macapá 68901-258, AP, Brazil
3
CESAM-Centre for Environmental and Marine Studies, Universidade de Aveiro, Campus Universitário de Santiago, Avenida da Universidade de Aveiro, 3810-193 Aveiro, Portugal
4
Misión Biológica de Galicia—National Spanish Research Council (MBG-CSIC), 36143 Salcedo, Pontevedra, Spain
*
Author to whom correspondence should be addressed.
Agronomy 2025, 15(4), 926; https://doi.org/10.3390/agronomy15040926
Submission received: 6 March 2025 / Revised: 26 March 2025 / Accepted: 7 April 2025 / Published: 10 April 2025
(This article belongs to the Section Agroecology Innovation: Achieving System Resilience)

Abstract

:
Agricultural intensification often contributes to soil degradation. Mulch and biochar help reduce erosion and runoff while improving organic matter and crop habitat. However, optimal application strategies and the combined advantages of mulch and biochar remain underexplored. This study aimed to evaluate how biochar and mulch affect soil hydrology, erosion, and phytotoxicity, under mixed and layered application strategies: (i) biochar mix (2.8% by weight); (ii) biochar layer (surface application of 10 Mg ha−1); (iii) mulch layer (2 Mg ha−1 of straw mulch); and (iv) mulch + biochar layer (a straw mulch layer of 2 Mg ha−1 on top of a biochar layer of 10 Mg ha−1). Thirty-minute rainfall simulations (at 85.6 mm h−1) on sandy loam soils of a vineyard and olive orchard tested treatment effects on soil hydrology and erosion. The leachate collected from the simulations was used to test treatments phytotoxicity, using Lactuca sativa L. Runoff and interrill erosion decreased by 52–91% and 55–81%, respectively, with the greatest reductions in the treatments that included a mulch layer. Biochar increased root length (29–45%), while mulch had no significant effect. The mulch + biochar treatment performed best, highlighting the products’ complementary benefits in reducing soil degradation and improving soil habitat.

1. Introduction

Inefficient land management practices in Mediterranean agricultural regions can accelerate desertification, leading to severe agronomic, economic, and environmental consequences [1]. Soil degradation processes, including erosion and compaction, can significantly deplete organic matter, lower crop yields, and reduce overall soil health, thereby threatening food security [2,3,4,5]. In Portugal’s Alentejo region, agricultural intensification is progressing rapidly despite the area’s dry Mediterranean conditions and its traditional reliance on extensive, multifunctional farming systems [6]. Sustainable practices, such as mulch application, are being explored as potential solutions to mitigate the negative impacts of this intensification on soil ecosystem services, which remain a subject of debate [7,8].
Organic mulching has demonstrated potential in reducing surface runoff, consequently preventing erosion, and enhancing soil organic matter contents. These are the main environmental problems associated with agriculture in Mediterranean regions [2,9,10,11,12,13], where soil losses in vineyards and olive orchards can reach up to 90 t/ha/year [1]. Biochar, a carbon-rich substance produced via pyrolysis of organic biomass under limited oxygen conditions, can also alter soil hydrology and erosion patterns, potentially aiding in the restoration of degraded soils [14,15,16]. Biochar increases soil organic matter and enhances physical and chemical properties, having great potential to improve soil habitat [14]. If used in the right way, it can improve soil fertility and boost crop yields [17,18,19,20,21].
Optimal soil application methods of biochar and the combined effect of mulch and biochar remain underexplored and under debate. The European Union Green Deal targets no-tillage management options, which eliminates plowing and reduces soil disturbance, enhancing organic matter retention [19,22]. However, according to [15], mixing biochar into the soil can improve infiltration, by decreasing bulk density and consequently increasing porosity. Biochar phytotoxicity is also an important consideration, as it is highly variable and depends on factors such as the biomass source, pyrolysis temperature, and application rate. At low concentrations (up to 4%), its effects are usually beneficial [23]. Key factors typically responsible for biochar toxicity include pH, EC (electrical conductivity), polycyclic aromatic hydrocarbons (PAHs), and heavy metals [23]. Additionally, soil characteristics can influence the effects of biochar. Therefore, comprehensive assessments should be conducted before its use as a soil amendment [23].
This study aimed to analyze the effects of commercial biochar (derived from acacia residues) and straw mulch applications on soil hydrology, erosion control, and phytotoxicity. Our approach was rainfall simulations applied to a wide range of application strategies, i.e., homogeneous soil-mixing schemes (bare soil or biochar), or heterogeneous soil surface-applied layers of biochar or mulch (or both), using sandy loam soils from a vineyard and olive orchard of the Portuguese Alentejo Mediterranean region. The soils of this region, due to agricultural overexploitation, lost part of their capacity to retain water and are now very prone to erosion and, consequently, increasingly losing organic matter. This study’s specific objectives were the following: (a) to determine the effect of the four treatments (soil mixed with biochar, soil with a biochar layer, soil with a mulch layer, soil with a mulch layer on top of a biochar layer) on the soil water balance, using runoff volume, leachate volume, soil water storage volume, and runoff/leachate timing; (b) to determine the effectiveness of these treatments to mitigate interrill and rainsplash erosion; and (c) to assess how the different treatments affect germination/plant growth and physical properties of the leachate, through germination tests and pH/EC measurements, respectively.
By assessing the optimal application approach and the combined effects of biochar and mulch, which remain underexplored in the existing body of literature, we aim to develop the best solutions to mitigate degradation in erosion-prone, overexploited Mediterranean soils, such as those found in the Alentejo region.

2. Materials and Methods

The impact of two application strategies (soil-mixed and surface-layered) on runoff, leachate, soil water storage, runoff, leachate timing, interrill erosion, and rainsplash erosion was assessed using a rainfall simulator. Four different treatments (soil mixed with biochar, soil with a biochar layer, soil with a mulch layer, and soil with a mulch layer on top of a biochar layer) were tested, each with nine repetitions. Additionally, bare soil served as a control and was categorized as a mixed condition. This study was conducted on two intensively cultivated soils, one from a vineyard and the other from an olive orchard, both collected at a depth of 10 cm and sieved to 5 mm (Table 1). The soils were collected in September 2023, and the experiments were conducted from October 2023 to July 2024.
Leachate from each treatment and the control was submitted to germination tests. These tests were conducted separately in the water collected from minutes 0 to 10, 10 to 20, and 20 to 30 of the thirty-minute rainfall simulations.

2.1. Plot Preparation

The rainfall simulation setup included a metal tray with a 60 × 60 cm frame inclined at 15°. The tray was subdivided into three equal subplots (60 × 20 cm), each designed to collect runoff and leachate separately. A 5 mm metal grid covered with geotextile fabric allowed leachate to pass beneath each subplot. To collect rain-splashed soil and water from the entire tray, an external metal frame (20 cm wide) was installed, directing material to a geotextile filter. After, the filter was dried at 105 °C for 24 h to determine the rainsplash erosion, which is a result of the impact of rain drops directly on soil particles [24].
Approximately 4.5 kg of air-dried soil, sieved to 5 mm, was placed in each subplot, levelled to a depth of 3 ± 0.2 cm using a straight-edged blade. A small ring (2 cm height, 5.5 cm diameter) was used to measure bulk density (1.3 ± 0.1 g cm3). Biochar and mulch were applied at rates of 10 Mg ha1 and 2 Mg ha1, respectively. In the biochar-mixed treatment, the same amount of biochar as the surface application was mixed into the soil, corresponding to a 2.8% biochar concentration.

2.2. Simulated Rainfall

The rainfall simulator, adapted from [9], used a full-cone nozzle (1/4-HH-14W FullJet, Spraying Systems Co., Wheaton, IL, USA) with a 3.6 mm orifice diameter and a 120° spray angle. The simulator produced rainfall at an intensity of 85.6 ± 4.6 mm h1, achieving a 4.4% uniformity coefficient (n = 5), calculated using the method found in [25], from measurements with 24 rain gauges (plastic cups) spread uniformly over the tray. Each simulation lasted 30 min under controlled laboratory conditions, with raindrops falling from a 2 m height. Mean drop diameter and velocity were 0.52 ± 0.21 mm and 1.41 ± 1.03 m s1, respectively. This intensity of precipitation over a thirty-minute period mimicked extreme rainfall events that would occur on average less than every 100 years in Portugal [16,26].
Runoff samples containing eroded sediments were collected every minute using aluminum trays. The runoff water volume was determined by subtracting wet and dry weights. Leachate was collected at 10 min intervals in plastic containers and weighed immediately post-simulation. Rainsplash erosion was collected at the end of the simulations, dried, and quantified. Runoff start and end times, as well as leachate start times, were recorded. Runoff/leachate start times were annotated when two or more drops fell from the outlets in less than 3 s and end times when the time gap between two consecutive drops was higher than 3 s. Soil weight before and after rainfall was used to determine the soil water storage volume. Then, the infiltration water was calculated as the sum of leachate (mm) plus the soil water storage volume (mm). Interrill and rainsplash erosion rates were quantified after drying at 105 °C for 24 h.

2.3. Germination Tests

Leachate from each treatment and the control were submitted to germination tests. A potentiometer (Hanna Instruments HI9814) was used to determine this water pH (scale 1–14) and EC (mS cm1). The laboratory germination experiment followed the Phytotoxkit protocol (MicroBioTest Inc., Sterling, VA, USA), outlined by [27], in which seeds were directly placed in the collected samples. A total of 450 Petri dishes (90 mm diameter, transparent lids) were prepared, with 15 dishes per simulation. Five dishes per simulation were assigned to each interval (0–10, 10–20, and 20–30 min). Each dish received 5 mL of leachate, evenly distributed on filter paper (Filtra Tech, Shakopee, MN, USA), before ten lettuce seeds (Lactuca sativa L., VITA, Crancey, France) were placed at equal distances. Lettuce was selected for its sensitivity to phytotoxicity [28,29]. Dishes were incubated in a greenhouse at 25 °C, in darkness for 72 h. After, root and shoot lengths were measured with a digital caliper (iGAGING IP67 COOLANT CAL, Clemente, CA, USA) to assess germination percentage and relative growth parameters (of the root and the shoot, in mm).

2.4. Biochar, Mulch Materials, and Soils

The biochar used in this study, “Ecochar”, is a commercial product from Ibero Massa Florestal. It is derived from acacia residues, an invasive species in Portugal [30]. The pyrolysis occurs at temperatures ranging from 490 to 590 °C, over 12 h and 30 min under low oxygen conditions. The organic mulch used was wheat straw sourced from Agriloja in Évora, Portugal. The vineyard and olive orchard soils fall under the lithosol classification and exhibit a sandy loam texture. The vineyard soil comprises 66% sand, 23% silt, and 11% clay, while the olive orchard soil comprises 69% sand, 18% silt, and 13% clay. Organic matter content was quantified via incineration (550 °C for 3 h), and water holding capacity (WHC) was determined through weight measurements before and after saturation with water. Bulk density was measured using the volumetric ring method. pH and EC assessments were conducted using a potentiometer. PAHs were analyzed through capillary column gas chromatography–mass spectrometry (GC/MS), following the United States Environmental Protection Agency (US EPA) methodology (Table 1).

2.5. Statistical Methods

Analyses were performed using a two-way mixed-effects models on the response hydrological and erosive variables: runoff (mm), runoff start time (min), runoff end time (min), leachate (mm), leachate start time (min), soil water storage (mm), interrill erosion (g m−2), and rainsplash erosion (g m−2). In each model, “treatment” (bare soil, soil mixed with biochar, soil with a biochar layer, soil with a mulch layer, soil with a mulch layer on top of a biochar layer) and “soil” (A or B) were the fixed effects. “Plot” and “RFS repetition” were the random effects. Bulk density and rainfall were tested as covariates, but were not significant. A three-way mixed-effects models was also run on the response phytotoxicity variables: germination percentage (%), root length (mm), shoot length (mm), leachate pH (1–14), and leachate EC (mS cm−1). In each model, “treatment”, “soil”, and “time” (0–10 min, 10–20 min, and 20–30 min) were the fixed effects, and “Rainfall simulation repetition” was the random effect. Rainfall pH and EC were tested as covariates but were not significant. We also ran five individual models on the response variables runoff, leachate, soil water storage, interrill erosion, and root length, using “treatment”, “soil”, “layer” (soil-mixed or surface-layered), “biochar presence” (soil-mixed/with a layer of biochar or soil without biochar), and “mulch presence” (soil with a mulch layer or soil without mulch), respectively, as fixed factors, to determine the F values and p values of these effects on the mentioned variables. Using the individual model with “treatment” as the fixed factor, we also performed a pooled data analyses for soil A and B on the response variables runoff, runoff start time, runoff end time, leachate, leachate start time, soil water storage, interrill erosion, rainsplash erosion, germination percentage, root length, shoot length, leachate pH, and leachate EC.
Model consistency was verified by performing some diagnostics. The normality of residuals was tested using the Shapiro–Wilk test and checking QQ plots. Variance homogeneity was tested using the Bartlett test and evaluating the scale-location plots. To normalize model residuals, square root transformations were applied to runoff, runoff start and end times, interrill erosion, and rainsplash erosion. Interactions among fixed factors were included in the analysis, and multiple pairwise comparisons were performed using the Tukey–Kramer method [31]. Pearson correlation coefficients were calculated to examine linear correlations between hydrological, erosive, and phytotoxicity variables.
All statistical assumptions were evaluated at a significance level of α = 0.05. The statistical analyses were conducted using RStudio 2024.4.2.764.

3. Results

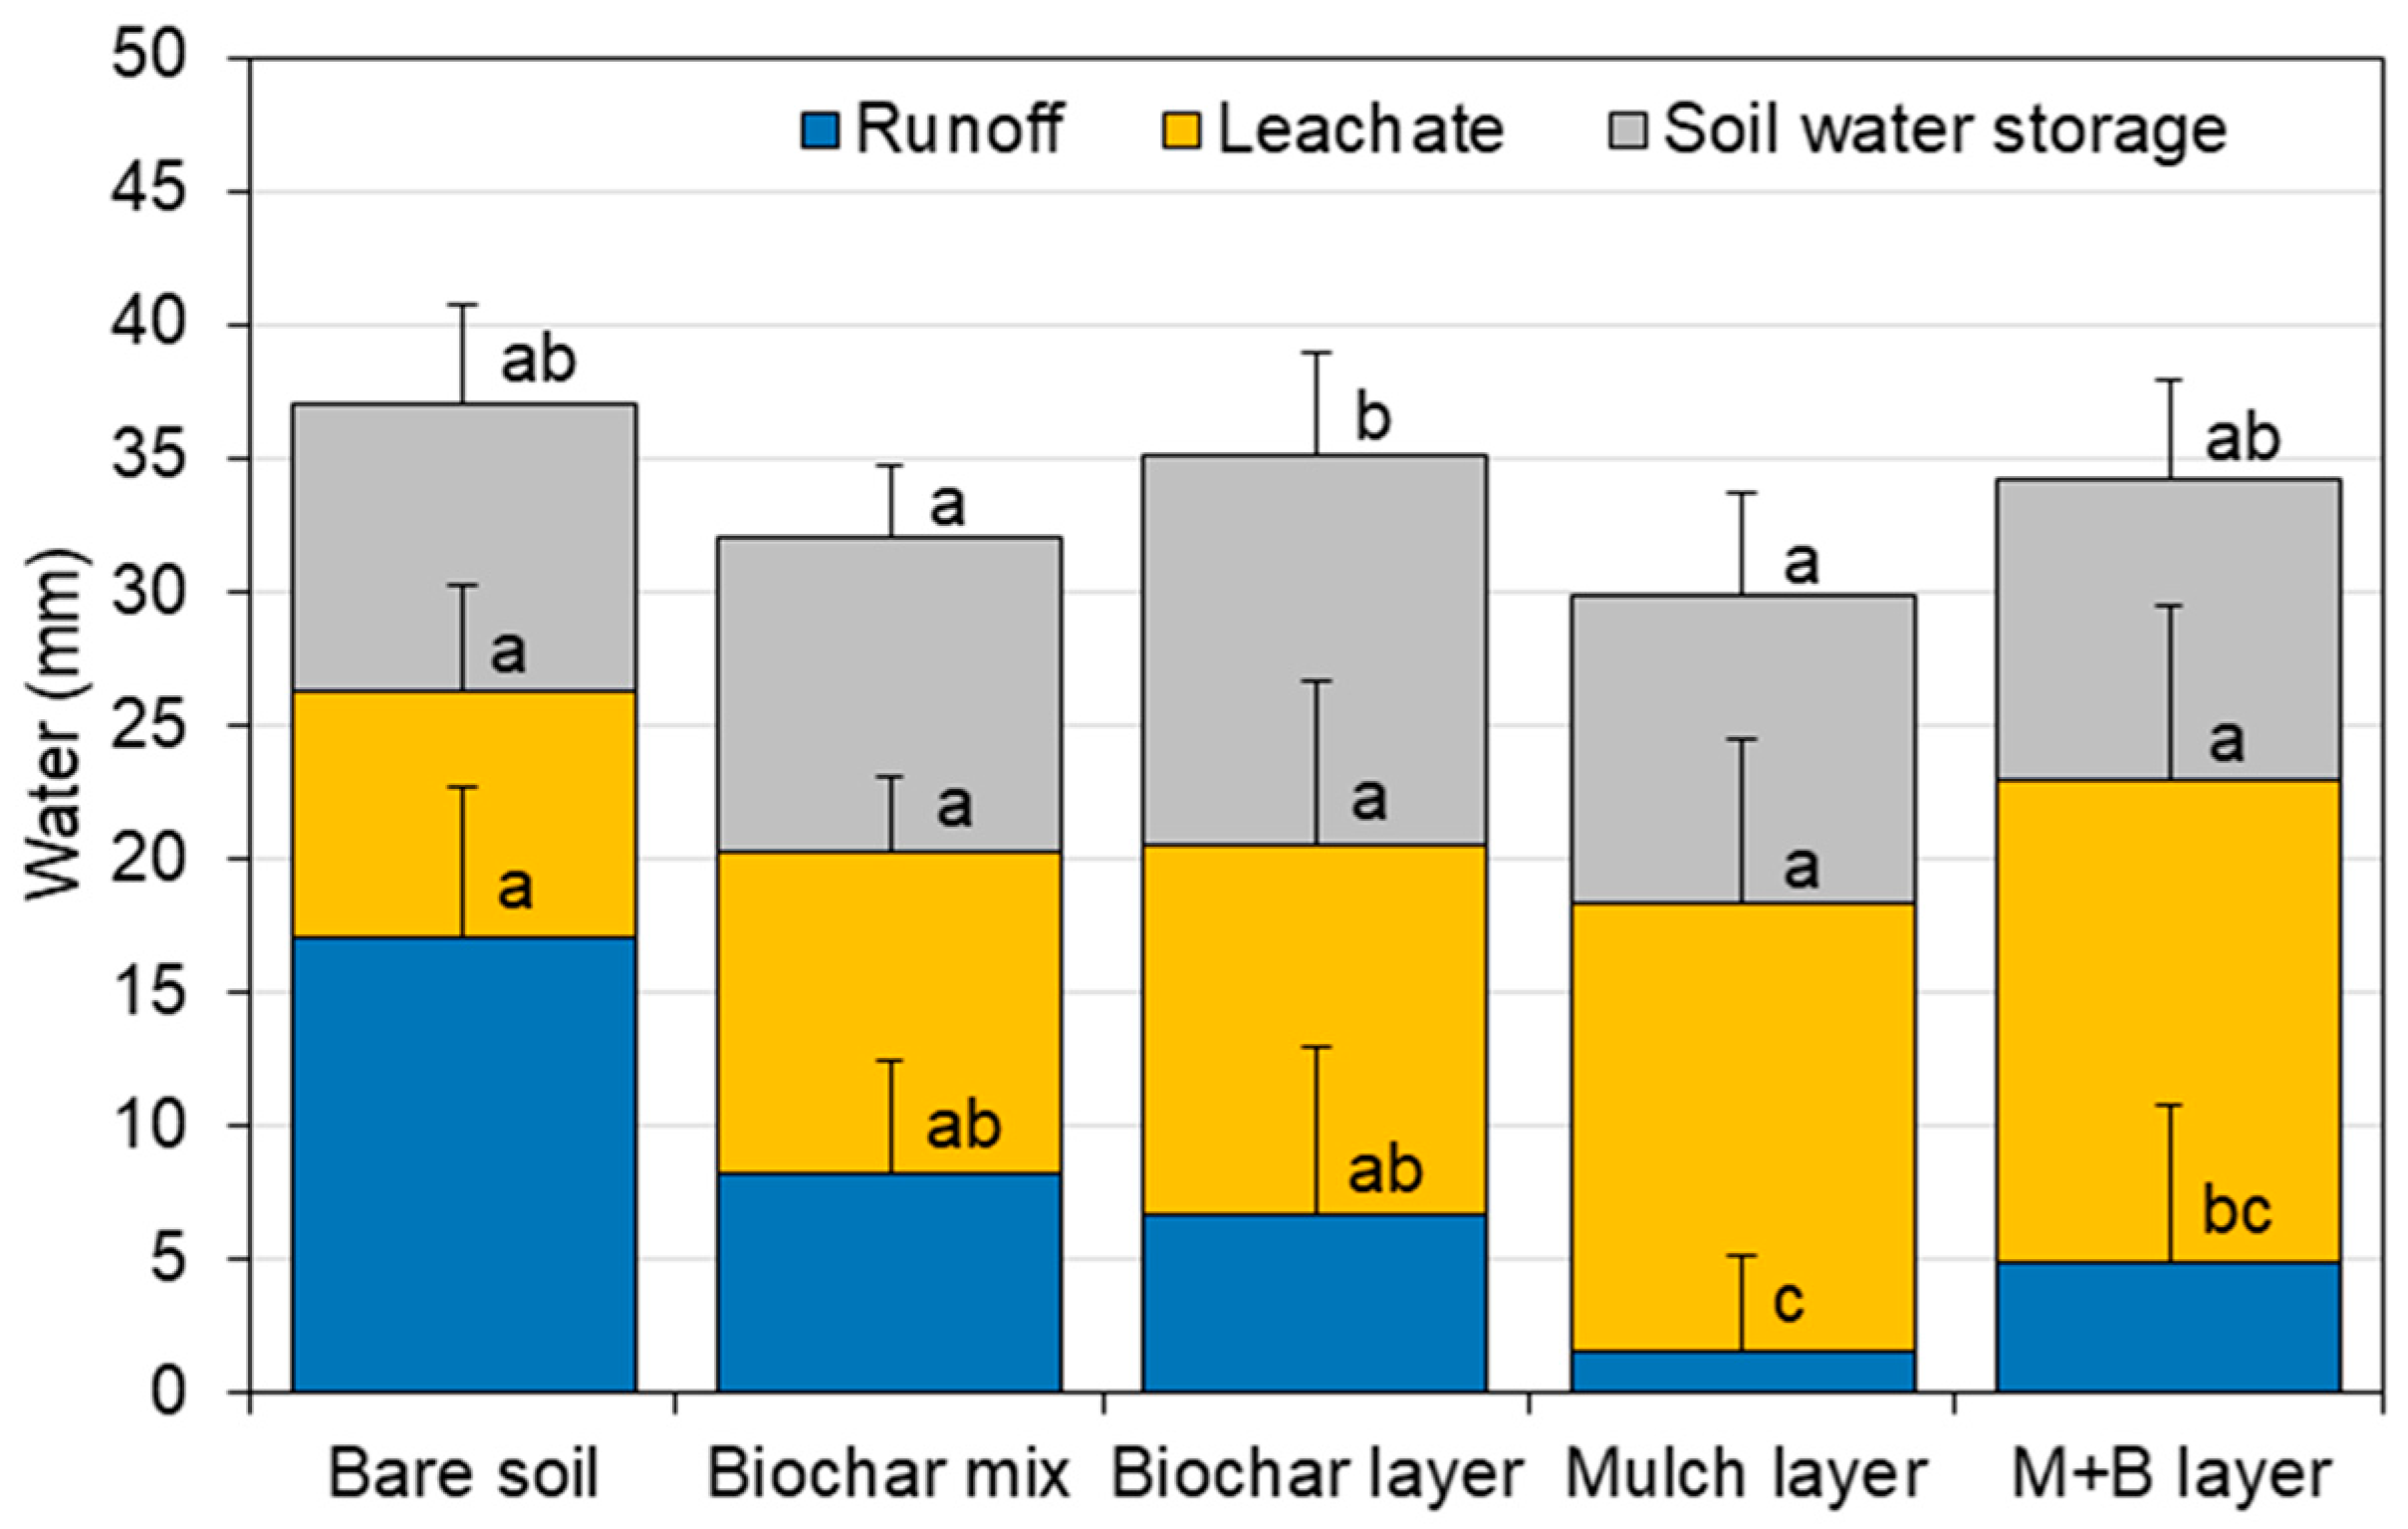
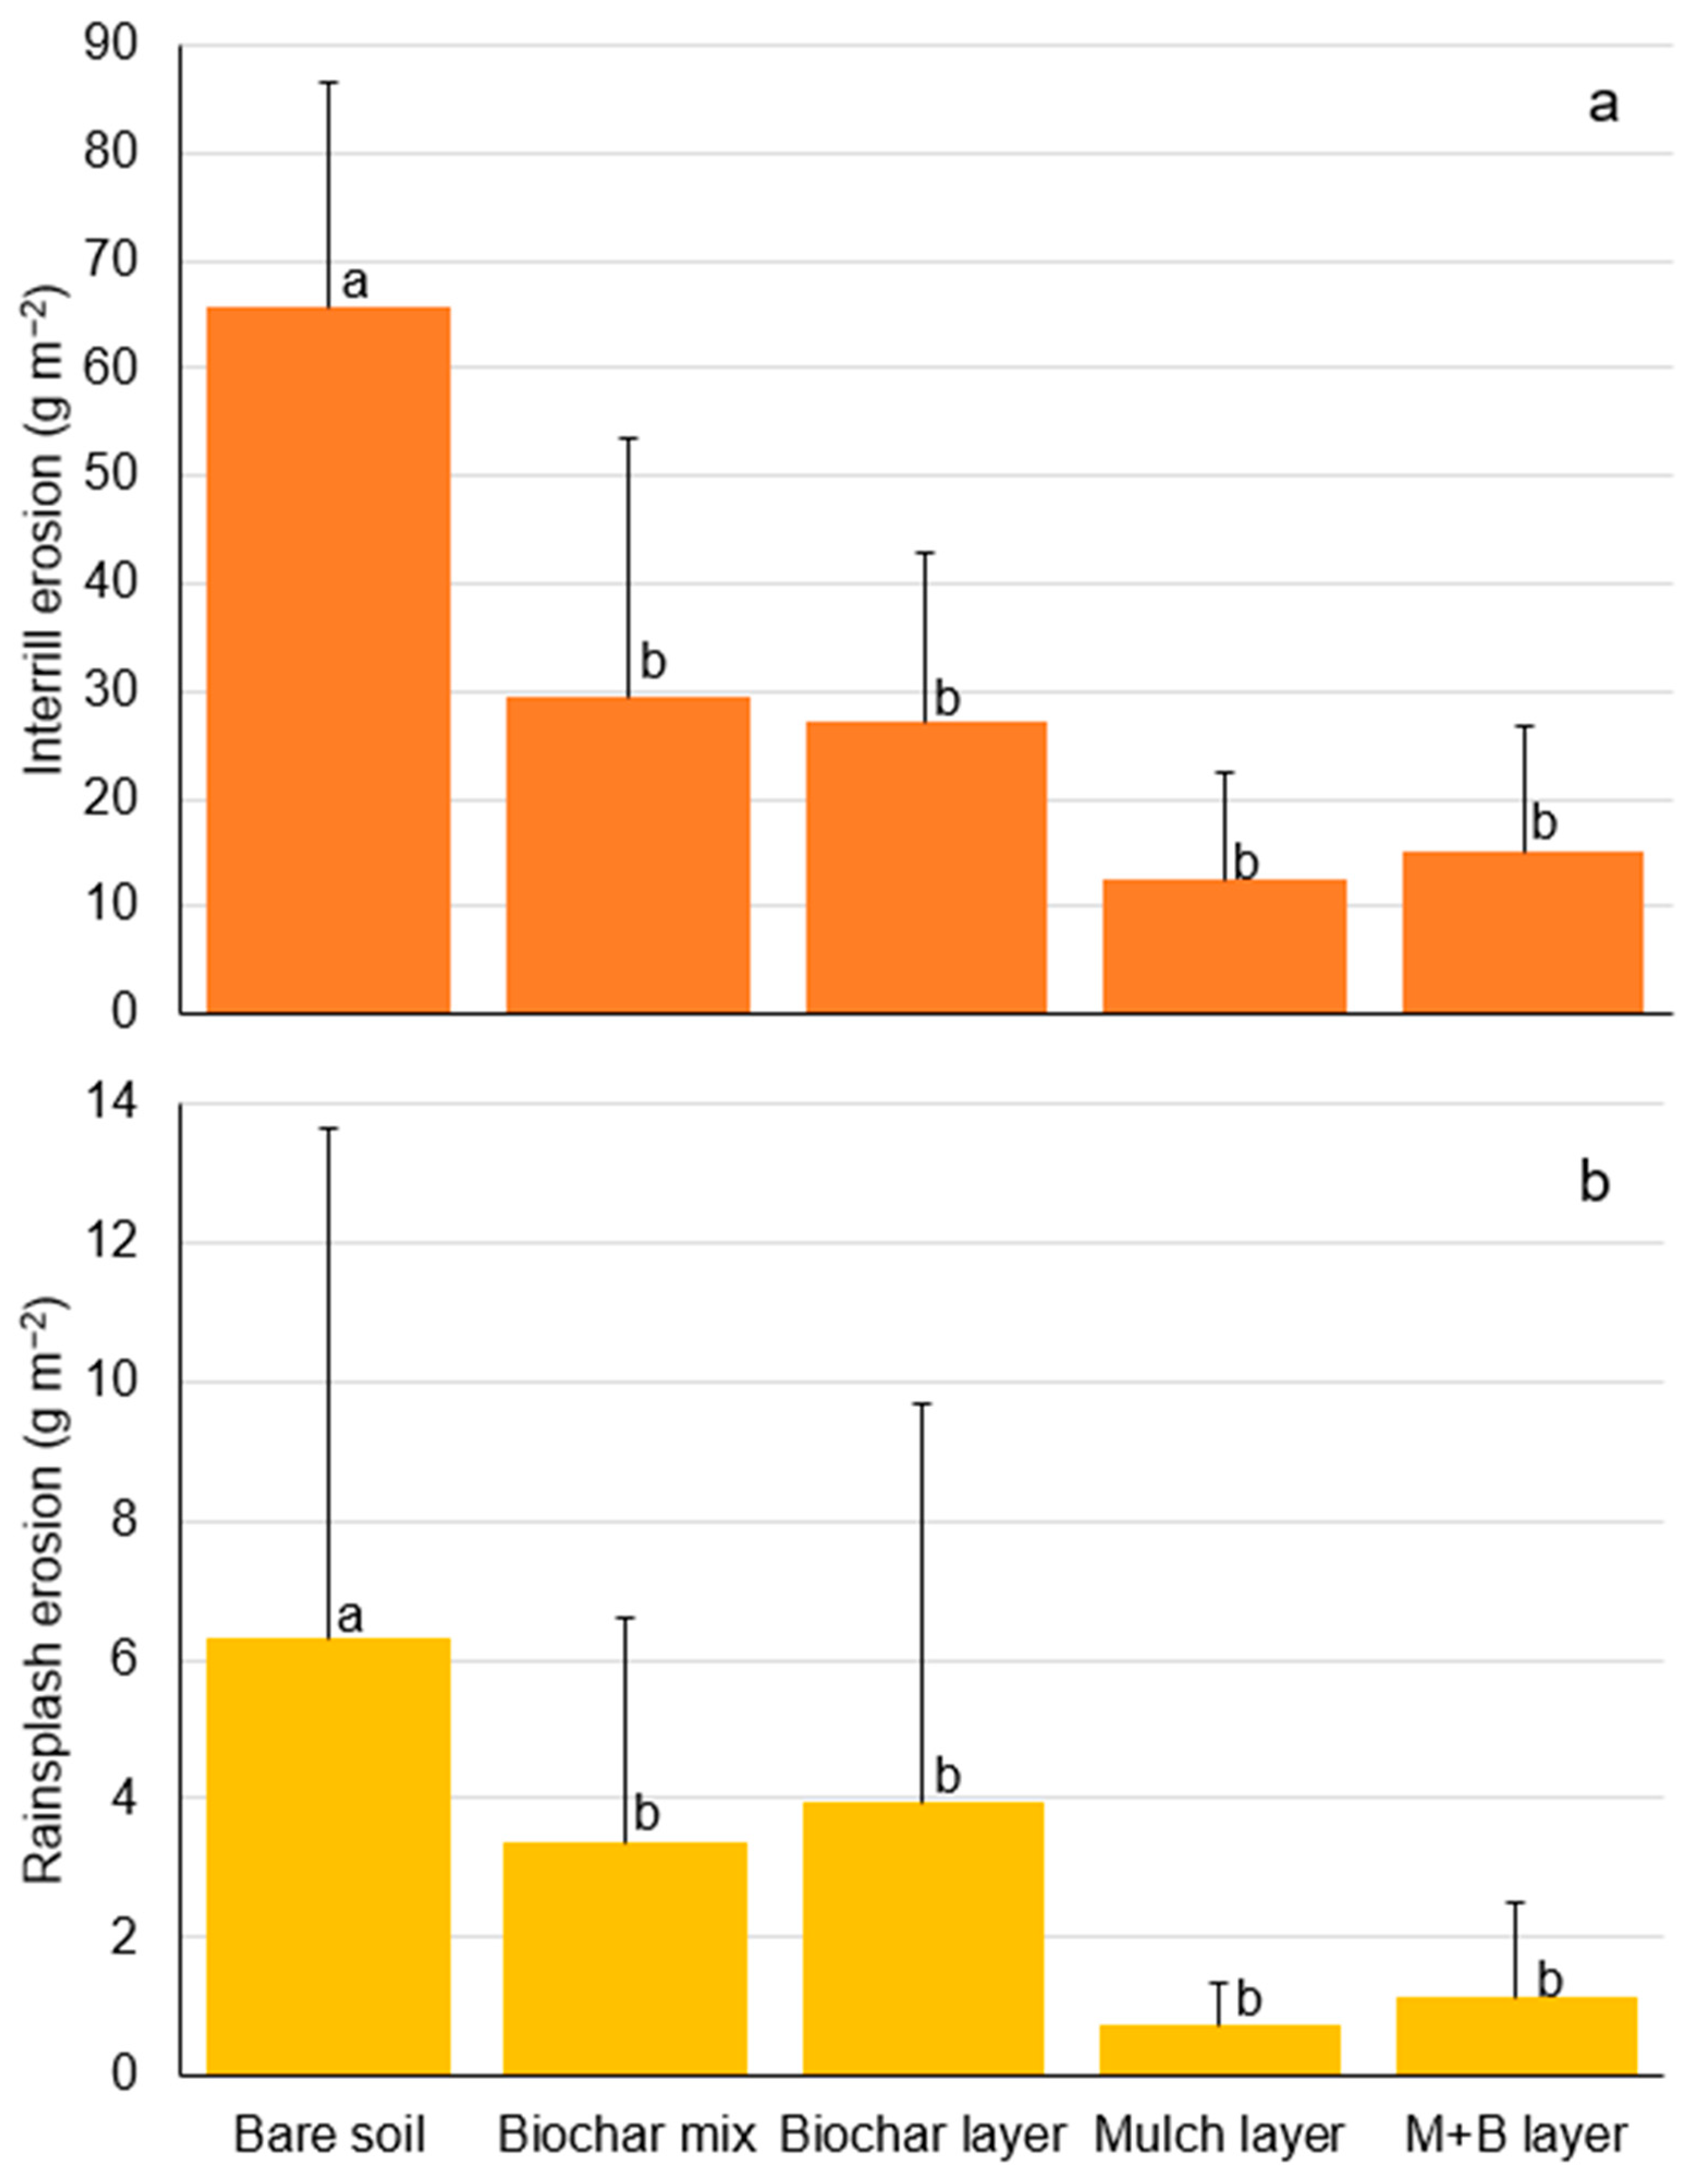
3.1. Overall Hydrological and Erosive Response

Significant differences in runoff and soil water storage were found between some treatments, but leachate was not significantly different between any treatments (Figure 1).
All treatments trended to reduce runoff compared to the control. Still, effects were only significant for the mulch (91 ± 22% reduction) and the mulch + biochar (71 ± 35% reduction) layered treatments, although they were not significantly different. Consistently, runoff coefficients (%) varied in the wake of runoff amount, with a maximum runoff coefficient for the bare soil (40% of the incident rainfall) and lower runoff coefficients of 19%, 17%, 5%, and 12%, respectively, for the biochar mix treatment and for the biochar, mulch, and mulch + biochar layered treatments (Table 2).
Leachate was the lowest in the bare soil and increased by 1.3, 1.6, 1.9, and 2 times for the biochar mix treatment and the biochar, mulch, and mulch + biochar layered treatments. Soil water storage in the bare soil was also the lowest and increased 1.08, 1.34, 1.06, and 1.05 times, respectively, for the biochar mix treatment and for the biochar, mulch and mulch + biochar layered treatments. These corresponded to 18–46% increases compared to the bare soil. No significant differences existed between soil A and B or between soil-mixed and surface-layered treatments in either runoff, leachate, or soil water storage (Table 2). The “presence of mulch” was the factor that most affected runoff and leaching but not soil water storage (SWS), which was more affected by soil properties (Table 3).
All treatments trended to later runoff start times compared to bare soil. However, no significant differences were found in runoff start, end, or leachate start times compared with bare soil. There were also no significant differences between soil A and B or between soil-mixed and surface-layered treatments (Table 2).
Significant differences were observed in both erosion variables for all treatments when compared to bare soil (Figure 2).
Interrill erosion was decreased by 55%, 59%, 81%, and 77%, respectively, for the biochar mix treatment and the biochar, mulch, and mulch + biochar layered treatments, compared to the bare soil. Rainsplash erosion decreased by 46%, 40%, 86%, and 83% in the same treatments compared with the bare soil. There were no significant differences between soil A and B. The soil-mixed treatments had an average interrill erosion of 49 g m−2 and rainsplash erosion of 1.9 g m−2. Both interrill and rainsplash erosion were decreased by 63% in the surface-layered treatments compared with the soil-mixed treatments, with significant differences (Table 2). The factor that affected interrill erosion the most was the “presence of mulch”, followed by the “layer” (Table 3).
Pearson correlation showed some significant correlation between hydrological and erosive variables (Table S1).

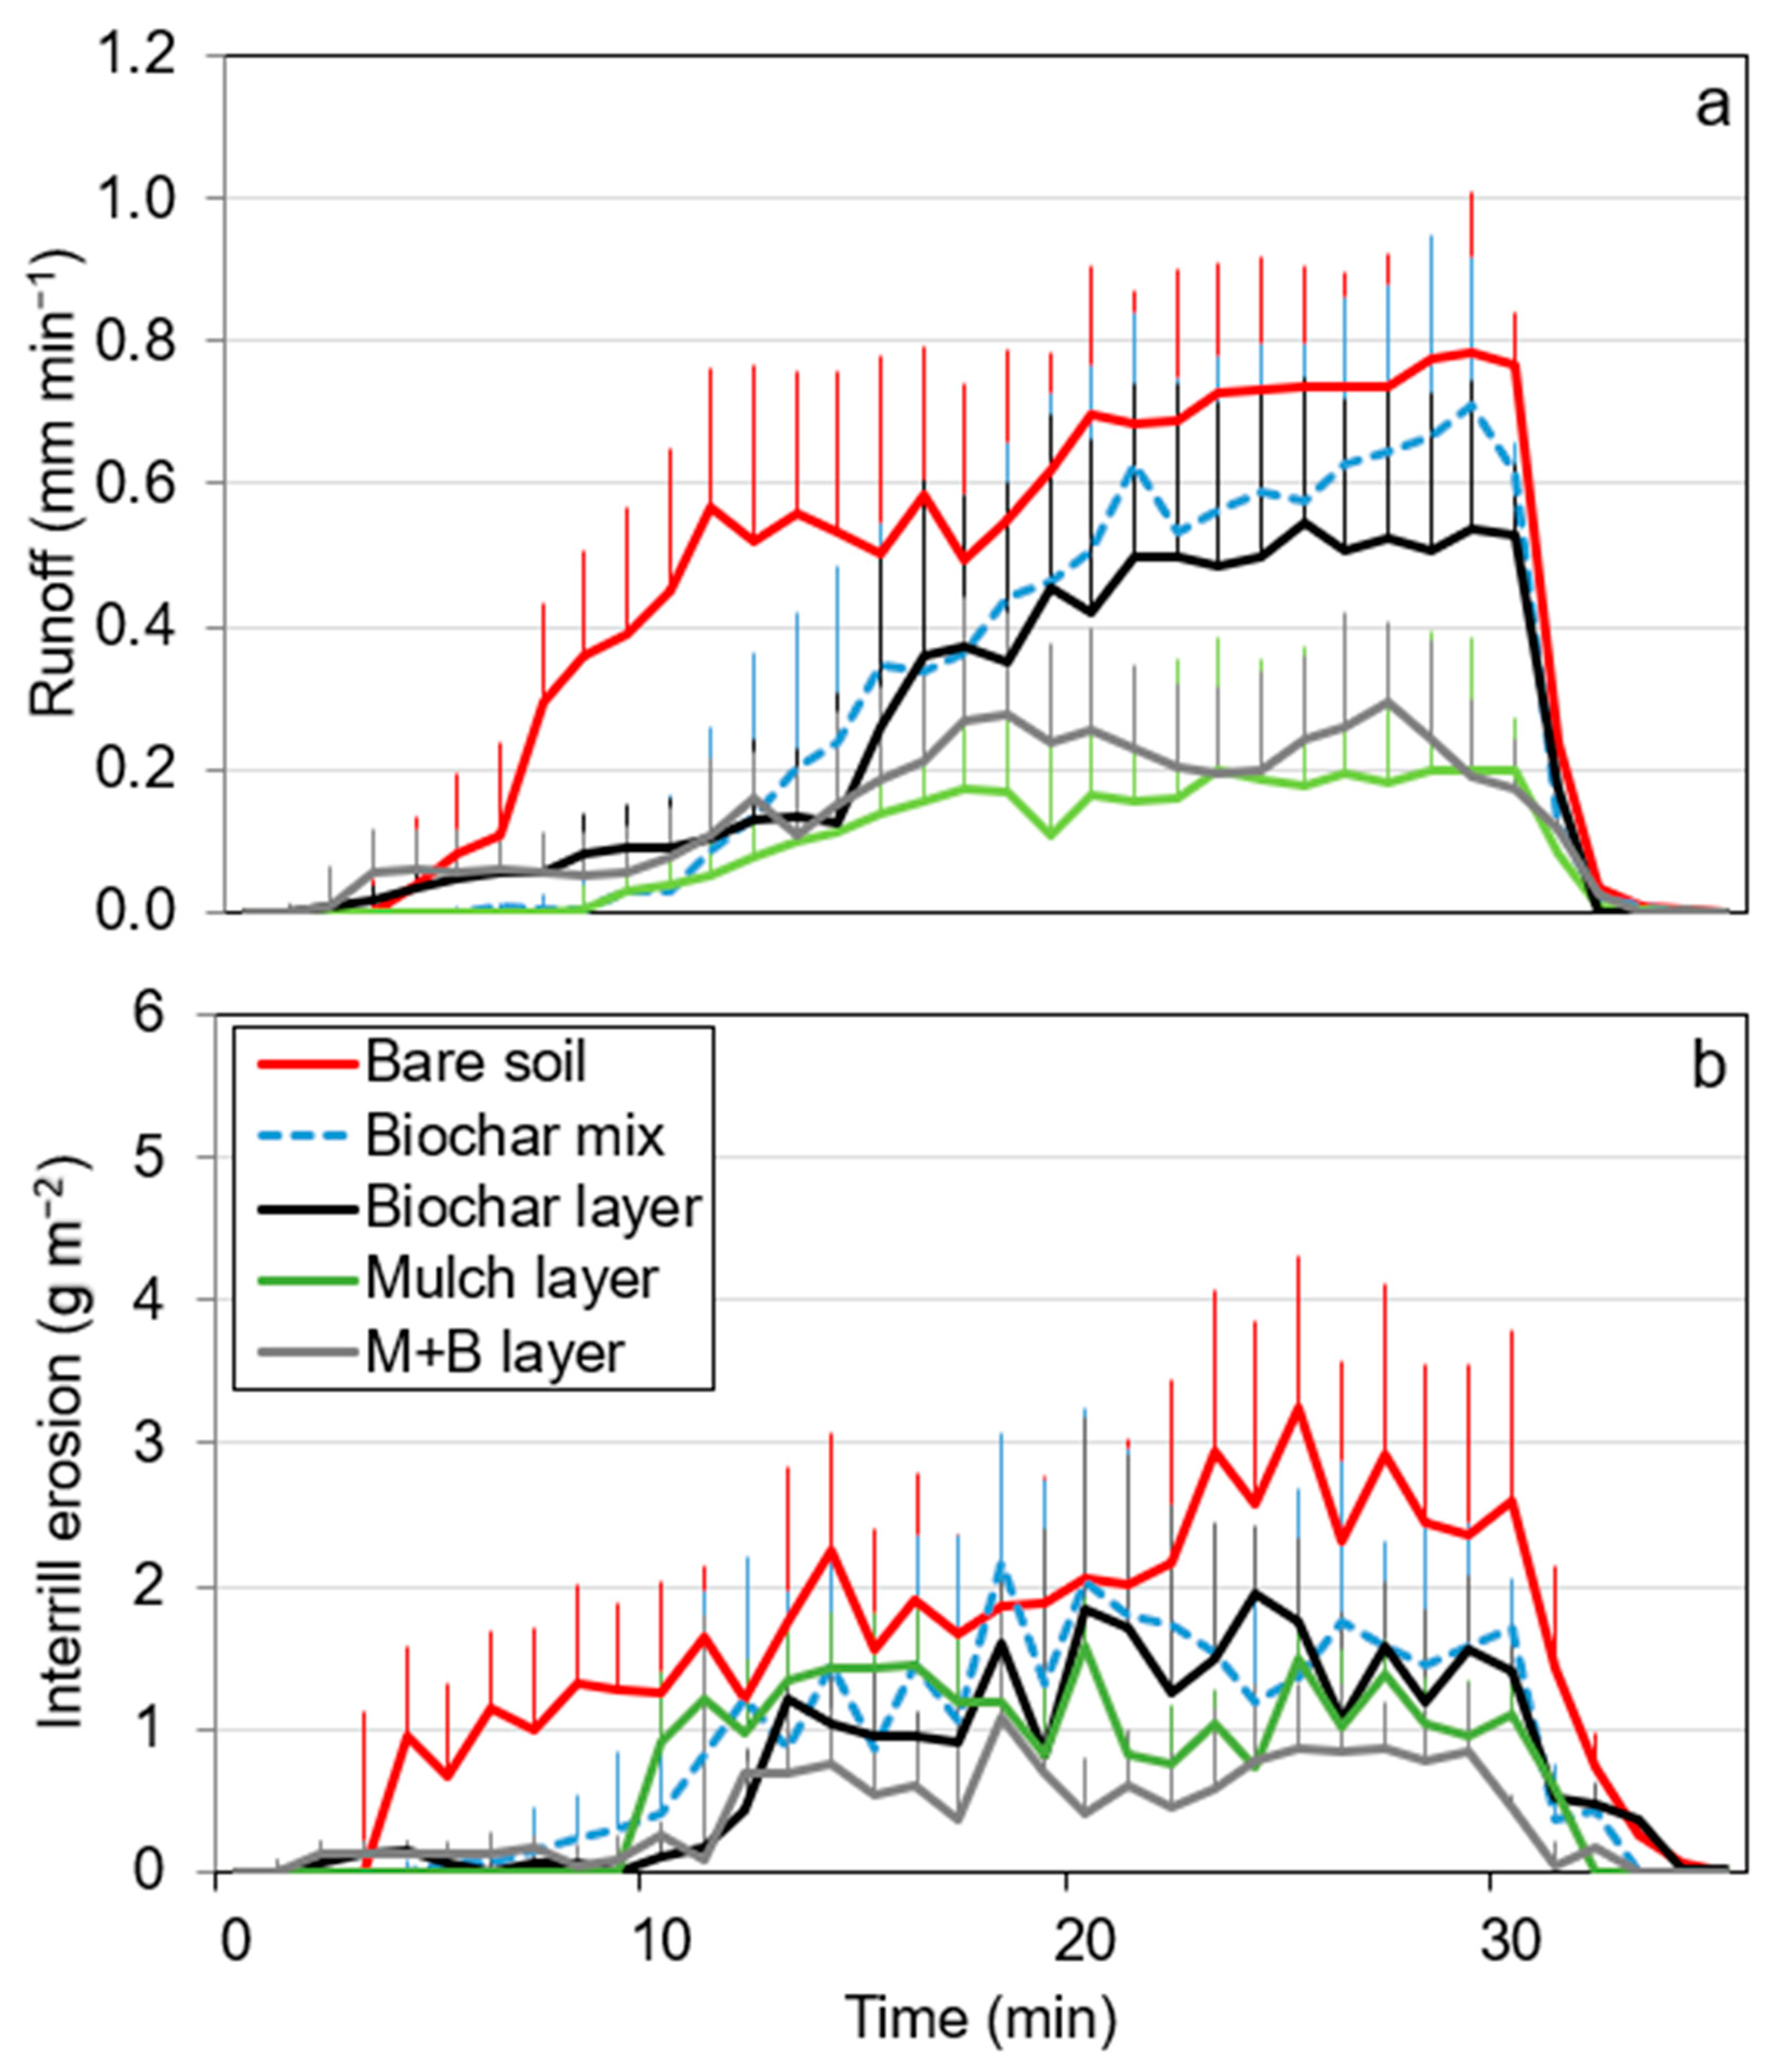
3.2. Hydrological and Erosive Short Response

Runoff rates for the bare soil, biochar mix, and biochar layer treatments increased progressively every minute during the simulation until 20–21 min where they somewhat maintained a stabilized rising until the end of the simulation (30 min). The runoff rates of the mulch and mulch + biochar-layered treatments also increased, but only until 16–17 min, when they stabilized until the end of the simulation (Figure 3a).
Erosion rates for the bare soil increased constantly until 25–26 min. In the biochar mix and layer treatment, erosion rates increased to 18–19 min and stabilized until 25–26. In the mulch and mulch + biochar layered treatments, erosion rates increased only until 12–13 min before stabilizing until 25–26 min. In all treatments, erosion rates start decreasing around 25–26 min until the end of the simulations. Erosion peaks during the simulations were more frequent in the bare soil, biochar mix, and biochar-layered treatments than in the mulch and mulch + biochar-layered treatments (Figure 3b).

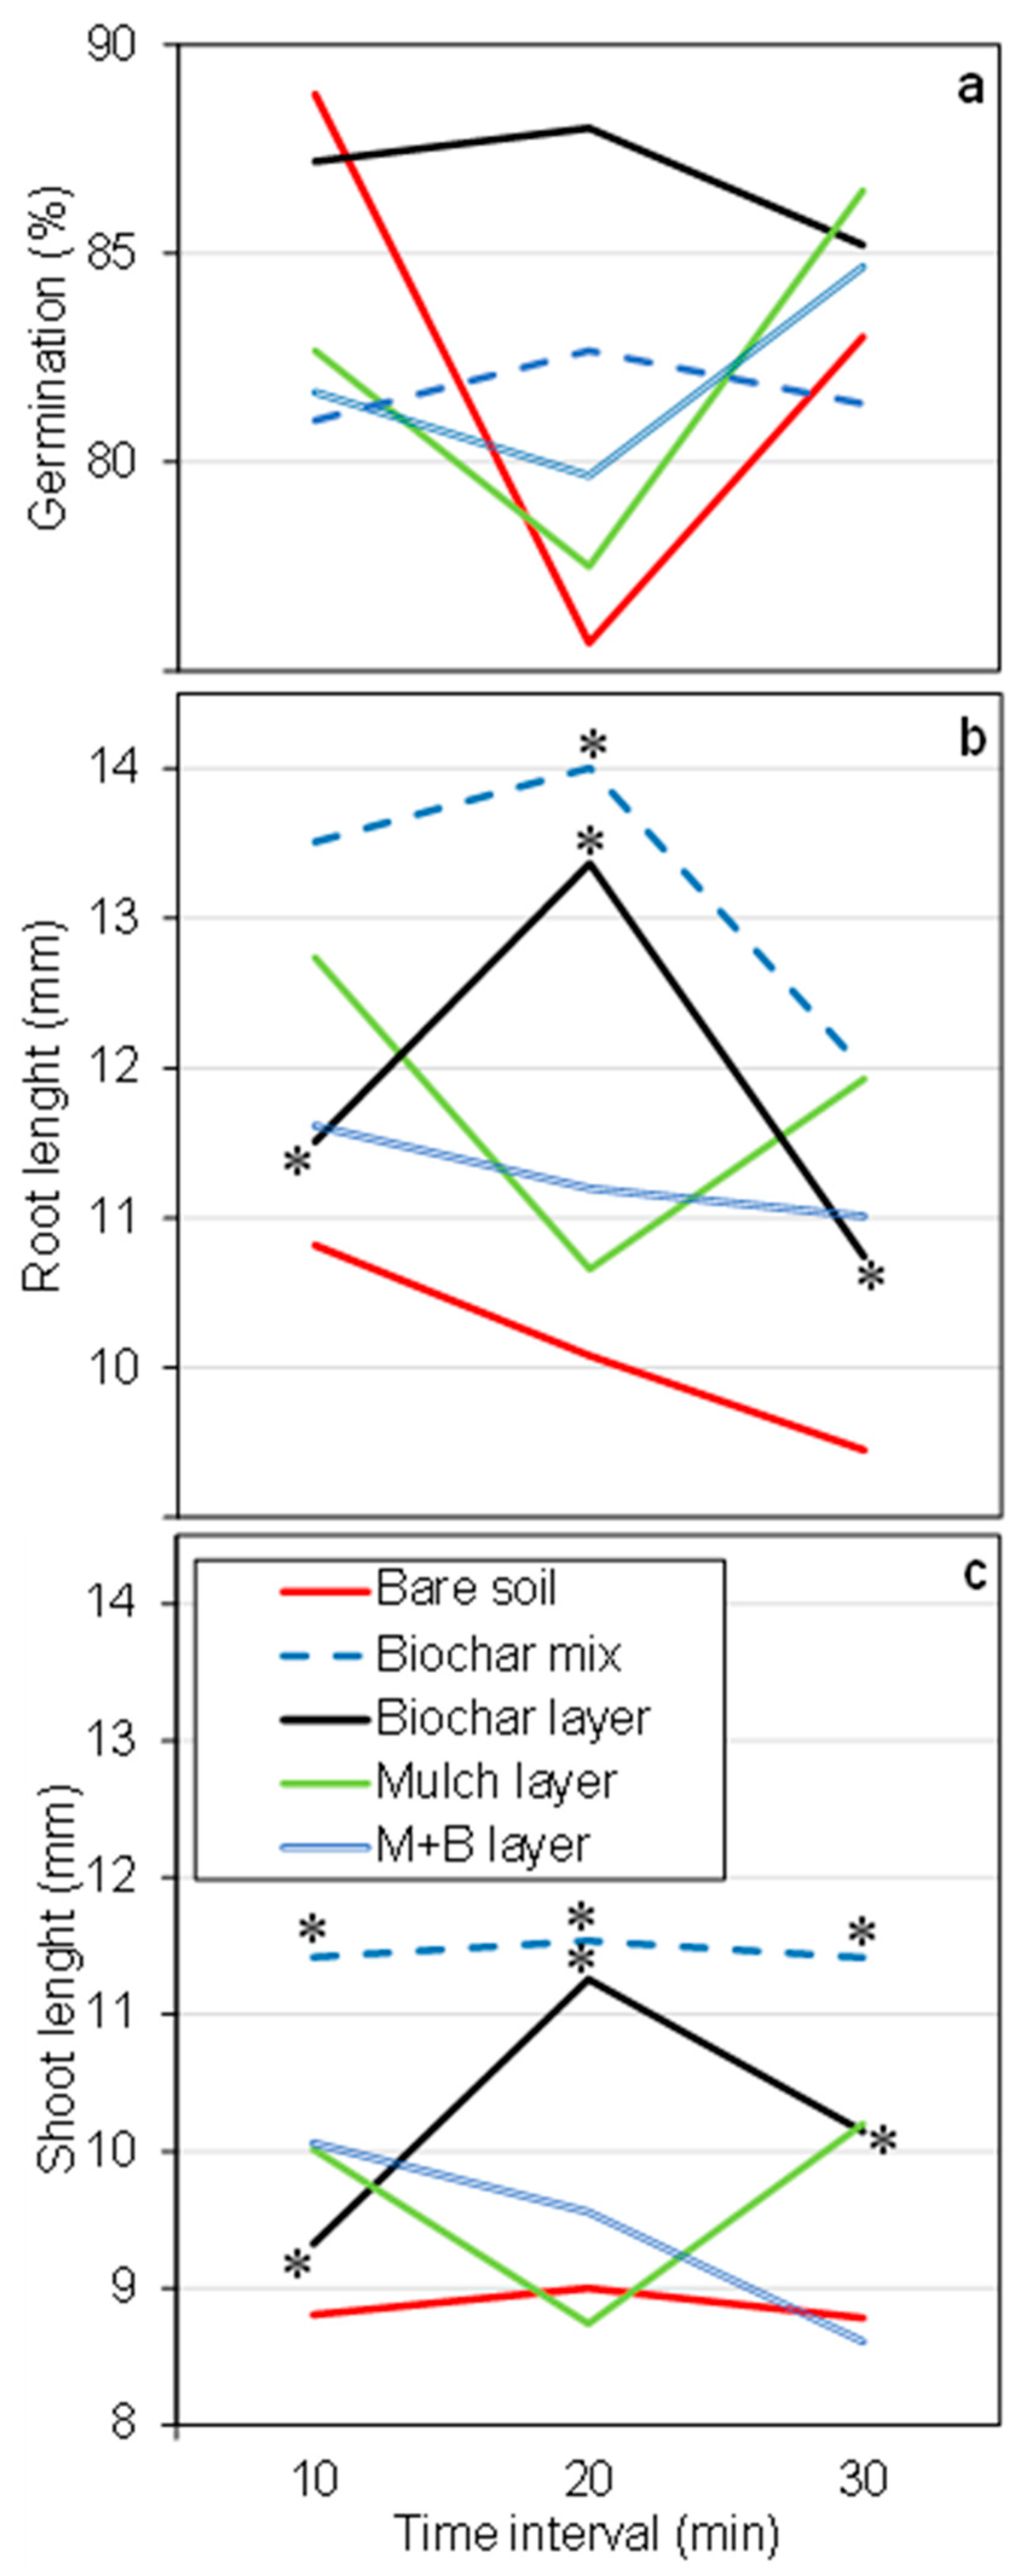
3.3. Leachate Phytotoxicity

All treatments had similar and high germination percentages (ranging from 76% to 88%), and no significant differences were found (Figure 4a).
Compared to bare soil, the treatments increased root length from 12% to 45% and shoot length from 15% to 39%. Between treatments, significant differences were found between the biochar mix, biochar layer, and mulch + biochar layer root and shoot length, as compared to the bare soil. Significant differences were also found between soil A and B in root length average (12.7 and 9.9 mm, respectively) and between soil-mixed and surface-layered treatments, also in root length average (11.6 and 11.1 mm, respectively) (Table 4).
Some differences were found in the variables root and shoot length between time intervals (Figure 4b,c). The “soil” factor had a higher impact on root length, followed by the “presence of biochar” (Table 3).
The bare soil treatment had an average pH of 7.4, the same as the biochar mix treatment. The biochar layer treatment increased pH by 1.4% and the mulch and mulch + biochar layered treatments decreased pH values by 14%, and 8.1%, respectively. On the other side, EC in the bare soil was the lowest, with only 0.8 mS cm−1, and it was increased by 36% in the biochar mix, biochar layer, and mulch layer and by 23% in the mulch + biochar layer treatment. Significant differences were found in pH and EC between treatments. In pH, differences were found between all treatments in comparison with bare soil and EC between the biochar mix, biochar layer, and mulch + biochar layer and the bare soil. Significant differences were also found in pH between soil A and B (7.4 and 7.3, respectively) and soil-mixed and surface-layered (7.4 and 7.3, respectively). In EC, differences were only found between soil A and B (1 and 1.2, respectively) (Table 4). pH decreased and EC increased constantly with time intervals, with some significant differences (Figure 5a,b).
Pearson correlation showed some significant correlation between phytotoxicity variables (Table S2).

4. Discussion

4.1. Mulch and Biochar Effects on Soil Hydrology

This study found that both mixed and layered treatments were more effective in reducing runoff in soil than in other studies [12,14,16,32]. The higher reductions for mulched treatments may have been due to dry initial soil conditions, which delayed runoff production. Other studies have found runoff reductions near −100% for dry soils (Figure 6), which can be explained by the lowering of runoff velocities and the increase in soil water retention [3,11,33,34,35].
The water repellency of both soils and the amendments (Table 1) was extremely low (biochar and straw) or absent (soil A and B), which also contributed to the observed delay to runoff. A few biochar studies even found increased runoff by up to 25%, as compared to the untreated control plots (Figure 6), which can be explained by the water repellency status of the used biochar [36,37].
The application of mulch plays a critical role in reducing runoff, as seen in the significant decrease in runoff amounts in the mulch-layered treatments when compared to other treatments (Figure 1). By increasing the soil’s surface roughness of the soil, mulch reduces the velocity of surface flow [38,39]. Straw mulch, in particular, offers greater runoff reductions than biochar surface applications due to the latter’s higher susceptibility to erosion [32]. Additionally, mulch traps water [11,33,34,35,40], especially at the start of a rainfall event when it is dry and its water retention capacity is maximized [3].
Infiltration (including leachate and soil water storage) was greater in the layered treatments compared to the mixed treatments, with the highest values observed in the mulch + biochar treatment (Figure 1). The delay in runoff, due to the physical barrier created by the layers, facilitated increased contact time between water and surface soil. This allowed for deeper water movement [16,26], promoting infiltration. Although the biochar mix treatment also increased infiltration [15] due to the reduction in density (Table 1), and consequent increase in porosity, the surface application of the product demonstrated an optimized effect. The combination of mulch and biochar layers had a more pronounced effect due to the larger quantity of material on the soil surface acting as a barrier to water flow, along with the synergistic sponge-like effect of the mulch–biochar combination [3]. Additionally, as a no-tillage management practice, it contributes to biodiversity conservation, as one of the main threats to biodiversity in agricultural landscapes is associated with mechanical disturbances [41]. The lack of differences between treatments in some variables, such as leaching, were likely a consequence of having a pool data including two different soils (Figure 1). An analysis splitting these two soils showed different hydrological responses of soil A and B (Table 2), soil A being hydrologically more conductive than soil B. These differences may increase the coefficient of variation and result in a lack of main differences (Table S3). Other research has found lack of differences in the variables overall, but partial differences with each soil in their research [37].
Studies in Mediterranean agricultural systems with soils of similar textures as ours have found similar results in terms of mulch and biochar effects on soil hydrological response [14,15,42]. Also, studies comparing cultivated and abandoned vineyards and olive orchards have found that the abandoned ones exhibited less runoff due to the vegetation that started growing in the lines and the absence of soil overexploitation. The increased vegetation cover in abandoned orchards enhances soil structure and permeability, which contributes to better water infiltration and reduced surface runoff [43]. This aligns with our findings where surface treatments that promote soil cover and structure mitigate runoff and increased infiltration.

4.2. Mulch and Biochar Effects on Soil Erosion

This study revealed that the mulch and mulch + biochar-layered treatments resulted in the greatest reductions in soil interrill and rainsplash erosion compared to the untreated plots (Figure 2), aligning with the majority of studies that have investigated the effects of mulch layers [12,42,44,45,46] (Figure 6). Mulch provides a protective cover for the soil surface, shielding it from the direct impact of raindrops, which reduces rainsplash erosion, soil detachment, and the availability of detached soil particles that could be transported by runoff [10]. Straw mulch in particular has also demonstrated high efficiency in mitigating erosion in other studies conducted in Mediterranean agricultural orchards [47].
Biochar layers demonstrated partial effectiveness in mitigating erosion [16,48,49,50] (Figure 6). According to [16], biochar was effective in reducing soil erosion during the initial rainfall phases when runoff is minimal and insufficient to wash away the char particles. However, biochar’s effectiveness diminishes after these early stages unless it is covered by a layer of straw mulch [32]. The biochar mix treatments were the least effective at reducing soil erosion, as they lacked sufficient surface protection. This result is consistent with findings from other studies [51,52,53,54,55,56,57,58,59,60,61,62,63,64]. The proportion of ground cover is a very important factor, with 70% to 100% coverage capable of reducing soil loss by up to 95% [42,46]. Soil erosion in biochar-amended soils showed a wide range of outcomes, with reductions reaching up to −100% (no erosion compared to untreated plots) and increases as high as 177%, resulting in an average decrease of −6%, which highlights the wide variability among studies.
In studies conducted under field conditions, erosion rates exhibit significant seasonal variability, primarily due to the influence of changing soil conditions such as moisture levels, water repellency, and other related factors. Seasonal fluctuations can greatly impact the soil’s susceptibility to erosion, with wetter or more water-repellent soils responding differently to rainfall events [1,11]. Additionally, although we aimed to simulate field conditions in our laboratory study, the rainfall simulation research always pose some limitations, such as rainfall conditions (lower drop height, smaller droplet diameter, and reduced rainfall velocity), soil preparation, and lack of spatio-temporal patterns, which simplifies the assumptions, and may led to differences in the magnitude (both underestimation and overestimation) of the hydrologic and erosion variables [12,16,54,58,59,60,62]. However, rainfall simulations present many advantages, and the reproducibility of the trends were recognized by the scientific community and justify the use of this methodology [12,16,54,58,59,60,62]. The application of mulch and mulch/biochar combinations has consistently demonstrated high efficiency in reducing runoff and erosion across various field conditions [11,32], as well as laboratory rainfall simulation studies with erosion reductions being similar in both studies.

4.3. Mulch and Biochar Effects on Soil Phytotoxicity

The germination percentages in the leachate were high (76–88%), showing no significant differences between treatments (Figure 4a; Table 4), which can be attributed to low PAHs and EC values (Table 1; Table 4), which did not affect seeds germination rates. The PAHs consistently remained in the lower concentration range found in untreated agricultural soils globally, from close to 0 to approximately 2 mg kg1, minimizing the toxicity that these pollutants have on germination and plant development [65,66,67,68]. The EC values, which ranged from 0.7 to 1.3 mS cm−1 in all treatments, are far from values exceeding 3 mS cm1, which are generally considered elevated and can negatively impact lettuce development [69], especially affecting germination rates [70].
Both root and shoot lengths significantly increased in all biochar treatments, but no such effect was observed in the only mulch treatment (Table 4). The greater increases were found in soil B, which can be explained by the lower pH of soil B (Table 1), as most plant species tend to thrive in soils with pH values between 6.2 and 7.3, where the availability of essential nutrients is optimized [71]. In the case of lettuce, pH values below 6 increase toxicity, negatively affecting early growth [72]. In soil B, biochar (mix and layered) and mulch + biochar (layered) enhanced both root and shoot length by raising pH, while mulch alone reduced pH (Figure 5), due to biochar’s alkalinity and straw’s acidity [73,74] (Table 1). Additionally, the presence of phytotoxic phenolic compounds, which are common in olive orchard soils, may have been adsorbed by biochar, thereby reducing their bioavailability to plants [75]. In soil A, biochar’s effect was not so marked, because pH was already in the value range that enhances nutrient availability. However, biochar application in this soil also improved plant length. Biochar’s high cation exchange capacity, enhancing nutrient retention, can increase plant growth at low concentrations [74]. Studies assessing biochar impacts on plant growth found that concentration in the soil between 1% and 3% significantly improved plant length, compared with the control—soil without biochar [66,76]. The increase in EC observed across all treatments with biochar compared to bare soil, from 0.8 mS cm−1 to values between 1 and 1.2 mS cm1 (pooled data average for soil A and B, in all time intervals), may have also influenced plant growth (Table 4; Figure 5). This aligns with findings from studies on hydroponically grown lettuce. The authors of [67] reported that lettuce growth rates improved within an EC range of 1–2 mS cm1. Similarly, [77] found that moderate EC levels (0.8–1.2 mS cm1), indicative of lower salt concentrations, promoted lettuce growth by minimizing osmotic stress, while levels below 0.8 mS cm1 were associated with inadequate nutrient availability, leading to reduced biomass.
The use of a mulch and biochar seems to have advantages in recovering especially the more degraded soils, as stated previously by [2]. However, the economic feasibility and farmers’ acceptability of these practices depend on many factors, the initial investment on biochar acquisition being a strong barrier. Mulch and biochar could offer valuable long-term returns, but the exact dose–response details and economic quantification of the measures make its implementation on broader spatial and temporal scales difficult.

5. Conclusions

The principal conclusions of this study into the effect of biochar and straw mulch applications on the hydrology, erosion, and phytotoxicity of agricultural soils were as follows:
Regarding the first specific objective, we conclude that all treatments positively affected the soil water balance, leading to lower runoff and higher infiltration rates, with the most significant improvements observed in the surface-layered treatments.
Regarding the second specific objective, we conclude that both interrill and rainsplash erosion significantly decreased for all treatments, but with larger effects for the mulched ones.
Regarding the third specific objective, we conclude that the presence of biochar at 2.8% (soil-mixed) or 10 Mg ha−1 (soil surface-layered) was a factor that significantly increased plant root and shoot length in the leachate, especially in the soil-mixed application strategy.
Overall, the mulch + biochar-layered treatment showed the best results in simultaneously improving soil hydrology, erosion control, and habitat for plant growth, by combining the advantages of both products. Additionally, as a no-tillage management practice, it minimizes ecosystem disturbance.
Future research should focus on investigating the long-term effects of biochar and mulch on soil health, with an emphasis on their correlation with crop productivity and phytotoxin inhibition. Additionally, the specific mechanisms by which mixed treatments impact soil aggregation and biochar and mulch properties interact warrant further investigation.

Supplementary Materials

The following supporting information can be downloaded at: https://www.mdpi.com/article/10.3390/agronomy15040926/s1, Table S1: Correlation matrix of Pearson correlation coefficients between hydrological (runoff amount, runoff coefficient, soil water storage, leachate amount, runoff start time, runoff end time, leachate start time) and erosion (rainsplash erosion, interrill erosion) variables. Values followed by one or two asterisks indicate significant correlations between the variables at p < 0.05 and p < 0.001, respectively; Table S2: Correlation matrix of Pearson correlation coefficients between phytotoxicity variables (germination percentage, root length, shoot length, leachate pH, and leachate EC). Values followed by one or two asterisks indicate significant correlations between the variables at, respectively, p < 0.05 and p < 0.001. Table S3: Coefficient of variation for each soil (A, B) and for the pooled data (A+B) in each treatment, for the hydrologic (runoff, soil water storage and leachate). erosion (interrill erosion and rainsplash erosion) and phytotoxic (germination percentage, root length, root length, leachate pH and leachate EC) variables.

Author Contributions

Conceptualization, S.P.; methodology, S.P.; software, J.N.G.V.C.; validation, S.P. and F.G.A.V.; formal analysis, J.N.G.V.C.; investigation, S.P., J.N.G.V.C. and L.C. (Luísa Coelho); L.C. (Livian Castro); resources, S.P., J.N.G.V.C., L.C. (Luísa Coelho) and L.C. (Livian Castro); data curation, J.N.G.V.C.; writing—original draft preparation, J.N.G.V.C.; writing—review and editing, S.P. and F.G.A.V.; visualization, S.P. and F.G.A.V.; supervision, S.P.; project administration, S.P.; funding acquisition, S.P. All authors have read and agreed to the published version of the manuscript.

Funding

This research was funded by FCT (Fundação para a Ciência e Tecnologia), under the Project SOLVO (2022.06004.PTDC)—Solutions to restore degraded Soils in mediterranean OLive orchards Via Organic mulch and biochar from olive industry waste (https://doi.org/10.54499/2022.06004.PTDC) and PRR (Plano de Recuperação e Resiliência), under the project SOLVIT (Vine &Wine Portugal C644866286-00000011).

Data Availability Statement

The datasets used or analyzed during the current study are available from the corresponding author upon reasonable request.

Acknowledgments

The authors also thank the MED—Mediterranean Institute for Agriculture, Environment and Development (https://doi.org/10.54499/UIDP/05183/2020) and CHANGE—Global Change and Sustainability Institute (https://doi.org/10.54499/LA/P/0121/2020). We acknowledge the Centro de Estudos do Ambiente e Mar (CESAM) + LA/P/0094/2020. We also acknowledge the research contracts of Sergio Prats of the FCT-CEEC program (CEECIND/01473/2020) and of the Spanish Ministry of Science, Innovation and Universities (RYC2022-035489-I) and Frank Verheijen (https://doi.org/10.54499/2023.06689.CEECIND/CP2840/CT0011).

Conflicts of Interest

The authors declare no conflicts of interest. The funders had no role in the design of the study; in the collection, analyses, or interpretation of data; in the writing of the manuscript; or in the decision to publish the results.

Abbreviations

The following abbreviations are used in this manuscript:
ECElectrical conductivity
PAHsPolycyclic aromatic hydrocarbons
WHCWater-holding capacity
GC/MSGas chromatography-mass spectrometry
US EPAUnited States Environmental Protection Agency

References

  1. Gomez, J.A.; Llewellyn, C.; Basch, G.; Sutton, P.B.; Dyson, J.S.; Jones, C.A. The effects of cover crops and conventional tillage on soil and runoff loss in vineyards and olive groves in several Mediterranean countries. Soil Use Manag. 2011, 27, 502–514. [Google Scholar] [CrossRef]
  2. Blanco-Canqui, H.; Lal, R. Crop residue removal impacts on soil productivity and environmental quality. Crit. Rev. Plant Sci. 2009, 28, 139–163. [Google Scholar] [CrossRef]
  3. Ferreira, C.S.; Seifollahi-Aghmiuni, S.; Destouni, G.; Ghajarnia, N.; Kalantari, Z. Soil degradation in the European Mediterranean region: Processes, status and consequences. Sci. Total Environ. 2022, 805, 150106. [Google Scholar] [CrossRef] [PubMed]
  4. García-Ruiz, J.M. The effects of land uses on soil erosion in Spain: A review. Catena 2010, 81, 1–11. [Google Scholar] [CrossRef]
  5. Soane, B.D.; Ball, B.C.; Arvidsson, J.; Basch, G.; Moreno, F.; Roger-Estrade, J. No-till in northern, western and south-western Europe: A review of problems and opportunities for crop production and the environment. Soil Tillage Res. 2012, 118, 66–87. [Google Scholar] [CrossRef]
  6. Silveira, A.; Muñoz-Rojas, J.; Pinto-Correia, T.; Guimarães, M.H.; Ferrão, J.; Schmidt, L. The sustainability of agricultural intensification in the early 21st century: Insights from the olive oil production in Alentejo (Southern Portugal). In Changing Societies: Legacies and Challenges; Delicado, A., Domingos, N., Sousa, L., Eds.; Science Press Social: Lisbon, Portugal, 2018; Volume 3, pp. 247–275. [Google Scholar] [CrossRef]
  7. Guerrero-Casado, J.; Carpio, A.J.; Tortosa, F.S.; Villanueva, A.J. Environmental challenges of intensive woody crops: The case of super high-density olive groves. Sci. Total Environ. 2021, 798, 149212. [Google Scholar] [CrossRef] [PubMed]
  8. Rodríguez Sousa, A.A.; Muñoz Rojas, J.; Brígido, C.; Prats, S.A. Impacts of agricultural intensifcation on soil erosion and sustainability of olive groves in Alentejo (Portugal). Landsc. Ecol. 2023, 38, 3479–3498. [Google Scholar] [CrossRef]
  9. Abrantes, J.R.; Prats, S.A.; Keizer, J.J.; Lima, J.L. Effectiveness of the application of rice straw mulching strips in reducing runoff and soil loss: Laboratory soil flume experiments under simulated rainfall. Soil Tillage Res. 2018, 180, 238–249. [Google Scholar] [CrossRef]
  10. Gholami, L.; Sadeghi, S.H.; Homaee, M. Straw mulching effect on splash erosion, runoff, and sediment yield from eroded plots. Soil Sci. Soc. Am. J. 2013, 77, 268–278. [Google Scholar] [CrossRef]
  11. Prats, S.A.; MacDonald, L.H.; Monteiro, M.S.V.; Ferreira, A.J.D.; Coelho, C.O.A.; Keizer, J.J. Effectiveness of forest residue mulching in reducing post-fire runoff and erosion in a pine and a eucalypt plantation in north-central Portugal. Geoderma 2012, 191, 115–124. [Google Scholar] [CrossRef]
  12. Prats, S.A.; Abrantes, J.R.; Crema, I.P.; Keizer, J.J.; de Lima, J.L. Runoff and soil erosion mitigation with sieved forest residue mulch strips under controlled laboratory conditions. For. Ecol. Manag. 2017, 396, 102–112. [Google Scholar] [CrossRef]
  13. Shen, H.; Li, H.; Liu, H.; Wu, J.; Li, C.; Liang, Y. Effects of Furrow Corn Straw Mulch on Soil Erosion and Organic Carbon Loss in Sloping Farmland in the Black Soil Region. Agronomy 2025, 15, 66. [Google Scholar] [CrossRef]
  14. Gholamahmadi, B.; Jeffery, S.; Gonzalez-Pelayo, O.; Prats, S.A.; Bastos, A.C.; Keizer, J.J.; Verheijen, F.G.A. Biochar impacts on runoff and soil erosion by water: A systematic global scale meta-analysis. Sci. Total Environ. 2023, 871, 161860. [Google Scholar] [CrossRef] [PubMed]
  15. Abrol, V.; Ben-Hur, M.; Verheijen, F.G.A.; Keizer, J.J.; Martins, M.A.; Tenaw, H.; Tchehansky, L.; Graber, E.R. Biochar effects on soil water infiltration and erosion under seal formation conditions: Rainfall simulation experiment. J. Soils Sediments 2016, 16, 2709–2719. [Google Scholar] [CrossRef]
  16. Prats, S.A.; Abrantes, J.R.C.D.B.; Coelho, C.D.O.A.; Keizer, J.J.; de Lima, J.L.M.P. Comparing topsoil charcoal, ash, and stone cover effects on the postfire hydrologic and erosive response under laboratory conditions. Land Degrad. Dev. 2018, 29, 2102–2111. [Google Scholar] [CrossRef]
  17. Shanthi, P.; Renuka, R.; Sreekanth, N.; Babu, P.; Thomas, A. A study of the fertility and carbon sequestration potential of rice soil with respect to application of biochar and selected amendments. Ann. Environ. Sci. 2013, 7, 17–30. [Google Scholar]
  18. Verheijen, F.G.A.; Bastos, A.C.; Vasques, A.; Mesquita, R.; Keizer, J.J.; Silva, F.C.; Jesus, C.; Amaral, J.; Pinto, G. Biochar Increases Water Use Efficiency in Eucalypt Plants Under Water and Nutrient Limitation, with Trade-Offs Under Non-limiting Conditions. J. Soil Sci. Plant Nutr. 2022, 22, 1732–1742. [Google Scholar] [CrossRef]
  19. Kabato, W.; Getnet, G.T.; Sinore, T.; Nemeth, A.; Molnár, Z. Towards Climate-Smart Agriculture: Strategies for Sustainable Agricultural Production, Food Security, and Greenhouse Gas Reduction. Agronomy 2025, 15, 565. [Google Scholar] [CrossRef]
  20. Chisté, L.; Silva, C.A.; Rabêlo, F.H.S.; Jindo, K.; Melo, L.C.A. Evaluating Copper-Doped Biochar Composites for Improving Wheat Nutrition and Growth in Oxisols. Agronomy 2025, 15, 144. [Google Scholar] [CrossRef]
  21. Li, Q.; Xu, M.; Xu, L.; Wu, X.; Zhang, Y.; Xin, J.; Shen, Y.; Gao, J. Organic Fertilization Leads to N Limitation Rather than P Limitation in Both Vegetable Soils. Agronomy 2025, 15, 190. [Google Scholar] [CrossRef]
  22. Ogle, S.M.; Alsaker, C.; Baldock, J.; Bernoux, M.; Breidt, F.J.; McConey, B.; Regina, K.; Vasquez-Amabile, G. Climate and Soil Characteristics Determine Where No-Till Management Can Store Carbon in Soils and Mitigate Greenhouse Gas Emissions. Sci. Rep. 2019, 9, 11665. [Google Scholar] [CrossRef] [PubMed]
  23. Godlewska, P.; Ok, Y.S.; Oleszczuk, P. The Dark Side of Black Gold: Ecotoxicological aspects of biochar and biochar-amended soils. J. Hazard. Mater. 2021, 403, 123833. [Google Scholar] [CrossRef] [PubMed]
  24. Flanagan, D.C.; Nearing, M.A. USDA-Water Erosion Prediction Project Hillslope Profile and Watershed Model Documentation, NSERL Report 10; USDA ARS National Soil Erosion Research Laboratory: West Lafayette, IN, USA, 1995. [Google Scholar]
  25. Christiansen, J.E.; Sprinkling, I. California Agricultural Experiment Station Bulletin; University of California: Berkeley, CA, USA, 1942; p. 670. [Google Scholar]
  26. Prats, S.A.; Malvar, M.C.; Coelho, C.O.A.; Wagenbrenner, J.W. Hydrologic and erosion responses to compaction and added surface cover in post-fire logged areas: Isolating splash, interrill and rill erosion. J. Hidrol. 2019, 575, 408–419. [Google Scholar] [CrossRef]
  27. Van der Vliet, L.; Velicogna, J.; Princz, J.; Scroggins, R. Phytotoxkit: A critical look at a rapid assessment tool. Environ. Toxicol. Chem. 2012, 31, 316–323. [Google Scholar] [CrossRef]
  28. Trupiano, D.; Cocozza, C.; Baronti, S.; Amendola, C.; Vaccari, F.C.; Lustrato, G.; Lonardo, S.; Fantasma, F.; Tognetti, R.; Scippa, G.S. The Effects of Biochar and Its Combination with Compost on Lettuce (Lactuca sativa L.) Growth, Soil Properties, and Soil Microbial Activity and Abundance. Int. J. Agron. 2017, 2017, 3158207. [Google Scholar] [CrossRef]
  29. Bagur-González, M.; Estepa-Molina, C.; Martín-Peinado, F.; Morales-Ruano, S. Toxicity assessment using Lactuca sativa L. bioassay of the metal(loid)s As, Cu, Mn, Pb and Zn in soluble in water saturated soil extracts from an abandoned mining site. J. Soil Sediments 2011, 11, 281–289. [Google Scholar] [CrossRef]
  30. Vaz, A.S.; Ribeiro, J.; Honrado, J.P.; Vicente, J.R. Stakeholders’ perceptions towards non-native acacias and implications for their management in Portugal. For. Int. J. For. Res. 2020, 93, 557–566. [Google Scholar] [CrossRef]
  31. Kramer, C.Y. Extension of multiple range tests to group means with unequal numbers of replications. Biometrics 1956, 12, 307–310. [Google Scholar] [CrossRef]
  32. Prats, S.A.; Merino, A.; Gonzalez-Perez, J.A.; Verheijen, F.G.A.; De la Rosa, J.M. Can straw-biochar mulching mitigate erosion of wildfire-degraded soils under extreme rainfall? Sci. Total Environ. 2021, 761, 143219. [Google Scholar] [CrossRef]
  33. Foltz, R.B.; Wagenbrenner, N.S. An evaluation of three wood shred blends for post fire erosion control using indoor simulated rain events on small plots. Catena 2010, 80, 86–94. [Google Scholar] [CrossRef]
  34. Pannkuk, C.D.; Robichaud, P.R. Effectiveness of needle cast at reducing erosion after forest fires. Water Resour. Res. 2003, 39, 1333. [Google Scholar] [CrossRef]
  35. Prats, S.A.; Wagenbrenner, J.; Malvar, M.C.; Martins, M.A.S.; Keizer, J.J. Hydrological implications of post-fire mulching across different spatial scales. Land Degrad. Dev. 2016, 27, 1440–1452. [Google Scholar] [CrossRef]
  36. Mao, J.; Zhang, K.; Chen, B. Linking hydrophobicity of biochar to the water repellency and water holding capacity of biochar-amended soil. Environ. Pollut. 2019, 253, 779–789. [Google Scholar] [CrossRef]
  37. Page-Dumroese, D.S.; Robichaud, P.R.; Brown, R.E.; Tirocke, J.M. Water repellency of two forest soils after biochar addition. Trans. ASABE 2015, 58, 335–342. [Google Scholar] [CrossRef]
  38. Montenegro, A.A.A.; Abrantes, J.R.C.B.; de Lima, J.L.M.P.; Singh, V.P.; Santos, T.E.M. Impact of mulching on soil and water dynamics under intermittent simulated rainfall. Catena 2013, 109, 139–149. [Google Scholar] [CrossRef]
  39. Shi, Z.H.; Yue, B.J.; Wang, L.; Fang, N.F.; Wang, D.; Wu, F.Z. Effects of mulch cover rate on interrill erosion processes and the size selectivity of eroded sediment on steep slopes. Soil Sci. Soc. Am. J. 2013, 77, 257–267. [Google Scholar] [CrossRef]
  40. Robichaud, P.R.; Jordan, P.; Lewis, S.A.; Ashmun, L.E.; Covert, S.A.; Brown, R.E. Evaluating the effectiveness of wood shred and agricultural straw mulches as a treatment to reduce post-wildfire hillslope erosion in southern British Columbia. Can. Geomorphol. 2013, 197, 21–33. [Google Scholar] [CrossRef]
  41. van Capelle, C.; Schrader, S.; Brunotte, J. Tillage-induced changes in the functional diversity of soil biota–A review with a focus on German data. Eur. J. Soil Biol. 2012, 50, 165–181. [Google Scholar] [CrossRef]
  42. Jordán, A.; Zavala, L.M.; Gil, J. Effects of mulching on soil physical properties and runoff under semi-arid conditions in Southern Spain. Catena 2010, 81, 77–85. [Google Scholar] [CrossRef]
  43. Rodrigo-Comino, J.; Martínez-Hernández, C.; Iserloh, T.; Cerdà, A. Contrasted impact of land abandonment on soil erosion in Mediterranean agriculture fields. Pedosphere 2018, 28, 617–631. [Google Scholar] [CrossRef]
  44. Foltz, R.B.; Dooley, J.H. Comparison of erosion reduction between wood strands and agricultural straw. Trans.-Am. Soc. Agric. Eng. 2003, 46, 1389–1396. [Google Scholar] [CrossRef]
  45. Foltz, R.B.; Copeland, N.S. Evaluating the efficacy of wood shreds for mitigating erosion. J. Environ. Manag. 2009, 90, 779–785. [Google Scholar] [CrossRef] [PubMed]
  46. Yanosek, K.A.; Foltz, R.B.; Dooley, J.H. Performance assessment of wood strand erosion control materials among varying slopes, soil textures and cover amounts. J. Soil Water Conserv. 2006, 61, 45–51. [Google Scholar]
  47. Keesstra, S.D.; Rodrigo-Comino, J.; Novara, A.; Giménez-Morera, A.; Pulido, M.; Di Prima, S.; Cerdà, A. Straw mulch as a sustainable solution to decrease runoff and erosion in glyphosate-treated clementine plantations in Eastern Spain. An assessment using rainfall simulation experiments. Catena 2019, 174, 95–103. [Google Scholar] [CrossRef]
  48. Gholami, L.; Karimi, N.; Kavian, A. Soil and water conservation using biochar and various soil moisture in laboratory conditions. Catena 2019, 182, 104151. [Google Scholar] [CrossRef]
  49. Sadeghi, S.H.; Hazbavi, Z.; Harchegani, M.K. Controllability of runoff and soil loss from small plots treated by vinasse-produced biochar. Sci. Total Environ. 2016, 541, 483–490. [Google Scholar] [CrossRef]
  50. Sadeghi, S.H.; Kiani-Harchegani, M.; Hazbavi, Z.; Sadeghi, P.; Angulo-Jaramillo, R.; Lassabatere, L.; Younesi, H. Field measurement of effects of individual and combined application of biochar and polyacrylamide on erosion variables in loess and marl soils. Sci. Total Environ. 2020, 728, 138866. [Google Scholar] [CrossRef]
  51. Ahmadi, S.H.; Ghasemi, H.; Sepaskhah, A.R. Rice husk biochar influences runoff features, soil loss, and hydrological behaviour of loamy soil in a series of successive simulated rainfall events. Catena 2020, 192, 104587. [Google Scholar] [CrossRef]
  52. Bashagaluke, J.B.; Logah, V.; Opoku, A.; Tuffour, H.O.; Sarkodie-Addo, J.; Quansah, C. Soil loss and run-off characteristics under different soil amendments and cropping systems in the semi-deciduous forest zone of Ghana. J. Soil Use Manag. 2019, 35, 617–629. [Google Scholar] [CrossRef]
  53. Doan, T.T.; Henry-Des-Tureaux, T.; Rumpel, C.; Janeau, J.L.; Jouquet, P. Impact of compost, vermicompost and biochar on soil fertility, maize yield and soil erosion in northern Vietnam: A three years mesocosm experiment. Sci. Total Environ. 2015, 514, 147–154. [Google Scholar] [CrossRef]
  54. Khademalrasoul, A.; Kuhn, N.J.; Elsgaard, L.; Hu, Y.; Iversen, B.V.; Heckrath, G. Short-term effects of biochar application on soil loss during a rainfall-runoff simulation. J. Soil Sci. 2019, 184, 17–24. [Google Scholar] [CrossRef]
  55. Lee, S.S.; Shah, H.S.; Awad, Y.M.; Kumar, S.; Ok, Y.S. Synergy effects of biochar and polyacrylamide on plants growth and soil erosion control. Environ. Earth Sci. 2015, 74, 2463–2473. [Google Scholar] [CrossRef]
  56. Lee, C.H.; Wang, C.C.; Lin, H.H.; Lee, S.S.; Tsang, D.C.W.; Jien, S.H.; Ok, Y.S. In-situ biochar application conserves nutrients while simultaneously mitigating runoff and erosion of an Fe-oxide-enriched tropical soil. Sci. Total Environ. 2018, 619, 665–671. [Google Scholar] [CrossRef]
  57. Li, Z.; Gu, C.; Zhang, R.; Ibrahim, I.; Zhang, G.; Wang, L.; Zhang, R.; Chen, F.; Liu, Y. The benefic effect induced by biochar on soil erosion and nutrient loss of slopping land under natural rainfall conditions in Central China. Agric. Water Manag. 2017, 185, 145–150. [Google Scholar] [CrossRef]
  58. Li, Y.; Zhang, F.; Yang, M.; Zhang, J. Effects of adding biochar of different particle sizes on hydro-erosional processes in small scale laboratory rainfall experiments on cultivated loessial soil. Catena 2019, 173, 226–233. [Google Scholar] [CrossRef]
  59. Li, Y.; Zhang, F.; Yang, M.; Zhang, J.; Xie, Y. Impacts of biochar application rates and particle sizes on runoff and soil loss in small, cultivated loess plots under simulated rainfall. Sci. Total Environ. 2019, 649, 1403–1413. [Google Scholar] [CrossRef]
  60. Smetanová, A.; Dotterweich, M.; Diehl, D.; Ulrich, U.; Dotterweich, N.F. Influence of biochar and terra preta substrates on wettability and erodibility of soils. Z. Für Geomorphol. Suppl. Issues 2013, 57, 111–134. [Google Scholar] [CrossRef]
  61. Vilayvong, K.; Yasufuku, N.; Omine, K. Mitigating rainfall-induced sediment hazard and soil erosion using organic amended soil improvement. J. Dis. Res. 2016, 11, 1228–1237. [Google Scholar] [CrossRef]
  62. Zhang, F.; Huang, C.; Yang, M.; Zhang, J.; Shi, W. Rainfall simulation experiments indicate that biochar addition enhances erosion of loess-derived soils. Land Degrad. Dev. 2019, 30, 2272–2286. [Google Scholar] [CrossRef]
  63. Zhou, B.B.; Chen, X.P.; Wang, Q.J.; Wei, W.; Zhang, T.C. Effects of nano carbon on soil erosion and nutrient loss in a semi-arid loess region of Northwestern China. Int. J. Agric. Bio. Eng. 2018, 11, 138–145. [Google Scholar] [CrossRef]
  64. Zhou, B.B.; Chen, X.P.; Henry, L. The effect of nano-biochar on soil, water, and nutrient loss of a sloping land with different vegetation covers on loess plateau of China. Appl. Ecol. Environ. Res. 2020, 18, 2845–2861. [Google Scholar] [CrossRef]
  65. Agarwal, T.; Khillare, P.S.; Shridhar, V.; Ray, S. Pattern, sources and toxic potential of PAHs in the agricultural soils of Delhi, India. J. Hazard. Mater. 2009, 163, 1033–1039. [Google Scholar] [CrossRef] [PubMed]
  66. Kataya, G.; Charif, Z.E.; Badran, A.; Cornu, D.; Bechelany, M.; Hijazi, A.; Sukkariyah, B.; Issa, M. Evaluating the impact of different biochar types on wheat germination. Sci. Rep. 2024, 14, 28663. [Google Scholar] [CrossRef] [PubMed]
  67. Maliszewska-Kordybach, B.; Smreczak, B.; Klimkowicz-Pawlas, A. Concentrations, sources, and spatial distribution of individual polycyclic aromatic hydrocarbons (PAHs) in agricultural soils in the Eastern part of the EU: Poland as a case study. Sci. Total Environ. 2009, 407, 3746–3753. [Google Scholar] [CrossRef]
  68. Nam, J.J.; Thomas, G.O.; Jaward, F.M.; Steinnes, E.; Gustafsson, O.; Jones, K.C. PAHs in background soils from Western Europe: Influence of atmospheric deposition and soil organic matter. Chemosphere 2008, 70, 1596–1602. [Google Scholar] [CrossRef]
  69. Seo, M.W.; Yang, D.S.; Kays, S.J.; Kim, J.H.; Woo, J.H.; Park, K.W. Effects of nutrient solution electrical conductivity and sulfur, magnesium, and phosphorus concentration on sesquiterpene lactones in hydroponically grown lettuce (Lactuca sativa L.). Sci. Hortic. 2009, 122, 369–374. [Google Scholar] [CrossRef]
  70. Hoekstra, N.; Bosker, T.; Lantinga, E. Effects of cattle dung from farms with different feeding strategies on germination and initial root growth of cress (Lepidium sativum L.). Agric. Ecosyst. Environ. 2002, 93, 189–196. [Google Scholar] [CrossRef]
  71. Hartemink, A.E.; Barrow, N.J. Soil pH-nutrient relationships: The diagram. Plant Soil 2023, 486, 209–215. [Google Scholar] [CrossRef]
  72. Gomes, F.S.; da Silva, P.N.; Dos Reis, C.H.G.; de Anchieta, M.R.; Santolino, A.C.; Nakamura, K.S.D.; Pereira, F.J. Iron mining tailing toxicity is increased by lower pH affecting lettuce seed germination, seedling early growth, and leaf anatomy. Environ. Sci. Pollut. Res. 2025, 32, 5788–5799. [Google Scholar] [CrossRef]
  73. Bolan, N.; Sarmah, A.K.; Bordoloi, S.; Bolan, S.; Padhye, L.P.; Van Zwieten, L.; Sooriyakumar, P.; Khan, B.A.; Ahmas, M.; Solaiman, Z.M.; et al. Soil acidification and the liming potential of biochar. Environ. Pollut. 2023, 317, 120632. [Google Scholar] [CrossRef]
  74. Dai, Y.; Zheng, H.; Jiang, Z.; Xing, B. Combined effects of biochar properties and soil conditions on plant growth: A meta-analysis. Sci. Total Environ. 2020, 713, 136635. [Google Scholar] [CrossRef] [PubMed]
  75. Pinho, I.A.; Lopes, D.V.; Martins, R.C.; Quina, M.J. Phytotoxicity assessment of olive mill solid wastes and the influence of phenolic compounds. Chemosphere 2017, 185, 258–267. [Google Scholar] [CrossRef] [PubMed]
  76. Louati, Z.; Wahab, M.A.; Drapanauskaitė, D.; Doyeni, M.; Baksinskaite, A.; Ziura, K.; Zvicevicius, E.; Jedidi, N.; Trabelsi, I.; Barcauskaite, K. Benefits of pig manure digestate-derived biochar on soil properties and plant growth. Euro-Mediterr. J. Environ. Integr. 2025, 1–14. [Google Scholar] [CrossRef]
  77. Adhikari, B.; Olorunwa, O.J.; Wilson, J.C.; Barickman, T.C. Seasonal dynamics of lettuce growth on different electrical conductivity under a nutrient film technique hydroponic system. Technol. Hortic. 2024, 4, e018. [Google Scholar] [CrossRef]
Figure 1. Runoff volume (mm), leachate volume (mm), and soil water storage volume (mm) in each one of the bare soil (control), biochar mix (2.8% by weight), biochar layer (surface application of 10 Mg ha−1), mulch layer (surface application of 2 Mg ha−1 of straw mulch), and mulch + biochar (M + B) layer (surface application of 2 Mg ha−1 of straw mulch on top of 10 Mg ha−1 of biochar) treatments, after 30 min of simulated rainfall at an intensity of 85.6 mm h−1. Pooled data for soil A and B. Error bars correspond to standard deviation. Different letters in each variable indicate significant differences between treatments at p < 0.05 (Tukey–Kramer test), n = 18.
Agronomy 15 00926 g001
Figure 2. Interrill erosion (a) and rainsplash erosion (b), in each one of the bare soil (control), biochar mix (2.8% by weight), biochar layer (surface application of 10 Mg ha−1), mulch layer (surface application of 2 Mg ha−1 of straw mulch), and mulch + biochar (M + B) layer (surface application of 2 Mg ha−1 of straw mulch on top of 10 Mg ha−1 of biochar) treatments, after 30 min of simulated rainfall at an intensity of 85.6 mm h−1. Pooled data for soil A and B. Error bars correspond to standard deviation. Different letters indicate significant differences between treatments, at p < 0.05, n = 18.
Agronomy 15 00926 g002
Figure 3. Runoff volume (a) and interrill erosion (b) per minute, during the 30 min rainfall simulations at a 85.6 mm h−1 intensity, in each one of the treatments: bare soil (control), biochar mix (2.8% by weight), biochar layer (surface application of 10 Mg ha−1), mulch layer (surface application of 2 Mg ha−1 of straw mulch), and mulch + biochar (M + B) layer (surface application of 2 Mg ha−1 of straw mulch on top of 10 Mg ha−1 of biochar). Pooled data for soil A and B. Only positive error bars, corresponding to standard deviation, were shown to facilitate visualization, n = 18.
Agronomy 15 00926 g003
Figure 4. Germination percentage (a), root length (b), and shoot length (c) in leachate samples of each treatment and rainfall simulations time intervals of 0–10 min, 10–20 min, and 20–30 min. Pooled data for soil A and B. Asterisk (*) near a treatment line indicate significant differences in the selected treatment as compared with bare soil in each time interval at p < 0.05, n = 18.
Agronomy 15 00926 g004
Figure 5. pH (a) and EC (b) of the leachate, in each treatment and time interval during the rainfall simulations. Pooled data for soil A and B. Asterisk (*) indicates significant differences in comparison with bare soil, at p < 0.05, n = 18.
Agronomy 15 00926 g005
Figure 6. Runoff effect versus erosion effect (percentage of increase or decrease as compared to untreated plots) for comparing studies in the literature on the effect of biochar and mulch application schemes: biochar soil-mixed (brown), biochar soil surface layer (blue), and mulch soil surface layer (green). Negative percentages indicate reductions, while positive percentages indicate increases in the treatments as compared to the untreated controls. Numbers correspond to the references; B (biochar layer), M (mulch layer), and MB (mulch + biochar layer) correspond to this study.
Agronomy 15 00926 g006
Table 1. Characteristics of the biochar, straw, vineyard soil (soil A), and olive orchard soil (soil B). Values between brackets are the standard deviation over the mean value (n = 3). Organic matter content was quantified via incineration (550 °C for 3 h), and water holding capacity (WHC) was determined through weight measurements before and after saturation with water. Bulk density was measured using the volumetric ring method. pH and EC assessments were conducted using a potentiometer. Polycyclic aromatic hydrocarbons (PAHs) were analyzed through capillary column gas chromatography–mass spectrometry (GC/MS), following the United States Environmental Protection Agency (US EPA) methodology.
MaterialApplication Rate (g m−2)Cover Contribution (%)Layer Thickness (mm)Organic Matter Content (%)Water Holding Capacity (mL)Bulk Density (g cm−3)pHElectrical Conductivity (mS cm−1)PAHs Content (mg kg−1)Repellency WDPT (s)
Biochar1000 (0)100 (0)5 (2)93.8 (5)50 (0)0.6 (0.1)9 (0.3)0.5 (0.1)14.93 (2)
Straw200 (0)100 (0)40 (10)92.5 (5)50 (0)0.3 (0.1)5.5 (0.2)0.3 (0)<0.046 (4)
Soil A-0 (0)40 (0)5 (0.8)48.3 (0.5)1.30 (0.12)6.5 (0.2)0.06 (0)<0.040 (0)
Soil B-0 (0)40 (0)4 (0.6)44.1 (0.6)1.34 (0.15)5.7 (0.2)0.08 (0)<0.040 (0)
Soil–biochar mix A1000 (0)0 (0)40 (0)7.5 (1)48.5 (0.4)1.22 (0.09)7.1 (0.2)0.07 (0)0.460 (0)
Soil–biochar mix B1000 (0)0 (0)40 (0)6.5 (1)44.4 (0.3)1.26 (0.11)6.4 (0.2)0.09 (0)0.460 (0)
Table 2. Mean and standard deviation results for each soil (A, B) and treatment for the hydrologic and erosion variables. Different letters indicate significant differences between treatments. Values in bold mean significant differences between soil-mixed and surface-layered treatments. For all comparisons, α = 0.05.
Homogeneous Mixture (Soil-Mixed)Heterogeneous Mixture (Surface-Layered)
Bare SoilBiochar MixBiochar LayerMulch LayerMulch + Biochar Layer
Soil ASoil BSoil ASoil BSoil ASoil BSoil ASoil BSoil ASoil B
Hydrological variables
Rainfall (mm)41 ± 1 a42 ± 1 a43 ± 3 a43 ± 3 a41 ± 1 a41 ± 1 a43 ± 3 a43 ± 3 a42 ± 1 a43 ± 3 a
Runoff (mm)15 ± 6 ab19 ± 4 ab8 ± 5 ab8 ± 4 ab6 ± 9 ab7 ± 4 b2 ± 4 a2 ± 4 a4 ± 7 ab5 ± 5 ab
Runoff coefficient (%)37 ± 15 ab45 ± 9 ab18 ± 11 ab18 ± 8 ab14 ± 17 ab17 ± 9 b5 ± 9 a5 ± 8 a10 ± 17 ab12 ± 11 ab
Soil water storage (mm)11 ± 4 abc10 ± 4 abc12 ± 1 abc11 ± 4 abc13 ± 1 a17 ± 4 b9 ± 3 c14 ± 1 ab8 ± 3 c14 ± 1 ab
Leachate (mm)11 ± 3 abc8 ± 4 abc11 ± 3 abc13 ± 2 abc15 ± 7 abc13 ± 5 ac21 ± 6 ab13 ± 3 c23 ± 8 b15 ± 2 abc
R. start (min)9 ± 4 ab8 ± 4 ab9 ± 4 ab13 ± 9 ab9 ± 7 a17 ± 6 ab22 ± 13 b19 ± 14 ab18 ± 13 ab14 ± 6 ab
R. end (min)31 ± 4 ab32 ± 1 ab33 ± 1 ab32 ± 1 ab30 ± 4 a33 ± 1 b33 ± 2 ab32 ± 2 ab32 ± 2 ab32 ± 2 ab
L. start (min)5 ± 2 abc6 ± 5 abc5 ± 2 abc7 ± 2 abc4 ± 1 a9 ± 3 b6 ± 1 a12 ± 2 b4 ± 2 ac10 ± 3 b
Erosion variables
Interrill (g m−2)53 ± 16 abcb80 ± 17 ad36 ± 33 bc23 ± 10 bc35 ± 25 ab19 ± 13 abcd17 ± 10 abcd8 ± 8 cd15 ± 11 abcd14 ± 14 abcd
Rainsplash (g m−2)6.2 ± 8 abcd6.4 ± 8 ad6.2 ± 2 abcd3.3 ± 5 bc3.1 ± 5 ab4.7 ± 7 abcd1 ± 1 abcd0.5 ± 1 cd0.8 ± 1 abcd0.5 ± 1 bc
Table 3. Summary of the fixed effects statistical showing the numerator degrees of freedom (df), the F-values and the p-values, for the variables runoff, leachate, soil water storage (SWS), interrill erosion, and root length, for the selected, best fitting, statistical mixed models as well as individual models for each individual fixed factor: Treatment (5 levels), Soil (2 levels), Layer (2 levels), Biochar presence (2 levels), and Mulch presence (2 levels). Asterisk (*) indicate the interaction between the variable Treatment and Soil. Statistically significant effects (p < 0.05 and p < 0.001) are shown in bold type.
HydrologicErosionPhytotoxic
Runoff (mm)Leachate (mm)SWS (mm)Interrill (g m−2)Root Length (mm)
dfF Valuep ValueF Valuep ValueF Valuep ValueF Valuep ValueF Valuep Value
Best fitting model
Treatment417.6<0.00111.3<0.0015.2<0.00118.1<0.00115<0.001
Soil12.20.313.3<0.00122.8<0.0013.40.16174<0.001
Treatment * Soil40.20.853.5<0.057.7<0.0012.3<0.0522.8<0.001
Individual models
Treatment418.1<0.0019<0.0013.30.1416.5<0.00113.9<0.001
Soil10.90.548.4<0.0515.3<0.0012.20.25154.5<0.001
Layer116<0.00112<0.0011.70.1918.5<0.0015<0.05
Biochar presence100.191.90.182.60.112.30.0621.2<0.001
Mulch presence137.8<0.00126.4<0.0012.10.1629.5<0.0010.70.4
Table 4. Mean and standard deviation results for each soil (A, B) and treatment for the phytotoxicity variables. Different letters indicate significant differences between treatments. Values in bold type mean significant differences between soil-mixed and surface-layered treatments. For all comparisons, α = 0.05.
Homogeneous Mixture (Soil-Mixed)Heterogeneous Mixture (Surface-Layered)
UntreatedBiochar MixBiochar LayerMulch LayerMulch + Biochar Layer
Soil ASoil BSoil ASoil BSoil ASoil BSoil ASoil BSoil ASoil B
Phytotoxicity variables
Germination (%)85 ± 15 a79 ± 20 a88 ± 9 a79 ± 15 a88 ± 13 a83 ± 13 a82 ± 15 a82 ± 17 a83 ± 11 a81 ± 12 a
Root length (mm)12.3 ± 7 cf7.5 ± 4 g12.9 ± 6 bcd13.4 ± 7 e13.6 ± 7 a10.2 ± 6 df13.1 ± 6 abd5.5 ± 4 g11.1 ± 7 e11.4 ± 7 e
Shoot length (mm)9.8 ± 5 f7.7 ± 4 eg10.9 ± 5 cf11.8 ± 6 bg11.7 ± 5 a8.8 ± 5 ac10.3 ± 4 b6.6 ± 5 d8.2 ± 5 de10.6 ± 5 f
Leachate pH7.5 ± 0.1 ab7.2 ± 0.4 b7.3 ± 0.4 ab7.5 ± 0.2 a7.7 ± 0.5 ab7.2 ± 0.2 ab7 ± 0.2 ab6.4 ± 0.2 ab7.4 ± 0.5 ab7.3 ± 0.2 ab
Leachate EC0.7 ± 0.4 ab1.1 ± 0.6 b1.3 ± 0.7 ab0.9 ± 0.4 a1.2 ± 0.7 ab1.1 ± 0.2 ab1.1 ± 0.7 ab1.2 ± 0.4 ab0.7 ± 0.2 ab1.2 ± 0.4 ab
Disclaimer/Publisher’s Note: The statements, opinions and data contained in all publications are solely those of the individual author(s) and contributor(s) and not of MDPI and/or the editor(s). MDPI and/or the editor(s) disclaim responsibility for any injury to people or property resulting from any ideas, methods, instructions or products referred to in the content.

