Article

Dosages of Biodegradable Poly(butylene adipate-co-terephthalate) Microplastics Affect Soil Microbial Community, Function, and Metabolome in Plant–Soil System

1
Institute of Resources, Environment and Soil Fertilizer, Fujian Academy of Agricultural Sciences, Fuzhou 350003, China
2
College of Resources and Environment, Fujian Agriculture and Forestry University, Fuzhou 350002, China
*
Author to whom correspondence should be addressed.
Agronomy 2025, 15(4), 990; https://doi.org/10.3390/agronomy15040990
Submission received: 2 March 2025 / Revised: 22 March 2025 / Accepted: 1 April 2025 / Published: 21 April 2025
(This article belongs to the Section Soil and Plant Nutrition)

Abstract

:
As a substitute for conventional plastic mulch, biodegradable mulch film (BDM) has been popular in agricultural systems in recent years. However, studies focusing on the systematic effect of BDM residues on the soil microbiome and metabolome remain obscure. Thus, a mesocosm experiment was established, and it aimed to investigate the effects of concentrations of poly(butylene adipate-co-terephthalate) (PBAT) microplastics (MPs) on soil microbial ecology and plant (Lactuca sativa) fitness. Metagenomics and metabolomics analyses were deployed to explore the response of soil microbial communities, functional shifts, and metabolites under different dosages of PBAT MPs (CK, 0.1%, 1%, and 5% w/w). The results showed that PBAT MPs did not significantly affect the morphological traits (shoot length and leaf dry weight) of the plant. Regarding plant biochemical indicators, the highest concentration of PBAT could increase the proline and soluble protein contents compared to low- and medium-dosage PBAT treatments with high malonaldehyde (MDA) or soluble sugar contents. Soil physicochemical properties like the available phosphorus and potassium, ammonium N and nitrate N contents were decreased in a dose-dependent manner. Metagenomics analysis revealed that only a high concentration of PBAT had more profound effects on the soil microbial community composition, diversity, and function when compared to the control (CK). In particular, a 5% PBAT treatment could result in the development of some microbial biomarkers, such as Paraburkholderia and Rhizobium, which had beneficial functions. Moreover, metabolomics analysis showed that 5% PBAT differentially affected the soil metabolites, with a high abundance of bioactives like peptides, organic acid, and nepetaside. This work underscores that soil could recruit certain microbes and bioactive substances to resist external high-PBAT stress. PBAT might pose little threat to the soil ecosystem, and its application is beneficial for soil health management.

1. Introduction

Plastic mulch films have been widely used in agriculture for decades due to their numerous benefits [1]. They can regulate the soil temperature and moisture [2], inhibit weeds [3], and enhance crop growth [4]. Conventional polyethylene (PE) mulches are not easily degradable in soils, resulting in plastic contamination [5]. Plastic films deposited in soils can decompose into microplastics with a particle size of less than 5 mm, which are widely considered emerging pollutants because of their poor biodegradability and potential toxicity [6]. Microplastics (MPs) may accumulate in soils and pose a potential risk to the soil environment [7]. To alleviate plastic pollution in agricultural soil, biodegradable plastic mulch films (BDMs) have been introduced as an alternative to the traditional PE mulch films. BDMs can be left in the agricultural field at the end of the growth period, which reduces the recycling cost of mulch films. At present, poly(butylene adipate-co-terephthalate (PBAT), polylactic acid (PLA), and polybutylene succinate (PBS) are popular biodegradable plastics on the market. Based on an overall consideration of the film performance, production technology, and cost [8], PBAT is widely used in mulch because of its excellent moldability [9]. Many studies have shown that BDMs have promising applications in specific crops in certain regions [10]. Other than the agronomic benefits of BDMs, the mechanisms of the biodegradation process in the soil should also be considered. In theory, biodegradable plastics (BPs) can be completely converted by microorganisms into microbial biomass, CO2, and H2O [11] and have no detrimental effect on the soil. However, the complete degradation of BPs is difficult in real soil conditions. The complete biodegradation of bioplastics occurs under specific conditions, including a suitable temperature, pH, humidity, and sufficient nutrients [12]. Sintim et al. [13] pointed out that the in situ degradation of biodegradable plastics under real environmental conditions requires several years, and the mineralization process has been proven to be incomplete. Compared with the CK, the degradation rate of PBAT in mature compost increased by 4.44% during 21 days of composting [14]. PBAT films broke into large-scale fragments after being buried in the soil for 180 days [15]. Therefore, BPs may also generate MPs after use in the agricultural field [16].
So far, some studies have demonstrated that BDMs may be more detrimental to plants and soil ecosystems than PE MPs. Numerous research studies have evaluated BDM’s effects on various crops [17,18,19]. Brown et al. [20] found that poly(3-hydroxybutyrat-co-3-hydroxyvalerate) (PHBV) MPs could reduce the maize plant biomass. It was reported that PE MPs had no noticeable toxic effect on plant growth, while 0.1% PLA MPs significantly decreased the root length in comparison with the control [21]. Microorganisms are the key drivers in element cycles in soil. Elucidating the changes in microbial communities is critical in understanding the ecological impacts of MPs. Because of the biodegradation of BPs, they can be consumed by the soil microbiome, and consequently, they may alter soil microbial communities. The extent of the effect of BPs on the soil microbial diversity depends on the material, dosage, and soil physicochemical properties. A meta-analysis once demonstrated that soil bacteria generally had a more obvious response to traditional MPs than fungi [22]. However, the increase in the fungal diversity index with the PBAT treatment was higher than that of the soil bacteria [23]. Song et al. [24] found that bio-MPs like PBAT and PLA reduced the soil bacterial diversity compared to the control (CK) and conventional MPs. MPs may change the soil bacterial community composition, depending on the dose and type of MPs. For example, high-dose PLA (10%) enriched several dominant taxa such as Firmicutes (Bacillus), Proteobacteria (Bradyrhizobium, Steroidobacter, Phenylobacterium, Skermanella, and Ramlibacter), Actinobacteria (Saccharothrix, Pseudarthrobacter, Blastococcus, and Pseudonocardia), and Chloroflexi (SBR1031), which implies that these bacteria may utilize PLA or its metabolites [25].
A change in the soil metabolites could reflect the response of soil microbiomes to external disturbances [26]. Elucidating the variations in soil metabolism with mulch film residue can help us understand the biochemical signatures of microbial communities [27]. The combined analysis of soil microorganisms and soil metabolism is considered a powerful method to reveal soil biological systems with an external disturbance [28]. Previous studies were mainly focused on PBAT fragments. PBAT particles with diameters in the micrometer range can exert varying impacts on the soil. In this study, a pot experiment was conducted with Lactuca sativa to investigate the effects of varying dosages of PBAT MPs on plant growth, soil physicochemical properties, soil microbial communities, and soil metabolites. We hypothesized that the concentration of PBAT would significantly alter the soil microbial communities, with certain microbes and metabolites being induced by a high-dosage PBAT amendment.

2. Materials and Methods

2.1. Experimental Materials

PBAT powder with a particle size of 100 mesh was procured from Xinjiang Blue Ridge Tunhe Sci. & Tech. Co., Ltd., Changji, China. Lactuca sativa seeds were obtained from Anhui 97 Seedling Technology Co., Ltd., Hefei, China. The seeds were sterilized in 5% sodium hypochlorite solution for 10 min, followed by five rinses with deionized water, and were subsequently soaked in deionized water in darkness to promote germination. Soil samples were collected from the topsoil (0–20 cm) of farmland in Xiapu County, Fujian Province (120°1′16″ E, 26°49′19″ N). This soil is classified as Stagnic Anthrosol according to the FAO [29]. The soil was air-dried and sieved through a 2 mm mesh to remove stones and plant debris. The soil used in this study did not exhibit visible microplastics.

2.2. Experimental Design

Four treatments were designed: CK (control, no PBAT), T1 (0.1% w/w), T2 (1% w/w), and T3 (5% w/w). These concentrations were determined based on the environmentally relevant concentration of plastic residues, which is 1% [30]. Approximately 2 kg of a mixture of soil and a PINDSTRUP substrate (8:2, w/w) were placed into gallon pots (diameter = 8.6 cm, height = 8.2 cm) and the corresponding PBAT powder was added to achieve the final MP concentrations. Three pre-germinated L. sativa seeds were sown in each pot, and after one week, two seedlings were retained. All pots were placed in a growth chamber at 26 °C with a light/dark cycle of 16 h/8 h and a light intensity of 25,000 lx. The soil moisture was maintained at 60% of the maximum water holding capacity throughout the incubation period. Each treatment consisted of four replicates. During the soil culture, the soil samples were periodically replenished with deionized water to maintain the soil moisture at 60% of the maximum water holding capacity.

2.3. Soil and Plant Sampling and Analysis

After 120 days of plant growth, soil samples were collected and stored at −80 °C for the analysis of the soil microbiome and metabolites. Air-dried soil was used for the analysis of the soil physicochemical properties. The soil pH was measured in a 1:2.5 soil-to-water suspension solution using a pH meter (NY/T 1377-2007) [31]; the organic carbon and dissolved organic carbon were determined using the potassium dichromate oxidation method; the total nitrogen (TN), total phosphorus (TP), and total potassium (TK) were analyzed using the Kjeldahl method and digestion method; and the available nitrogen (AN), phosphorus (AP), and potassium (AK) were measured via alkaline hydrolysis and the colormetric method. The ammonium N and nitrate N were determined using potassium chloride and the colormetric method.

2.4. Plant Growth Evaluation

At the end of the incubation, the length of the lettuce shoots was measured. Subsequently, the plant leaves were carefully harvested; one portion of the leaves was oven-dried at 70 °C until a constant weight was achieved for dry weight recording. The remaining leaves were rinsed with deionized water and stored at −80 °C for further analysis. The concentrations of chlorophyll, proline, malonaldehyde (MDA), soluble protein, soluble sugar, and vitamin C in the leaf samples were analyzed by Pronets Testing Co., Ltd., (Wuhan, China) following their specific protocols.

2.5. Soil DNA Extraction, Metagenomic Sequencing, and Bioinformatics Analysis

Soil DNA was extracted from approximately 0.5 g of soil using the Mag-Bind® Soil DNA Kit (Omega Bio-tek, Norcross, GA, USA). The concentration and purity of the extracted DNA were determined using the TBS-380 and NanoDrop 2000 spectrophotometer (NanoDrop Technologies Inc., Wilmington, DE, USA), respectively. The quality of the DNA was assessed on a 1% agarose gel. A total of 16 DNA samples (4 treatments × 4 replicates) were obtained for metagenomic sequencing on the Illumina HiSeq 4000 platform (Illumina Inc., San Diego, CA, USA) by Majorbio Bio-Pharm Technology Co., Ltd. (Shanghai, China). The raw sequences were submitted to the NCBI Sequence Read Archive database (Accession No.: PRJNA1212999).
The paired-end Illumina reads were trimmed for adaptors, and low-quality reads (a length of <50 bp or a quality value of <20) were removed using fastp (https://github.com/OpenGene/fastp, v0.20.0 accessed on 18 April 2024). Subsequently, metagenomic data were assembled using Megahit (https://github.com/voutcn/megahit, v1.12 accessed on 18 April 2024) with a minimum contig length of 300 bp. Open reading frames (ORFs) in the contigs were predicted using Prodigal (https://github.com/hyattpd/Prodigal, v2.6.3 accessed on 18 April 2024), and ORFs greater than 100 bp in length were clustered into a non-redundant gene catalog using CD-HIT (http://www.bioinformatics.org/cd-hit/, v4.6.1 accessed on 18 April 2024) with a 90% sequence identity and 90% coverage. Gene abundances with a 95% identity were calculated using SOAPligner (https://gaow.github.io/genetic-analysis-software/s/soap/, v2.21 accessed on 18 April 2024). Taxonomy identification was performed using Diamond (https://github.com/bbuchfink/diamond, v2.0.13 accessed on 18 April 2024) against the NCBI non-redundant (NR) database with an e-value of <1 × 10⁻⁵. Clusters of metabolic annotations for the predicted ORFs were created using Diamond against the Kyoto Encyclopedia of Genes and Genomes (KEGG) database (http://www.genome.jp/kegg, v20230830 accessed on 18 April 2024) with an e-value of <1 × 10⁻⁵. The Clusters of Orthologous Genes (COGs) were annotated against the eggNOG database using Diamond with an e-value of <1 × 10⁻⁵. The gene counts in each sample were calculated based on the reads per kilobase of reads per million (PRKM). Principal coordinate analysis (PCoA) was performed using the “vegan” package to estimate the community structure and functional discrimination among different treatments with Bray–Curtis similarity metrics. The significance was tested using an analysis of similarities (ADONIS) in R (ver. 3.6.3). The linear discriminant analysis effect size (LEfSe) was calculated using a non-parametric factorial Kruskal–Wallis sum rank test, followed by the Wilcoxon rank sum test to identify biomarkers for each treatment with a linear discriminant analysis (LDA) threshold of >3.0. This analysis was performed using the web tool available at https://huttenhower.sph.harvard.edu/lefse/ (accessed on 18 April 2024). A multi-group comparison analysis of KEGG pathways was conducted using the Kruskal–Wallis test and Tukey–Kramer post hoc test.

2.6. Non-Targeted Metabolome Detection for Soils and Data Analysis

Four biological replicates from each treatment were utilized to evaluate the non-targeted metabolomics, with the analysis conducted by Majorbio Bio-Pharm Technology Co., Ltd. (Shanghai, China). The metabolites of 1 g of soil were ultrasonicated and extracted with 1 mL of methanol/water (4:1, v/v) containing an internal standard solution 40 kHz for 30 min at 5 °C. After incubation at −20 °C for 30 min, the samples were centrifuged at 13,000× g and 4 °C for 15 min. The supernatants were then collected into sample vials for LC-MS/MS analysis. Quality control samples (QC) were prepared by mixing 20 μL of the supernatants from all samples to monitor the stability of the analyses.
The chromatographic separation of metabolites was performed using a Thermo UHPLC-Q Exactive HF-X system (Thermo Scientific, Bremen, Germany) equipped with an ACQUITY HSS T3 column (100 mm × 2.1 mm, 1.8 μm; Waters, Milford, MA, USA). The mobile phases consisted of 0.1% formic acid in acetonitrile/water (5:95, v/v) (solvent A) and 0.1% formic acid in acetonitrile/isopropanol/water (47.5:47.5:5, v/v/v) (solvent B). The sample injection volume was 3 μL, with a flow rate of 0.4 mL min−1, and the column temperature was maintained at 40 °C. Throughout the analysis, all samples were stored at 4 °C. Mass spectrometric data were collected using a Thermo UHPLC-Q Exactive HF-X Mass Spectrometer equipped with an electrospray ionization source operating in both positive and negative ion modes.
The raw data were uploaded into Progenesis QI v3.0 (Waters, Milford, MA, USA) for peak detection and alignment. Each metabolite was normalized through summation, and the raw data were transformed and corrected using log10 to minimize analytical errors. The data matrix was uploaded to the Majorbio platform (https://cloud.majorbio.com, accessed on 10 July 2024) for comprehensive data analysis. The identified metabolites were annotated according to the KEGG database (https://www.kegg.jp/kegg/compound/, accessed on 10 July 2024). Principal component analysis (PCA) and partial least squares discriminant analysis (PLS-DA) were performed to visualize the metabolic alterations across all treatments. Differential metabolites were identified based on variable importance in projection (VIP) values (>2.0) derived from the PLS-DA model.

2.7. Statistical Analysis

The differences in the plant growth, soil properties, and microbial diversity under various treatments were analyzed using SPSS software (version 19.0; SPSS Inc., Chicago, IL, USA). A one-way analysis of variance (ANOVA), followed by Duncan’s test, with a significance level of p < 0.05, was employed to evaluate the effects of the PBAT MP concentrations on microbial diversity and soil physicochemical properties. Additionally, a partial least squares path model (PLS-PM) was constructed using the ‘plspm’ package in R to elucidate the impacts of PBAT dosages on soil properties, plant growth, microbial communities, and soil metabolites.

3. Results

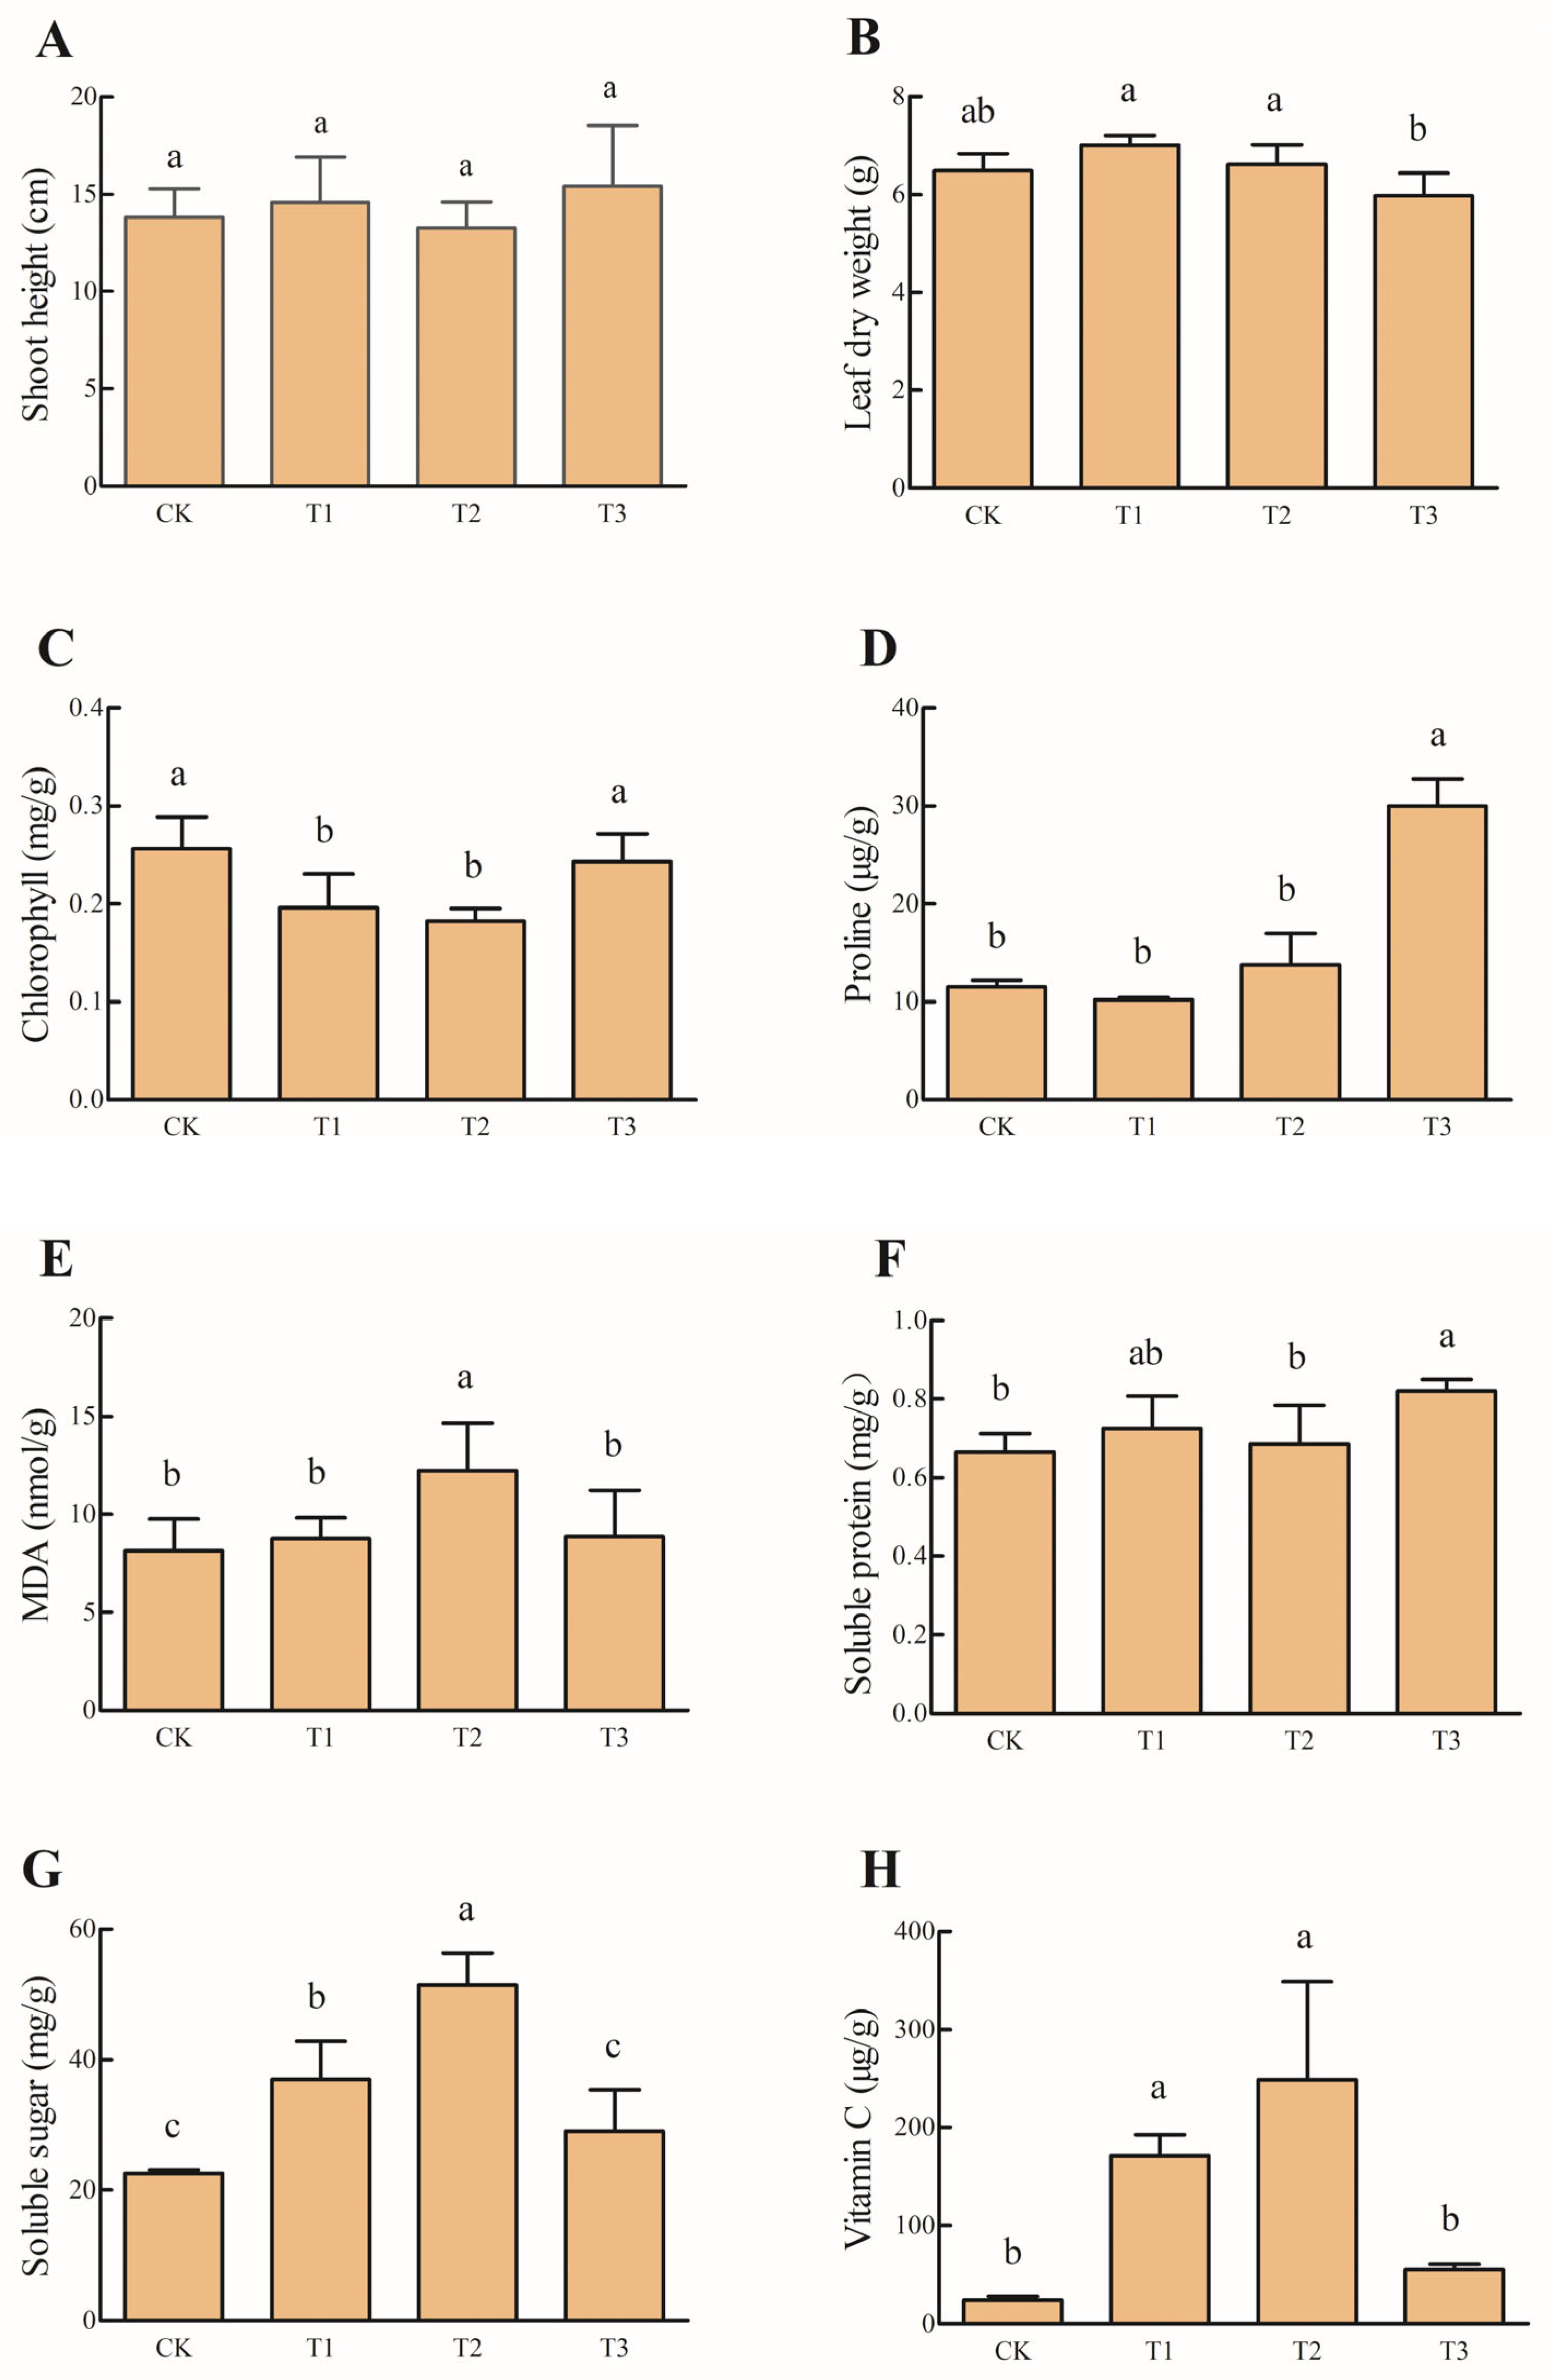
3.1. Effects of PBAT MP Concentration on Plant Growth

No significant differences in the shoot height were observed between the PBAT treatment groups and the control group (CK) (Figure 1A). The dry weights of plant leaves were slightly increased in the T1 and T2 treatments, while a decrease was noted in the T3 group compared to the CK (Figure 1B). After 120 days of growth, the maximum chlorophyll content was recorded in the CK, exhibiting a significant decline with increasing doses of PBAT MPs; however, a substantial increase was observed in the T3 group (Figure 1C). Regarding the leaf proline content, no significant differences were observed between the CK and T1 or T2; nevertheless, a significant increase in the proline content was detected in the T3 group (Figure 1D). The maximum MDA content was recorded in the T2 treatment, while the other treatments showed no significant differences in the MDA content (Figure 1E). Compared to the CK, only the T3 treatment significantly increased the soluble protein content in the plant leaves (Figure 1F). The soluble sugar levels in the leaves increased with PBAT MP treatments, with T3 showing no significant difference compared to the CK (Figure 1G). Vitamin C exhibited a similar trend to that of soluble sugar (Figure 1H).

3.2. Effects of PBAT MP Concentration on Soil Properties

As shown in Table 1, the addition of PBAT MPs influenced several physicochemical parameters of the soil. Notably, there were no significant variations in the soil pH across all samples. The soil organic carbon (OC) content increased with higher PBAT concentrations, with the most substantial increase (193.29%) observed at a 5% PBAT addition. However, the dissolved organic carbon (DOC) remained consistent across different PBAT concentrations. PBAT exhibited no significant effects on the soil TN and TK. The TP content only decreased with a 1% PBAT dosage. Additionally, the soil AP and AK contents were reduced with the addition of PBAT, with the lowest values noted at 1% PBAT. The addition of PBAT significantly decreased the ammonium nitrogen content. Low and medium dosages of PBAT reduced the nitrate nitrogen levels, while a high dosage of PBAT did not exhibit a significant effect on the nitrate nitrogen.

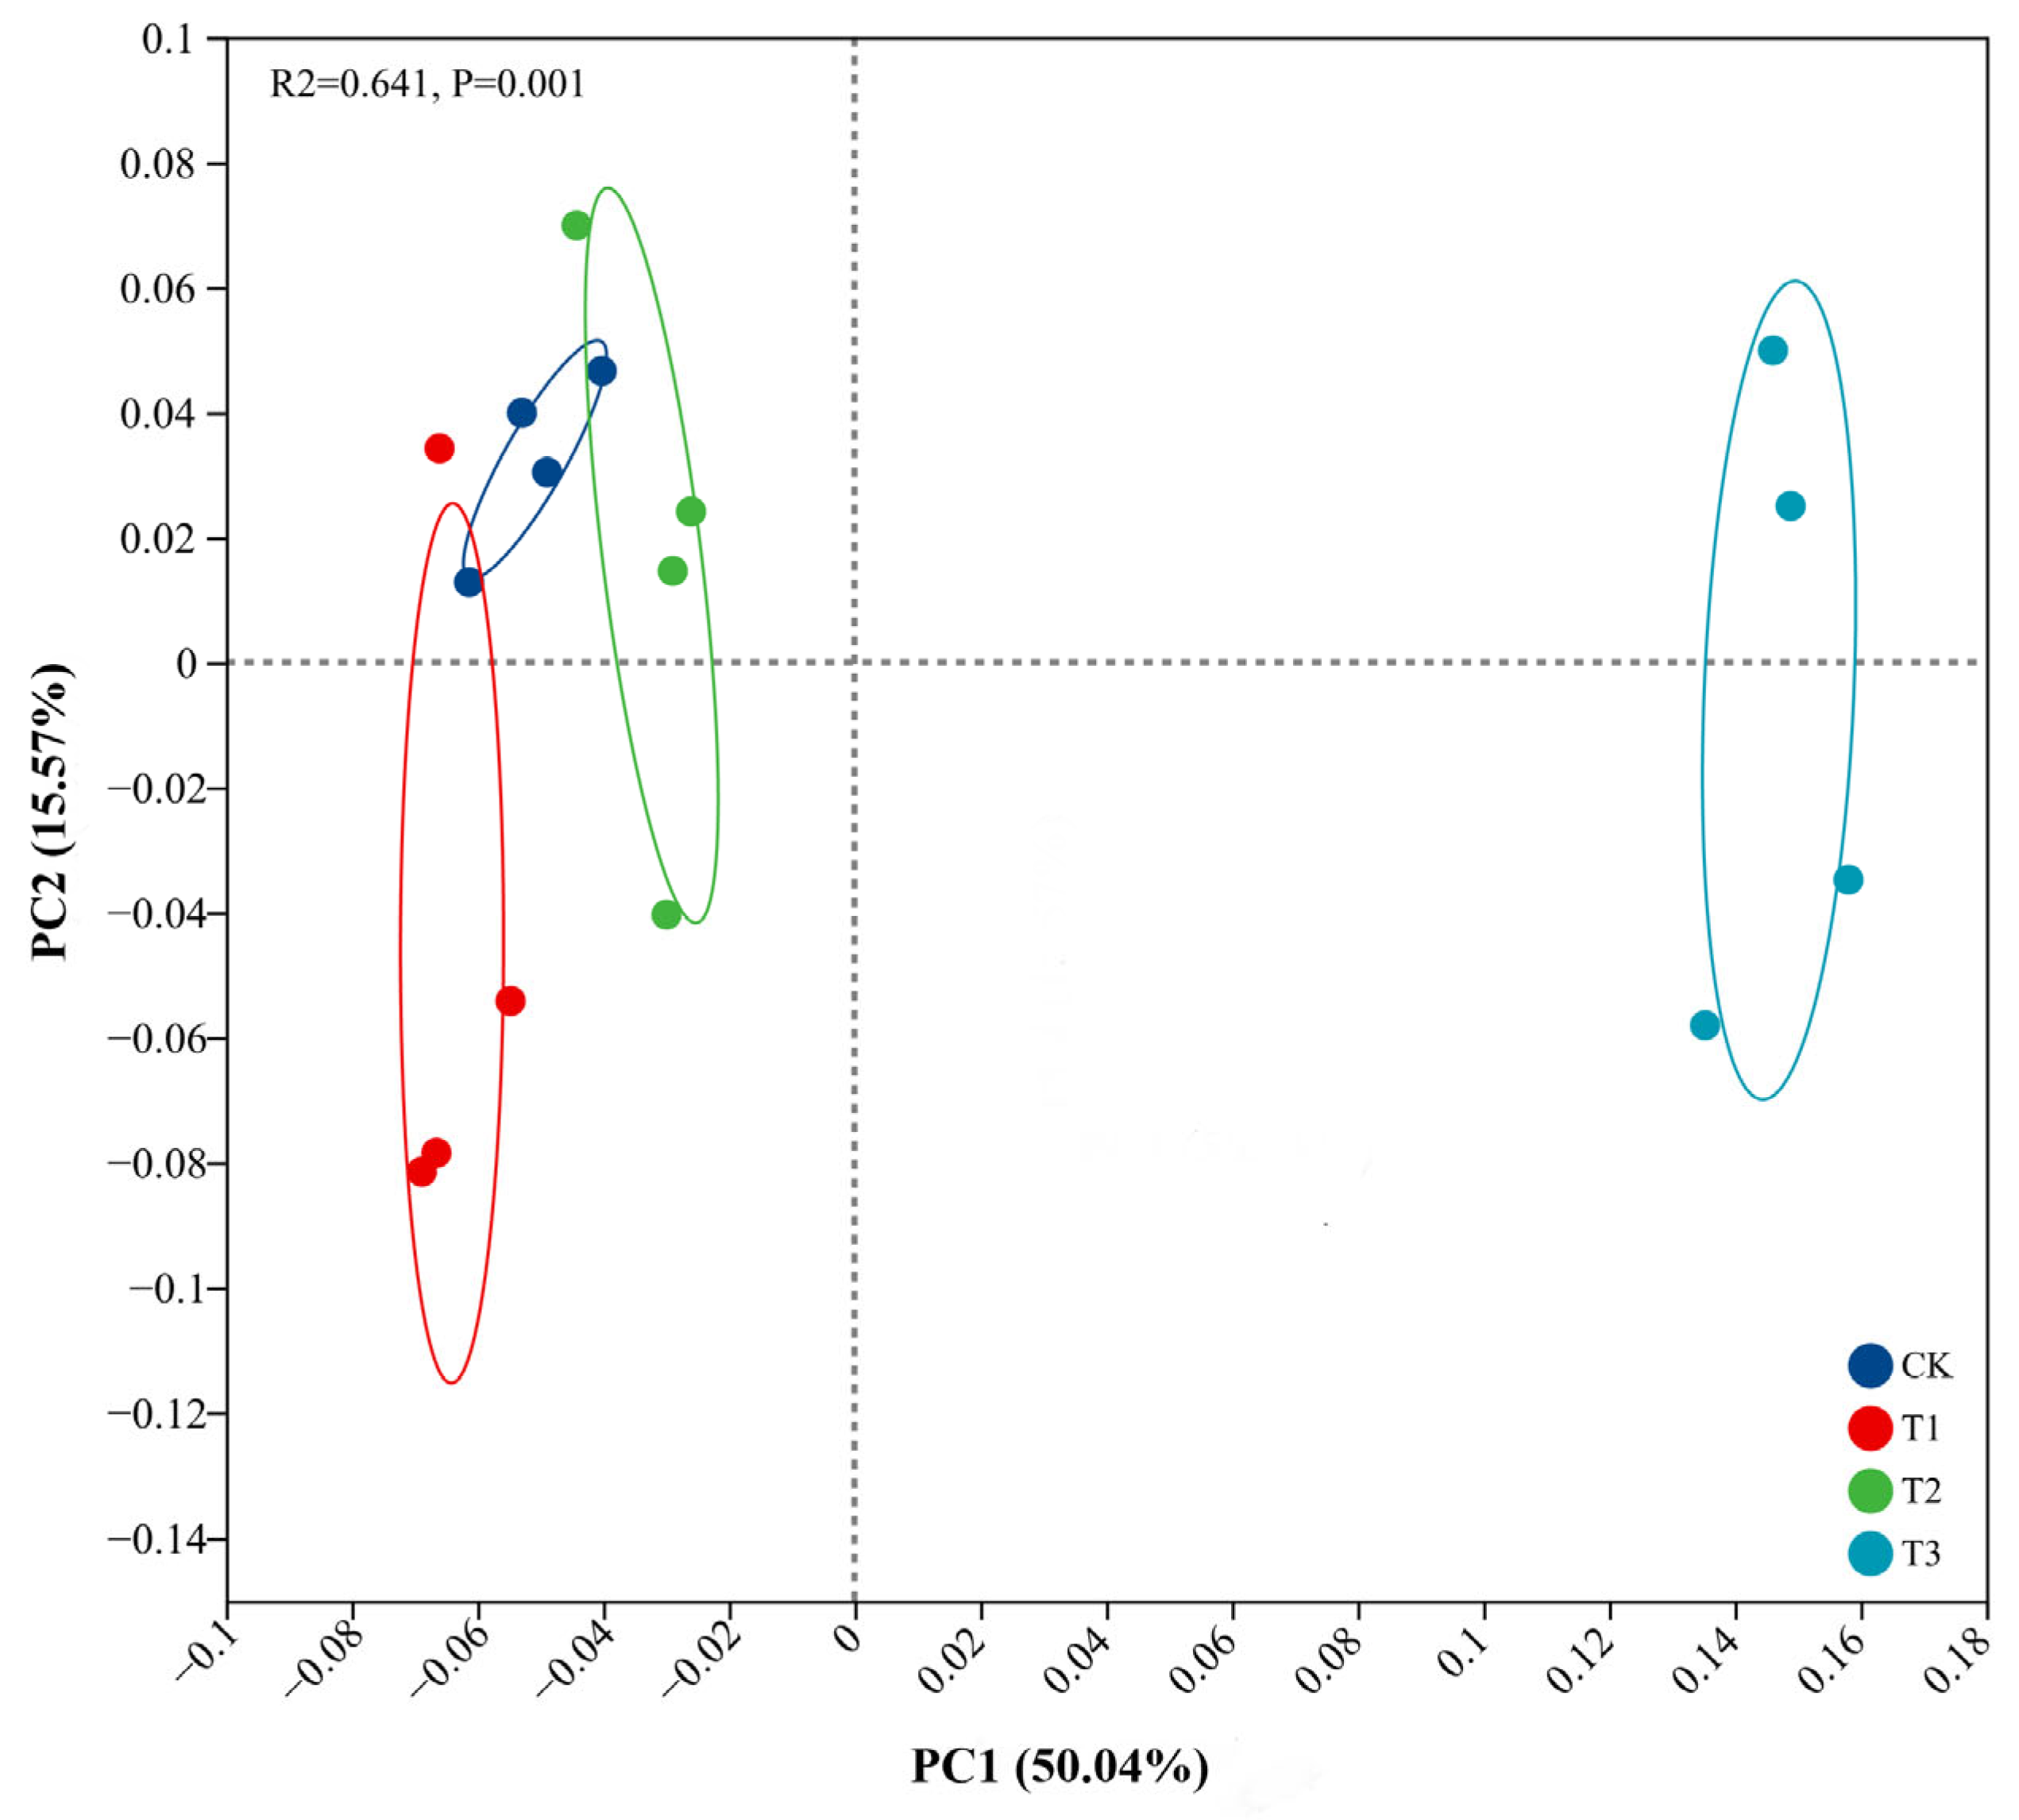
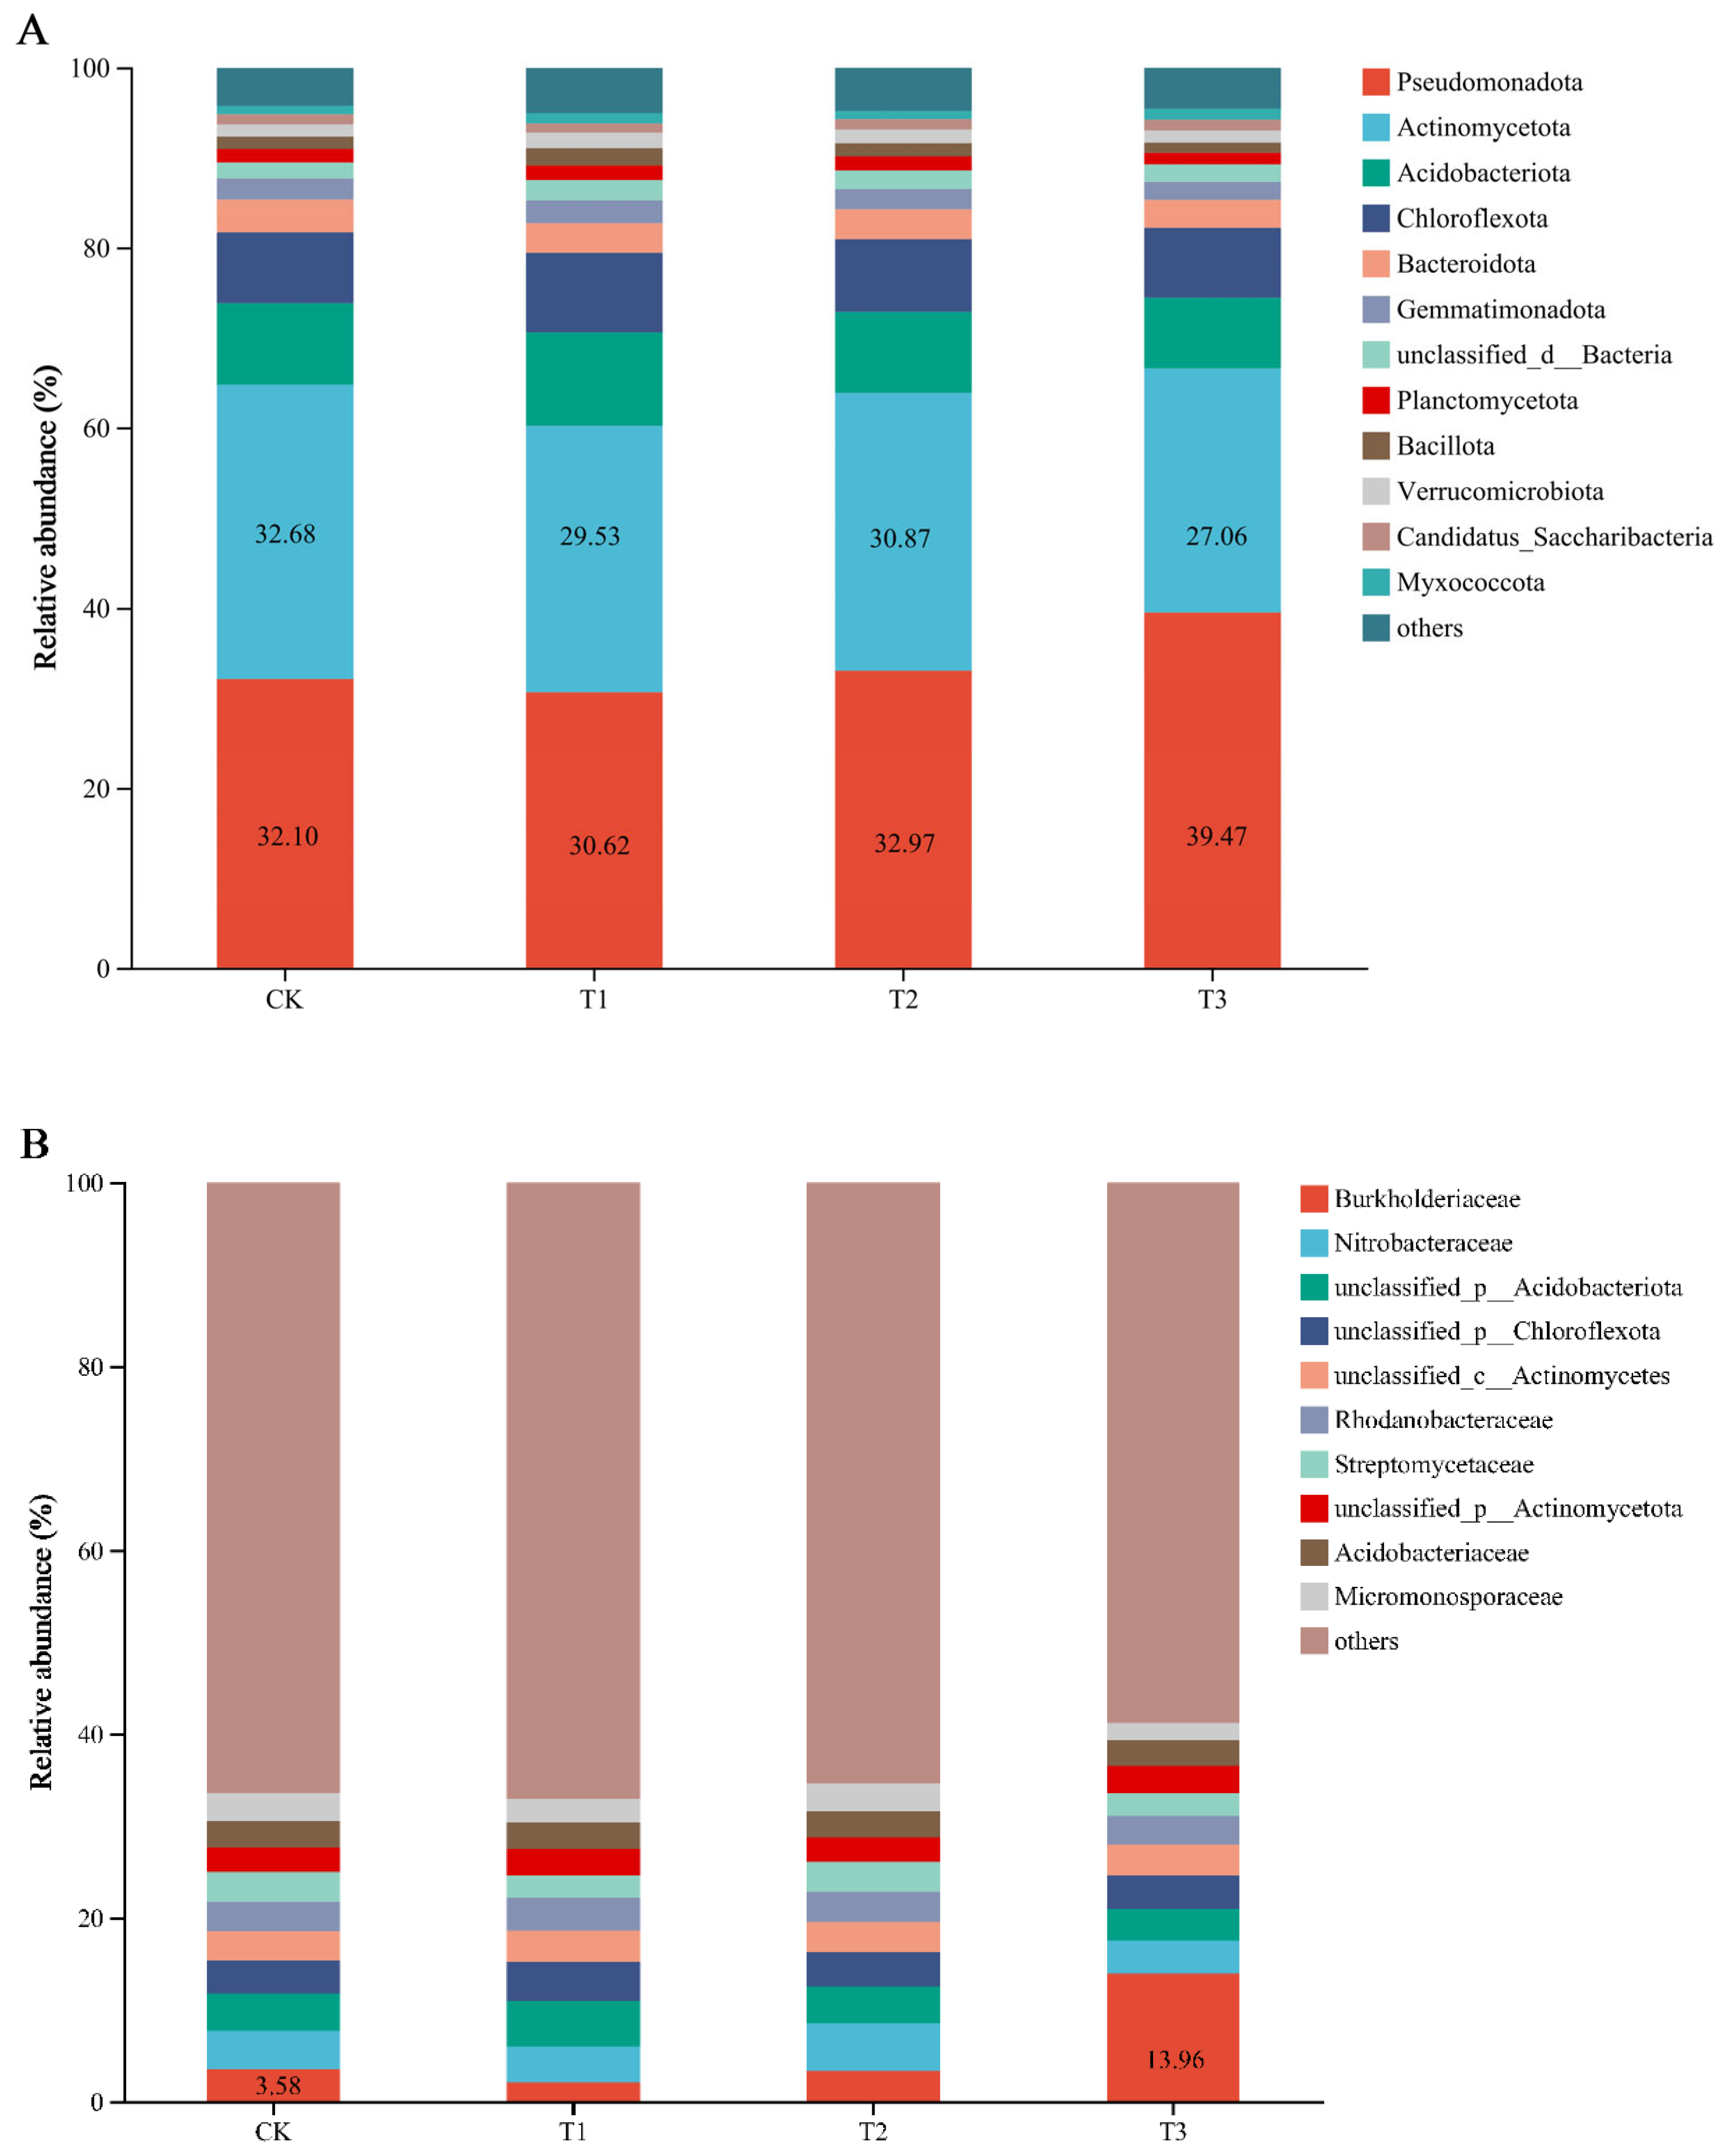
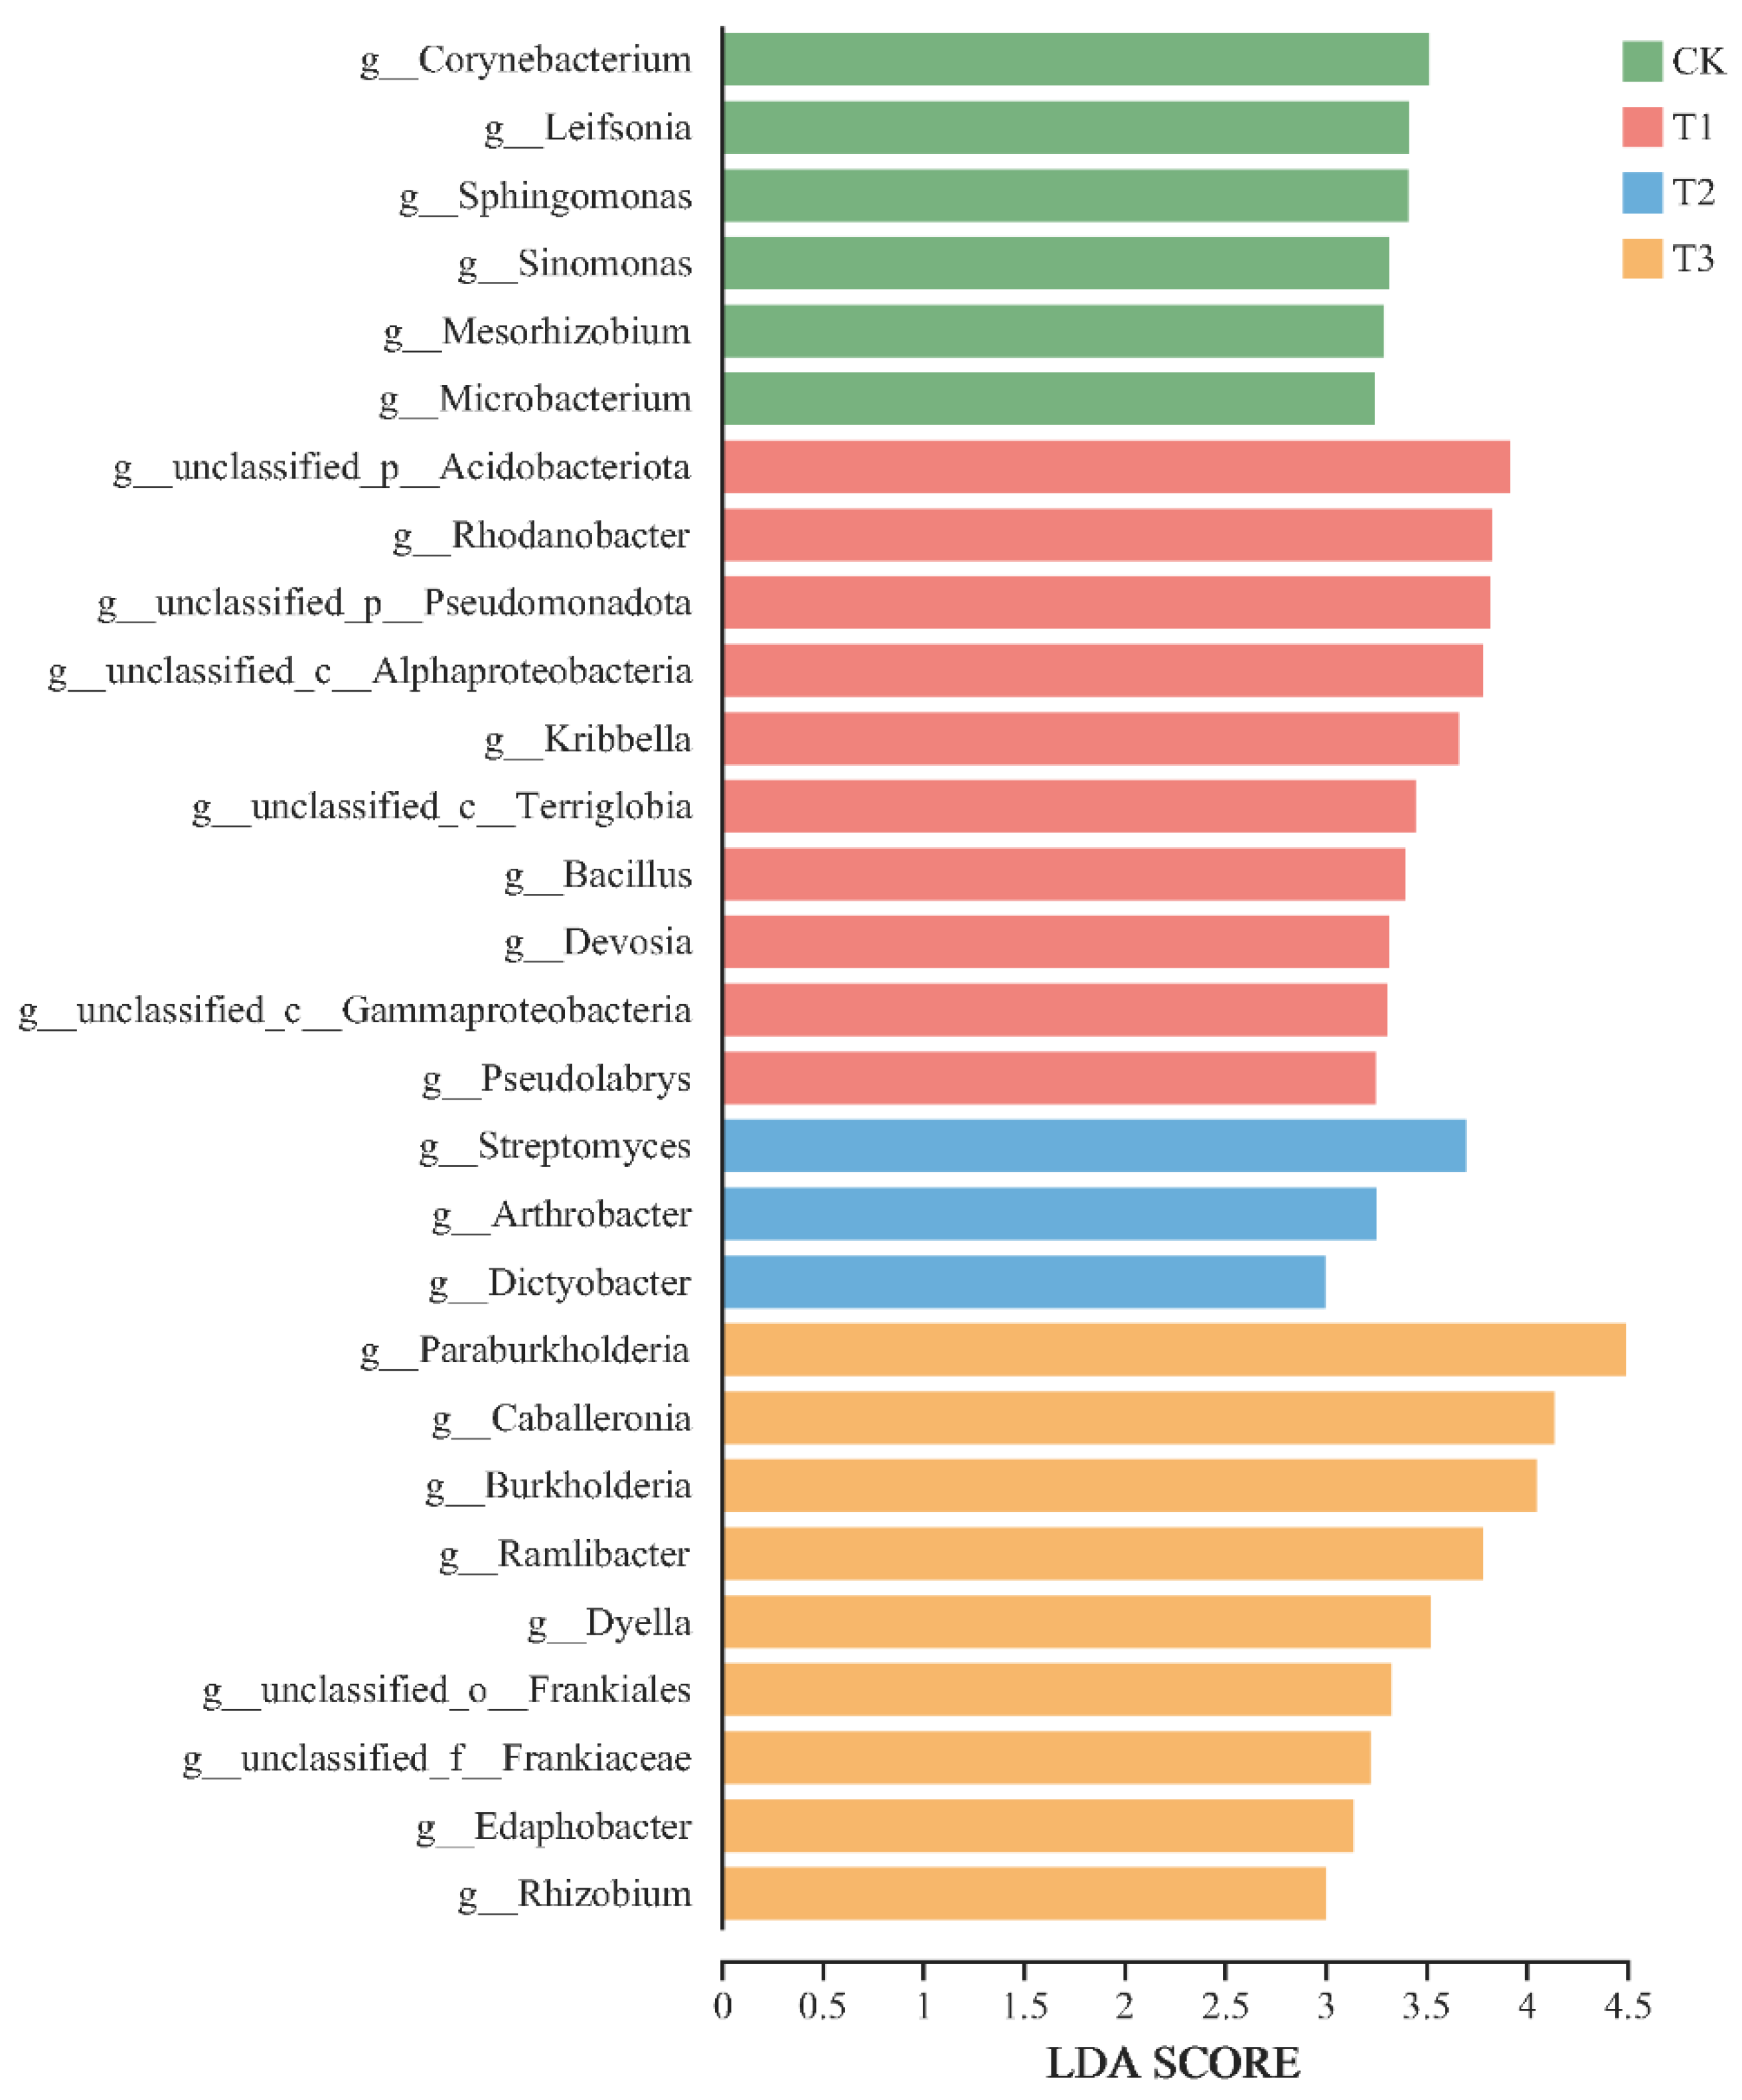
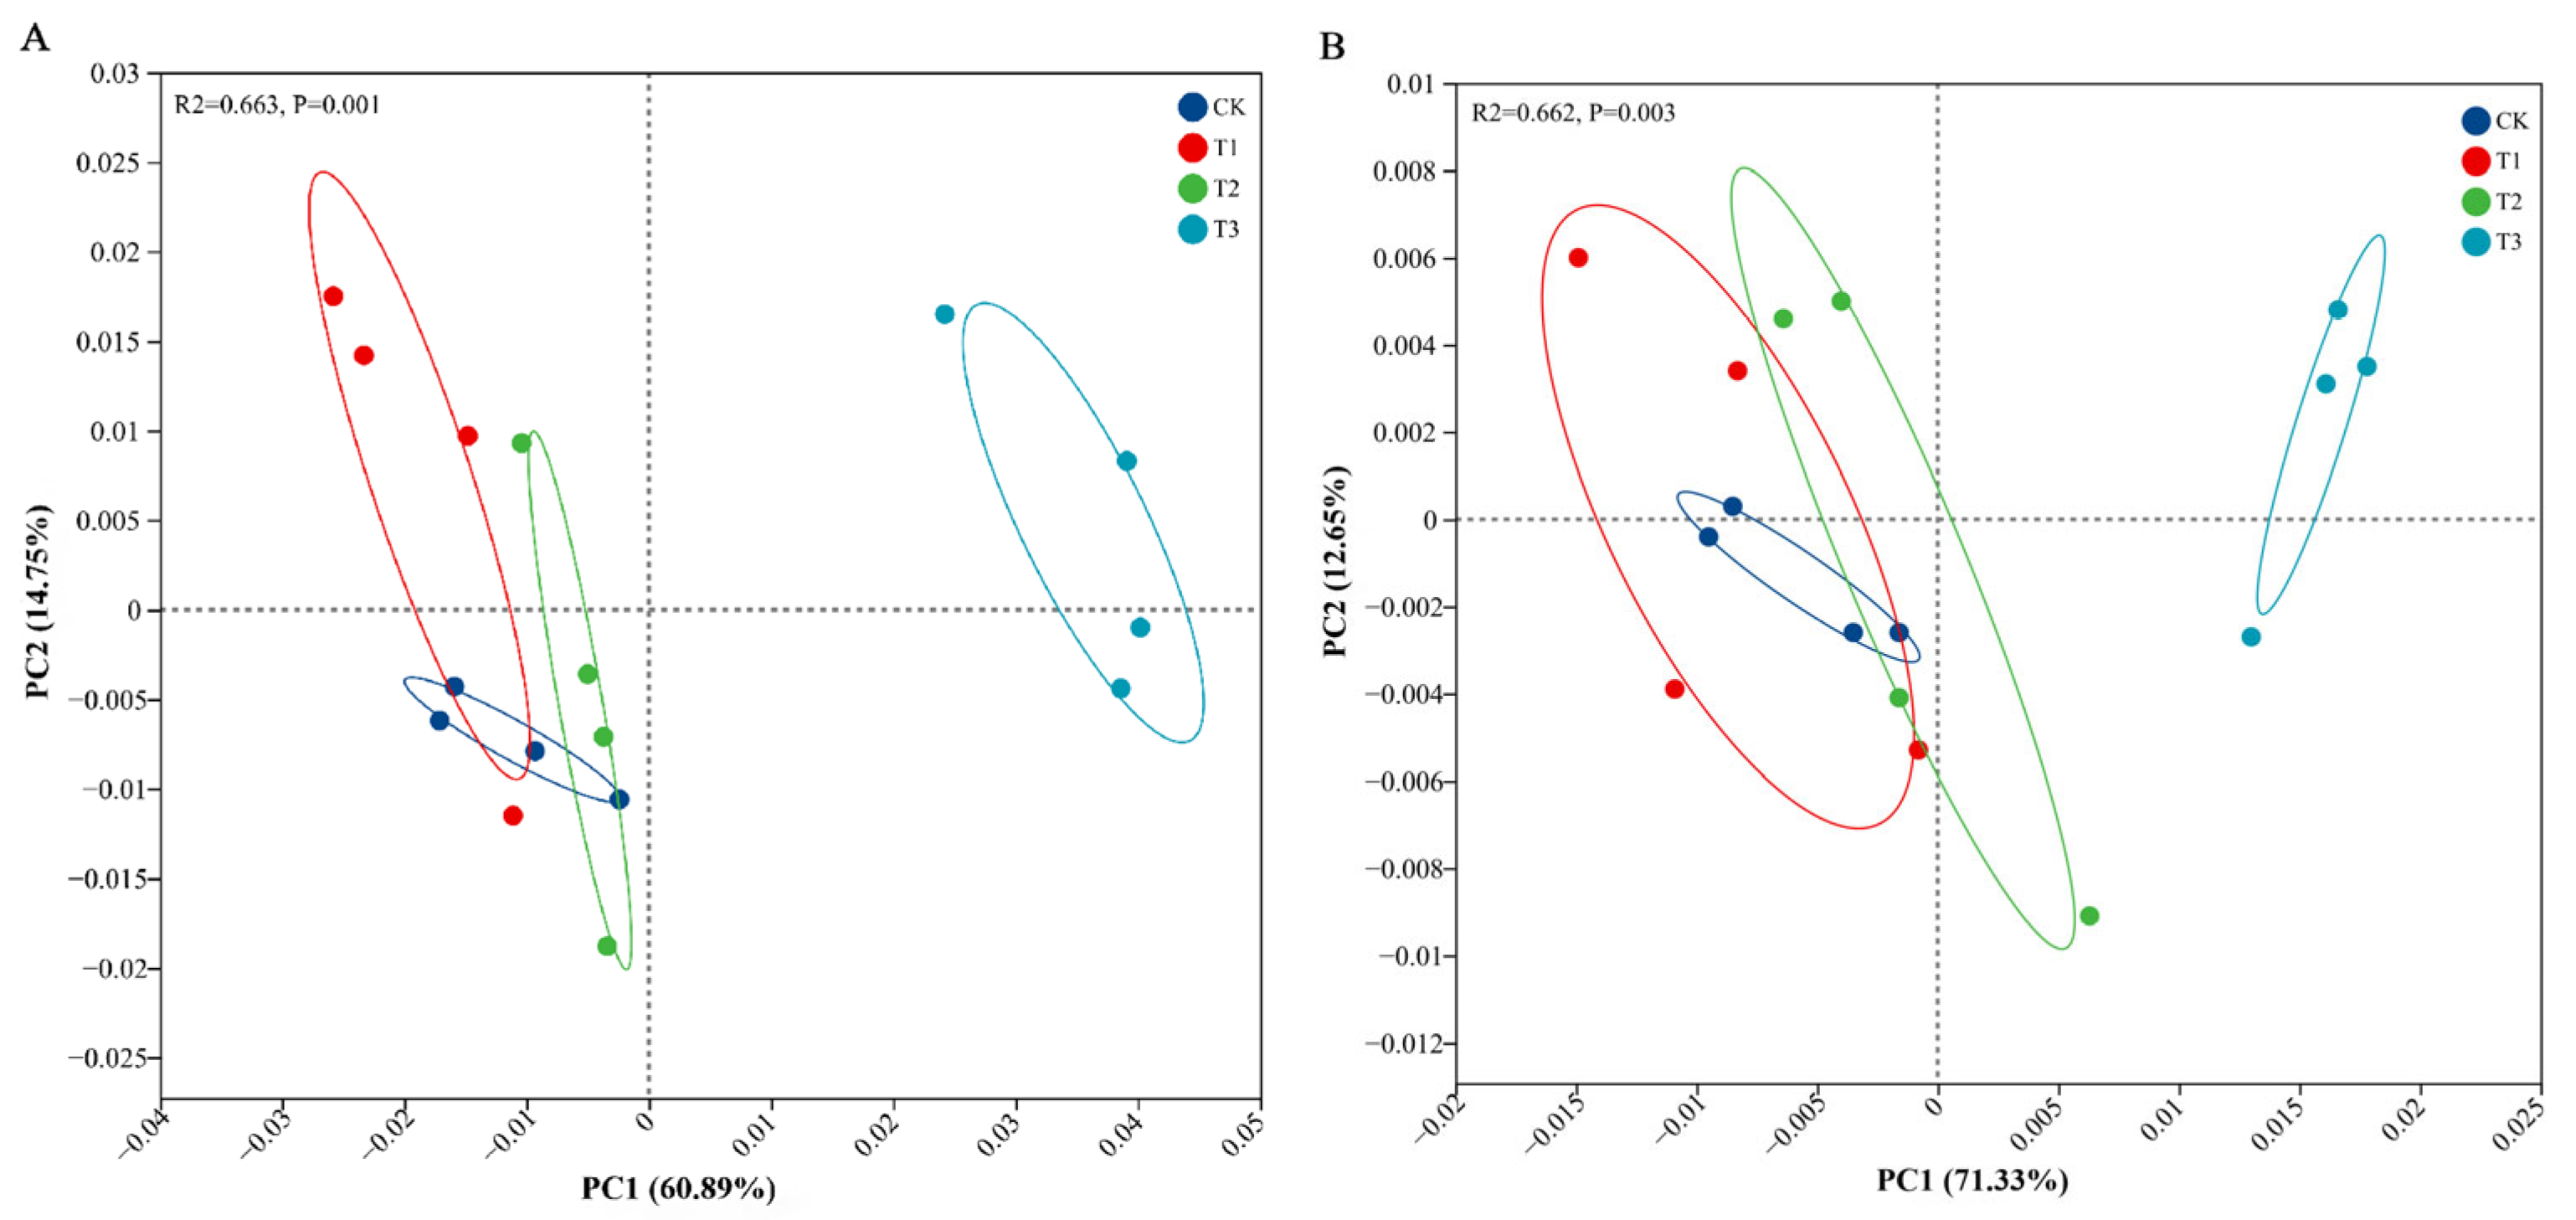
3.3. Soil Microbial Compositions and Diversity Under PBAT Addition

Metagenomic sequencing was performed to analyze the changes in the soil microbial community following the addition of varying concentrations of PBAT. A total of 1,356,137,270 reads were obtained from the 16 soil samples, yielding an average of 84,758,579 reads per sample. The microbial α-diversity indices, including the ACE index, Shannon index, and Pielou_e index, were estimated to evaluate the soil microbial richness, diversity, and evenness. As shown in Figure S1, no significant differences in the microbial richness were observed between PBAT amendments and the CK. However, the addition of 5% PBAT MPs significantly decreased both the diversity and evenness of the microbial community. Changes in the β-diversity of the microbial community structure were examined using PCoA (Figure 2). The results revealed that the microbial community response in the T3 treatment was the most pronounced, significantly (p = 0.001) diverging from the CK and other PBAT groups along the first principal coordinate (50.04%), while treatments T1, T2, and the CK clustered together.
To further estimate the shifts in the microbial community structure due to the PBAT concentration, the microbial relative abundances at different taxonomic levels were analyzed. Based on the NR database, the majority of sequence reads were assigned to bacteria (98.648%), with the remainder classified as eukaryotes (0.879%), archaea (0.158%), viruses (0.298%), and unclassified organisms (0.017%). The dominant phyla included Pseudomonadota, Actinomycetota, Acidobacteriota, Chloroflexota, Bacteroidota, and Gemmatimonadota (Figure 3A). Soils amended with 5% PBAT exhibited a significant enrichment of Pseudomonadota and a decrease in Actinomycetota compared to the CK. At the family level, Burkholderiaceae was the most dominant family in the 5% PBAT group, significantly surpassing other treatments (Figure 3B).
To investigate the impacts of varying PBAT dosages on soil microorganisms, the significantly enriched and depleted microbial populations were analyzed. A total of 514, 610 and 1055 differentiated genera were observed in the T1, T2, and T3 treatments, respectively, when compared to the CK (Figure S2). These results indicated that increasing amounts of PBAT corresponded to a rise in the number of differentiated microbial taxa. To identify the microbial genera contributing to the distinctions among the various treatments, a linear discriminant analysis effect size (LEfSe) with an LDA threshold (log 10) of 3.0 was employed. In total, 29 genera were identified as biomarkers across all treatments. For instance, the biomarkers in the CK treatment primarily included Corynebacterium, Leifsonia, Sphingomonas, Sinomonas, Mesorhizobium, and Microbacterium; the T1 treatment displayed biomarkers such as Rhodanobacter, Kribbella, Bacillus, Devosia, and Pseudolabrys; the T2 treatment was characterized by Streptomyces, Arthrobacter, and Dictyobacter; and the T3 treatment featured biomarkers like Paraburkholderia, Caballeronia, Burkholderia, Ramlibacter, Dyella, Edaphobacter, and Rhizobium (Figure 4). These findings demonstrated that soils amended with different PBAT levels could recruit distinct microbial communities.

3.4. Response of Soil Microbial Function to PBAT

Changes in the microbial community may lead to alterations in the metabolic functions of the soil microbiome. The assembled metagenomes were annotated with predicted functions based on alignment with the COG and KEGG databases. A PCoA of the COG functions and KEGG pathways indicated that the T3 treatment exhibited the most significant differences compared to the CK (Figure 5A,B), which was consistent with the microbial community composition results. Samples from the CK, T1, and T2 treatments generally clustered closely together. These findings indicated that the shifts in the community function induced by PBAT were most pronounced with 5% PBAT MPs.
The 30 most abundant microbial community functions across all soil samples were similar, including metabolic pathways, the biosynthesis of secondary metabolites, microbial metabolism in diverse environments, two-component systems, the biosynthesis of cofactors, carbon metabolism, the biosynthesis of amino acids, ABC transporters, quorum sensing, pyruvate metabolism, etc. (Figure S3). Soils exposed to higher concentrations of PBAT were characterized by significant increases in certain pathways, including two-component systems, ABC transporters, quorum sensing, glyoxylate and dicarboxylate metabolism, and fatty acid metabolism. Conversely, there was a notable decrease in metabolic pathways, the biosynthesis of secondary metabolites, the biosynthesis of cofactors, carbon metabolism, the biosynthesis of amino acids, glycolysis/gluconeogenesis, and amino sugar and nucleotide sugar metabolism (Figure 6).

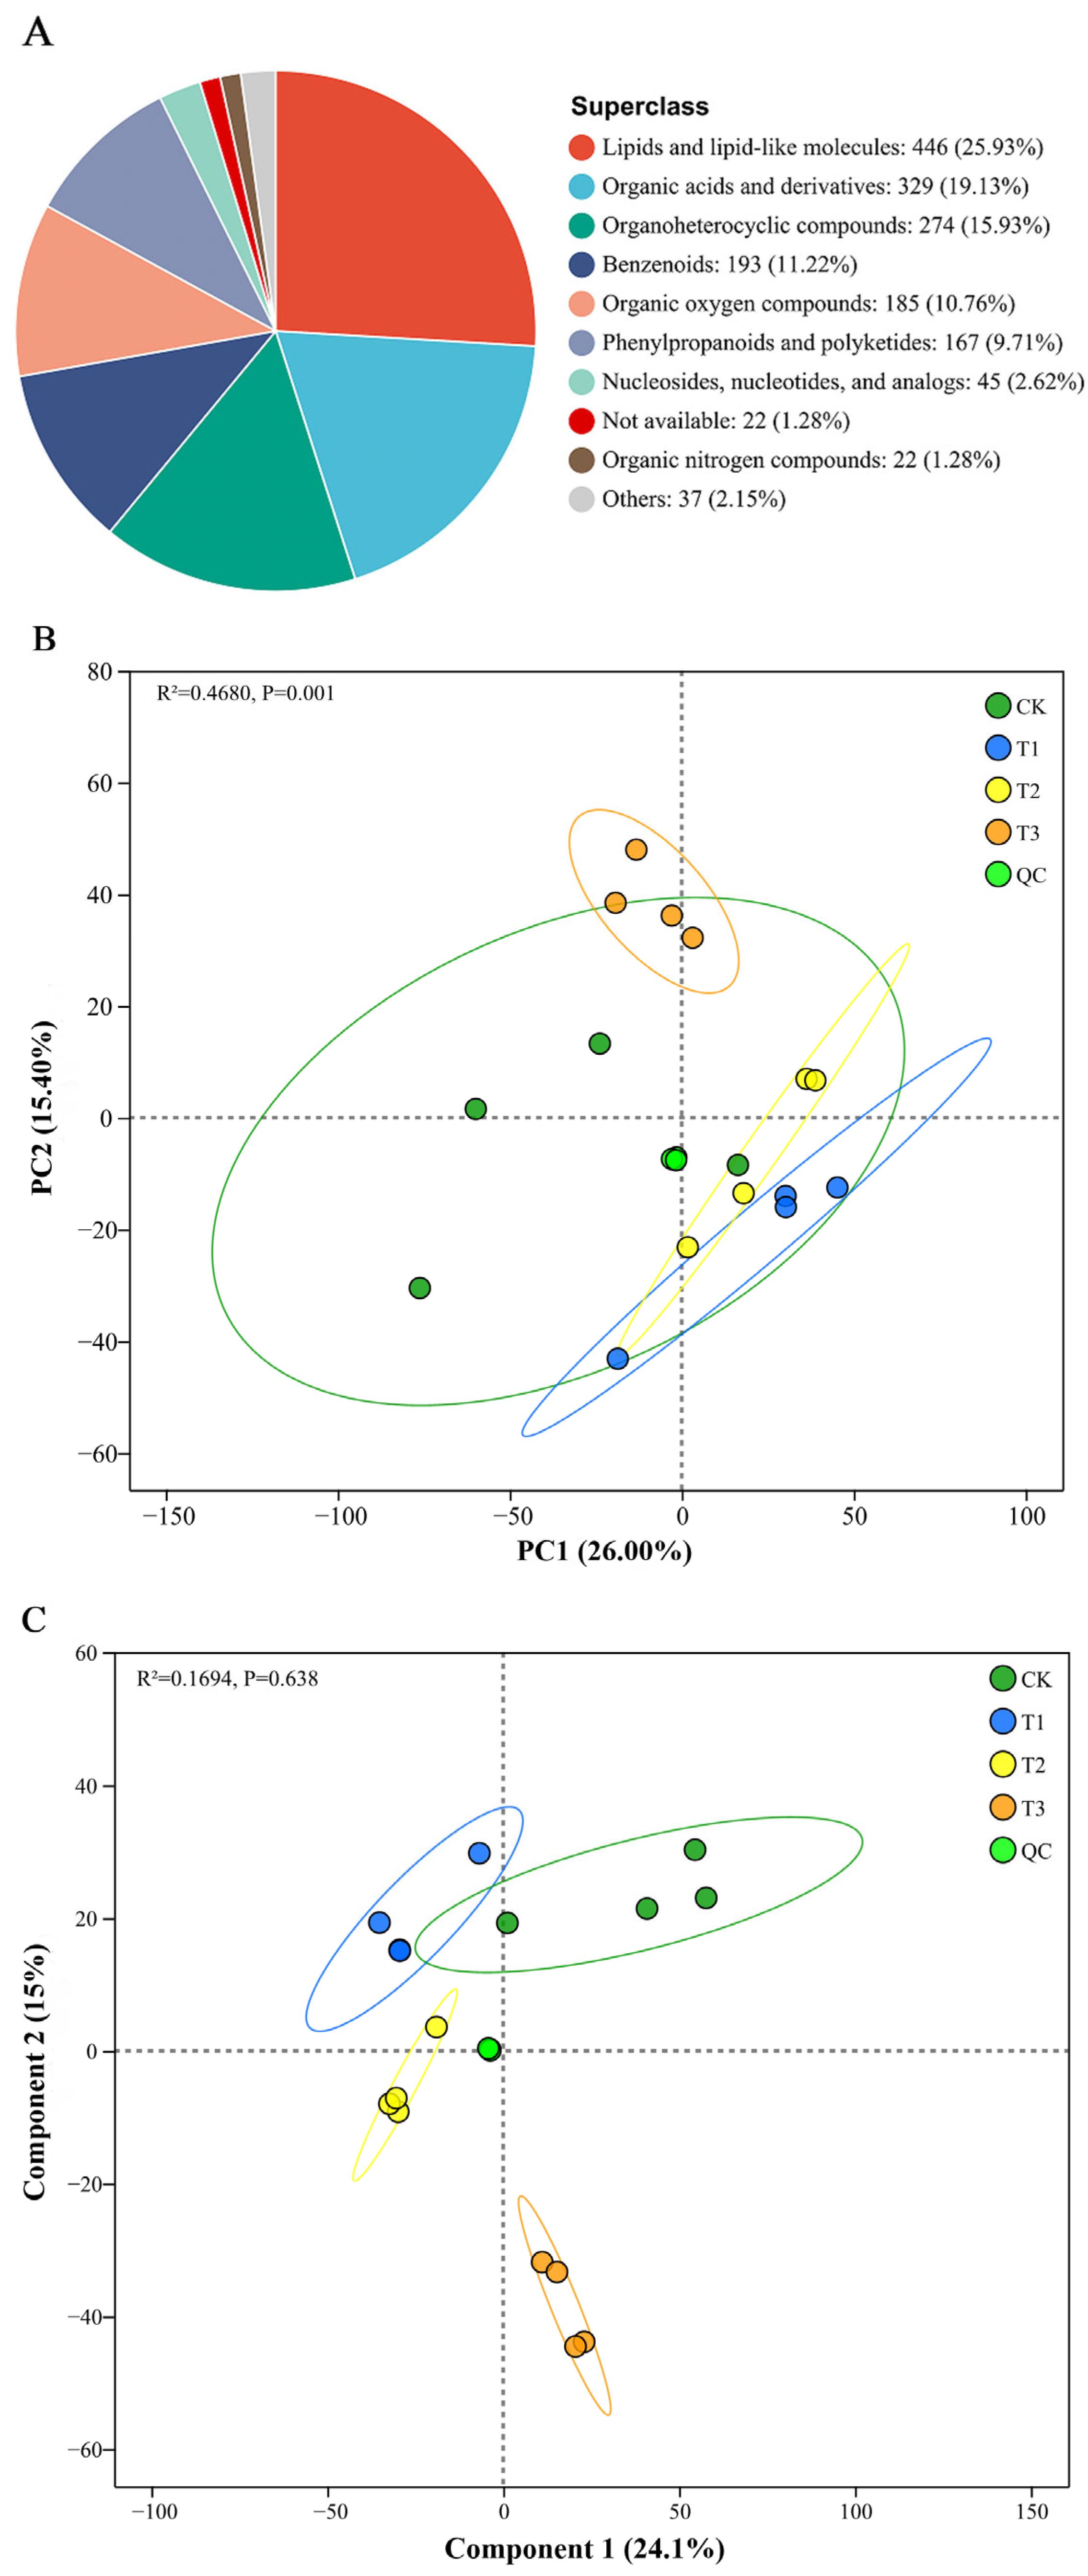
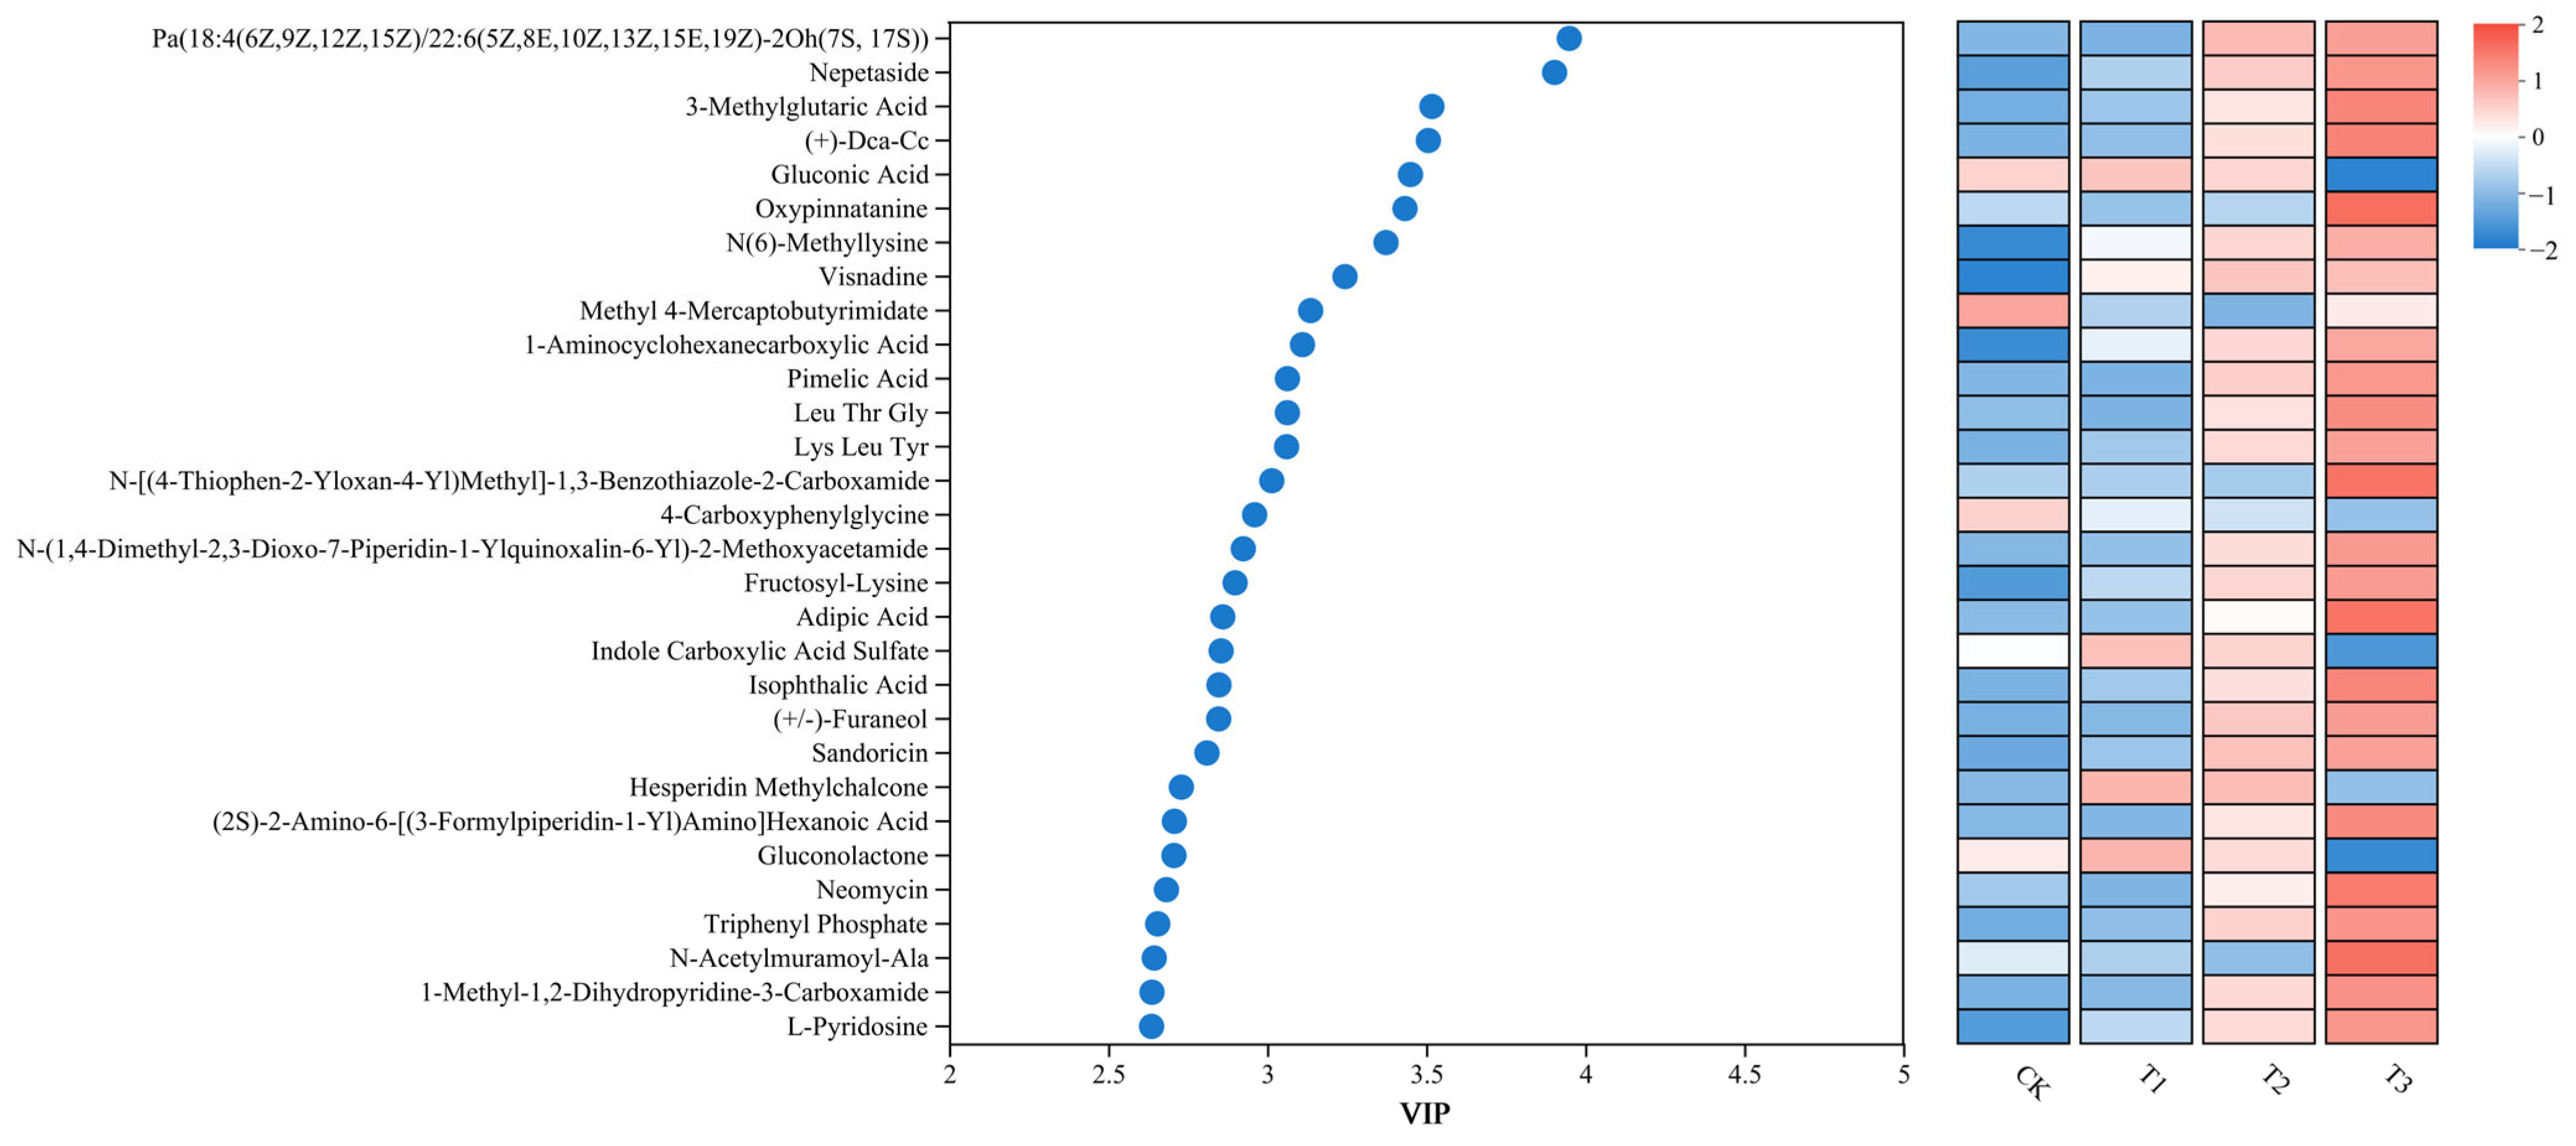
3.5. PBAT Dosages Altered Soil Metabolome Characteristics

The untargeted metabolomic profiles of all soil samples were analyzed to confirm the variations in metabolism under different dosages of PBAT exposure. A total of 2416 metabolites were identified, predominantly lipids and lipid-like molecules (25.93%), organic acids and derivatives (19.13%), organoheterocyclic compounds (15.93%), benzenoids (11.22%), organic oxygen compounds (10.76%), phenylpropanoids and polyketides (9.71%), nucleosides, nucleotides, and analogs (2.62%), and organic nitrogen compounds (1.28%) (Figure 7A). To assess the reproducibility of the dataset, quality control (QC) samples were analyzed throughout the experiment. PCA plots showed that QC samples were clustered closely together and were separated from the treated samples, suggesting the stability and reproducibility of the LC-MS/MS analysis (Figure 7B). The samples from the CK, T1, and T2 were closely clustered, while the T3 treatment was distinctly separated from them. To maximize the differences between treatments, supervised PLS-DA models were further applied to the metabolic data. As shown in Figure 7C, distinct separations of T2 and T3 from the CK were observed; however, the close clustering of CK and T1 suggested that the T1 treatment may not have significantly altered the soil metabolite profiles compared to the CK.
To further elucidate the effects of varying PBAT dosages on soil metabolites, a volcano plot was employed to identify differential metabolites between PBAT treatments and the CK. In comparison with the CK, the T1, T2, and T3 treatments exhibited 149, 169, and 126 up-regulated metabolites (indicated by red dots) and 158, 250, and 135 down-regulated metabolites (indicated by blue dots), respectively (Figure S4). Ultimately, 30 metabolites with significant differences across all treatments were identified using the variable importance in the projection (VIP) method, with a score threshold of >2.0. The levels of peptides (Leu Thr Gly and Lys Leu Tyr), organic acids (3-methylglutaric acid, adipic acid, pimelic acid, isophthalic acid), amino acid derivatives (oxypinnatanine), and antibiotics (neomycin) were found to be elevated in the T3 group (Figure 8). To investigate the potential impact of the changes in differential metabolites on soil microbial functions, KEGG enrichment pathway analysis was conducted focusing on the top 20 most enriched factors. Significantly differential enrichment pathways were observed in the PBAT groups compared to the CK. The PBAT groups exhibited 15, 19, and 19 differentially enriched pathways in the T1, T2, and T3 treatments, respectively (Figure S5). For instance, compared to the CK, pathways related to limonene degradation, terpenoid backbone biosynthesis, progesterone, androgen and estrogen receptor agonists/antagonists, vitamin digestion and absorption, ABC transporters, etc., were significantly enriched in the T1 group. The T2 treatment showed significant enrichment in glucocorticoid and mineralocorticoid receptor agonists/antagonists, diterpenoid biosynthesis, carotenoid biosynthesis, and arginine and proline metabolism, etc. In the T3 treatment, pathways related to flavonoid biosynthesis, styrene degradation, and nicotinate and nicotinamide metabolism, etc were significantly enriched. These pathways are primarily involved in fundamental metabolism, environmental information processing, and organic system processes. On the other hand, a 0.1% PBAT treatment interfered with cell membrane transport, lipid metabolism, and xenobiotic biodegradation and metabolism. However, the 1% and 5% PBAT groups interfered with carbohydrate metabolism, amino acid metabolism, the biosynthesis of other secondary metabolites, and xenobiotic biodegradation and metabolism.

3.6. Relationships Among Soil Properties, Microbial Communities, and Metabolites

To explore the interrelationship among plant growth, soil physicochemical properties, microbial communities, and soil metabolites, PLS-PM analysis was employed to elucidate the direct and indirect effects of PBAT dosages on both plants and the soil (Figure 9). The selected variables accounted for 66.1% and 88.3% of the variations in plant growth and soil metabolites, respectively. PBAT MPs exhibited a direct positive effect on soil properties (coefficient = 0.710, p < 0.01), the soil microbial community (coefficient = 0.879, p < 0.01), and soil metabolites (coefficient = 0.476, p < 0.01). Conversely, soil properties were directly and positively associated with soil metabolites (coefficient = 0.504, p < 0.01). These results demonstrated that the PBAT dosages exerted direct and indirect impacts on soil metabolites; however, PBAT MPs had limited effects on plant growth.

4. Discussion

In this study, metagenomic sequencing and non-targeted metabolomics profiling were employed to assess the impact of biodegradable PBAT microplastic dosages on the soil microbiome and metabolic functions; meanwhile, the growth of L. sativa under PBAT addition was also determined. Previous studies have demonstrated that PBAT MPs negatively affect plant growth [32,33]. The direct toxicity of PBAT may arise from the production of smaller particles during its degradation, as these smaller MPs are expected to be absorbed by the roots, inhibiting plant growth [34]. At higher dosages, the adverse effects of PBAT are likely to be more pronounced. Additionally, the toxicity of PBAT degradation products could lead to a reduction in the leaf dry weight. However, in our study, none of the PBAT microplastic dosages had a significant effect on the plant shoot height (Figure 1A), which was in line with the findings reported by Zantis et al. [35]. In comparison with the CK, the T1 and T2 treatments increased the leaf dry weights, while the T3 treatment decreased the leaf dry weight without significant variations (Figure 1B), suggesting that varying dosages of PBAT had minimal effects on plant growth. Possible explanations for this observation include differences in plant tolerance, dosage discrepancies, and other factors. Therefore, further experiments are necessary to validate these findings. The chlorophyll content consistently and significantly decreased in the 0.1% and 1% PBAT treatments, a trend also observed in other studies [36,37]. This decrease may be attributed to the damage caused by lipid peroxidation in chloroplasts [38]. MPs with smaller sizes can be absorbed into the root system and accumulate in plant tissues, impeding intercellular nutrient transport and potentially reducing photosynthesis rates and the chlorophyll content. Interestingly, the 5% PBAT treatment did not decrease the chlorophyll content, and the underlying mechanism warrants further investigation. Stress indicators such as MDA, proline, soluble protein, and soluble sugar were up-regulated in one or two PBAT treatments (Figure 1D–G). The MDA content was studied as a biomarker of lipid peroxidation [39], which was stimulated only in the 1% PBAT treatment in this study. With the promotion of biodegradable plastics in China, the application of PBAT is gradually increasing. Its effect on the quality of agricultural products warrants significant attention. Consequently, the vitamin C content of the leaves was also assessed. Our results demonstrated that PBAT MPs had a positive impact on vitamin C levels.
The present study demonstrated that all the dosages of PBAT did not significantly affect the soil pH. The changes in the soil pH under BP stress lack unified conclusions. Han et al. [40] reported that all PBAT dosages could increase the soil pH. Medium and high concentrations of PBAT significantly promoted the accumulation of SOC compared to low-dose PBAT, which aligns with the findings of Han et al. [40]. Additionally, Chen et al. [41] indicated that the presence of BMPs in the soil can enrich soil organic matter. This suggests that the input of PBAT MPs may be converted into SOC by soil microorganisms, depending on the amount of MPs introduced. Furthermore, our study revealed that PBAT MPs influenced the soil’s available nutrients. The AN content in the T1 treatment was significantly higher than that in the CK, while the AP and AK contents were both decreased due to exposure to PBAT MPs. Aanderud et al. [42] also demonstrated that higher levels of bioplastics reduced the AP content compared to the control.
High-dose PBAT MPs exhibited a more pronounced effect on the soil microbial community compared to low- and medium-dose treatments. The influence of biodegradable MPs on the soil microbial diversity remains inconclusive, largely due to the varying types and concentrations of the materials tested. Starch-based bioplastics significantly enhanced bacterial diversity when compared to the control group [43]. Chen et al. [41] reported that 2% (w/w) PLA MPs had no measurable effects on the soil bacterial diversity. Conversely, Liu et al. [44] found that the addition of 2% PBAT fragments significantly reduced the Shannon index compared to both the control and conventional PE plastics. In our study, a 5% concentration of PBAT resulted in the lowest soil microbial diversity and evenness (Figure S1), suggesting that soil may selectively recruit certain microbiomes to mitigate the stress imposed by high PBAT levels, thereby disrupting the overall microbial community structure. Previous research confirmed that PBAT could be decomposed by microbiomes, leading to the enrichment of certain microbial taxa and significant shifts in the microbial community [45]. The concentration of MPs has been demonstrated to be a critical factor in regulating the microbial community structure [46], a finding that is also supported by our research. High-dose PBAT MPs significantly enriched the phylum Pseudomonadota and the family Burkholderiaceae (Figure 3). Members of the Burkholderiaceae family have the potential to promote plant growth and development [47]. As illustrated in Figure 4, the CK and PBAT groups exhibited distinct biomarkers. Notably, Paraburkholderia, Cavalleronia, Burkholderia, and Rhizobium were significantly enriched in the 5% PBAT treatment. Certain species of Paraburkholderia have demonstrated the potential for nodulation and nitrogen fixation [48]. Species of Burkholderia are recognized for their role in promoting plant growth through the synthesis of phytohormones [49], phosphate solubilization [50], nitrogen fixation [51], and other mechanisms. Furthermore, Burkholderia spp. have shown considerable efficacy in protecting host plants under abiotic stress [52]. Given that PBAT is composed solely of C, H, and O, its addition may induce nitrogen deficiency and stimulate the growth of nitrogen-fixing bacteria [53], a phenomenon that was particularly evident in the 5% PBAT group. Rhizobia can convert atmospheric nitrogen into a form readily utilized by plants [54]. This process can replace nitrogen fertilizer and promote the ecologically sustainable development of agricultural ecosystems [55]. The Streptomyces genus was identified as a significant biomarker in the 1% PBAT treatment. Streptomyces play a crucial role in promoting plant growth, protecting crops, degrading organic residues, and producing secondary metabolites in agriculture [56]. In the 0.1% PBAT treatment, 11 biomarkers were identified, including Bacillus. Bacillus can secrete hormones and volatile organic compounds (VOCs), contributing to enhanced plant growth, root development, and improved nutrient uptake. Additionally, the resistance of plants to biotic stresses can be enhanced by Bacillus strains, as they can produce cyclic lipopeptides, polyketides, and VOCs that resist pathogens and/or induce systemic resistance in plants [57]. These findings suggested that soils could recruit beneficial microbiomes with biocontrol capabilities and growth-promoting properties, aiding crops in resisting high microplastic stress.
The influx of PBAT not only alters the microbial community composition but also affects the soil microbial function. As anticipated, microbial functions were more sensitive to 5% PBAT compared to other PBAT groups (Figure 5). The relative abundance of ABC transporters was significantly higher in the 5% PBAT group, indicating that the microbial communities in this treatment preferred to utilize external energy and carbon sources [58]. The significantly higher organic carbon (OC) content in the 5% PBAT group compared to the 0.1% PBAT and 1% PBAT groups further corroborates the notion that a greater amount of PBAT may be utilized by soil microbiomes. Concurrently, carbon metabolism was markedly suppressed by high-dosage PBAT exposure (Figure 6), likely due to the increased presence of degradation products in the 5% PBAT group, which can serve as carbon sources for soil microorganisms; this presence may lead to the catabolite repression of carbon sources [59]. Our results demonstrated that significant changes in soil microbiomes were only observed under the 5% PBAT treatment. In our study, a 5% PBAT concentration was established as the maximum limit, and the actual concentration of PBAT MPs in the soil is expected to be less than 5%. Therefore, we speculate that PBAT MPs pose minimal long-term threats to soil health and crop productivity.
Soil metabolite profiles serve as a reflection of soil functions. Soil microbes and plants regulate their metabolic processes in response to external stressors. However, the effects of biodegradable MPs on soil metabolism remain unclear. The addition of C substrates to the soil, particularly at high concentrations, alters the soil stoichiometry [60]. Our results indicated that the metabolite profiles of the T3 group diverged significantly from those of the CK and other PBAT treatments (Figure 7C), paralleling changes in the soil microbial community structures. This suggested that alterations in soil metabolite profiles were mediated by soil microbial communities in response to PBAT amendments, indicating that modifying specific metabolic pathways is a primary strategy for these communities to adapt to environmental stress. Liu et al. [44] found that both 0.5% and 2% PBAT treatments resulted in significant variations in soil metabolites compared to those of the CK and LDPE residues. The T3 treatment enriched certain metabolites, including nepetaside, peptides, and organic acids etc. (Figure 8). PBAT is synthesized from butylene glycol, adipic acid, and terephthalic acid (TPA) [61]. The concentration of adipic acid significantly increased in the 5% PBAT treatment. Although TPA constitutes approximately 30-45% of PBAT, it was not significantly enriched in the high-dose PBAT treatment, suggesting that TPA can be mineralized by soil microorganisms [62]. Organic acids in the soil could enhance the solubilization of P, K, and Zn [63]. The application of protein peptides can improve the soil P availability and promote tobacco growth [64]. These findings indicate that the enrichment of peptides and organic acids in the soil may enhance soil fertility, thereby alleviating the stress caused by high PBAT concentrations.

5. Conclusions

This study explored the effects of biodegradable PBAT MP concentrations on the soil–plant system. The results revealed that no significantly adverse effects of PBAT MPs on plant growth were observed. However, PBAT interfered with plant stress indicators, such as proline, MDA, soluble protein, and soluble sugar, as well as soil physicochemical properties (e.g., organic carbon, available nutrients, ammonium N, and nitrate N), in a dose-dependent manner. In comparison with the control group (CK), only 5% PBAT MPs had a stronger impact on the soil microbial community, its function, and the soil metabolome. Furthermore, 5% PBAT exhibited negative effects on the soil microbial diversity and evenness. The addition of PBAT could recruit certain microbiomes in a dose-dependent manner. Soils with 5% PBAT can enrich certain beneficial microbes, such as Paraburkholderia and Rhizobium, which may help maintain plant growth under high PBAT stress. Moreover, 5% PBAT showed a high potential for the uptake of beneficial bioactive compounds, including peptides, organic acid, and antibiotics. Taken together, our findings demonstrated that in order to resist external high PBAT stress, the soil could recruit certain microbiomes and metabolites to support plant development. Based on these results, PBAT MPs might not exert adverse effects on agricultural fields. However, this study was based on pot experiments, and further research in agricultural fields is required to identify additional effects.

Supplementary Materials

The following supporting information can be downloaded at https://www.mdpi.com/article/10.3390/agronomy15040990/s1, Figure S1: Comparison of the a-diversity indices under different treatments at the genus level. T1, T2, and T3: 0.1%, 1%, and 5% PBAT, respectively. Figure S2: Volcano diagram of significantly enriched and depleted microbial genera in soils treated with different dosages of PBAT MPs. T1, T2, and T3: 0.1%, 1%, and 5% PBAT, respectively. Figure S3: Relative abundances of the 30 most abundant KEGG pathways at level 3 in different treatments. T1, T2, and T3: 0.1%, 1%, and 5% PBAT, respectively. Figure S4: Volcano plots of the identical biomarkers shared between the CK and PBAT treatments. The red, blue, and gray dots indicate up-regulated, down-regulated, and no differential metabolites, respectively. T1, T2, and T3: 0.1%, 1%, and 5% PBAT, respectively. Figure S5: KEGG enrichment metabolic pathways shared between CK and PBAT groups. T1, T2, and T3: 0.1%, 1%, and 5% PBAT, respectively. Table S1: Basic information of metagenomics sequencing data.

Author Contributions

Writing—original draft, review, and editing—data curation, and funding acquisition, Y.F.; investigation and funding acquisition, C.L.; methodology, visualization, and validation, J.Z.; data curation and methodology, Y.G.; conceptualization, funding acquisition, and supervision, X.J. All authors have read and agreed to the published version of the manuscript.

Funding

This research was supported by Scientific Research in the Public Interest of Fujian Province (2022R1025006, 2023R1023002, 2024R1024006), the Natural Science Foundation of Fujian Province (2023J01360), and the Fujian Academy of Agricultural Sciences programs (YCZX202409, CXTD2021002-3, CXPT202402).

Data Availability Statement

The data that support the findings of this study are available from the corresponding author upon reasonable request.

Conflicts of Interest

The authors declare no conflicts of interest.

References

  1. Kader, M.A.; Senge, M.; Mojid, M.A.; Ito, K. Recent advances in mulching materials and methods for modifying soil environment. Soil Till. Res. 2017, 168, 155–166. [Google Scholar] [CrossRef]
  2. Ding, F.; Li, S.; Lü, X.T.; Dijkstra, F.A.; Schaeffer, S.; An, T.; Pei, J.; Sun, L.; Wang, J. Opposite effects of nitrogen fertilization and plastic film mulching on crop N and P stoichiometry in a temperate agroecosystem. J. Plant Ecol. 2019, 12, 682–692. [Google Scholar] [CrossRef]
  3. Yin, M.H.; Li, Y.N.; Xu, Y.B.; Zhou, C.M. Effects of mulches on water use in a winter wheat/summer maize rotation system in Loess Plateau, China. J. Arid Land. 2018, 2, 277–291. [Google Scholar] [CrossRef]
  4. Chen, N.; Li, X.; Shi, H.; Hu, Q.; Zhang, Y.; Leng, X. Effect of biodegradable film mulching on crop yield, soil microbial and enzymatic activities, and optimal levels of irrigation and nitrogen fertilizer for the Zea mays crops in arid region. Sci. Total Environ. 2021, 776, 145970. [Google Scholar] [CrossRef]
  5. Steinmetz, Z.; Wollmann, C.; Schaefer, M.; Buchmann, C.; David, J.; Tröger, J.; Muñoz, K.; Frör, O.; Schaumann, G.E. Plastic mulching in agriculture. Trading short-term agronomic benefits for long-term soil degradation? Sci. Total Environ. 2016, 550, 690–705. [Google Scholar] [CrossRef] [PubMed]
  6. Li, C.; Li, X.; Bank, M.S.; Dong, T.; Fang, J.K.; Leusch, F.D.L.; Rillig, M.C.; Wang, J.; Wang, L.; Xia, Y.; et al. The “Microplastome”—A holistic perspective to capture the real-world ecology of microplastics. Environ. Sci. Technol. 2024, 58, 4060–4069. [Google Scholar] [CrossRef]
  7. Mbachu, O.; Jenkins, G.; Kaparaju, P.; Pratt, C. The rise of artificial soil carbon inputs: Reviewing microplastic pollution effects in the soil environment. Sci. Total Environ. 2021, 780, 146569. [Google Scholar] [CrossRef]
  8. Xie, H.Z.; Lu, W.X.; Shang, K.X. Comparative study on the properties and application of several biodegradable plastics. Chem. Fert. Des. 2020, 58, 1–3, 7. (In Chinese) [Google Scholar]
  9. Ferreira, F.V.; Luciana, S.C.; Rubia, F.G.; Liliane, M.F.L. An overview on properties and applications of poly (butylene adipate-co-terephthalate)-PBAT based composites. Polym. Eng. Sci. 2019, 59, E7–E15. [Google Scholar] [CrossRef]
  10. Khan, H.; Kaur, S.; Baldwin, T.C.; Radecka, I.; Jiang, G.; Bretz, I.; Duale, K.; Adamus, G.; Kowalczuk, M. Effective control against broadleaf weed species provided by biodegradable PBAT/PLA mulch film embedded with the herbicide 2-Methyl-4-Chlorophenoxyacetic acid (MCPA). ACS Sustain. Chem. Eng. 2020, 8, 5360–5370. [Google Scholar] [CrossRef]
  11. Lucas, N.; Bienaime, C.; Belloy, C.; Queneudec, M.; Silvestre, F.; Nava-Saucedo, J.E. Polymer biodegradation: Mechanisms and estimation techniques—A review. Chemosphere 2008, 73, 429–442. [Google Scholar] [CrossRef] [PubMed]
  12. Bastioli, C. Handbook of Biodegradable Polymers; Smithers Rapra Technology: Shrewsbury, UK, 2005. [Google Scholar]
  13. Sintim, H.Y.; Bary, A.I.; Hayes, D.G.; Wadsworth, L.C.; Anunciado, M.B.; English, M.E.; Bandopadhyay, S.; Schaeffer, S.M.; DeBruyn, J.M.; Miles, C.A.; et al. In situ degradation of biodegradable plastic mulch films in compost and agricultural soils. Sci. Total Environ. 2020, 727, 138668. [Google Scholar] [CrossRef] [PubMed]
  14. Wang, L.X.; Chang, R.X.; Ren, Z.P.; Meng, X.; Li, Y.M.; Gao, M. Mature compost promotes biodegradable plastic degradation and reduces greenhouse gas emission during food waste composting. Sci. Total Environ. 2024, 926, 172081. [Google Scholar] [CrossRef] [PubMed]
  15. Ma, J.X.; Cao, Y.D.; Fan, L.W.; Xie, Y.L.; Zhou, X.Q.; Ren, Q.P.; Yang, X.F.; Gao, X.; Feng, Y.H. Degradation characteristics of polybutylene adipate terephthalic acid (PBAT) and its effect on soil physicochemical properties: A comparative study with several polyethylene (PE) mulch films. J. Hazard. Mater. 2023, 456, 131661. [Google Scholar] [CrossRef]
  16. Fan, P.; Yu, H.; Xi, B.; Tan, W. A review on the occurrence and influence of biodegradable microplastics in soil ecosystems: Are biodegradable plastics substitute or threat? Environ. Int. 2022, 163, 107244. [Google Scholar] [CrossRef]
  17. Wang, Z.; Li, M.; Flury, M.; Schaeffer, S.M.; Chang, Y.; Tao, Z.; Jia, Z.; Li, S.; Ding, F.; Wang, J. Agronomic performance of polyethylene and biodegradable plastic film mulches in a maize cropping system in a humid continental climate. Sci. Total Environ. 2021, 786, 147460. [Google Scholar] [CrossRef]
  18. Liu, E.; Zhang, L.; Dong, W.; Yan, C. Biodegradable plastic mulch films in agriculture: Feasibility and challenges. Environ. Res. Lett. 2021, 16, 1004. [Google Scholar] [CrossRef]
  19. Sintim, H.Y.; Bandopadhyay, S.; English, M.E.; Bary, A.I.; DeBruyn, J.M.; Schaeffer, S.M.; Miles, C.A.; Reganold, J.P.; Flury, M. Impacts of biodegradable plastic mulches on soil health. Agric. Ecosyst. Environ. 2019, 273, 36–49. [Google Scholar] [CrossRef]
  20. Brown, R.W.; Chadwick, D.R.; Zang, H.; Graf, M.; Liu, X.; Wang, K.; Greenfield, L.M.; Jones, D.L. Bioplastic (PHBV) addition to soil alters microbial community structure and negatively affects plant-microbial metabolic functioning in maize. J. Hazard. Mater. 2023, 441, 129959. [Google Scholar] [CrossRef]
  21. Lian, Y.H.; Liu, W.T.; Shi, R.Y.; Zeb, A.R.; Wang, Q.; Li, J.T.; Zheng, Z.Q.; Tang, J.C. Effects of polyethylene and polyactic acid microplastics on plant growth and bacterial community in the soil. J. Hazard. Mater. 2022, 435, 129057. [Google Scholar] [CrossRef]
  22. Liu, M.; Feng, J.; Shen, Y.; Zhu, B. Microplastics effects on soil biota are dependent on their properties: A meta-analysis. Soil Biol. Biochem. 2023, 178, 108940. [Google Scholar] [CrossRef]
  23. Liu, Y.; Zhang, W.; Chen, M.; Zhao, X.; Liu, H.; Ge, M.; Li, N.; Ning, Z.; Gao, W.; Fan, C.; et al. Molecular insights into effects of PBAT microplastics on latosol microbial diversity and DOM chemodiversity. J. Hazard. Mater. 2023, 450, 131076. [Google Scholar] [CrossRef] [PubMed]
  24. Song, T.J.; Liu, J.X.; Han, S.Q.; Li, Y.; Xu, T.Q.; Xi, J.; Hou, L.J.; Lin, Y.B. Effect of conventional and biodegradable microplastics on the soil-soybean system: A perspective on rhizosphere microbial community and soil element cycling. Environ. Int. 2024, 190, 108781. [Google Scholar] [CrossRef] [PubMed]
  25. Wang, Q.L.; Feng, X.Y.; Liu, Y.Y.; Cui, W.Z.; Sun, Y.H.; Zhang, S.W.; Wang, F.Y. Effects of microplastics and carbon nanotubes on soil geochemical properties and bacterial communities. J. Hazard. Mater. 2022, 433, 128826. [Google Scholar] [CrossRef]
  26. Li, X.N.; Qu, C.S.; Bian, Y.R.; Gu, G.C.; Jiang, X.; Xin, J.; Song, Y. New insights into the responses of soil microorganism to polycyclic aromatic hydrocarbon stress by combining enzyme activity and sequencing analysis with metabolomics. Environ. Pollut. 2019, 255, 113312. [Google Scholar] [CrossRef]
  27. Miller, S.B.; Heuberger, A.L.; Broeckling, C.D.; Jahn, C.E. Non-targeted metabolomics reveals sorghum rhizosphere-associated exudates are influenced by the belowground interaction of substrate and sorghum genotype. Int. J. Mol. Sci. 2019, 20, 431. [Google Scholar] [CrossRef]
  28. Wu, C.C.; Wang, Z.N.; Ma, Y.; Luo, J.Y.; Gao, X.K.; Ning, J.; Mei, X.D.; She, D.M. Influence of the neonicotinoid insecticide thiamethoxam on soil bacterial community composition and metabolic function. J. Hazard. Mater. 2021, 405, 124275. [Google Scholar] [CrossRef]
  29. FAO. World reference base for soil resources 2014, update 2015. In International Soil Classification System for Naming Soils and Creating Legends for Soil Maps; Word Soil Resources Reports No. 106; FAO: Rome, Italy, 2015. [Google Scholar]
  30. Machado, A.A.; Lau, C.W.; Till, J.; Kloas, W.; Lehmann, A.; Becher, R.; Rillig, M.C. Impacts of microplastics on the soil biophysical environment. Environ. Sci. Technol. 2018, 52, 9656–9665. [Google Scholar] [CrossRef]
  31. NY/T 1377-2007; Determination of pH in Soil. Agricultural Industry Standard of the People’s Republic of China. Ministry of Agriculture of the People’s Republic of China: Beijing, China, 2007.
  32. Serrano-Ruiz, H.; Martin-Closas, L.; Pelacho, A.M. Impact of buried debris from agricultural biodegradable plastic mulches on two horticultural crop plants: Tomato and lettuce. Sci. Total Environ. 2023, 856, 159167. [Google Scholar] [CrossRef]
  33. Liu, J.X.; Wang, P.Y.; Wang, Y.F.; Zhang, Y.J.; Xu, T.Q.; Zhang, Y.Q.; Xi, J.; Hou, L.J.; Li, L.; Zhang, Z.Q.; et al. Negative effects of poly(butylene adipate-co-terephthalate) microplastics on Arabidopsis and its root-associated microbiome. J. Hazard. Mater. 2022, 437, 129294. [Google Scholar] [CrossRef]
  34. Sun, X.D.; Yuan, X.Z.; Jia, Y.; Feng, L.J.; Zhu, F.P.; Dong, S.S.; Liu, J.; Kong, X.; Tian, H.; Duan, J.L.; et al. Differentially charged nanoplastics demonstrate distinct accumulation in Arabidopsis thaliana. Nat. Nanotechnol. 2020, 15, 755–760. [Google Scholar] [CrossRef]
  35. Zantis, L.J.; Adamczyk, S.; Velmala, S.M.; Adamczyk, B.; Vijver, M.G.; Peijnenburg, W.; Bosker, T. Comparing the impact of microplastics derived from a biodegradable and a conventional plastic mulch on plant performance. Sci. Total Environ. 2024, 935, 173265. [Google Scholar] [CrossRef] [PubMed]
  36. Xu, Z.; Zhang, Y.; Lin, L.; Wang, L.; Sun, W.; Liu, C.; Yu, G.; Yu, J.; Lv, Y.; Chen, J.; et al. Toxic effects of microplastics in plants depend more by their surface functional groups than just accumulation contents. Sci. Total Environ. 2022, 833, 155097. [Google Scholar] [CrossRef] [PubMed]
  37. Lian, J.; Liu, W.; Meng, L.; Wu, J.; Chao, L.; Zeb, A.; Sun, Y. Foliar-applied polystyrene nanoplastics (PSNPs) reduce the growth and nutritional quality of lettuce (Lactuca sativa L.). Environ. Pollut. 2021, 280, 116978. [Google Scholar] [CrossRef]
  38. Bagheri, M.; Gholami, M.; Baninasab, B. Hydrogen peroxide-induced salt tolerance in relation to antioxidant systems in pistachio seedlings. Sci. Hortic. 2019, 243, 207–213. [Google Scholar] [CrossRef]
  39. Awasthi, J.P.; Saha, B.; Chowardhara, B.; Devi, S.S.; Borgohain, P.; Panda, S.K. Qualitative analysis of lipid peroxidation in plants under multiple stress through Schiff’s reagent: A histochemical approach. Bio-Protocol 2018, 8, e2807. [Google Scholar] [CrossRef] [PubMed]
  40. Han, Y.J.; Teng, Y.; Wang, X.; Wen, D.; Gao, P.X.; Yan, D.; Yang, N. Biodegradable PBAT microplastics adversely affect pakchoi (Brassica chinensis L.) growth and the rhizosphere ecology: Focusing on rhizosphere microbial community composition, element metabolic potential, and root exudates. Sci. Total Environ. 2024, 912, 169048. [Google Scholar] [CrossRef]
  41. Chen, H.; Wang, Y.; Sun, X.; Peng, Y.; Xiao, L. Mixing effect of polylactic acid microplastic and straw residue on soil property and ecological function. Chemosphere 2020, 243, 125271. [Google Scholar] [CrossRef]
  42. Aanderud, Z.T.; Saurey, S.; Ball, B.A.; Wall, D.H.; Barrett, J.E.; Muscarella, M.E.; Griffin, N.A.; Virginia, R.A.; Adams, B.J. Stoichiometric shifts in soil C:N:P promote bacterial taxa dominance, maintain biodiversity, and deconstruct community assemblages. Front. Microbiol. 2018, 9, 1401. [Google Scholar] [CrossRef]
  43. Wicaksono, J.A.; Purwadaria, T.; Yulandi, A.; Tan, W.A. Bacterial dynamics during the burial of starch-based bioplastic and oxo-low-density-polyethylene in compost soil. BMC Microbiol. 2022, 22, 309. [Google Scholar] [CrossRef]
  44. Liu, L.Y.; Zou, G.Y.; Zuo, Q.; Li, C.Z.; Gu, J.L.; Kang, L.Y.; Ma, M.T.; Liang, K.Y.; Liu, D.S.; Du, L.F. Soil bacterial community and metabolism showed a more sensitive response to PBAT biodegradable mulch residues than that of LDPE mulch residues. J. Hazard. Mater. 2022, 438, 129507. [Google Scholar] [CrossRef]
  45. Han, Y.J.; Teng, Y.; Wang, X.; Ren, W.J.; Wang, X.M.; Luo, Y.M.; Zhang, H.M.; Christie, P. Soil type driven change in microbial community affects poly(butylene adipate-coterephthalate) degradation potential. Environ. Sci. Technol. 2021, 55, 4648–4657. [Google Scholar] [CrossRef] [PubMed]
  46. Hu, X.; Gu, H.; Wang, Y.; Liu, J.; Yu, Z.; Li, Y.; Jin, J.; Liu, X.; Dai, Q.; Wang, G. Succession of soil bacterial communities and network patterns in response to conventional and biodegradable microplastics: A microcosmic study in Mollisol. J. Hazard. Mater. 2022, 436, 129218. [Google Scholar] [CrossRef] [PubMed]
  47. Huang, R.L.; Zhang, N.; Sun, B.; Liang, Y.T. Community structure of Burkholderiales and its diversity in typical maize rhizosphere soil. Acta Pedol. Sin. 2020, 57, 975–985. (In Chinese) [Google Scholar]
  48. Paulitsch, F.; Delamuta, J.R.M.; Ribeiro, R.A.; da Silva Batista, J.S.; Hungria, M. Phylogeny of symbiotic genes reveals symbiovars within legume-nodulating Paraburkholderia species. Syst. Appl. Microbiol. 2020, 43, 126151. [Google Scholar] [CrossRef]
  49. Singh, R.K.; Malik, N.; Singh, S. Improved nutrient use efficiency increases plant growth of rice with the use of IAA-overproducing strains of endophytic Burkholderia cepacia strain RRE25. Micob. Ecol. 2013, 66, 375–384. [Google Scholar] [CrossRef]
  50. Pal, G.; Kumar, K.; Verma, A.; Verma, S.K. Seed inhabiting bacterial endophytes of maize promote seedling establishment and provide protection against fungal disease. Microbiol. Res. 2022, 255, 126926. [Google Scholar] [CrossRef]
  51. Pandey, P.; Kang, S.C.; Maheshwari, D.K. Isolation of endophytic plant growth promoting Burkholderia sp. MSSP from root nodules of Mimosa pudica. Curr. Sci. 2005, 89, 177–180. [Google Scholar]
  52. Wang, X.; Zhang, X.; Liu, X.; Huang, Z.; Niu, S.; Xu, T.; Zhu, Y. Physiological, biochemical and proteomic insight into integrated strategies of an endophytic bacterium Burkholderia cenocepacia strain YG-3 response to cadmium stress. Metallomics 2019, 11, 1252–1264. [Google Scholar] [CrossRef]
  53. Sun, Y.Z.; Duan, C.X.; Cao, N.; Ding, C.F.; Huang, Y.; Wang, J. Biodegradable and conventional microplastics exhibit distinct microbiome, functionality, and metabolome changes in soil. J. Hazard. Mater. 2022, 424, 127282. [Google Scholar] [CrossRef]
  54. Shumilina, J.; Soboleva, A.; Abakumov, E.; Shtark, O.Y.; Zhukov, V.A.; Frolov, A. Signaling in legume-Rhizobia symbiosis. Int. J. Mol. Sci. 2023, 24, 17397. [Google Scholar] [CrossRef] [PubMed]
  55. Athul, P.P.; Patra, R.K.; Sethi, D.; Panda, N.; Mukhi, S.K.; Padhan, K.; Sahoo, S.K.; Sahoo, T.R.; Mangaraj, S.; Pradhan, S.R.; et al. Efficient native strains of rhizobia improved nodulation and productivity of French bean (Phaseolus vulgaris L.) under rainfed condition. Front. Plant Sci. 2022, 13, 1048696. [Google Scholar] [CrossRef] [PubMed]
  56. van Dissel, D.; Claessen, D.; van Wezel, G.P. Morphogenesis of Streptomyces in submerged cultures. Adv. Appl. Microbiol. 2014, 89, 1–45. [Google Scholar]
  57. Bernardes, M.B.; Dal’Rio, I.; Coelho, M.R.R.; Seldin, L. Response of sweet potato cultviars to Bacillus velezensis T149-19 and Bacillus safensis T052-76 used as biofertilizers. Heliyon 2024, 10, e34377. [Google Scholar] [CrossRef]
  58. Rees, D.C.; Johnson, E.; Lewinson, O. ABC transporters: The power to change. Nat. Rev. Mol. Cell Biol. 2009, 10, 218–227. [Google Scholar] [CrossRef] [PubMed]
  59. New, A.M.; Cerulus, B.; Govers, S.K.; Perez-Samper, G.; Zhu, B.; Boogmans, S.; Xavier, J.B.; Verstrepen, K.J. Different levels of catabolite repression optimize growth in stable and variable environments. PLoS Biol. 2014, 12, e1001764. [Google Scholar] [CrossRef]
  60. Qi, Y.L.; Ossowicki, A.; Yang, X.M.; Lwanga, E.H.; Dini-Andreote, F.; Geissen, V.; Garbeva, P. Effects of plastic mulch film residues on wheat rhizosphere and soil properties. J. Hazard. Mater. 2020, 387, 121711. [Google Scholar] [CrossRef]
  61. Jiao, J.; Zeng, X.B.; Huang, X.B. An overview on synthesis, properties and applications of poly(butylene-adipate-co-terephthalate)-PBAT. Adv. Ind. Eng. Polym. Res. 2020, 3, 19–26. [Google Scholar]
  62. Kleeberg, I.; Welzel, K.; VandenHeuvel, J.; Müller, R.J.; Deckwer, W.D. Characterization of a new extracellular hydrolase from Thermobifida fusca degrading aliphatic-aromatic Copolyester. Biomacromolecules 2005, 6, 262–270. [Google Scholar] [CrossRef]
  63. Sindhu, S.S.; Sehrawat, A.; Glick, B.R. The involvement of organic acids in soil fertility, plant health and environment sustainability. Arch. Microbiol. 2022, 204, 720. [Google Scholar] [CrossRef]
  64. Li, Y.D.; Li, S.; Yun, Y.L.; Li, J.P.; Sun, J.G.; Sun, G.W.; Feng, J.; Chen, Z.G.; Yang, L.F. The effect of controlling nitrogen by peptide fertilizer and reducing phosphorus fertilizer application on the growth of Yunyan 87. Hans J. Agric. Sci. 2024, 14, 931–939. (In Chinese) [Google Scholar]
Figure 1. Effects of PBAT MP concentration on L. sativa growth and physiological indices. (A) Shoot height, (B) Leaf dry weight, (C) Chlorophyll, (D) Proline, (E) MDA, (F) Soluble protein, (G) Soluble sugar, (H) Vitamin C. Different letters indicate significant differences among different treatments. T1, T2, and T3: 0.1%, 1%, and 5% PBAT, respectively.
Agronomy 15 00990 g001
Figure 2. Principal coordinate analysis (PCoA) of metagenomic species under different PBAT addition concentrations based on Bray–Curtis distance. T1, T2, and T3: 0.1%, 1%, and 5% PBAT, respectively.
Agronomy 15 00990 g002
Figure 3. Relative abundances of soil microbiome under different treatments at phylum (A) and family (B) levels. T1, T2, and T3: 0.1%, 1%, and 5% PBAT, respectively.
Agronomy 15 00990 g003
Figure 4. Discriminatory genera under different treatments based on analysis of linear discriminant analysis effect size (LEfSe) with LDA > 3.0. T1, T2, and T3: 0.1%, 1%, and 5% PBAT, respectively.
Agronomy 15 00990 g004
Figure 5. Principal coordinate analysis (PCoA) of COG functions (A) and KEGG functions (B) on the basis of the Bray–Curtis distance. T1, T2, and T3: 0.1%, 1%, and 5% PBAT, respectively.
Agronomy 15 00990 g005
Figure 6. Comparison analysis of KEGG pathways under different treatments. T1, T2, and T3: 0.1%, 1%, and 5% PBAT, respectively. Asterisks (* and **) indicate significance at p < 0.05 and p < 0.01, respectively.
Agronomy 15 00990 g006
Figure 7. Effects of PBAT MP dosages on soil metabolite profiles (A), principal component analysis (PCA) of soil metabolite profiles (B), and partial least squares discriminant analysis (PLS-DA) of soil metabolite profiles (C). T1, T2, and T3: 0.1%, 1%, and 5% PBAT, respectively.
Agronomy 15 00990 g007
Figure 8. Variable importance in projection (VIP) scores of soil metabolites under different treatments. The selected metabolites were those with a VIP of >2.0. The heatmap on the right indicates the relative abundance of the corresponding metabolites under different treatments. T1, T2, and T3: 0.1%, 1%, and 5% PBAT, respectively.
Agronomy 15 00990 g008
Figure 9. Partial least squares path modeling (PLS-PM) explaining how the PBAT dosages affected the plant growth, soil properties, soil microbial community, and soil metabolites. The red and blue arrows represent positive and negative effects, respectively, with the arrow width indicating the strength of the path coefficient. The R2 value represents the ratio of the variance accounted for by each variable. ** p < 0.01. The soil properties included the OC, AN, AP, AK, NH4+-N, and NO3-N. Plant growth: the leaf dry weight. The microbial community was measured using a-diversity indices. Soil metabolites: the first three principal components.
Agronomy 15 00990 g009
Table 1. Soil physicochemical properties under different treatments.
TreatmentCKT1 T2T3
pH4.77 ± 0.05 a4.66 ± 0.05 a4.68 ± 0.08 a4.69 ± 0.07 a
OC (g/kg)28.16 ± 1.40 c29.30 ± 1.15 c38.87 ± 2.53 b82.59 ± 2.27 a
DOC (g/kg)0.09 ± 0.01 a0.10 ± 0.01 a0.10 ± 0.02 a0.11 ± 0.01 a
TN (g/kg)1.65 ± 0.07 ab1.69 ± 0.08 a1.55 ± 0.07 b1.59 ± 0.05 ab
TP (g/kg)0.88 ± 0.09 a0.89 ± 0.05 a0.67 ± 0.04 b0.87 ± 0.01 a
TK (g/kg)16.9 ± 1.78 a16.8 ± 0.48 a17.60 ± 1.31 a15.94 ± 0.84 a
AN (mg/kg)45.84 ± 1.69 b59.64 ± 8.43 a54.77 ± 8.19 ab50.33 ± 3.08 ab
AP (mg/kg)121.29 ± 4.52 a112.84 ± 4.49 b106.07 ± 3.26 c116.03 ± 4.64 b
AK (mg/kg)47.10 ± 4.90 a22.09 ± 4.92 bc14.51 ± 3.39 c26.34 ± 3.42 b
NH4+-N (mg/kg)4.56 ± 0.42 a0.79 ± 0.06 c0.42 ± 0.10 d2.18 ± 0.16 b
NO3-N (mg/kg)7.49 ± 0.33 a6.07 ± 0.16 b5.98 ± 0.14 b7.01 ± 0.37 a
OC: organic carbon; DOC: dissolved organic carbon; TN: total nitrogen; TP: total phosphorus; TK: total potassium; AN: available nitrogen; AP: available phosphorus; AK: available potassium. T1, T2, and T3: 0.1%, 1%, and 5% PBAT, respectively. Different lowercase letters within a row indicate significant differences among different treatments at p < 0.05.
Disclaimer/Publisher’s Note: The statements, opinions and data contained in all publications are solely those of the individual author(s) and contributor(s) and not of MDPI and/or the editor(s). MDPI and/or the editor(s) disclaim responsibility for any injury to people or property resulting from any ideas, methods, instructions or products referred to in the content.

