Article

Analysis of the Resistance to Teeth During the Picking Process Based on DEM-MBD Coupling Simulation

1
School of Agriculture Engineering, Jiangsu University, Zhenjiang 212013, China
2
College of Electrical and Mechanical Engineering, Fujian Agriculture and Forestry University, Fuzhou 350002, China
3
Department of Mechanical Engineering, University of Nigeria, Nsukka 410001, Nigeria
*
Author to whom correspondence should be addressed.
Agronomy 2025, 15(5), 1002; https://doi.org/10.3390/agronomy15051002
Submission received: 26 March 2025 / Revised: 17 April 2025 / Accepted: 21 April 2025 / Published: 22 April 2025
(This article belongs to the Section Farming Sustainability)

Abstract

:
To improve the film-picking performance of toothed chain tillage residual film recycling machines, the working parameters of a film-picking device were optimized using a Box–Behnken design, with the film-picking rate as the response parameter. The effectiveness of the film-picking device, along with soil compaction, torque, and stress on the picking teeth during the process, was evaluated through DEM-MBD coupling simulations and experiments. The optimized working parameters for the film-lifting device were found to be forward speed v = 1.94   m · s 1 , picking tooth speed n = 10.47   r a d · s 1 , and penetration depth h = 125   m m . Under these conditions, the film-picking rate for the single-tooth and multi-tooth devices were 88% and 90%, respectively, with a 2% error. The simulation and experimental values for soil compaction, torque, and stress during the film-picking process were 800 Pa, 2.72 N · m , and 6.4 N, respectively. The corresponding simulation values were 870 Pa, 2.53 N · m , and 6.5 N, with errors of 8%, 7%, and 2%. This study provides valuable insights for optimizing the design of residual film recycling machines and predicting soil compaction, tooth torque, and stress.

1. Introduction

Xinjiang, China’s primary cotton-producing region, demonstrates a 16% yield increase with plastic mulching (Yang et al., 2023) [1]. However, residual film pollution inhibits root growth and reduces cotton productivity. While mechanized recovery is the most viable solution, its efficiency hinges on the film-picking device’s performance, which faces two critical scientific bottlenecks. The parameter optimization dilemma: Empirical determination of optimal operational parameters (e.g., retrieval speed, depth) remains costly and time-consuming due to the lack of predictive models. Dynamic resistance uncertainty: The complex soil–film–tooth interaction generates unpredictable resistance, compromising device longevity and recovery rates. Novel contributions of this study: To address these challenges, we propose a pre-manufacturing optimization framework combining single-tooth experiments with DEM-MBD coupling simulations, enabling the accurate prediction of retrieval resistance and operational efficiency prior to physical prototyping, and a flexible DEM film model that replicates real-world deformation dynamics, validated against field data. This model resolves the longstanding issue of simulating discontinuous film–soil interactions at the plow-layer scale.
Elastic teeth are crucial components of tillage residual film recovery devices (Jiang et al., 2023) [2]. Zhang et al. (2024) designed an arc-shaped toothed film-picking device and optimized its operating parameters, including forward speed, picking speed, and depth [3]. Shi et al. (2022) conducted a kinematic analysis of the chain-driven soil separation mechanism using ADAMS 2020 software and optimized the toothed device parameters [4]. Yang et al. (2020) examined the residual film recovery rate and resistance of three types of teeth to determine optimal design and operational parameters [5]. Shi et al. (2023) focused on optimizing the speed of the picking and unloading devices of the Kun-style recovery machine to improve recovery and unloading rates [6]. The interaction between elastic teeth and soil during the picking process is key to enhancing the recovery rate (Guo et al., 2020) [7,8,9]. Wang et al. (2021) optimized the working speed, excavation depth, and picking speed of the nail tooth-picking device, measuring particle velocity and total torque under the action of the teeth [10]. Zhang et al. (2024) used finite element simulation to optimize working parameters, focusing on forward speed, rotational velocity, and residual film stress and deformation [11].
After determining the design parameters of the film-picking device and elastic teeth, key factors influencing the recovery of residual film in the tillage layer include forward speed, tooth rotation speed, and soil penetration depth. For instance, Zhang et al. (2022) developed a virtual simulation model using the discrete element method (DEM) to analyze the interaction between the toothed roller device and the soil. Based on key performance indicators such as soil-lifting capacity, they constructed a quadratic regression model incorporating three operational parameters—forward speed, rotational speed, and working depth—via the Box–Behnken experimental design (Zhang et al., 2022; Dong et al., 2022; Wang et al., 2022) [12,13,14,15]. In designing the elastic teeth, improving the residual film recovery rate and enhancing drag reduction through tooth shape and surface design are also important (El Salem et al., 2021; Zhou et al., 2021) [16,17]. DEM simulations can predict the film-lifting force and effectiveness, while stress measurements using strain gauges on soil-contacting components help verify the simulation results (Kesner et al., 2021; Yang et al., 2023) [18,19]. The tillage force of the tiller is predicted using DEM, with model accuracy validated through error analysis of the disturbance zone in soil during simulations and experiments (Zhang et al., 2023; Li et al., 2024; Zhu et al., 2023; Fang et al., 2022) [20,21,22,23]. Tamas et al. (2021) created a discrete element model of plant root systems and validated it through penetration tests [24]. Studies using DEM have also examined the effect of trenching depth on the resistance of opening devices (Kim et al., 2022; Bahrami et al., 2023) [25,26], and Liu et al. (2023) simulated interactions between trenching devices, straw, and soil, optimizing trenching device parameters [27]. Zhang et al. (2023) applied biomimetic design to a trench opener, using mole claws to reduce resistance and improve disturbance characteristics via DEM-MBD coupling [20,28]. This method showed an 11% reduction in resistance and improved soil disturbance compared to traditional openers. DEM can also analyze the mechanical interactions between soil-touching components, predict their service life, and optimize soil-contact component performance (Li et al., 2024; Ma et al., 2023; Yuan et al., 2022) [29,30,31]. Accurate DEM parameters for flexible bodies enable analysis of interactions and displacement between soil-contact components, flexible objects, and soil. For example, Liu et al. (2023) developed a discrete element model of flexible straw-covered soil using EDEM 2020.0 software. They employed the Hertz–Mindlin contact model with bond particles to simulate the dual-layer adhesion characteristics between straw and soil (Liu et al., 2023; Shi et al., 2023; Tang et al., 2023) [32,33,34,35].
This study aims to (1) optimize the operational parameters of a plow-layer residual film retrieval device to enhance picking efficiency and (2) evaluate particle size effects on the discrete element model’s accuracy, thereby identifying an optimal size range that balances computational efficiency with simulation fidelity. Following this determination, DEM simulations were employed to predict device resistance and retrieval performance under varying conditions. Furthermore, a novel predictive model for the residual film trajectory was developed via DEM-MBD coupling, incorporating dynamic interactions between the retrieval teeth and the film through force/torque analysis. Collectively, this work establishes a parameter optimization framework to maximize film recovery rates in cotton field applications.

2. Materials and Methods

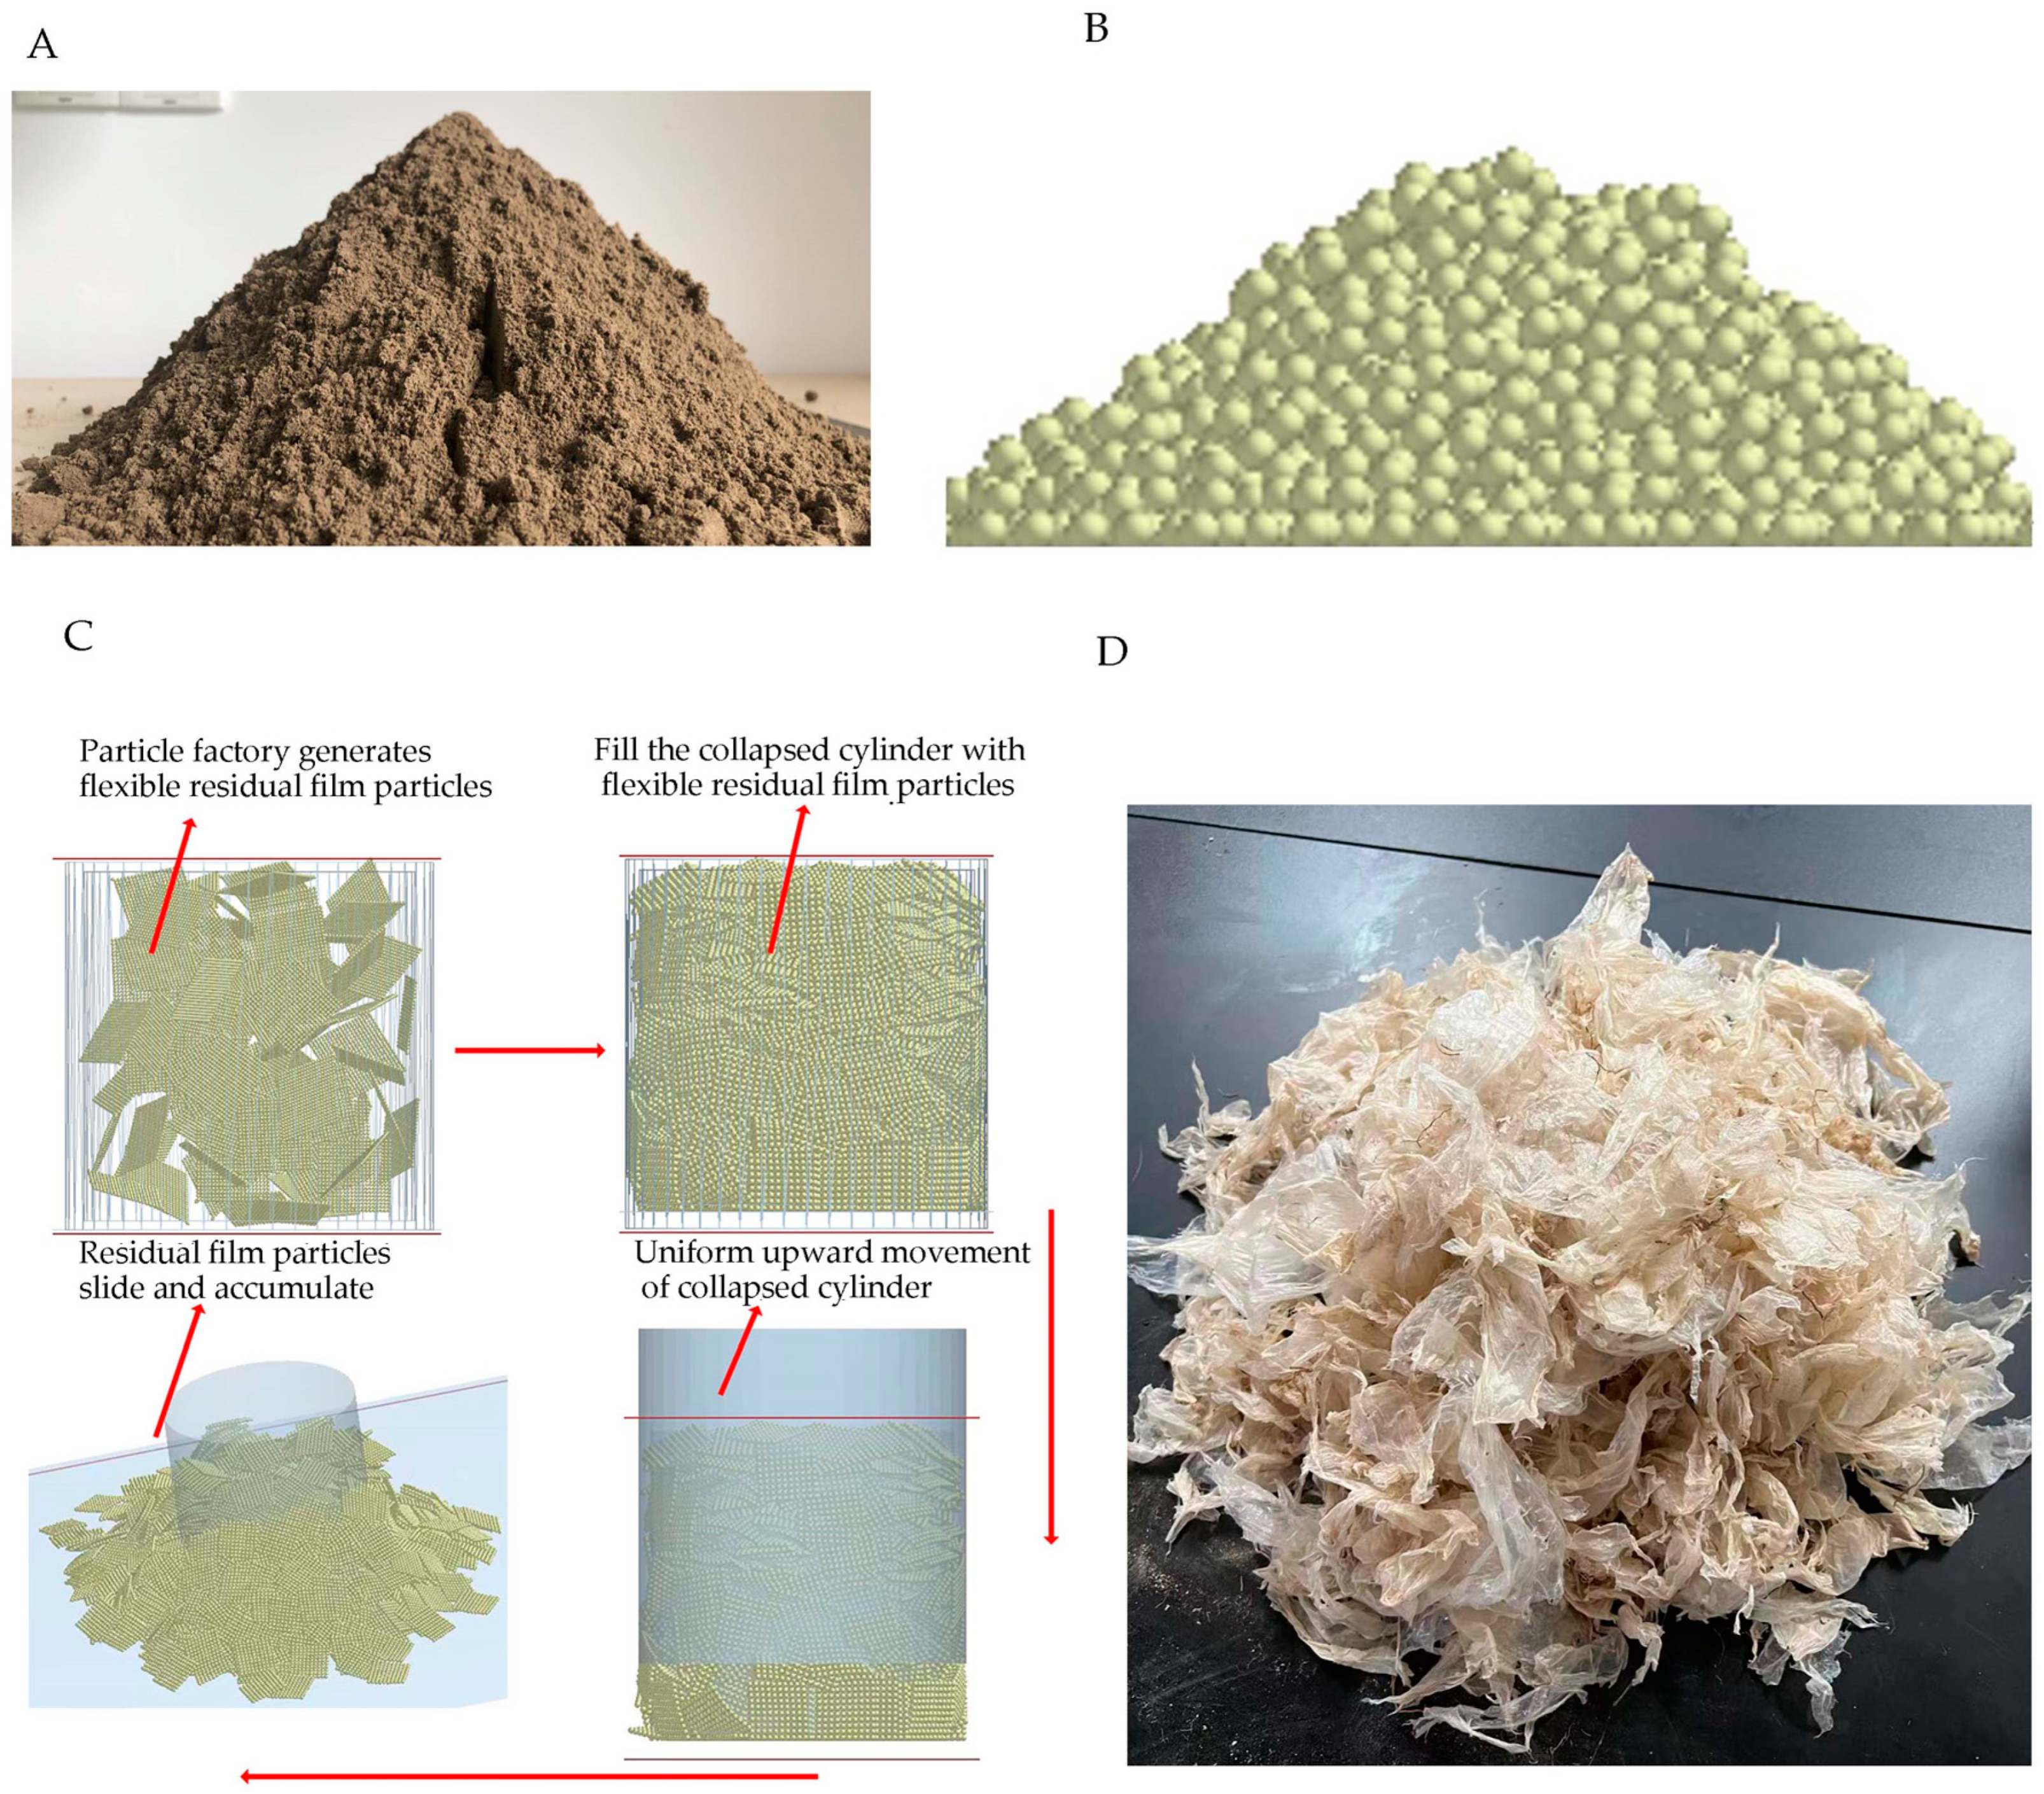
2.1. Determination of the Mechanical Properties of Residual Film and Analysis of the Impact of Key Parameters on Simulation Accuracy

Soil and residual film samples were collected from cotton fields in Tacheng, Xinjiang, using a standardized five-point sampling method. Figure 1 illustrates the sampling procedure, soil particle size analysis, and humidity measurement protocol. These measured parameters provide critical baseline data for subsequent simulation and experimental configurations. Soil bulk density was determined using a 100 c m 3 cutting ring method combined with high-precision balance measurements (Figure 1c). The density values were calculated from the measured soil volume and mass, yielding an average bulk density of 1.61 g · c m 3 (1610 k g · m 3 ). The soil-contacting parts of agricultural tillage tools were made from 65Mn steel, and the material properties of both the soil and elastic tooth (65Mn steel) were obtained from prior studies (Wang et al., 2019; Guo et al., 2017) [36,37]. The residual film density was 915 K g · m 3 (Quan et al., 2021) [38]. Other intrinsic and contact parameters, including bonding parameters, were derived from the literature (Fang et al., 2024) [39]. Key bonding parameters include normal stiffness ( K n = 3.8 × 10 6 ,     N · m 3 ), shear stiffness ( K s = 3.8 × 10 6 , generally equal to 1 / 3 − 1 K n , N · m 3 ), normal strength ( σ = 5 × 10 10 , Pa), shear strength ( τ = 5 × 10 10 , Pa), and bonded disk scale (1.1–1.3). Due to the difficulty in measuring soil–residual film contact parameters, the accuracy of these parameters was verified using accumulation angle tests and funnel method simulations (Figure 2A,B). The error between the simulation and experimental results for soil contact was 3% (43.6° vs. 42.42°). Similarly, the accuracy of the residual film contact parameters was verified by comparing simulated and experimental stacking angles (43° vs. 43.7°, see Figure 2C,D), with a 2% error. The close agreement between the simulation and experimental results (within acceptable error margins) validates both the discrete element parameters employed and the computational model’s reliability. DEM simulations were conducted using EDEM 2021. After setting the intrinsic and contact parameters (Table 1), the “fixed time step” was set to 5 × 10⁻⁶, which can be scaled 5–10 times if the model excludes residual film particles. The “target save interval” was set to 0.01 s, “cell size” to 3R, and the number of CPU cores to 12, based on the computer used.
The acquisition and validation of these material parameters enhance the reliability of the determined discrete element properties. Subsequent discrete element modeling will incorporate these verified parameters to ensure the accurate representation of physical conditions in the simulation.

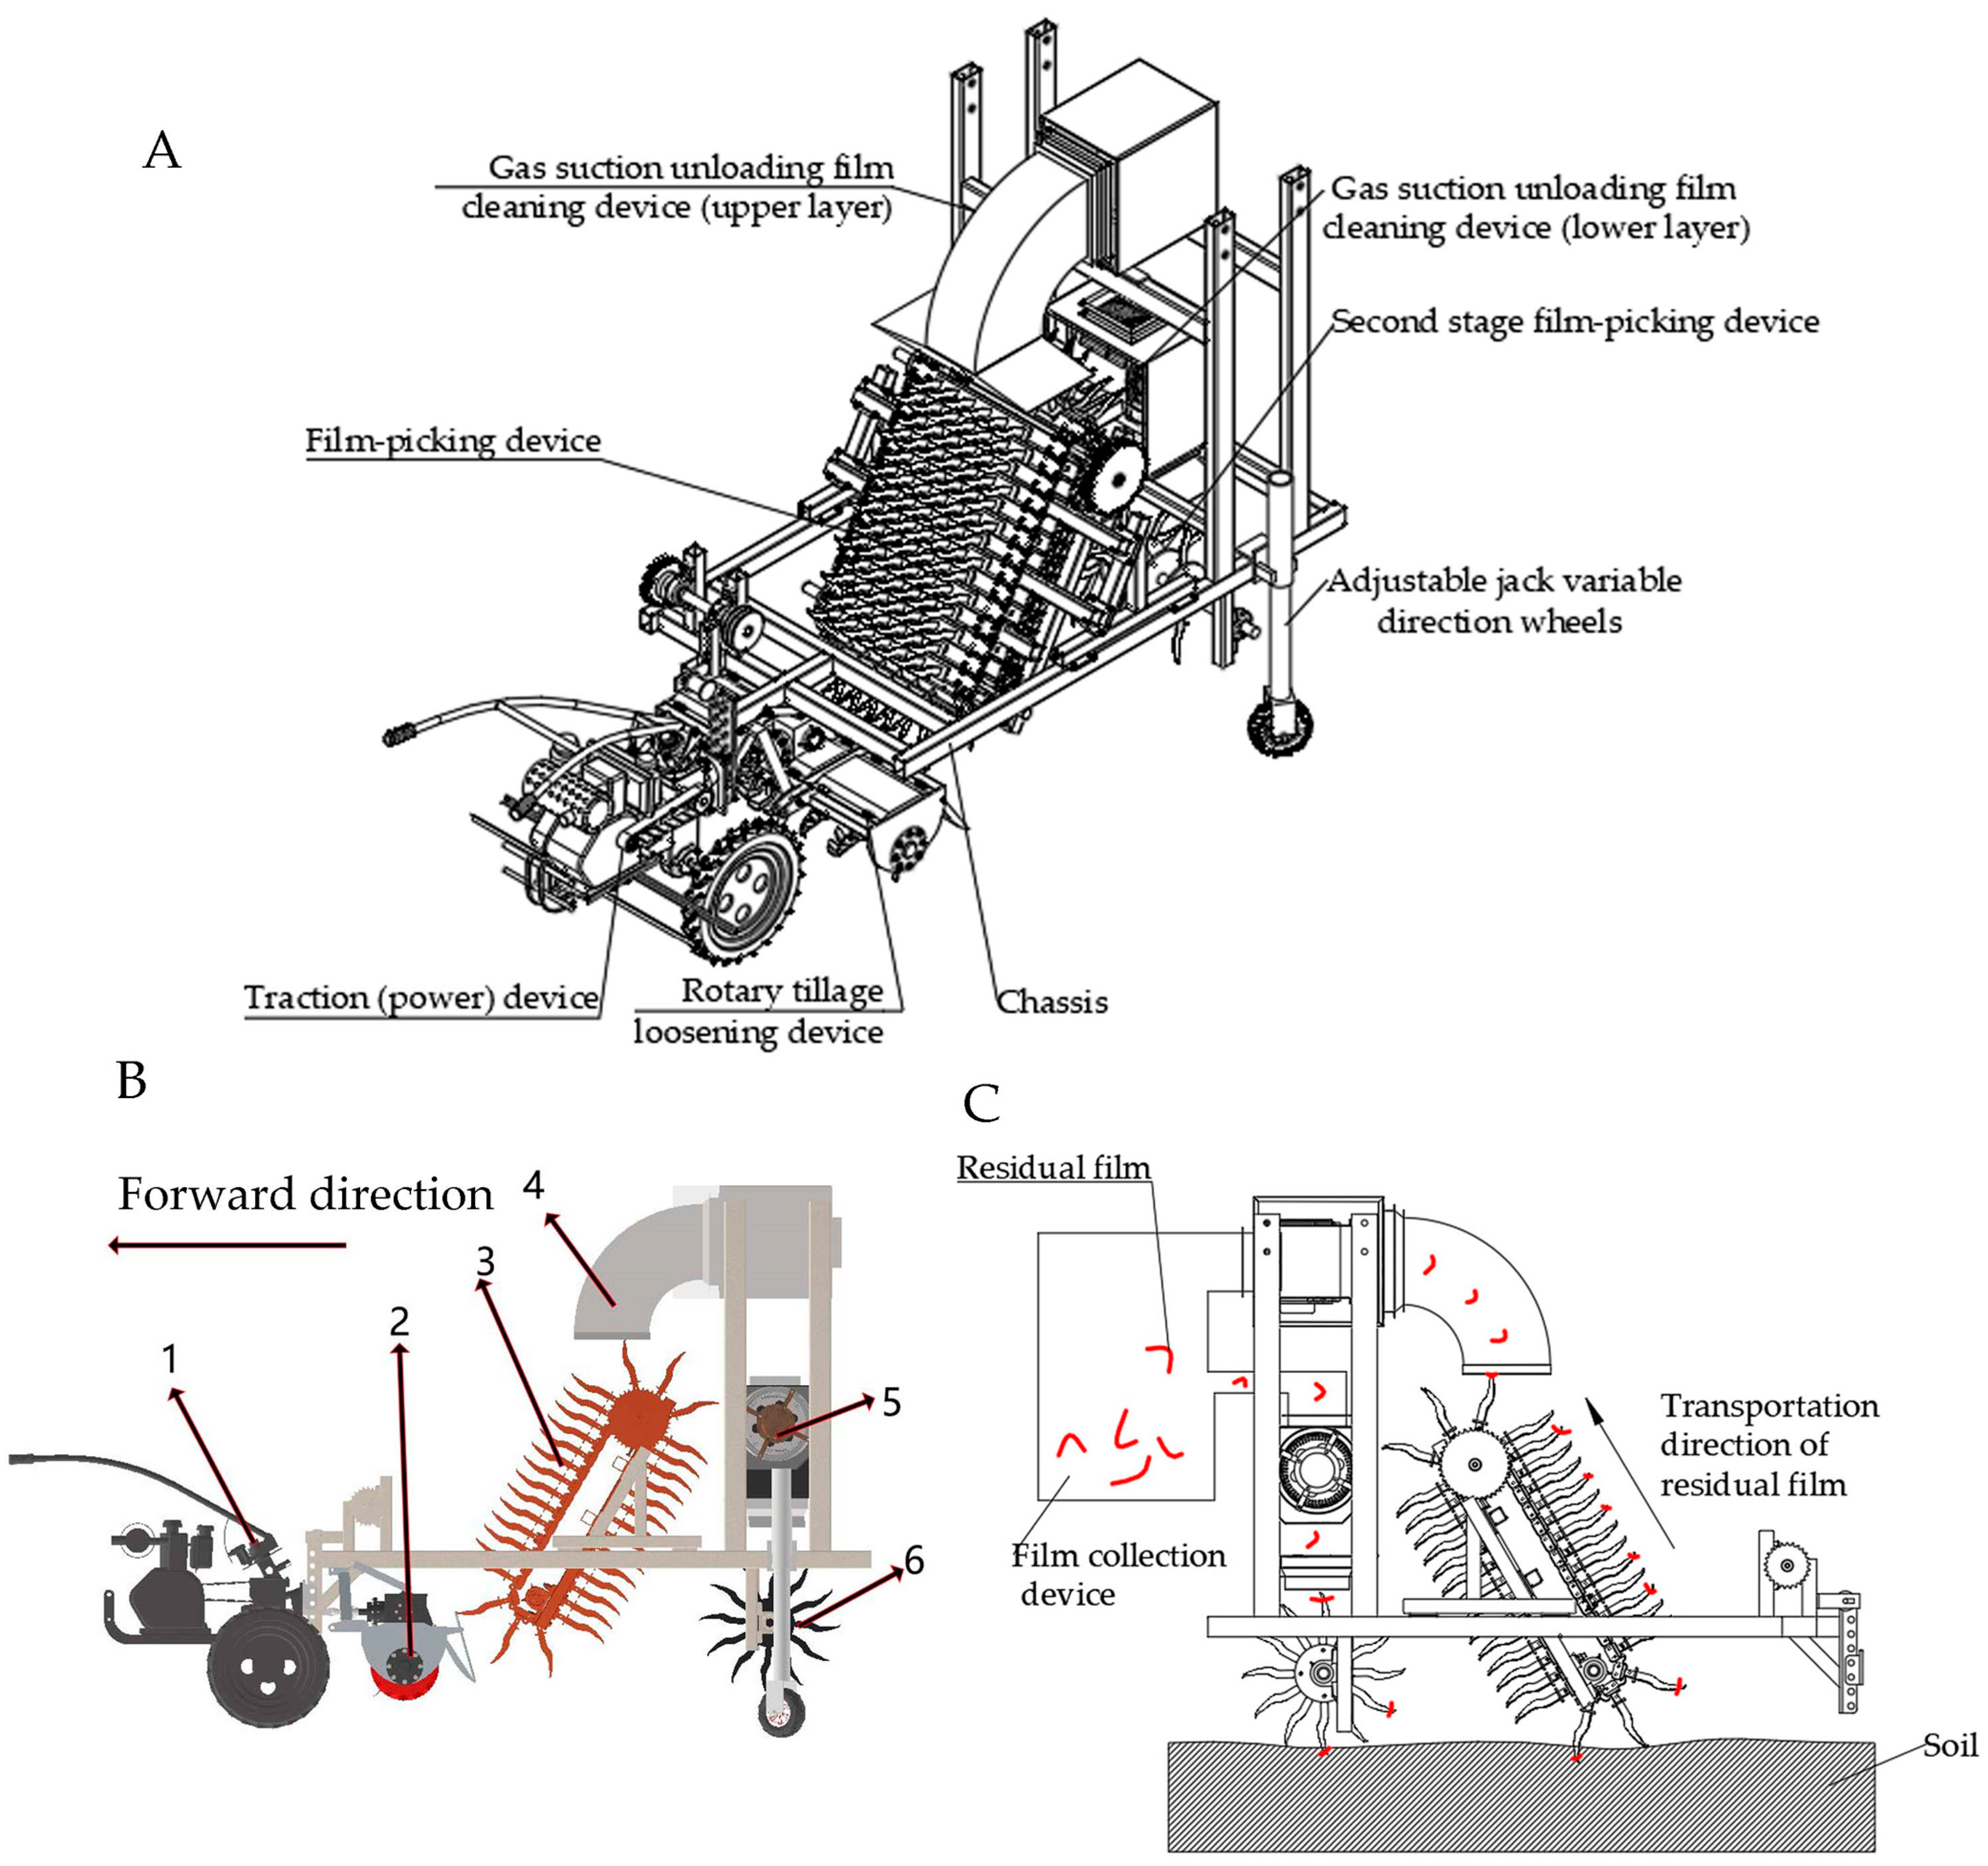
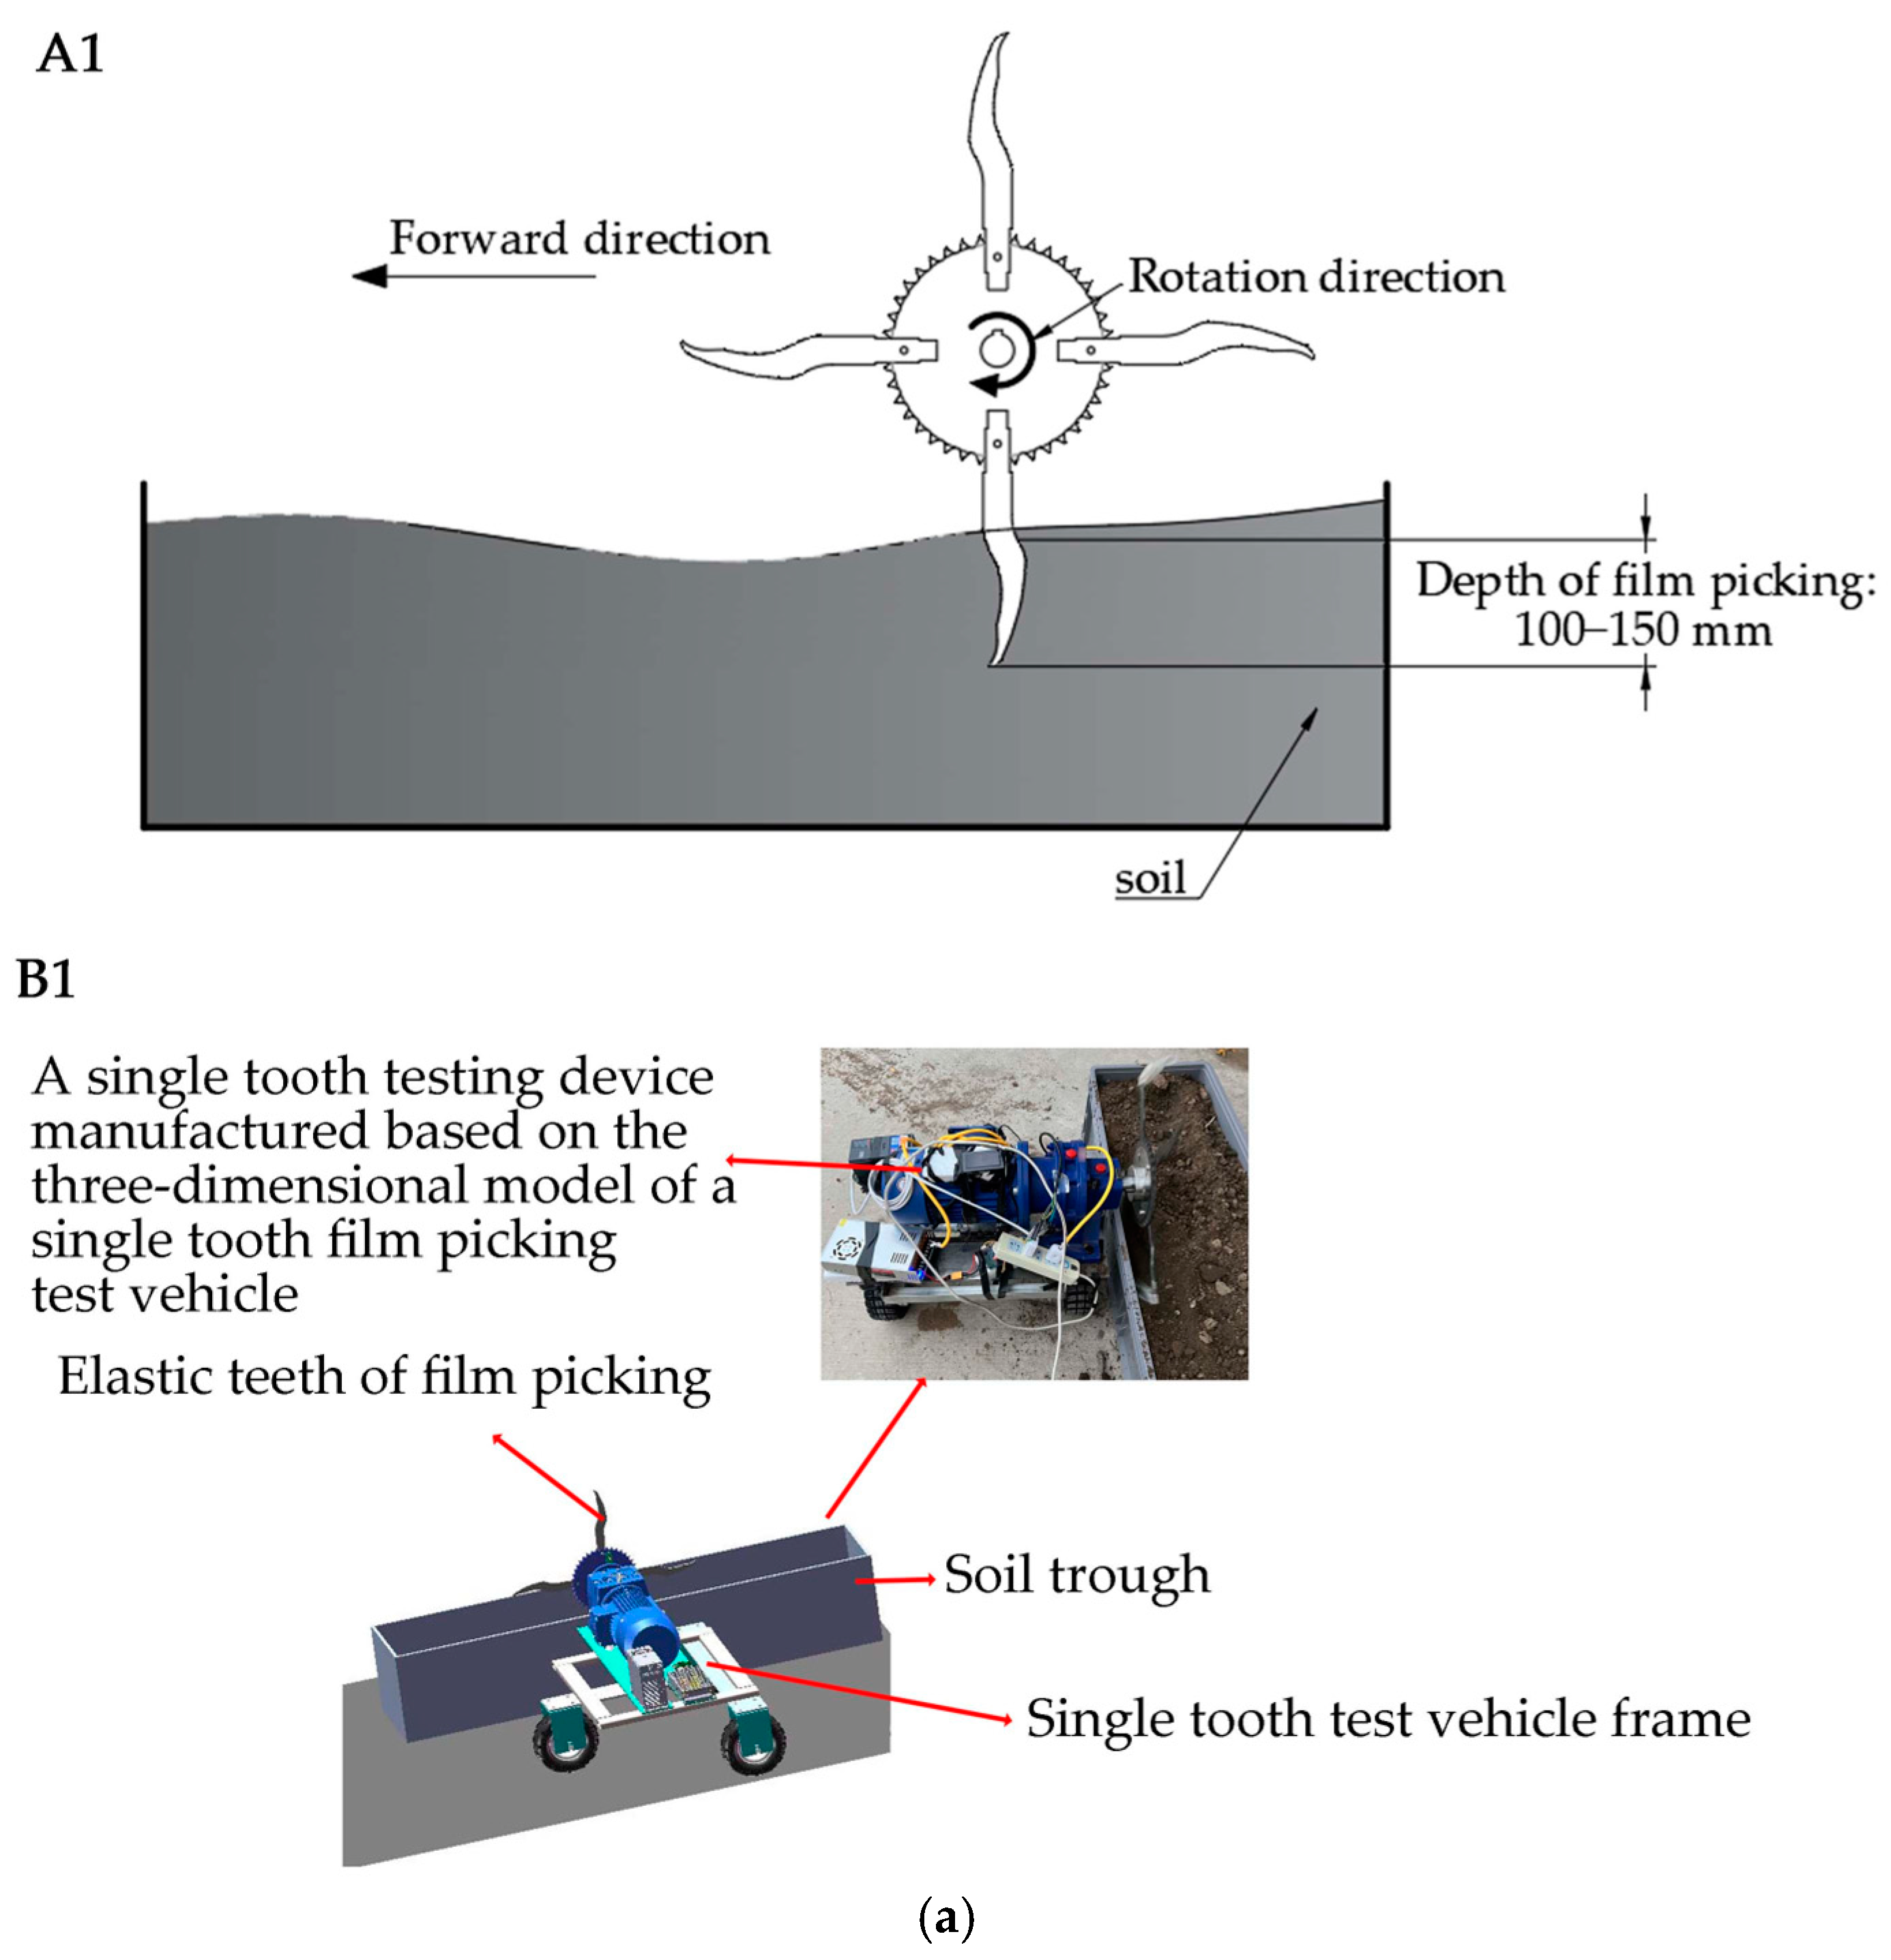
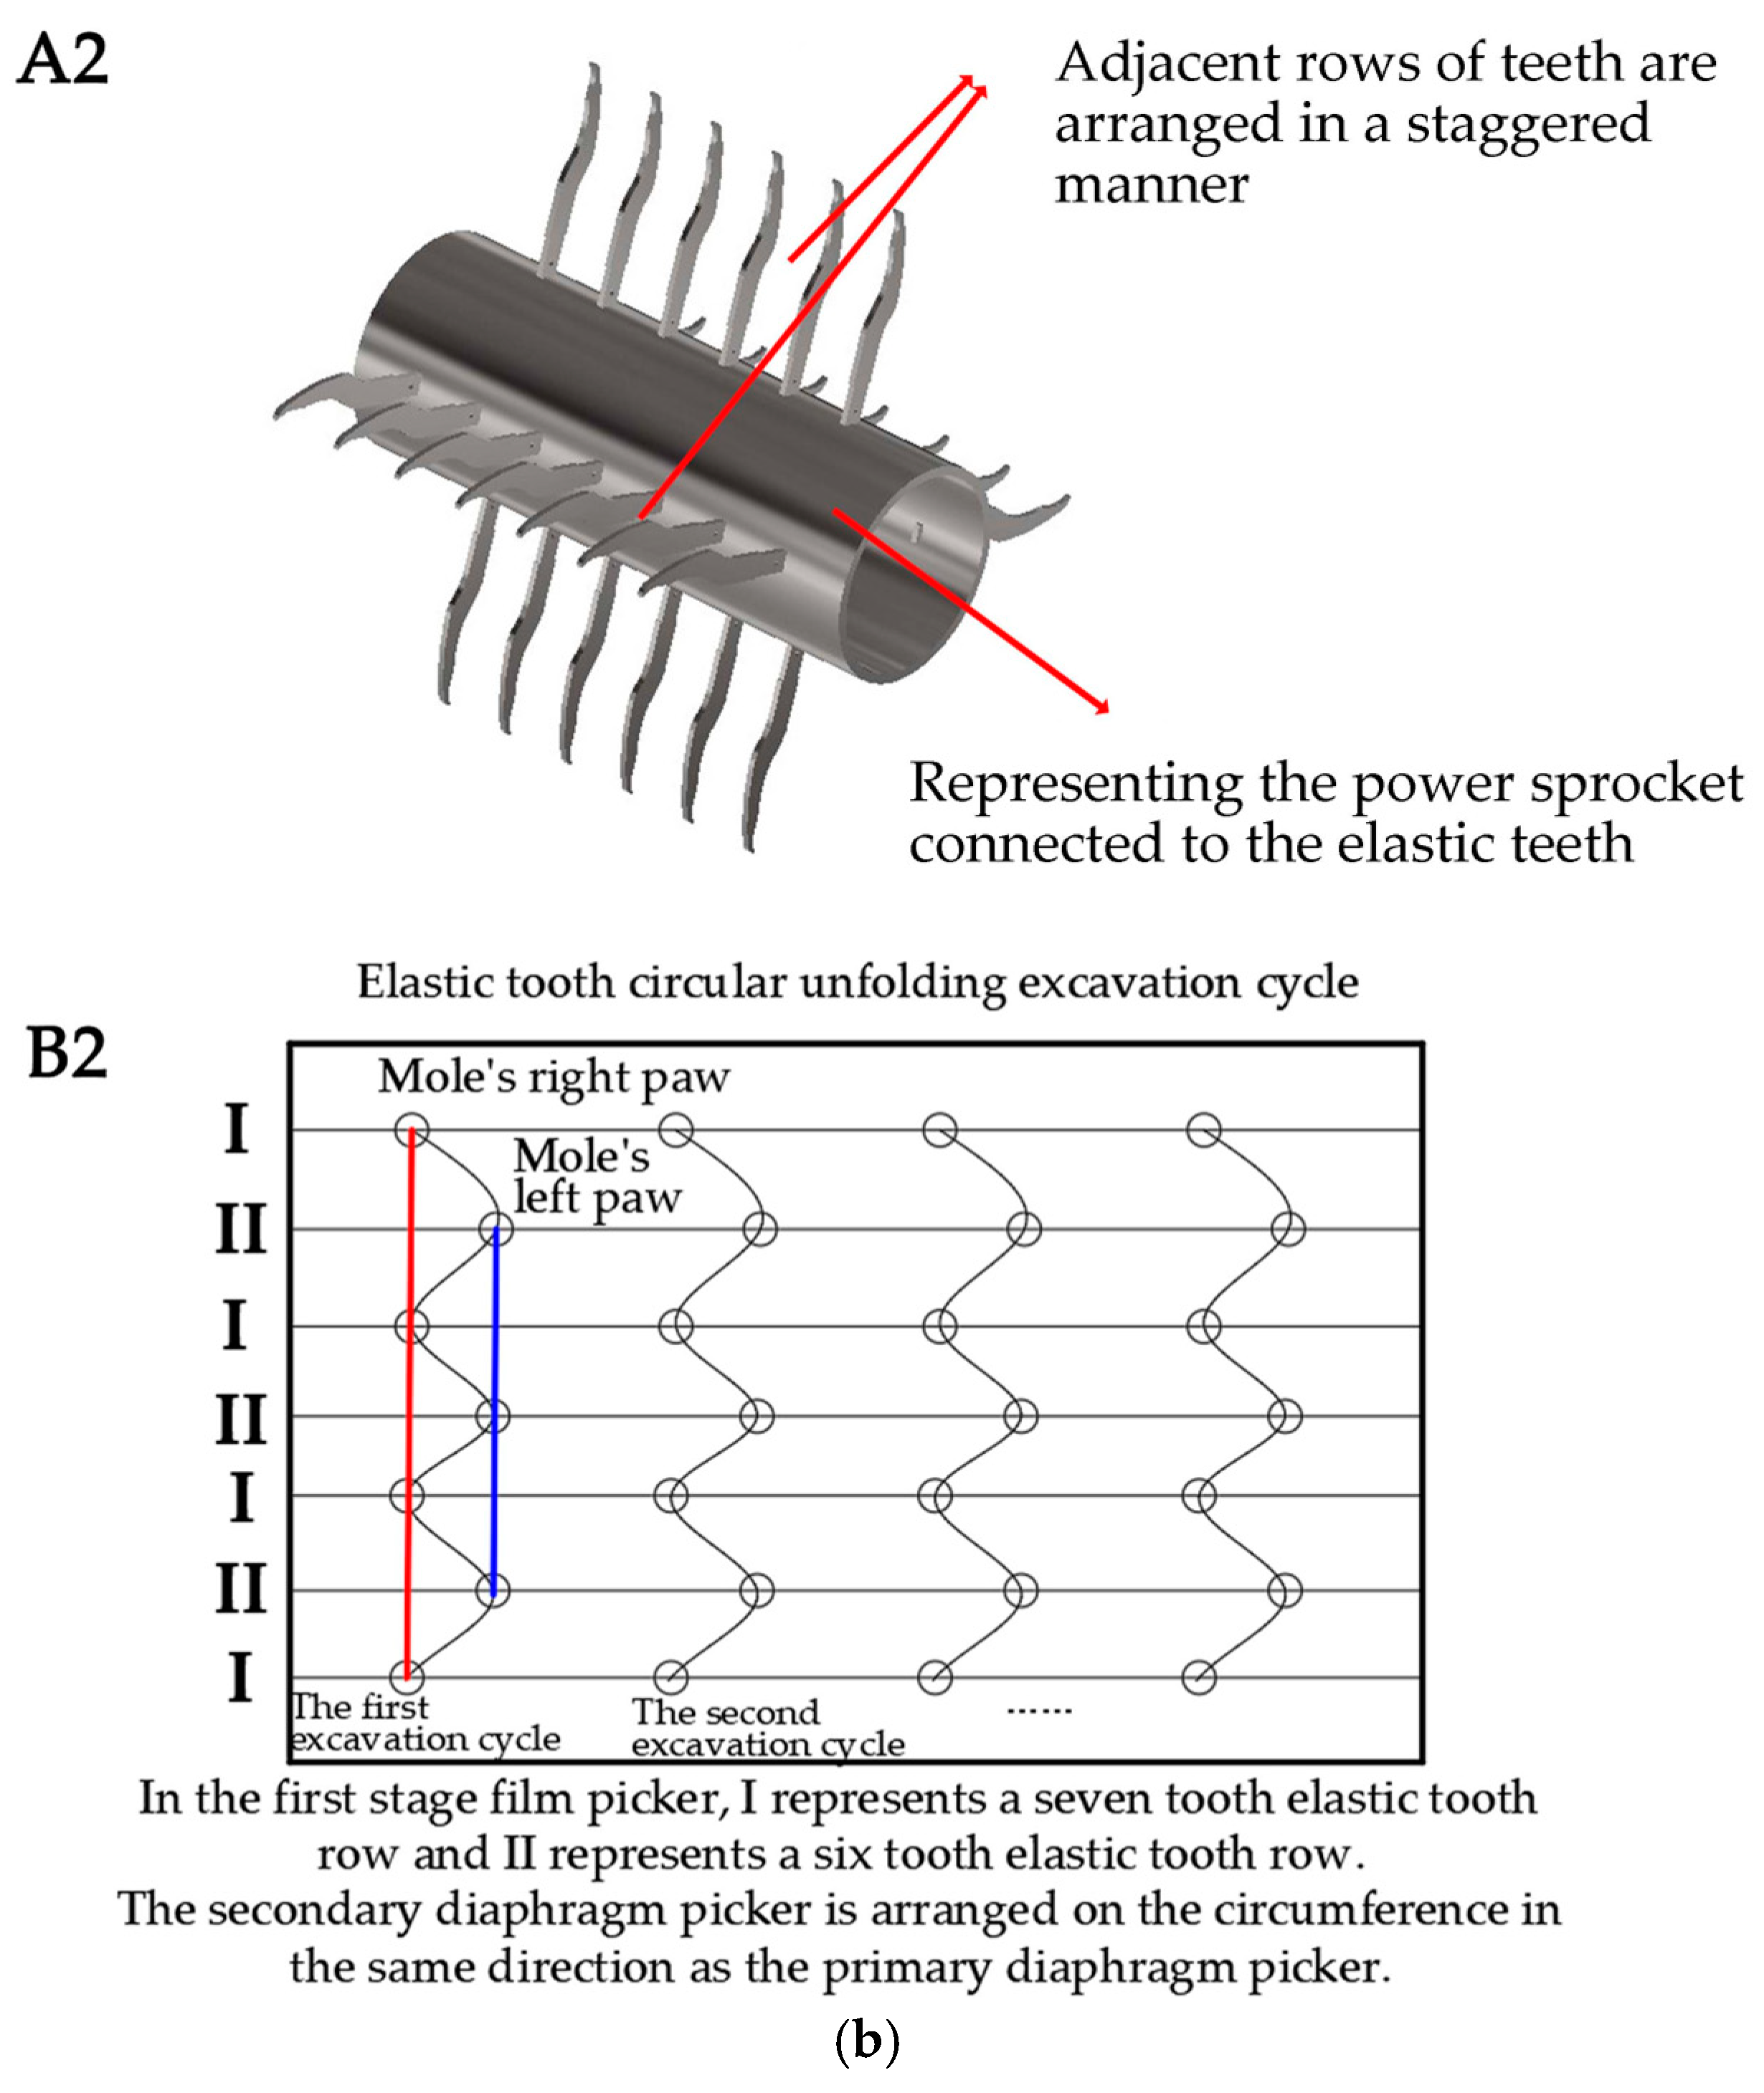
2.2. The Overall Design Scheme of the Residual Film Recycling Machine

This article compares and analyzes various types of residual film recycling machines and proposes the following plan: A soil crushing device was installed at the front of the machine, with elastic teeth used to lift the film. The film was then transported via airflow through an air duct to the film collection box, where it was unloaded and separated from impurities (see Figure 3A,B). This study focuses on a multi-tooth film-lifting device, which lifts the residual film from the ground and transports it to the collection box with the assistance of wind (see Figure 3C).

2.3. Theoretical Analysis and Simulation of the Film-Picking Process

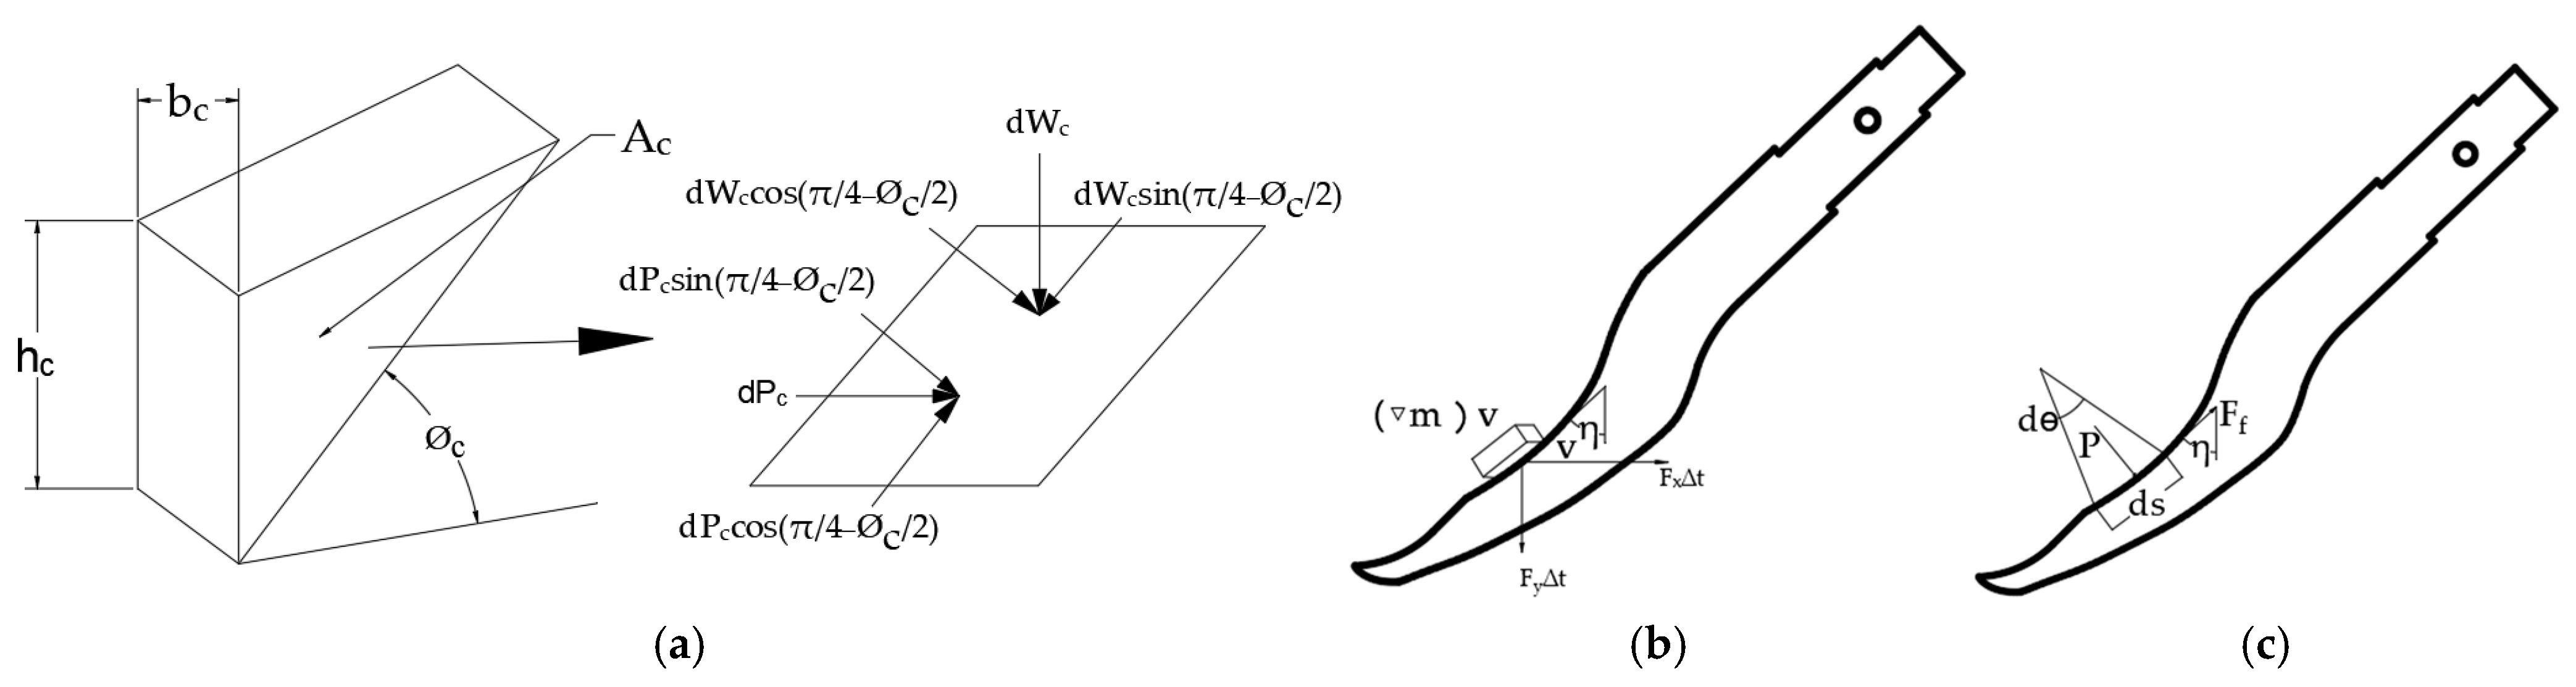
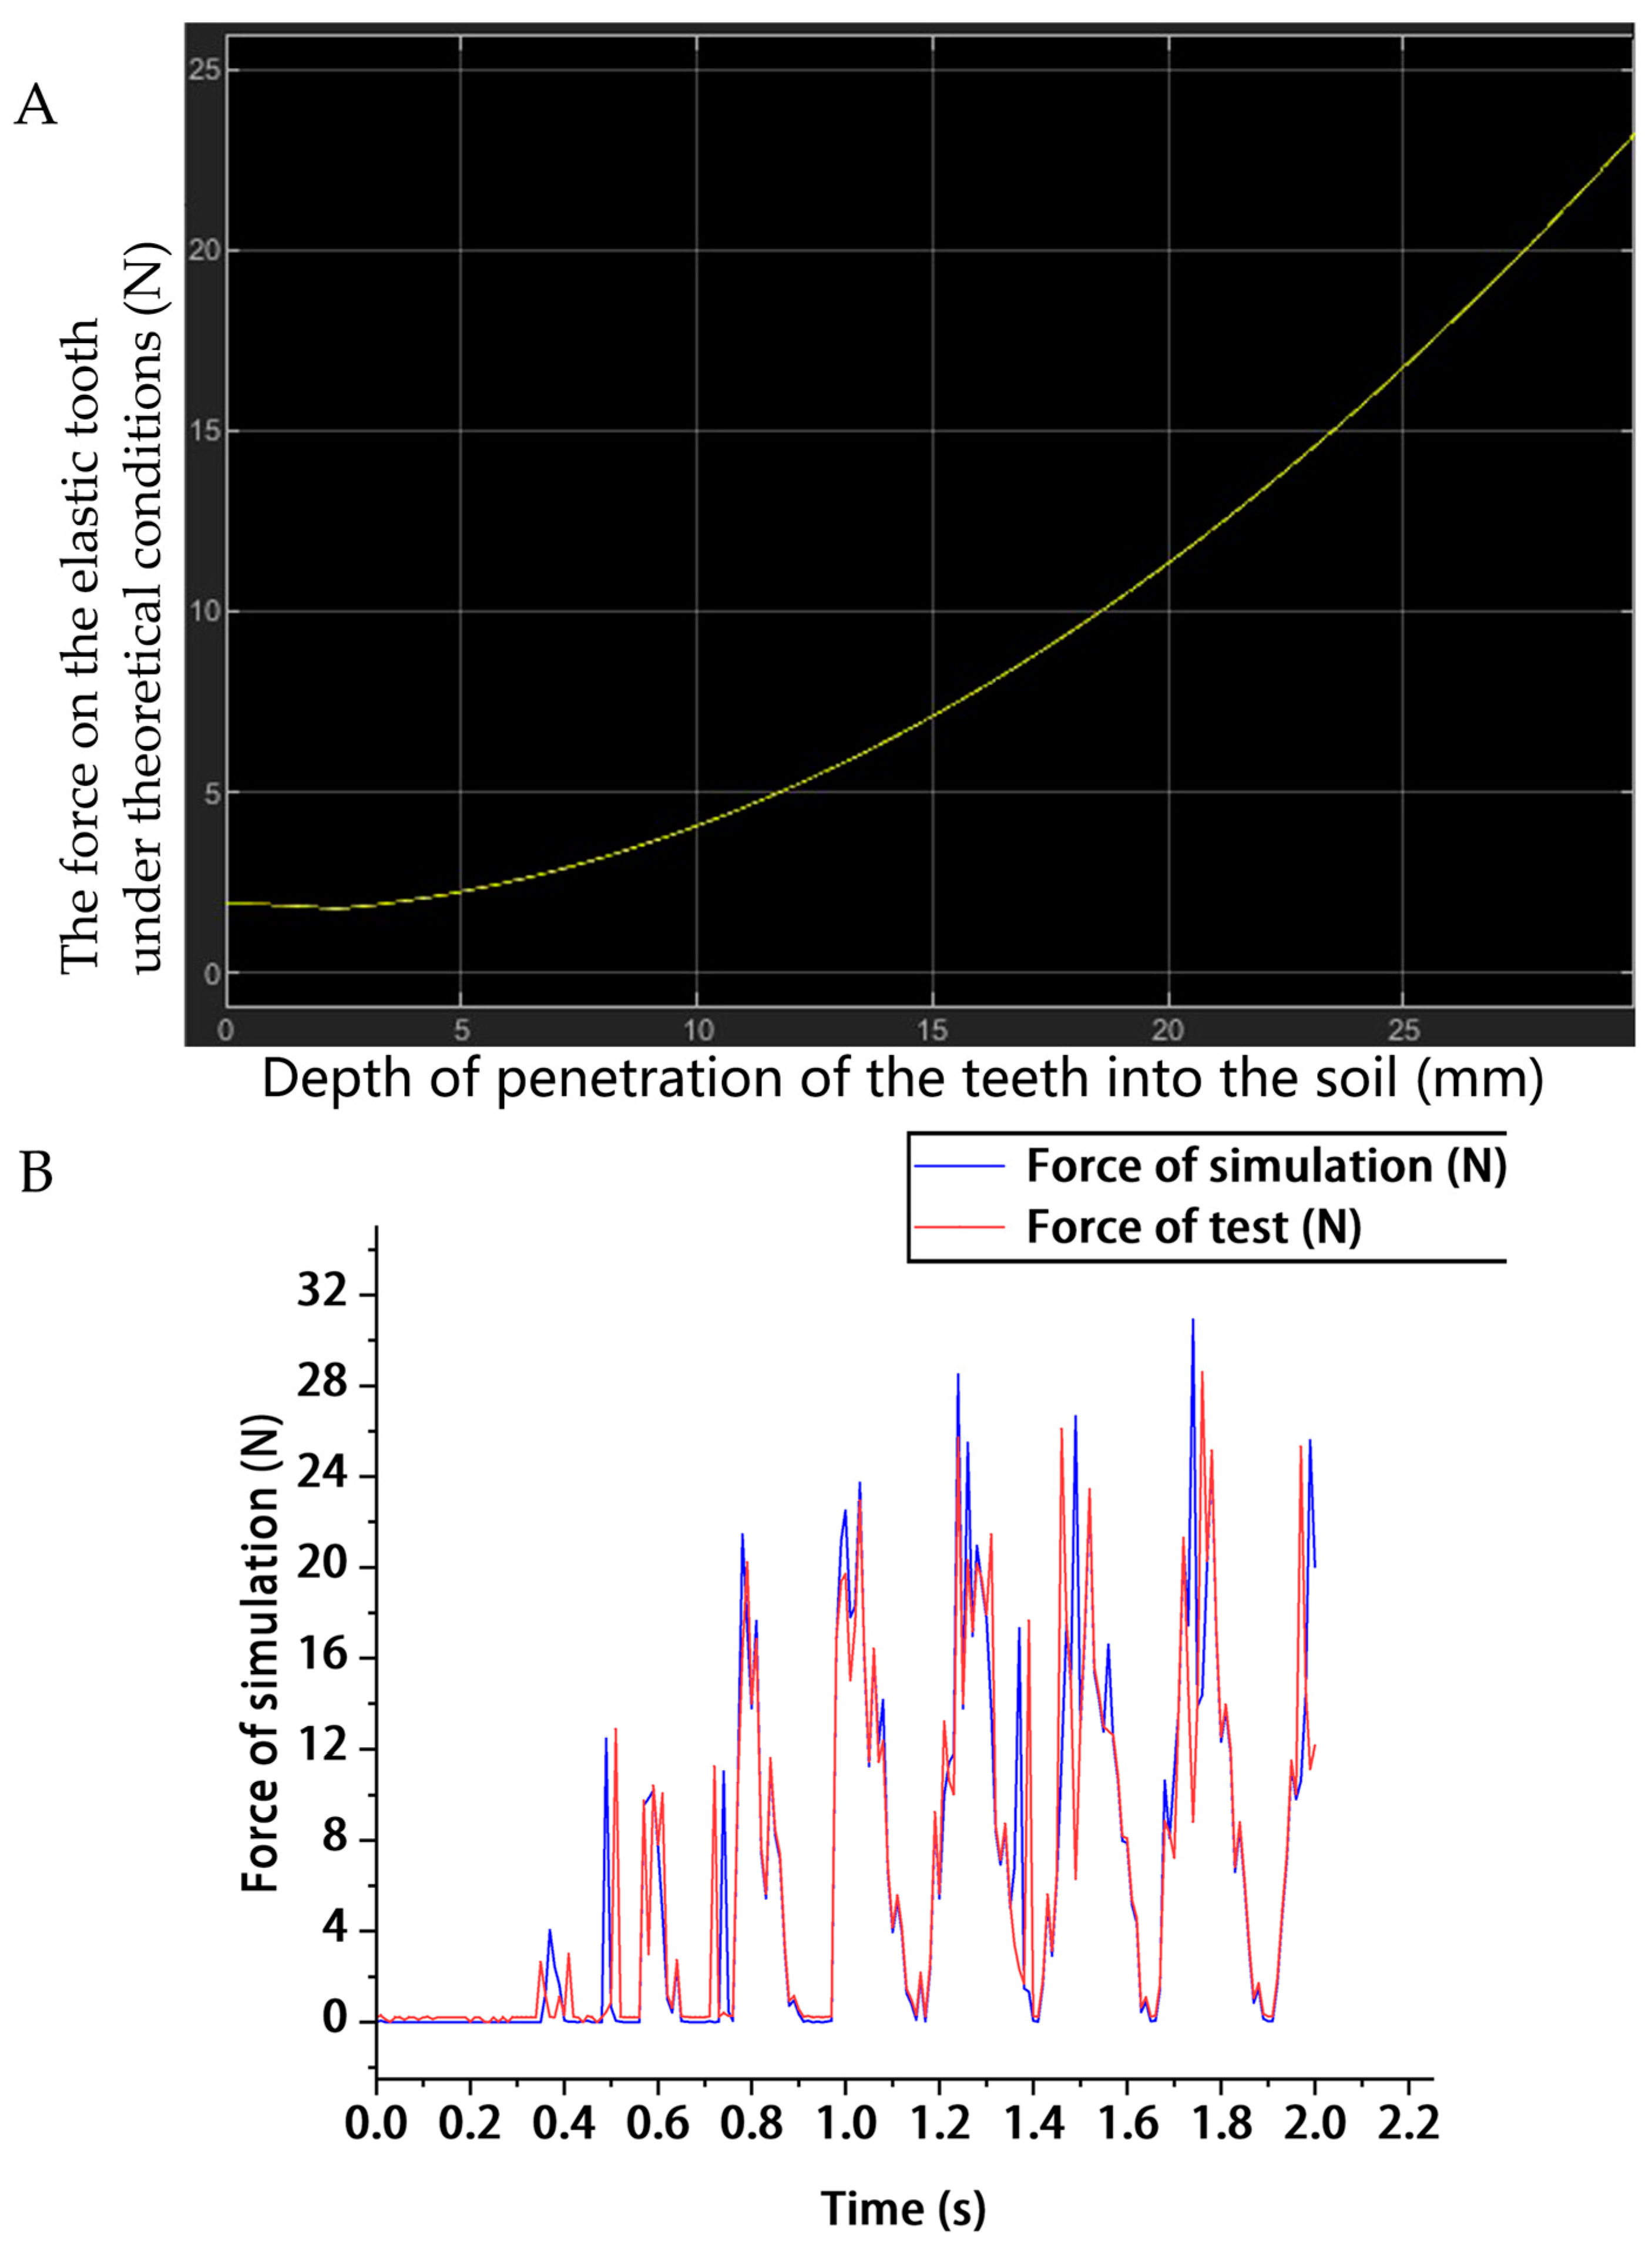
2.3.1. Mathematical Modeling and Simulation Analysis of the Resistance of Tooth Penetration into Soil

When the elastic tooth penetrates the soil, its motion consists of both rotational and forward movements. Based on the mechanical theory of soil cutting and the characteristics of the elastic tooth, a force model for the tooth’s interaction with the soil during the film-lifting process was developed. The resistance encountered by the elastic tooth in the soil includes three main forces: traction force ( F q ), dynamic pressure ( F x ), and sliding friction ( F f 1 ) [40]. The calculation formulas for these forces are provided in Equations (1)–(7). The total force (F) on the elastic tooth during the film-picking process is given by Equation (8).
To determine the forces acting on a unit soil wedge (cutting width: d b , depth: h ), three primary force components must be considered: (1) the cutting traction force d P c , (2) the wedge’s gravitational force d W , and (3) its shear resistance dR (Figure 4a). Soil failure occurs in passive mode during tooth movement, with the failure surface inclined at an angle of ( π 4 2 ) relative to the horizontal plane. The dynamic pressure generated by soil flow along the elastic tooth’s contact surface was analyzed through microelement decomposition (Figure 4b). Each microelement experiences F y (N) and F y (N) forces in the x- and y-directions, respectively. Figure 2C illustrates the frictional resistance analysis of soil microelements sliding along the tooth–soil interface. The microelement length d S can be derived from the curvature radius r, enabling calculation of the initial y-ridge line equation.
d P c = c d b × h sin π 4 2 cos π 4 2 sin π 4 2 tan + ρ s o i l g · d b h 2 2 tan π 4 2 sin π 4 2 + cos π 4 2 tan cos π 4 2 sin π 4 2 tan
P c = d P c
R = c h · d b sin π 4 2 + d P c sin π 4 2 + d W cos π 4 2 tan
F q = P c R × cos π 4 2
F x = ρ s o i l A T r e n c h w a l l v 2 1 sin η
η = 90 ° arctan d y d x
F f 1 = e μ θ μ P r e μ θ d θ + C sin η
F = F q + F x + F f 1 = [ c d b × h sin π 4 2 cos ( π 4 2 ) sin π 4 2 tan + ρ s o i l g · d b h 2 2 tan ( π 4 2 ) sin π 4 2 + cos ( π 4 2 ) tan cos ( π 4 2 ) sin π 4 2 tan ] [ c h · d b sin π 4 2 + d P c sin π 4 2 + d W cos π 4 2 tan ] + ρ s o i l A T r e n c h w a l l v 2 1 cos arctan d y d x + e μ θ ( μ P ( 1 + y 2 ) 3 2 y e μ θ d θ + C ) × cos ( arctan d y d x )
where b is the width ( 0.006   m ); h is the depth ( 0.12   m ); is the internal friction angle of the soil ( 30 ° ); c is the cohesion of soil ( 0.3 0.6 , set as 0.3 here), with the specific value determined based on the particle size of the soil; ρ s o i l is the density of soil ( 1610   K g · m 3 ); A T r e n c h w a l l = d b × h = 0.00072   m 2 is the contact surface between the elastic tooth and the soil; d P c is the unit resistance generated during the process of cutting soil, N; R is the soil wedge shear strength, N; d W is the unit soil wedge gravity, N; μ is the friction coefficient between the soil and the elastic teeth ( 0.50 ); v is the forward speed of the film-picking device, m · s 1 .

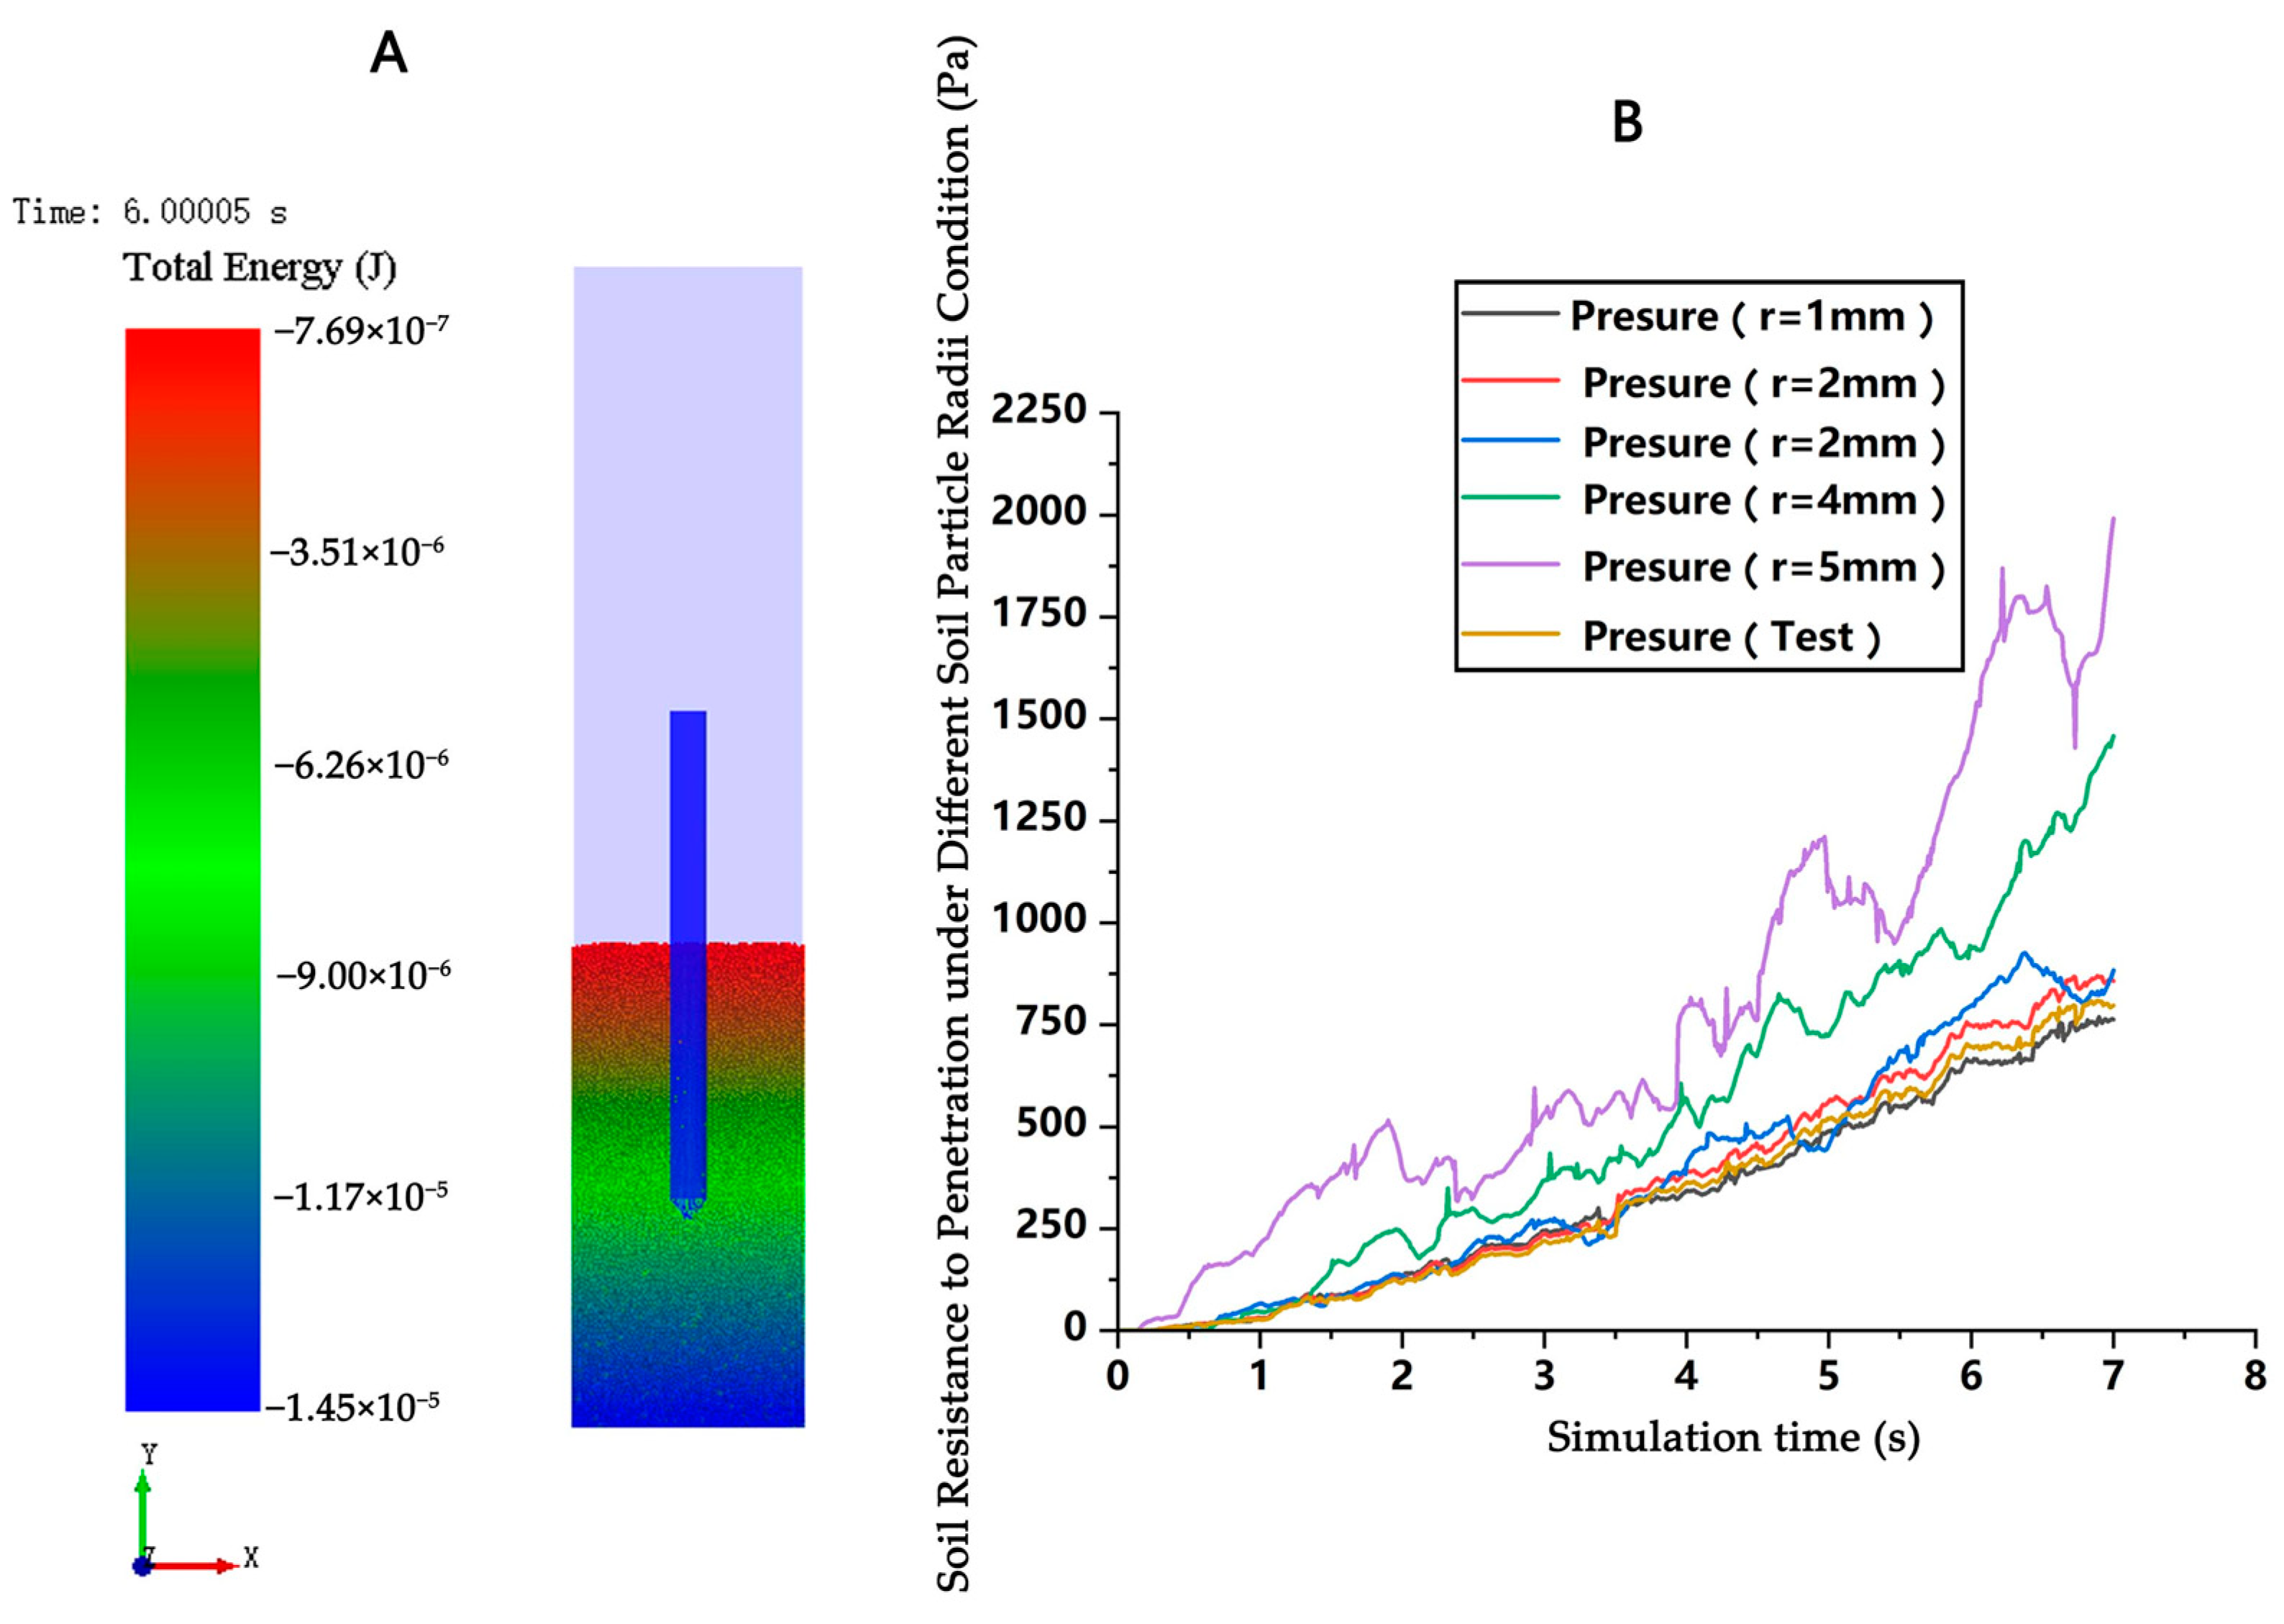
2.3.2. Analysis of the Impact of Particle Size on Soil Resistance to Penetration During Simulation Using the DEM Method

Analyzing the impact of particle size on soil resistance to penetration during simulation helps select the optimal particle radius, enhancing accuracy and reducing simulation time. In the simulation, the radius of soil particles varied from 1 mm to 5 mm, and the corresponding soil resistance to penetration was predicted using EDEM 2021. The results were compared to determine the most suitable soil particle radius for the simulation. High-precision soil resistance to penetration meters were used to measure the actual soil resistance to penetration in the experiments. By comparing the data and conducting error analysis between the simulation and experimental results, the feasible range of particle sizes was determined. In subsequent simulations, the selected particle size range served as the basis for determining soil particle size. The soil resistance to penetration measurement instrument (Zhejiang Topu Yunnong Technology Co., Ltd., Hangzhou, China) is shown in Figure 5A,B. Soil resistance to penetration was monitored through DEM-MBD coupling, and the simulation results were compared with the experimental data to analyze the error in soil resistance to penetration. This comparison laid the foundation for simulating the resistance experienced by the elastic teeth during the film-picking process.

2.3.3. The Influence of Particle Size on the Accuracy of Resistance Prediction Using the DEM Method

To ensure simulation accuracy while reducing simulation time, particle size was optimized in the DEM-MBD coupling simulation to analyze the resistance and soil disturbance of the elastic tooth. The single-tooth test vehicle and soil tank (Figure 6a) were used for bench tests, with a pressure sensor on the test vehicle for real-time data collection. The simulated cross section was measured in EDEM 2021, and the pressure on the tooth was recorded using RECURDYN V9R5. This approach can be extended to other DEM applications, enhancing both accuracy and versatility.
The test device, as shown in Figure 6, consists of a chassis, a motor, a sprocket, elastic teeth, a frequency converter, a switch power supply, and speed measurement instruments. The forward and rotational directions of the film picker are also illustrated. The frequency converter controls the speed of the film-picking gear, with power wheels driven by speed-regulating motors. The device’s walking and picking speeds and the ratio between them are adjustable via remote control. Soil depth in the tank can be controlled to regulate penetration. The pressure sensor at the tooth tip measures the force during film picking, allowing a comparison of DEM-simulated soil resistance to penetration with the experimental results. This multi-factor test device enables the adjustment of walking speed, film-picking speed, and soil penetration depth, all affecting the film-picking rate.
The movement of soil and the residual film under the action of elastic teeth is crucial for evaluating the effectiveness of the teeth and validating simulation accuracy. By comparing simulation and experimental movement trends, the efficacy of the elastic teeth can be assessed. In the multi-tooth film-picking device, adjacent rows of elastic teeth are alternately arranged to enhance soil disturbance, similar to how a mole’s claws alternate while digging. This arrangement, shown in Figure 6b, simulates the soil ejection process. During the film-picking process, the actual movement of the experimental device resembles the rotational motion of a small drum. To reduce computational load, the multi-tooth device was simplified into a circular drum with elastically arranged teeth. A more complex model would require significant computational resources and slow simulation speeds. The simplified device for simulation, shown in Figure 6b(A2,B2), was validated by comparing the simulated and experimental movement trends of the soil and residual film. For more precise analysis, the soil was divided into two layers with different colors. To reduce complexity, the soil layer not in contact with the residual film had a particle radius of 2 mm, while the surface layer in contact with the film had a radius of 1 mm, improving simulation accuracy.

2.4. Optimization Plan for the Parameters of a Toothed Chain Tillage-Layer Residual Film Recycling Machine

A Box–Behnken experiment was conducted with three factors as influencing factors, which are walking speed, film-picking speed, and soil penetration depth. These three factors are convenient to control during the film harvesting process. Therefore, the improved film-picking test device was designed to optimize the optimal conditions of these three factors in order to optimize the working parameters during the residual film recycling process and provide a reference for film-picking working parameters in actual working environments. The walking speed is based on 3 k m · h 1 (0.83 m · s 1 ), 5 k m · h 1 (1.39 m · s 1 ), and 7 k m · h 1 (1.94 m · s 1 ) as the basic data, and the rotational speed is shown in Table 2 The soil penetration requirement for the cultivation layer is 150 mm. Therefore, the experimental factors and levels for optimizing the working parameters of film lifting are shown in Table 2.

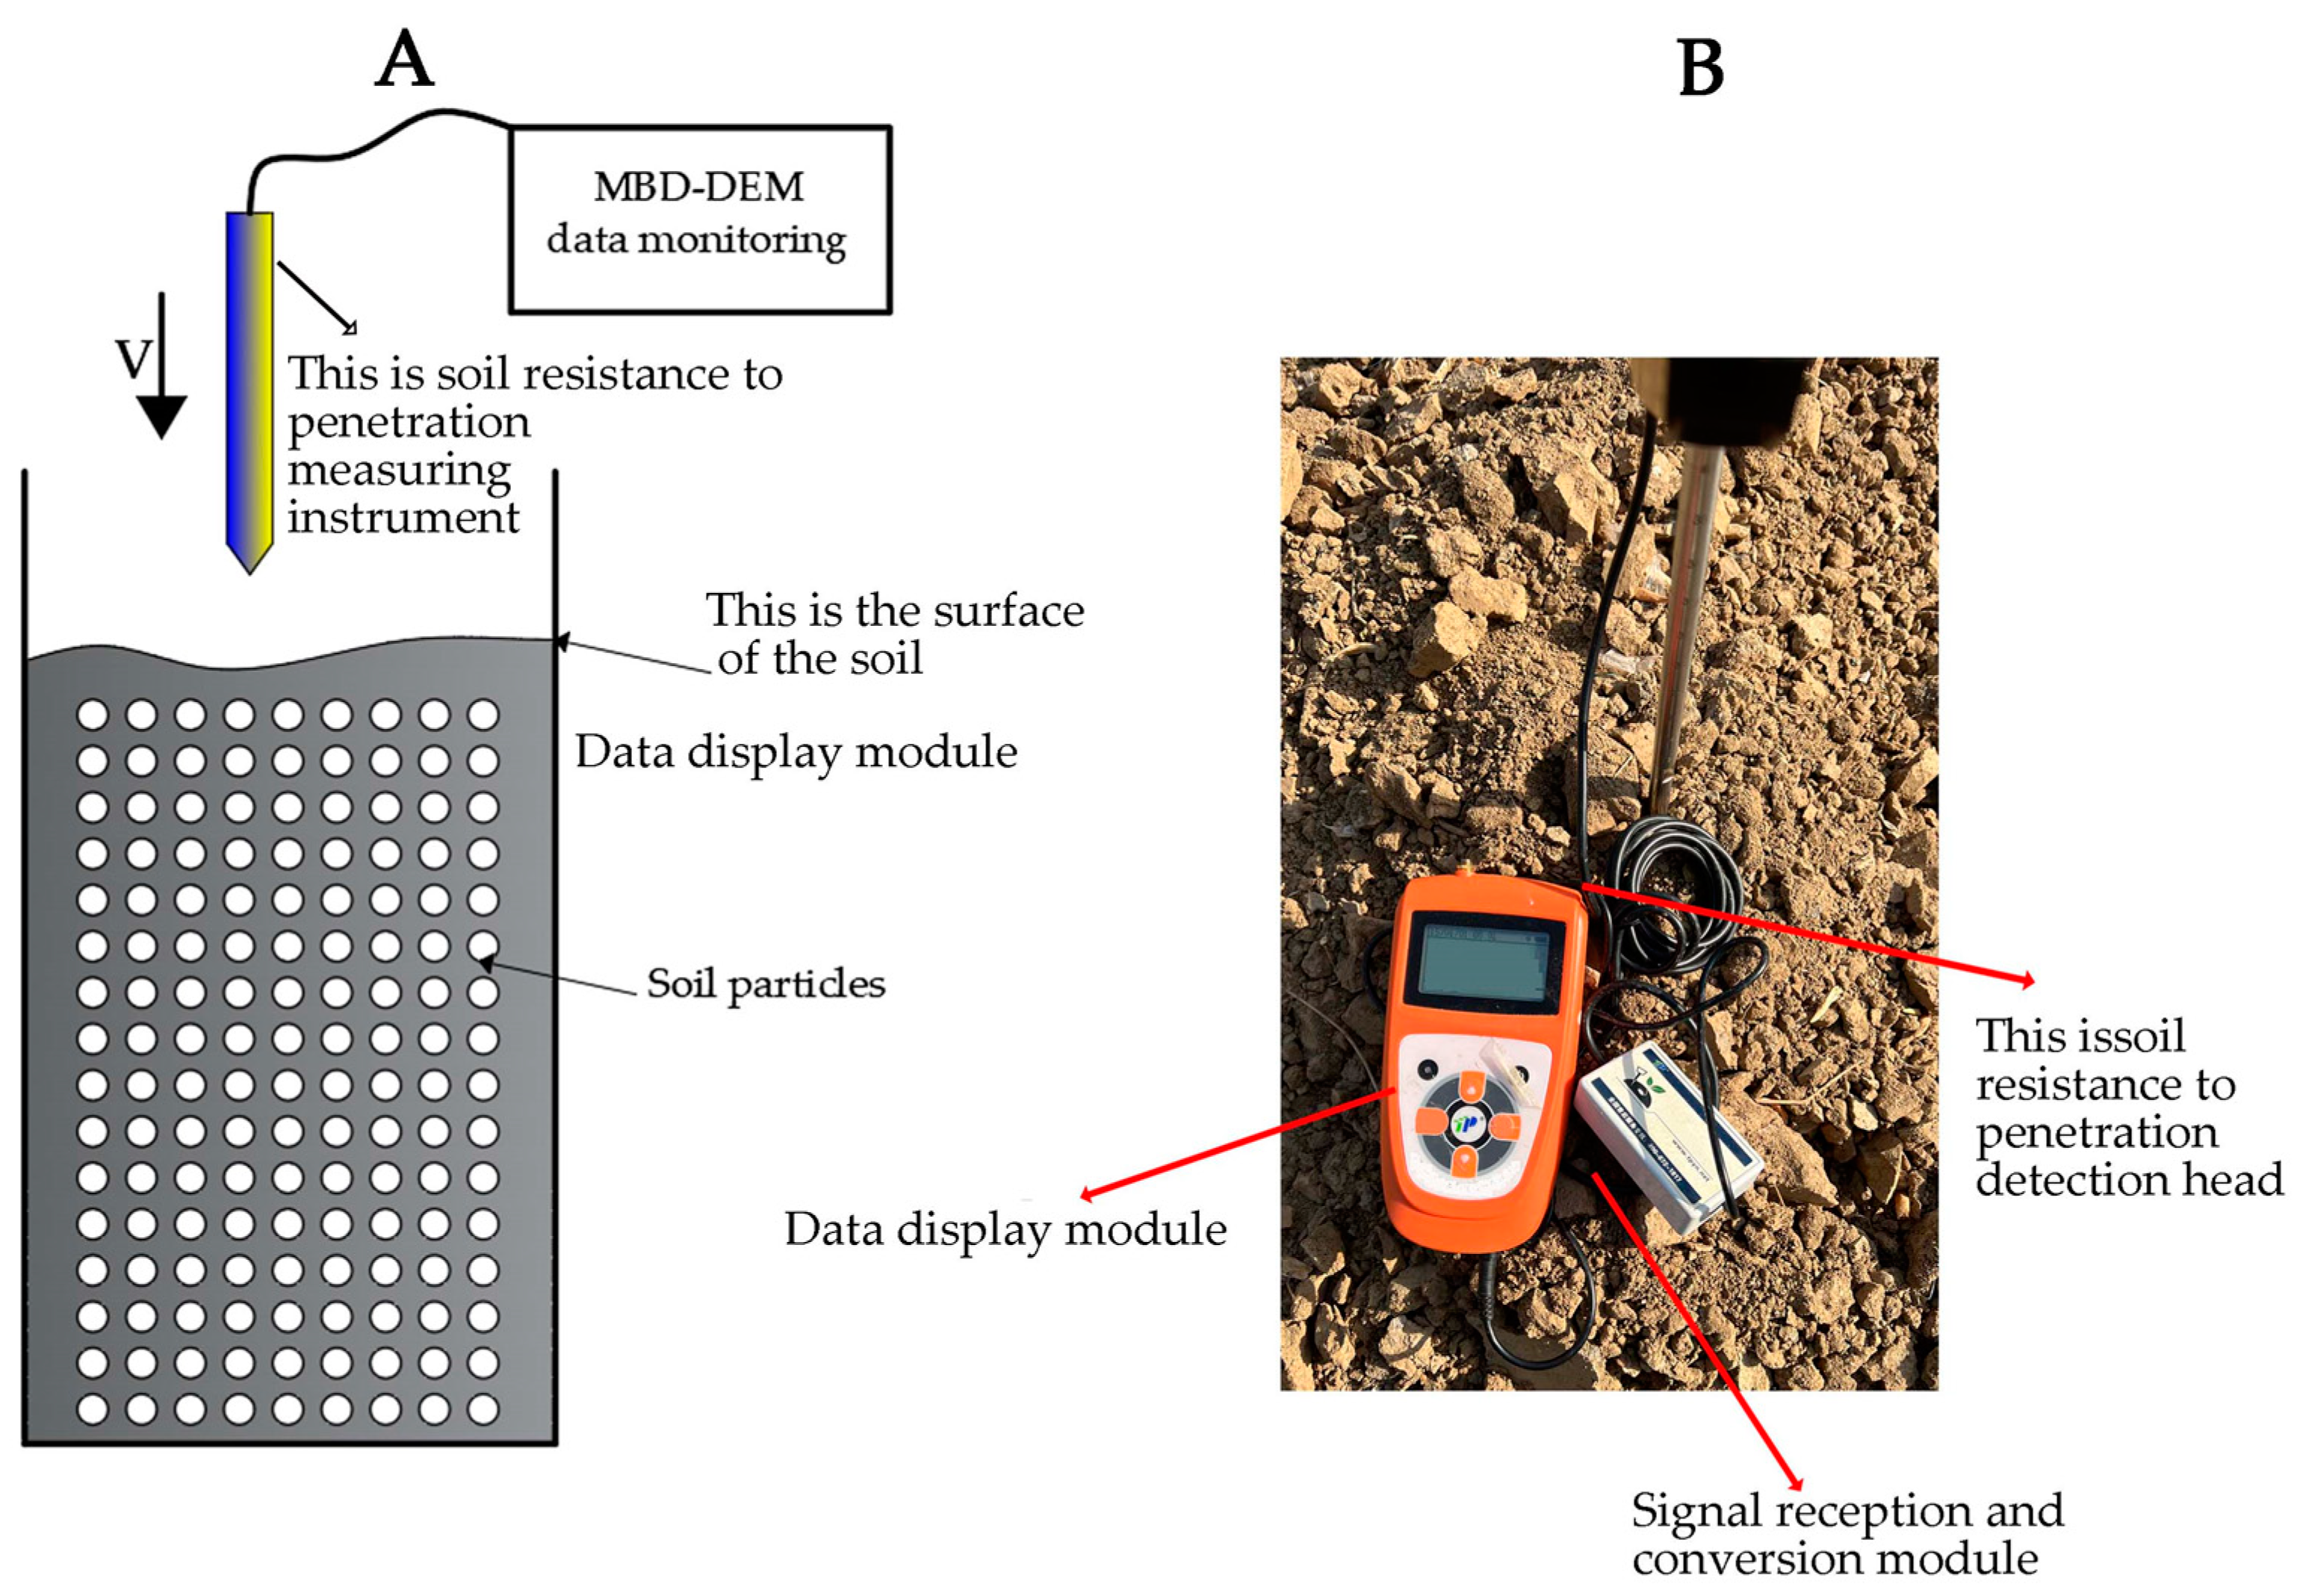
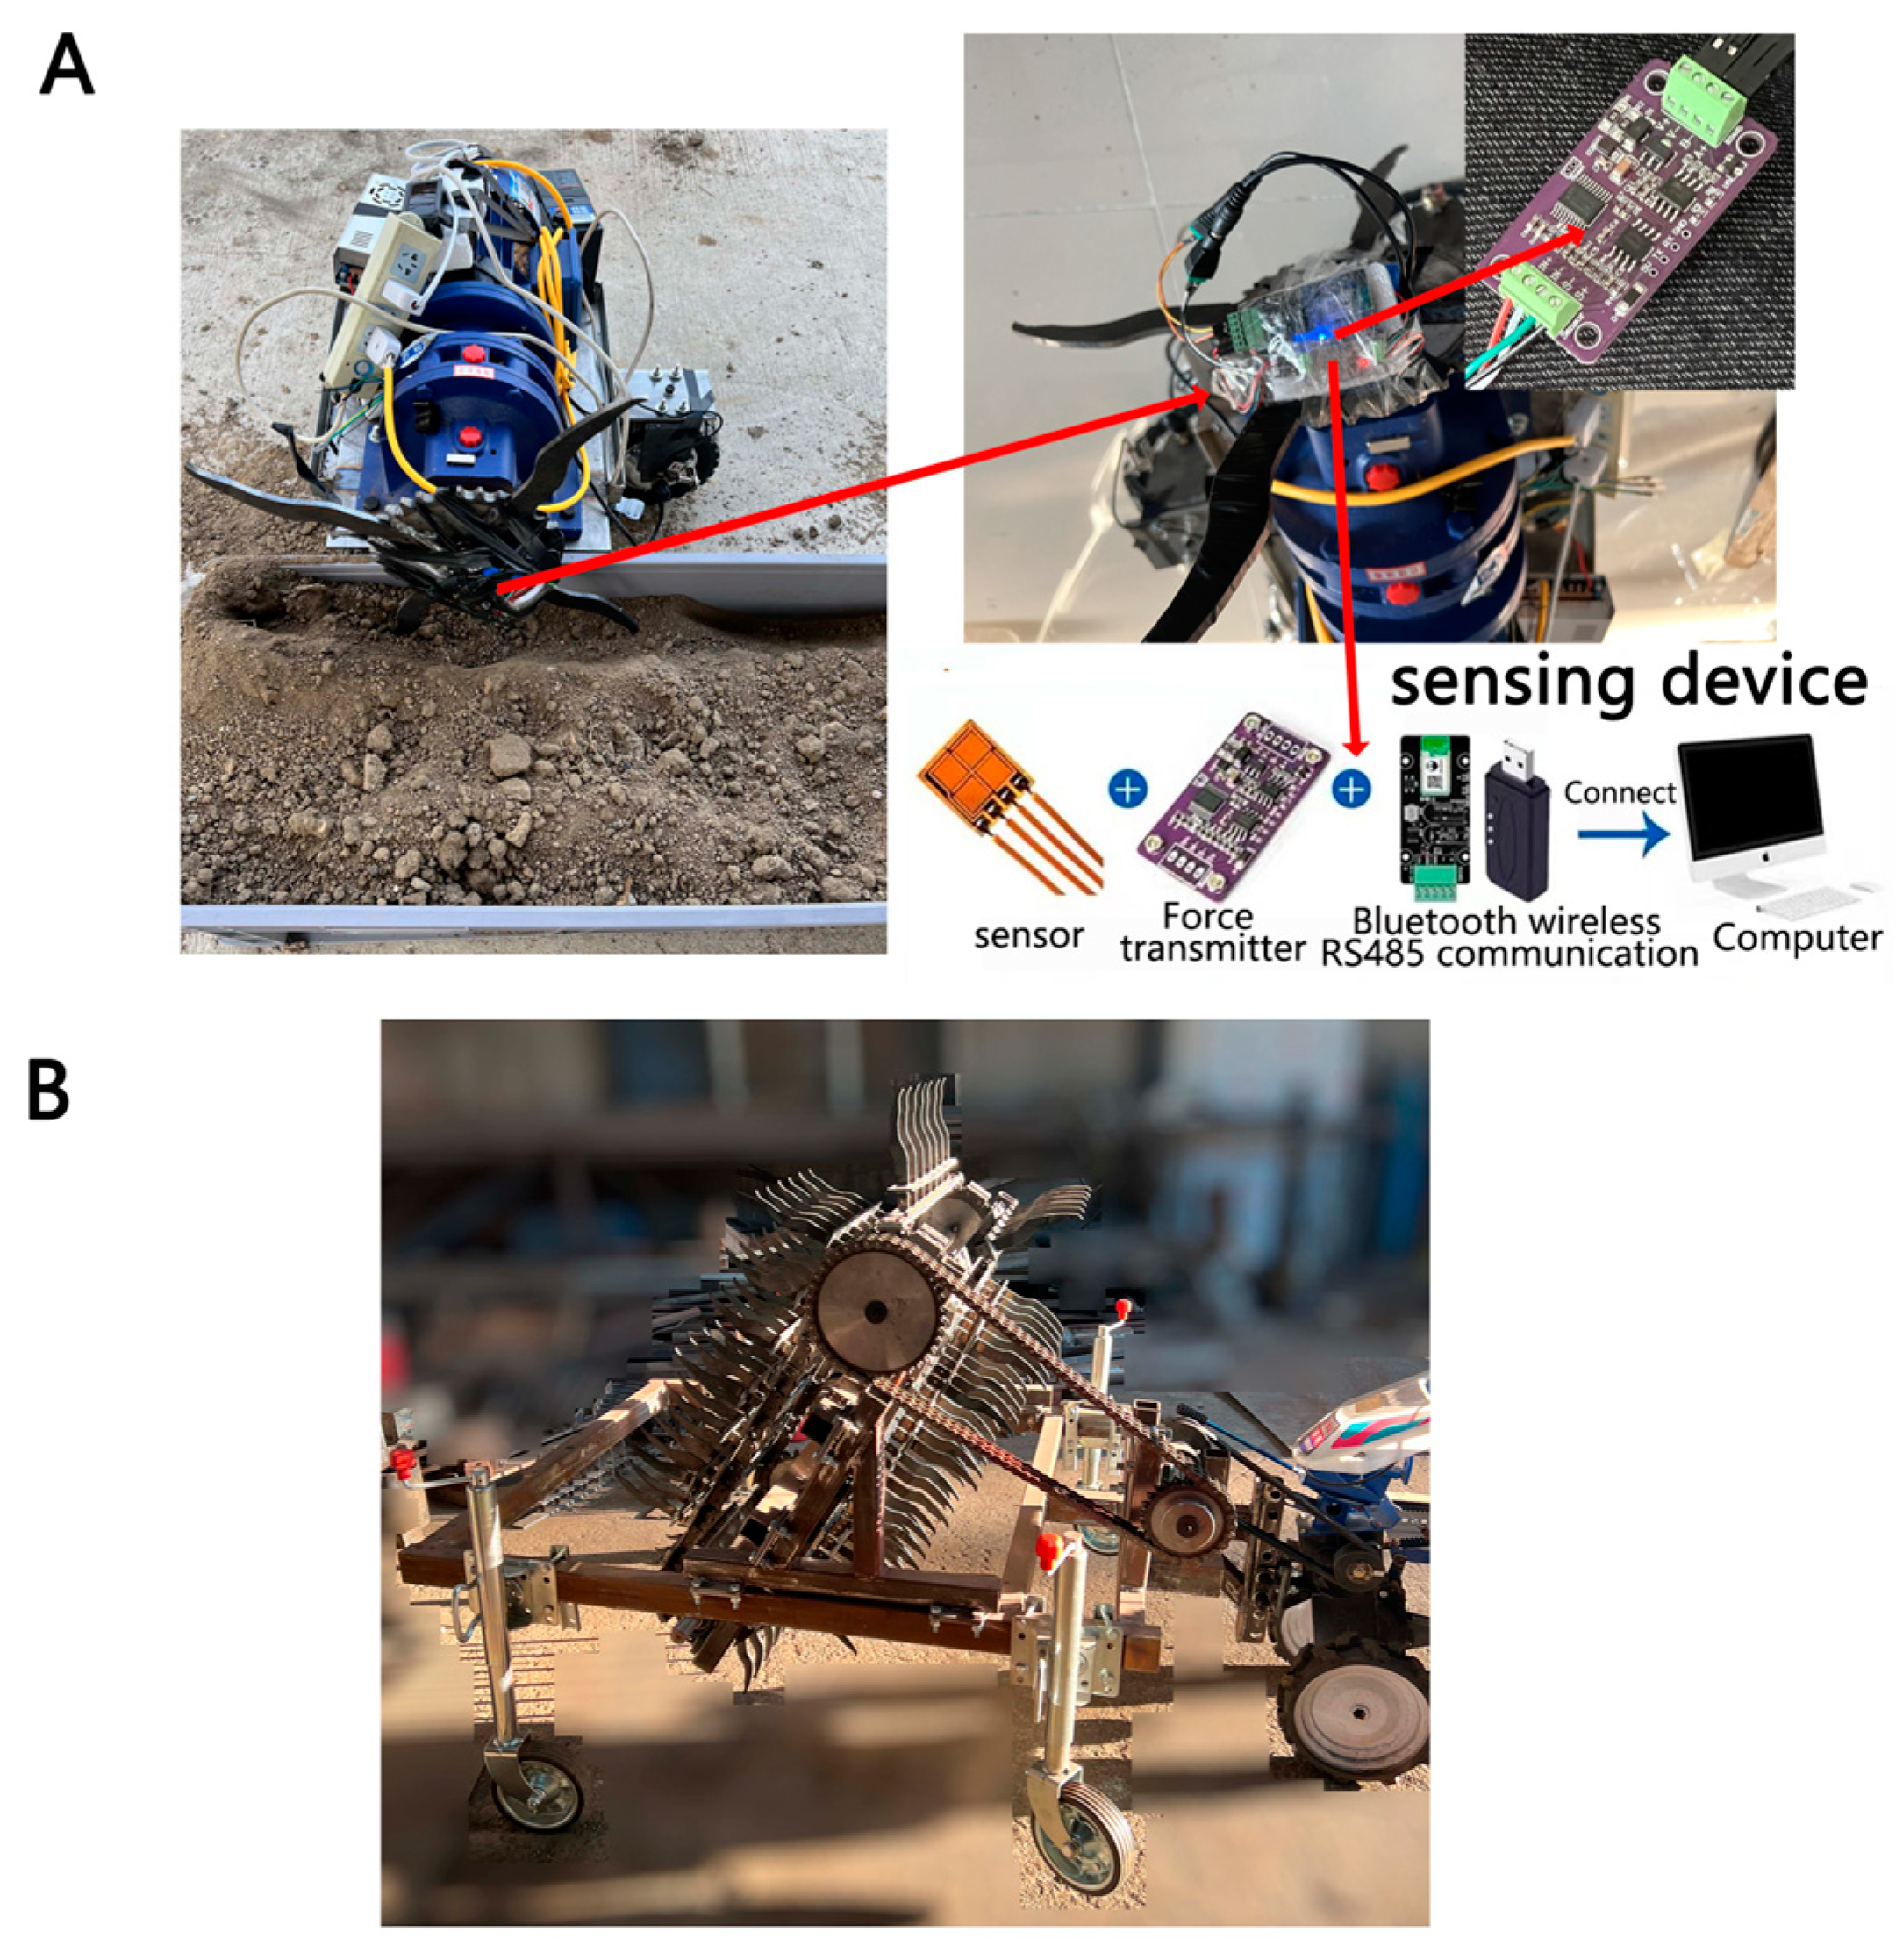
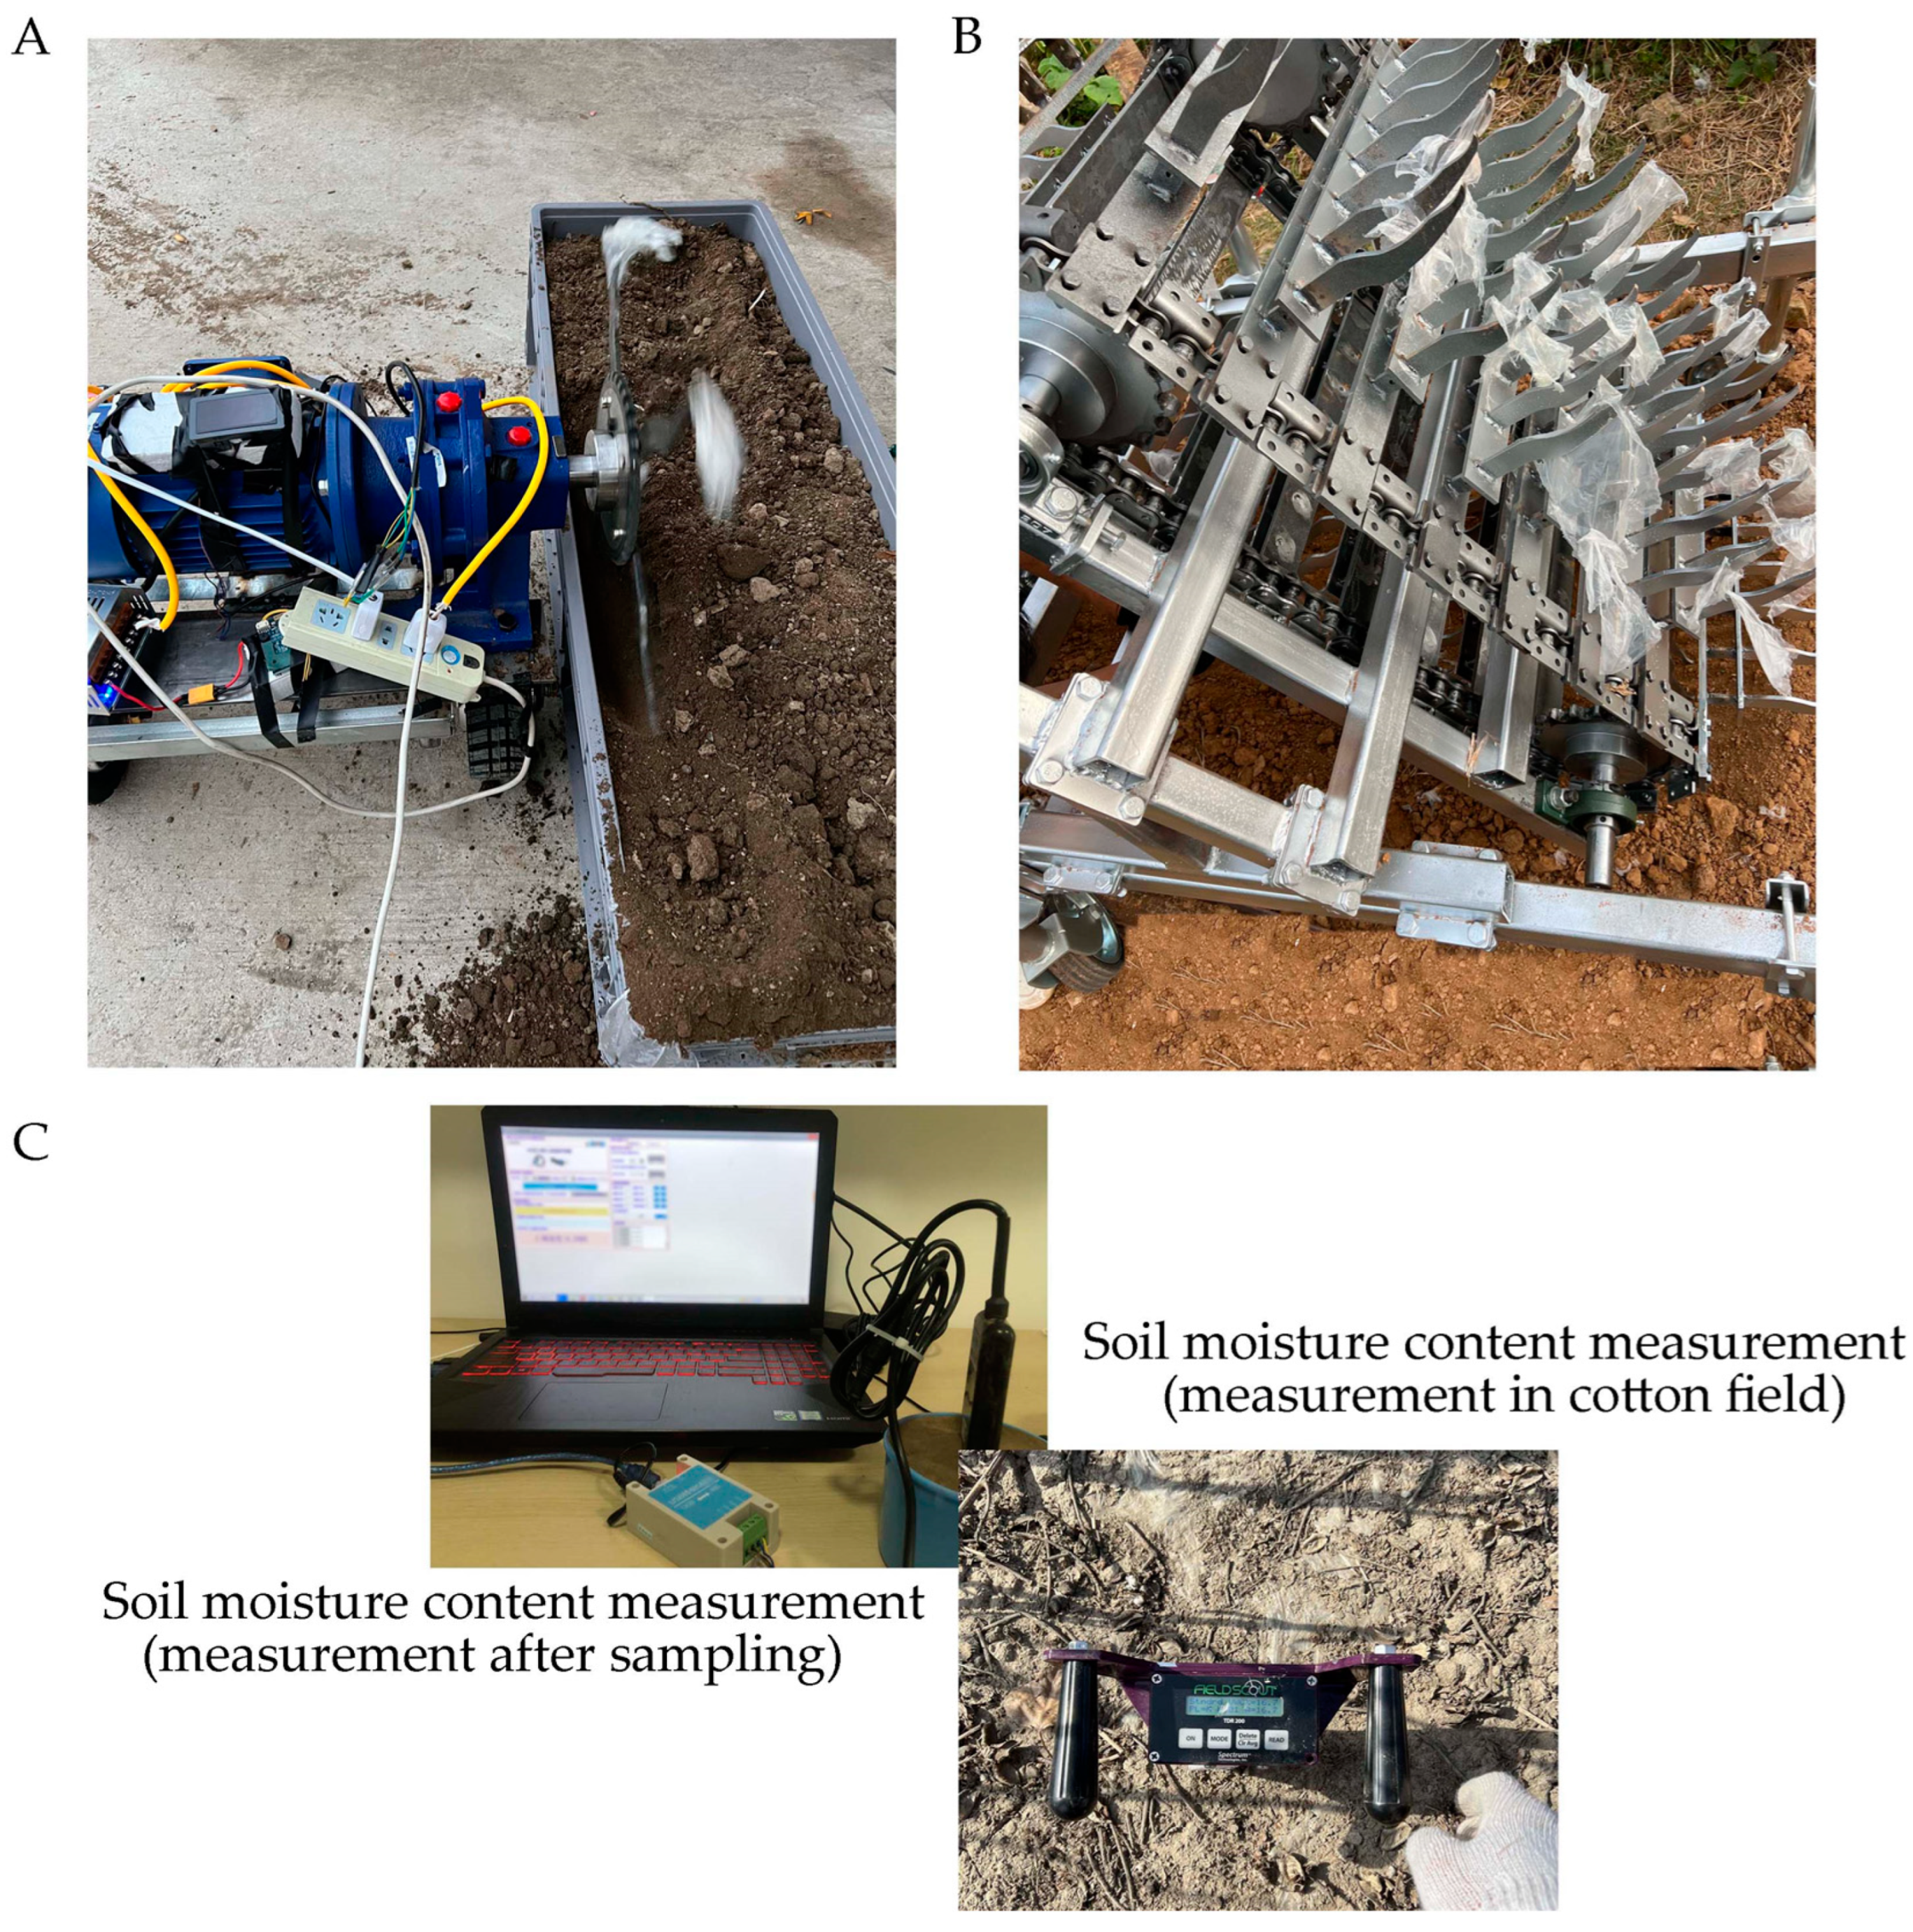
2.5. Stress Collection Tester for the Process of Tooth Film Picking

As shown in Figure 7A, the soil tank was filled with soil to a height of 230–280 mm, with the elastic teeth penetrating 150 mm into the soil. A stress–strain measurement device on the elastic teeth transmitted data via Bluetooth to a computer, providing real-time, visual feedback on the forces during the film-picking process, facilitating analysis. Figure 7B illustrates the multi-tooth film-lifting device, with a film-lifting width of 0.8 m, an adjustable soil penetration depth, and controllable walking and film-lifting speeds. The film-picking parameters were set based on the optimized results from the single-tooth test, and the actual film-picking rate was calculated. A comparison between the single-tooth and multi-tooth film-lifting rates confirmed the feasibility of the single-tooth test data.

3. Results

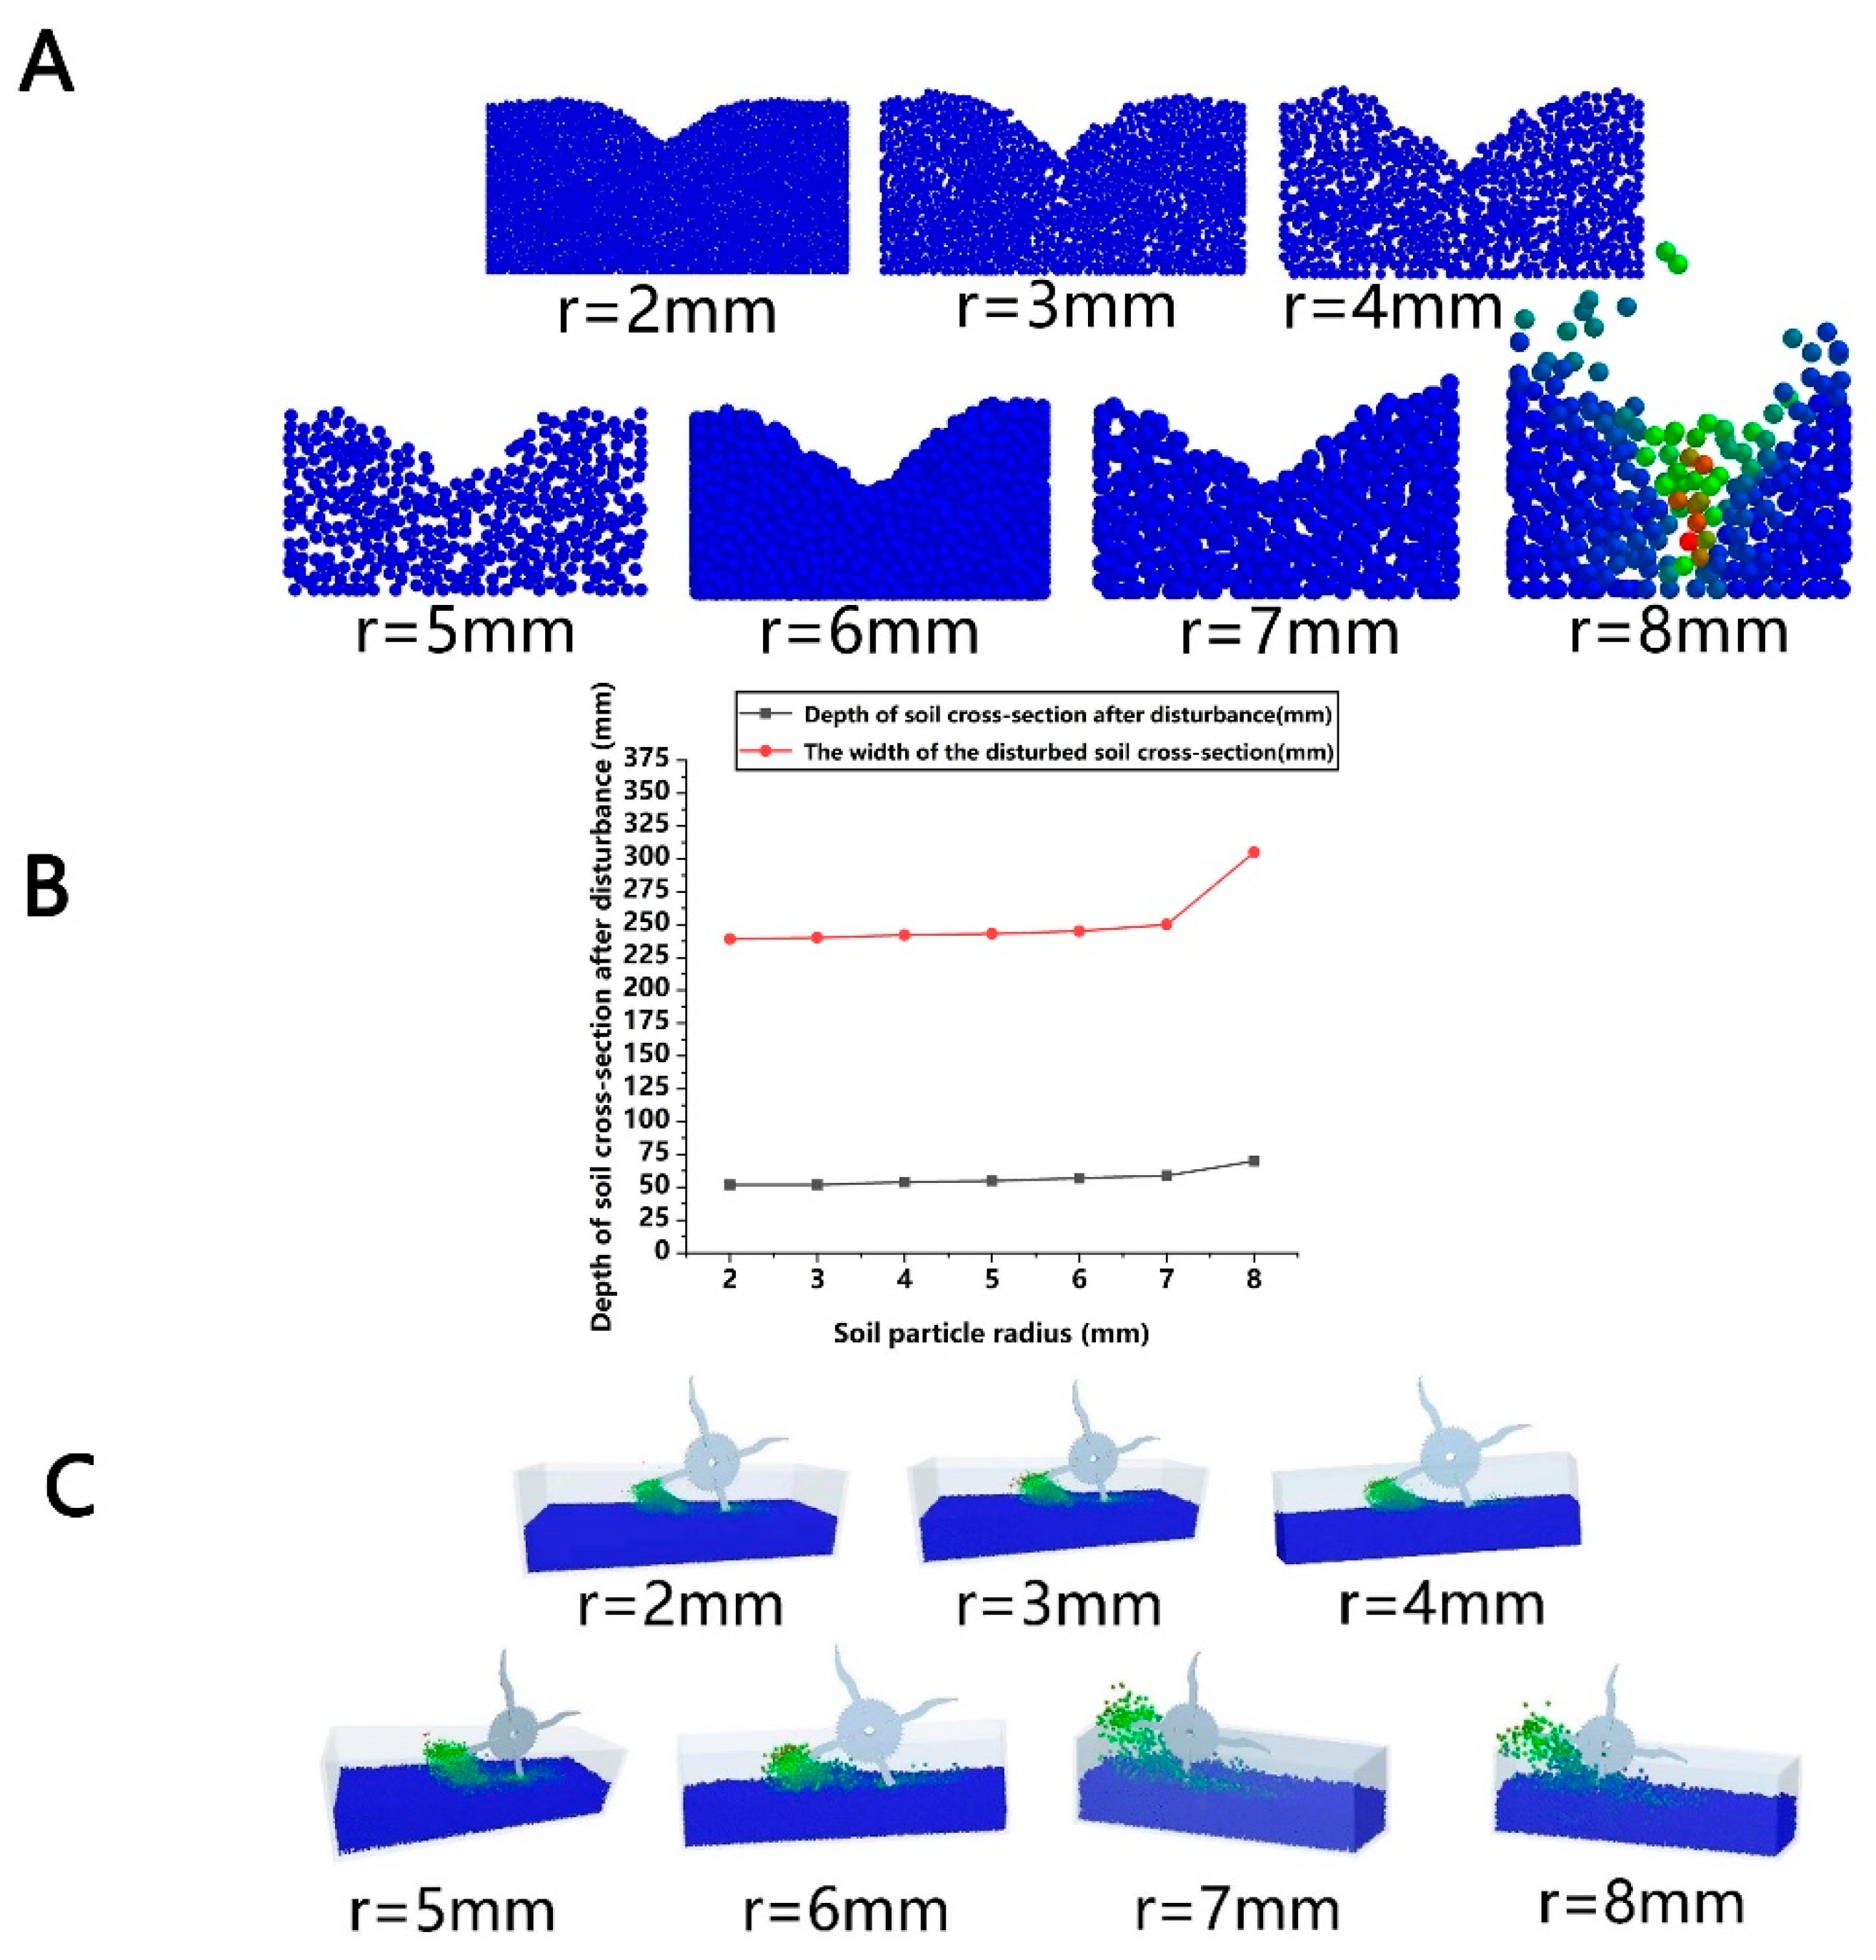
3.1. Analysis of the Influence of the Soil Particle Radius on Simulation Accuracy

3.1.1. Simulation Disturbance Cross-Section Analysis of Elastic Teeth on Soil with the Soil Particle Size as the Variable Factor

As shown in Figure 8, the radius of the soil particles varied from 2 mm to 8 mm. From Figure 8A, it is evident that as the particle radius increases, the cross-sectional shape of the disturbed soil changes. The larger the particle radius is, the more pronounced the change in shape, with significant changes occurring when the radius reaches 8 mm. Figure 8B shows the variation in the soil cross-sectional depth after disturbance. The average values of the width and depth after ejection were 240 mm and 52 mm, respectively. For particle radii ≤ 7 mm, the error between the simulated and experimental cross-sectional parameters remains within 10%. Therefore, in simulations, the maximum particle radius can be set to 7 mm. This amplifies the soil particle size 2–7 times, balancing simulation accuracy and reducing computational demands while maintaining reasonable simulation time and efficiency. From Figure 8C, when particle sizes range from 2 to 6 mm, the ejection of soil particles is stable and consistent. However, noticeable changes occur starting at 7 mm, with further instability at 8 mm. To improve simulation accuracy, the particle radius amplification factor should be reduced 2–6 times, ensuring the simulation meets accuracy requirements.

3.1.2. The Influence of Particle Size on Soil Resistance to Penetration and Comparative Analysis of the Simulation and Experimental Results of Soil Resistance to Penetration

The simulated pressure change curves under different soil particle radii were analyzed to assess the impact of particle size on soil resistance to penetration. As shown in Figure 9A,B, for particle radii of 1–3 mm, the predicted soil resistance to penetration trends are similar. When the hardness tester reaches 150 mm, the error between simulated soil resistance to penetration (761 Pa, 870 Pa, and 885 Pa for 1 mm, 2 mm, and 3 mm) and experimental soil resistance to penetration (800 Pa) is within 10%, indicating accurate predictions. Smaller particle sizes yield higher accuracy. When the particle radius is increased to 3 mm, prediction accuracy remains reasonable, but as the radius amplifies further, the simulated pressure increases, resembling a solid block of soil. Larger particles cause greater deviation from the experimental values. For 1 mm particles, soil resistance to penetration fluctuates slightly and increases linearly, but the simulation time is shorter. Therefore, a particle radius of 2–3 mm is optimal for balance between accuracy and simulation efficiency.

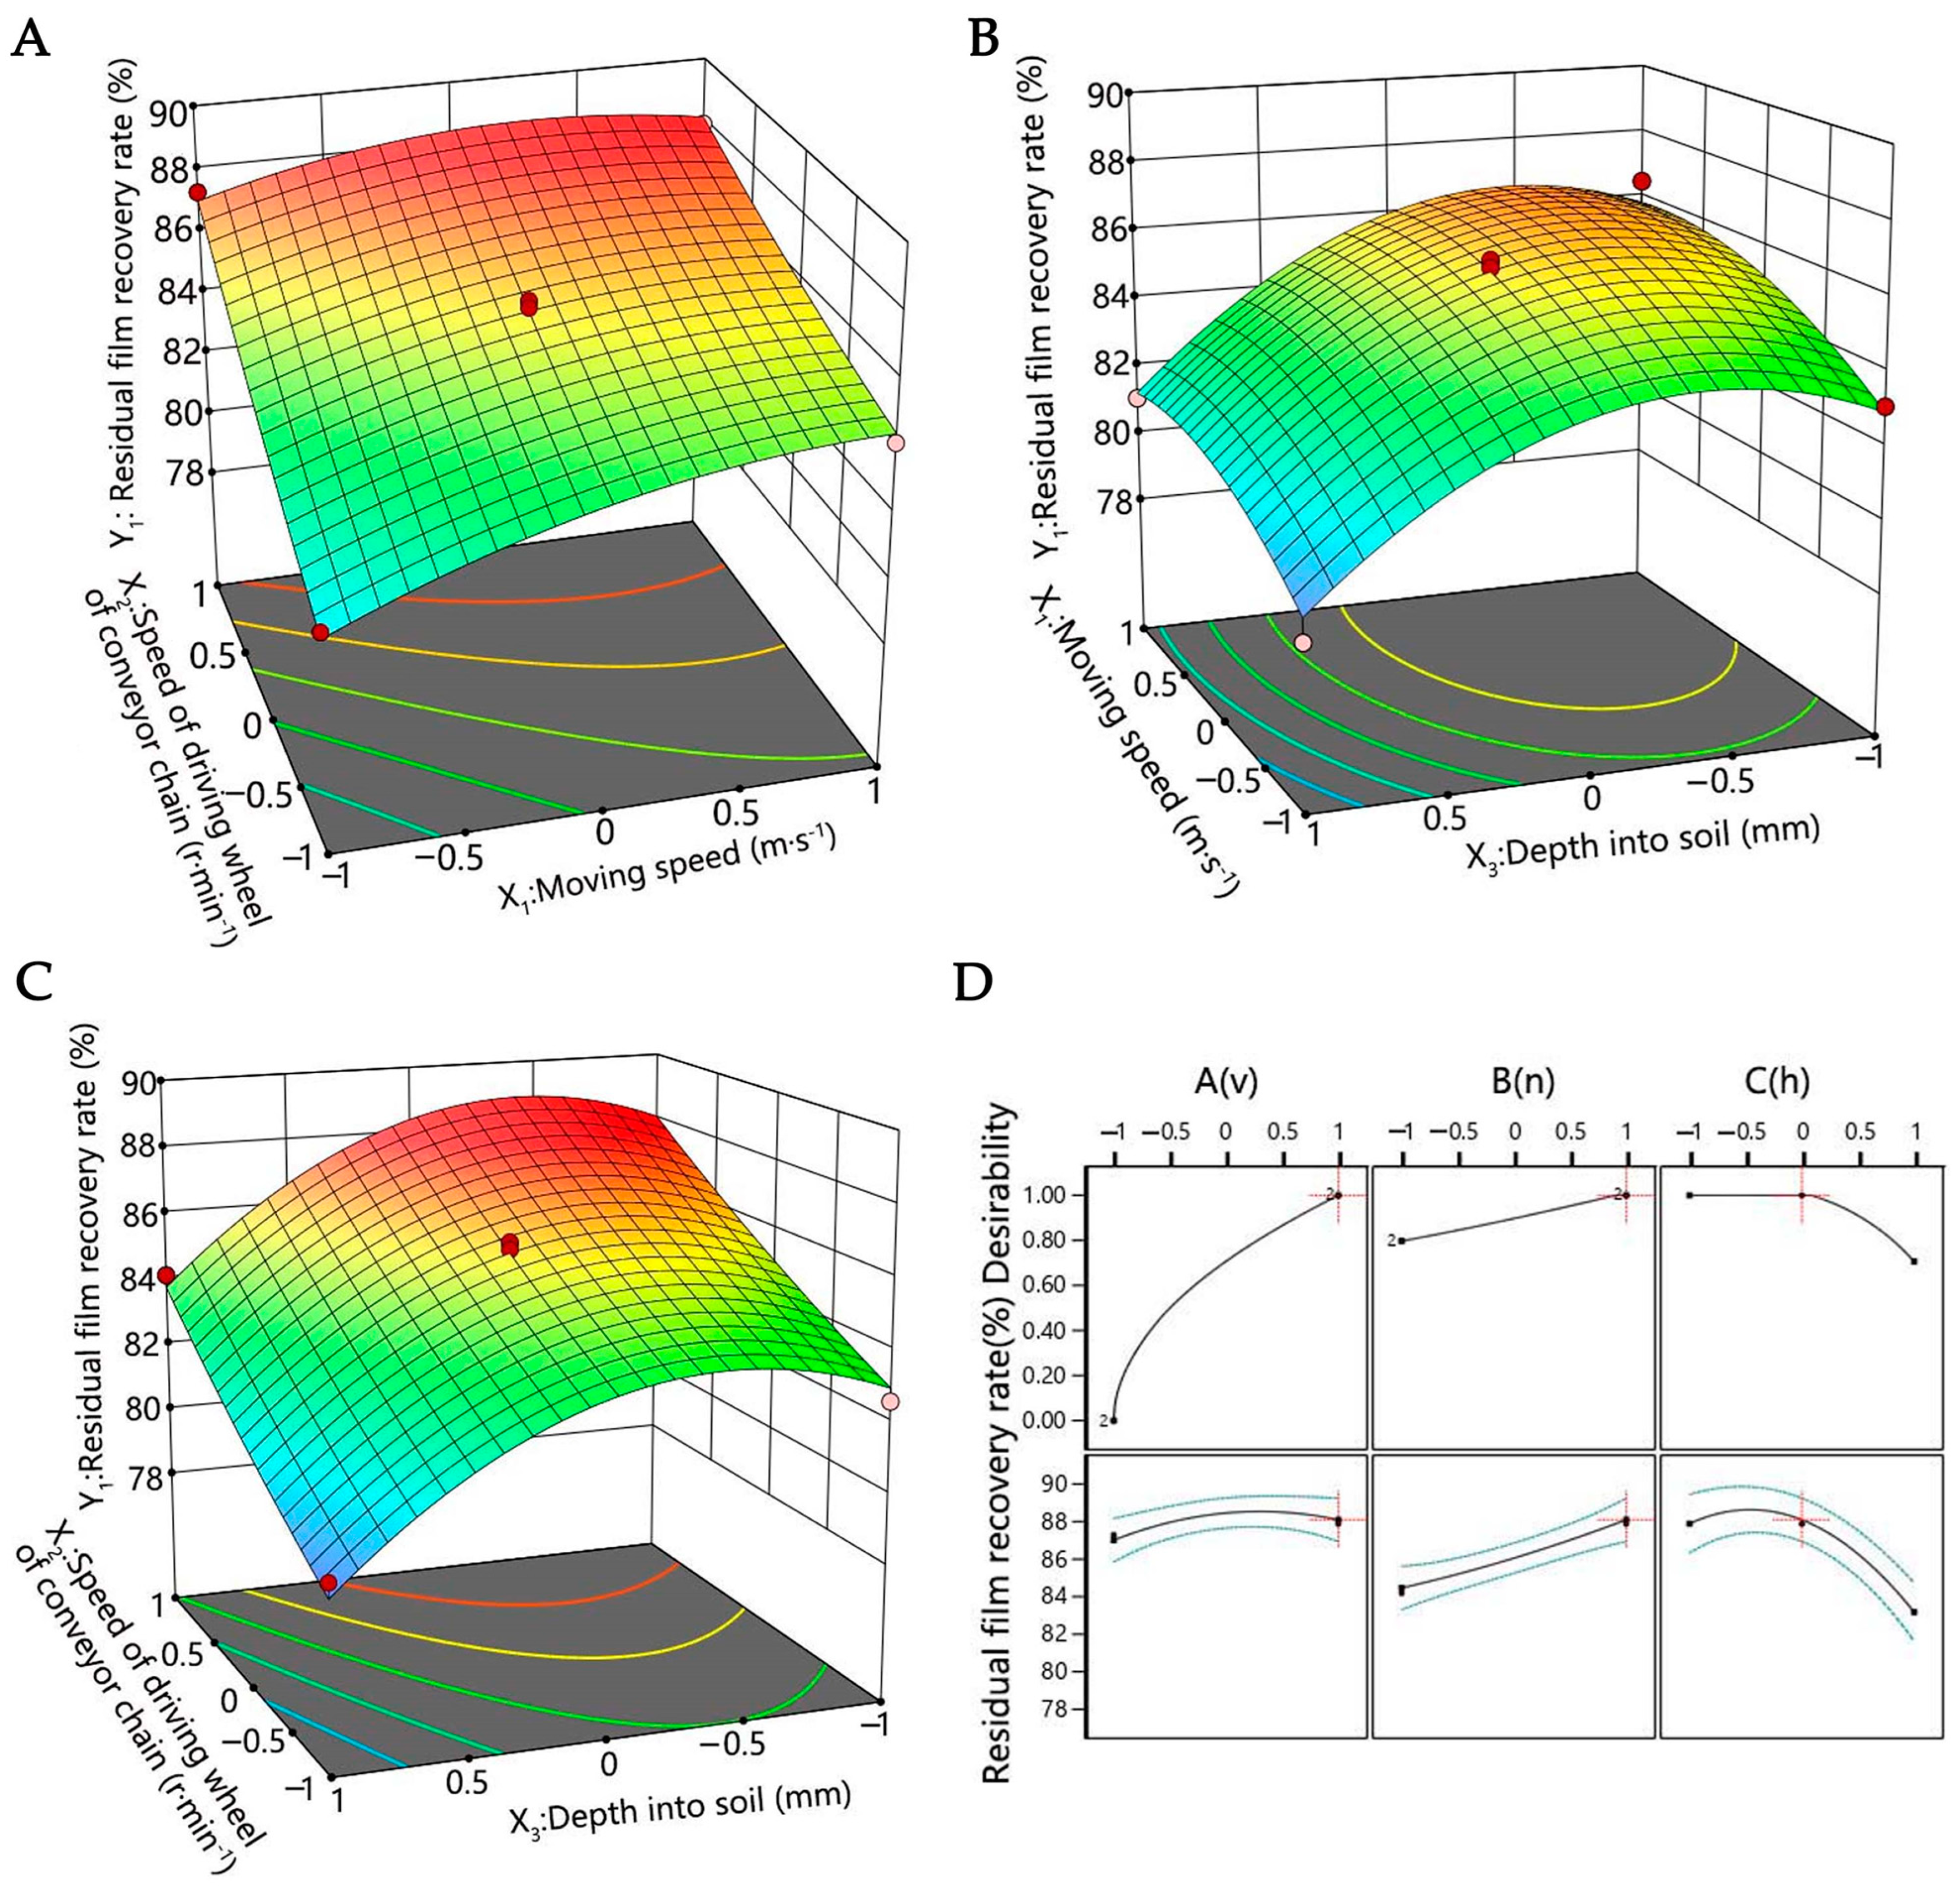
3.2. Analysis of the Results of the Optimization of the Working Parameters

3.2.1. Analysis of the Results of Parameter Optimization

Based on the experimental factors and levels, with the residual film recovery rate as the response factor, the Box–Behnken measure was used to design a three-factor, three-level orthogonal regression experiment. The experiment includes 17 test points, and the test plan and response values are shown in Table 3.

3.2.2. Regression Model Establishment and Significance Analysis

Based on the data in Table 4, multiple regression analysis was performed using Design-Expert 13 software to obtain the optimal parameters. A first-order response surface regression model was established for the recovery rate, with forward speed, driving wheel speed, and soil penetration depth as independent variables. The regression equation (Equation (9)) and analysis of variance are provided in Table 4. The results show that for the recovery rate Y 1 , the response surface model is highly significant (p < 0.001). The lack of a fit term (p = 0.0692) indicates a good model fit. The coefficient of determination R 2 is 0.9833, meaning the model explains over 98% of the variation in the evaluation metrics. Thus, this model is suitable for optimizing the machine’s working parameters. As presented in Table 4, the developed prediction model demonstrates statistical significance and provides reliable predictions of optimal values. Figure 9 illustrates the predictive analysis results, from which the optimal parameter combination for the experimental optimization was determined.
Y 1 = 85.738 + 1.2275 × A + 2.49875 × B + 2.09875 × C                                                                       + 0.685 × A B + 0.21 × A C + 0.0425 × B C                                                                                   + 0.90525 × A 2 + 0.22225 × B 2 + 2.55775 × C 2

3.2.3. Parameter Optimization and Validation

To achieve optimal performance of the chain screen residual film recycling machine, the influencing factors were optimized using Design-Expert 13.0, based on a three-variable, first-order orthogonal regression experiment. As shown in Figure 10A–D, the optimal parameters were determined as follows: a forward speed of 1.94 m · s 1 , a driving wheel speed of 10.47 r a d · s 1 , and a soil penetration depth of 125 mm, yielding a predicted recovery rate of 88%. To verify the optimization, three field experiments were conducted using these parameters (Figure 11A–C). The soil moisture content during film harvesting ranged from 9–12%. The average recovery rate from the three tests was 90%, with merely a 2% variance from the predicted performance metrics, and the results therefore substantiate the model’s predictive accuracy. The close agreement between the simulated and empirical film retrieval rates (Δ < 2%) verifies the efficacy of both the parameter optimization protocol and the predictive modeling approach. Parameter optimization improves field operation effectiveness by minimizing leakage during residual film recovery and preventing excessive energy consumption from high picking speeds. By balancing the forward speed, picking speed, and soil penetration depth, a high recovery rate is achieved, enhancing the operational efficiency of the residual film recycling machine. The current optimization of operating parameters for residual film recycling machines is typically conducted post-production, leaving operational performance uncertain during the design phase. This study presents a novel approach by optimizing the operating parameters of a single-tooth film retrieval device prior to manufacturing a multi-tooth system. This pre-production optimization strategy significantly enhances the residual film recovery efficiency of subsequent devices while substantially reducing production costs. The proposed methodology offers considerable potential for improving overall recycling rates in agricultural film recovery operations [6].

3.3. Experimental Study on the Force Analysis of Film-Picking Teeth

3.3.1. Simulation and Experimental Comparative Analysis of the Torque Acting on the Elastic Teeth During the Film-Picking Process

As shown in Figure 12A–D, a torque sensor was attached to the power shaft of the film-lifting device with a lifting depth of 150 mm. Torque was recorded in real-time during both idle and soil-insertion conditions. The torque of the elastic teeth was calculated as the difference between full-load and no-load torque. The average simulation torque was 2.53 N · m , while the experimental average was 2.72 N · m , with an error of only 8%, which is within the acceptable range. This confirms that the discrete element method effectively predicts torque during the film-lifting process. Existing research on residual film recycling machines has predominantly emphasized improving film recovery rates while paying limited attention to the torque characteristics and operational resistance of the retrieval mechanisms. This study systematically measured the critical operational parameters, including the film-picking torque, following the lifting process of residual film recovery. The obtained dataset provides valuable reference metrics for optimizing continuous tillage operations in film retrieval systems [7,8,9].

3.3.2. Analysis of the Film-Lifting Force Results of the Simulation and Experiment

Figure 13A is the force trend chart of the elastic teeth, established based on Equation (8). As shown in Figure 13B, during the film-lifting process, the tooth experiences a cyclic force, peaking when it first enters the soil and then stabilizing around 25 N. This matches the prediction of the established mathematical model. The simulation and experimental resistance results on the total contact area between the tooth and soil are consistent, with averages of 6.5 N and 6.4 N, respectively, yielding a 2% error, which is within the acceptable range. These results confirm the accuracy of the DEM-MBD simulation model for predicting the resistance of the elastic tooth during film picking.

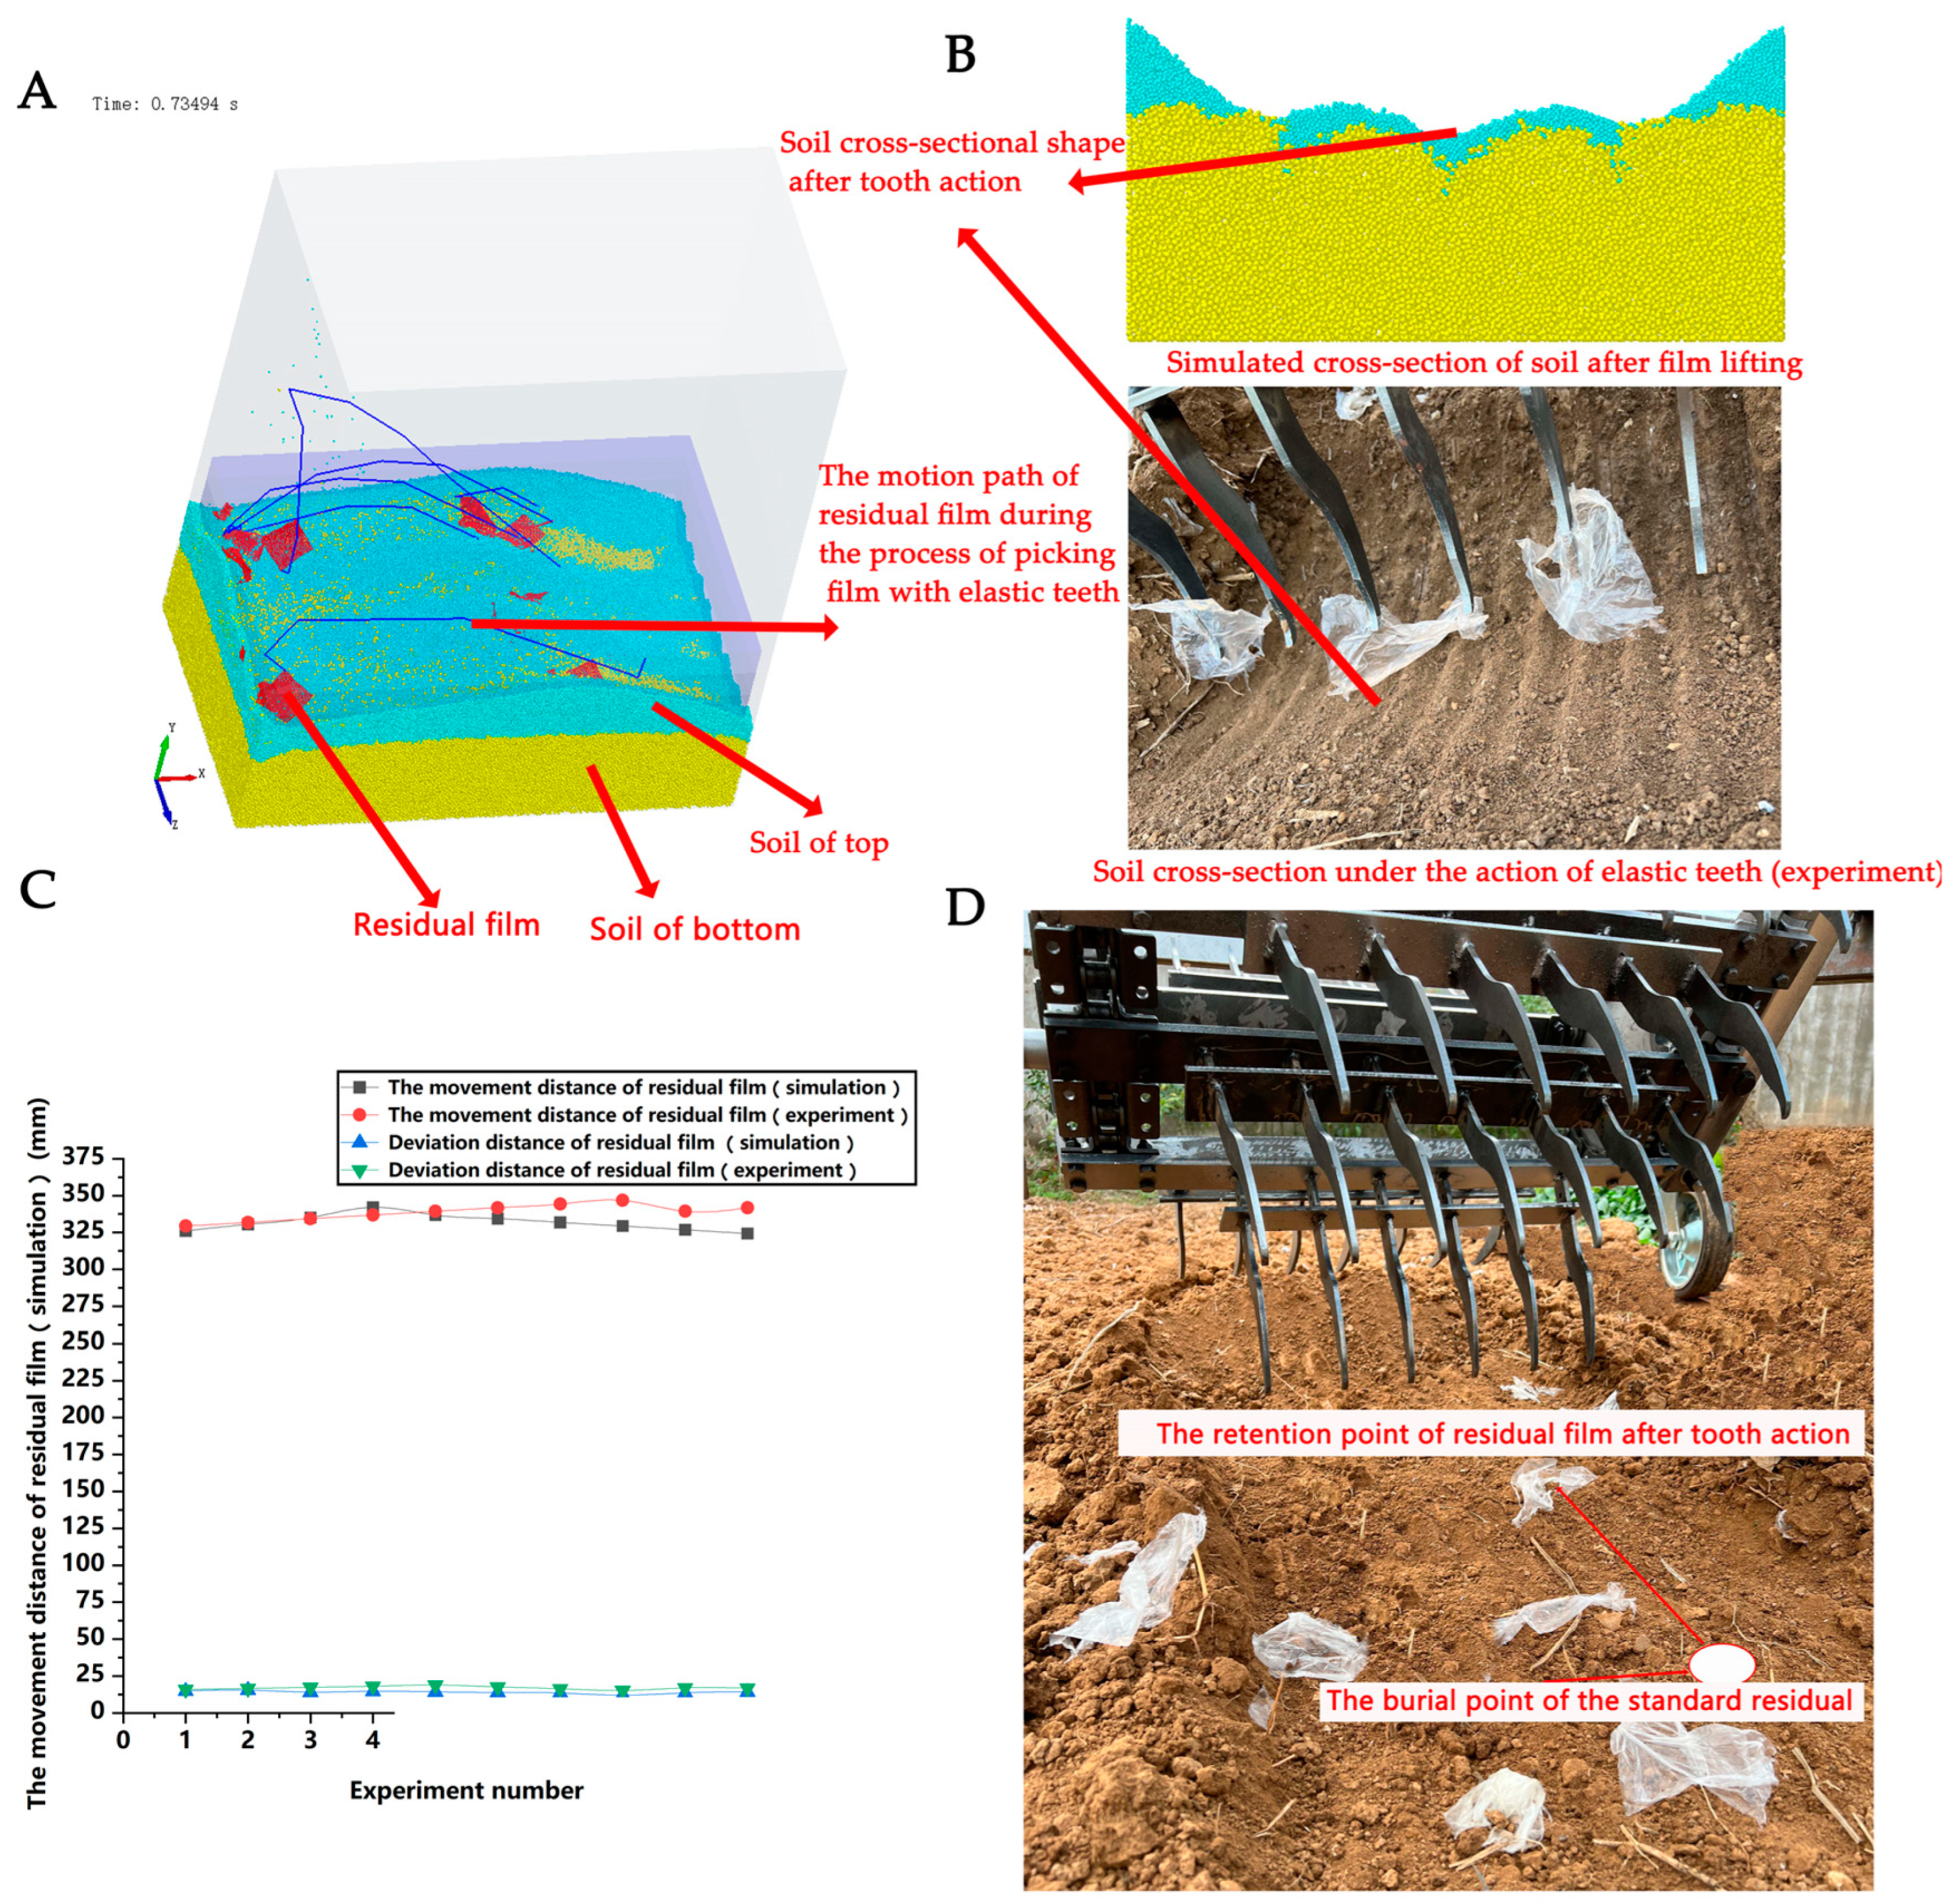
3.4. Simulation and Comparative Analysis of the Experimental Results on the Interaction and Movement Trend of the Soil and Residual Film Under the Action of Elastic Teeth

The interaction between the tooth, soil, and residual film was simulated within the soil particle radius range of 1–3 mm. The movement of the soil and residual film under the action of the tooth was analyzed, comparing the simulation and experimental results using a multi-tooth film-lifting device. A staggered multi-tooth model tracked the motion path of residual film particles, observing soil disturbance and the shape of the disturbed cross section. The position changes of the residual film in the field were compared to those in the simulation. The accuracy of predicting the movement trend was defined by the difference in forward displacement and deviation. After ten simulation–experiment repetitions, the results showed a 2% (332 mm vs. 339 mm) and 7% (15 mm vs. 16 mm) error, confirming the DEM method’s accuracy in analyzing soil disturbance during the film-picking process. The motion path comparison is shown in Figure 14A–D. As shown in Figure 14D, under the action of the teeth, soil is pushed aside and compressed into small piles between the teeth, which are disturbed by subsequent rows, ensuring the entire area where residual film exists is thoroughly disturbed. The discrepancy between the simulation results and the experimental data validates the accuracy of the established model, confirming that the discrete element model effectively predicts membrane-lifting resistance and device performance. Once the reliability of parameters within the selected particle size range is confirmed, this simulation model will serve as a foundation for further research on membrane-picking devices and provide valuable insights for particle size selection in soil-contacting component simulations. Building upon existing research in film retrieval technology, this study presents significant improvements to the pickup device design. The developed system demonstrates a notable advancement in till-layer residual film recovery efficiency, achieving a 90% retrieval rate compared to the current benchmark of 66.8% [12]. Furthermore, the study incorporates a novel simulation model to analyze the dynamic behavior of flexible residual films during the retrieval process, providing valuable insights for device optimization.

4. Discussion

This study focused on the film-picking device of a tillage-layer residual film recycling machine, using forward speed, film-picking speed, and soil penetration depth as factors and the film-picking rate as the response parameter in Box–Behnken experiments. DEM-MBD coupling simulations and experimental verification were conducted on resistance, torque, and soil disturbance in the film-lifting process, with an analysis of the soil particle radius impact on simulation accuracy. The results confirmed that the optimized biomimetic film-picking device is effective for residual film recovery in cotton fields. The experimental results demonstrate that the operational parameters of the film retrieval device significantly influence the recovery efficiency. This effect primarily stems from the kinematic coordination between retrieval speed, forward velocity, and working depth, which collectively determine the coverage effectiveness and minimize blind spots during the retrieval process. Optimal parameter coordination substantially reduces uncovered areas, thereby enhancing the residual film recovery rate. Furthermore, comparative analysis between the simulation and experimental results reveals that particle size critically affects soil–machine interactions. The simulation model maintains high accuracy when particle sizes are scaled to 2–3 mm (1–4 times the actual dimensions). However, excessive upscaling beyond this range adversely affects simulation fidelity, as it alters both the machine–soil-contact mechanics and interparticle interactions.
While there has been research on optimizing surface film recycling machine parameters, more work is needed for tillage film recycling machines, particularly regarding the resistance and torque of elastic teeth. Existing studies mainly focus on residual film recycling rates, but if the resistance of the elastic teeth is too high, the device may not be suitable for varying soil resistance to penetration. Significant soil penetration depth can increase resistance, hindering effective film collection. Jin et al. (2022) optimized the parameters of the film-picking device, including conveying speed, tooth spacing, and type, achieving an 88% residual film recovery rate [41]. Guo et al. (2020) optimized the forward and rotational speeds of a tillage residual film recovery machine, reaching a 55% recovery rate at a forward speed of 2 k m · h 1 and comb roller speed of 10.47 r a d · s 1 [42]. Huang et al. (2024) developed DEM and Rocky simulation models to optimize the working parameters of a soil-throwing device in a residual film recycling machine, and the optimal parameters were a rotary tillage speed of 200 rpm, soil-lifting speed of 320 rpm, and a distance of 130 mm between the two mechanisms [43]. While previous studies have focused on residual film recovery rates and elastic tooth types, the relationship between the recovery rate and film-picking resistance remains underexplored. Reduced resistance in the film-picking device enhances tooth movement, minimizing secondary tearing and improving recovery rates. The optimized device in this study achieved a 90% recovery rate, outperforming existing tillage-layer machines with more stable operation. This study integrates a single-tooth film-picking device with DEM-MBD coupling simulations to optimize parameters and predict key forces acting on the device. Additionally, a flexible discrete element model for the residual film was established. Beyond the DEM-MBD approach, alternative computational methods exist for analyzing elastic tooth–soil–residual film interactions. These include coupled FEM-DEM simulations and hybrid approaches such as ANSYS LS-DYNA (2022) implementations incorporating smoothed particle hydrodynamics (SPH) for enhanced multiphysics modeling [44]. In FEM-DEM simulations, the residual film is modeled using the discrete element method (DEM), which provides superior capability for analyzing film stress distribution and deformation characteristics. Conversely, DEM-MBD coupled simulations offer more effective analysis of interfacial interactions between the residual film and soil machinery. For the current investigation of small-scale residual film–soil interactions, the DEM-MBD approach proves particularly suitable. However, when simulating systems containing both larger and smaller residual films, the FEM-DEM coupling method may be preferentially employed to capture the complete mechanical behavior. The coupled CFD-DEM simulation approach enables the accurate prediction of particle dynamics during pneumatic unloading processes, providing critical data for optimizing suction device parameters [45,46]. Previous research by scholars, including Jin et al. (2022), has investigated the suspension characteristics of membrane–soil systems through both numerical simulations and experimental studies [47].
Currently, particle bonding in DEM is used to model non-spherical particles for simulating soil and flexible body interactions (Zhang et al., 2024; Deng et al., 2024) [48,49]. However, the mechanical properties of particle bonds in flexible bodies remain underexplored. Analyzing these bonds could enhance simulation accuracy. Additionally, limited research exists on the separation of particle motion paths during interactions between tillage tools and soil and even less on the motion paths of flexible particles under tillage tool influence (Wang et al., 2022) [50]. This study innovatively analyzes bonding strength parameters to explore the motion characteristics of thin, flexible bodies in soil. This research can be applied to agricultural harvesting and tillage machinery to improve design efficiency and operational effectiveness. By predicting stress conditions for soil-contacting components before manufacturing, equipment can be optimized in advance. For residual film recovery devices, incorporating a secondary picking mechanism, based on these findings, could further enhance the recovery rate.

5. Conclusions

This study established discrete element parameters and developed a simulation model based on material samples collected from the Tacheng region of Xinjiang. Experimental conditions were carefully configured according to measured material parameters (soil compactness: 800 kPa; moisture content: 10%) to ensure result accuracy. The reliability of DEM parameters was validated through comparative analysis of simulated and experimental soil repose angles, confirming close agreement between the model and actual field conditions. The results demonstrate the significant influence of operational parameters on film retrieval performance. The optimal parameter combination was determined to be the following: a forward speed of 1.94 m · s 1 , a drive wheel speed of 10.47 r a d · s 1 , and a retrieval depth of 125 mm (with a tooth rotation radius of 200 mm). Under these conditions, the multi-tooth retrieval device achieved a 90% residual film recovery rate, validating the optimization approach. Excellent correlation was observed between the predicted and experimental values, with only 2% deviation in film resistance (6.5 N vs. 6.4 N) and minimal trajectory discrepancies (2% horizontal, 7% vertical). The optimized device demonstrated stable operation and proved effective for cotton field applications within specific soil resistance to penetration ranges. This work provides (1) a validated DEM modeling approach for soil–film interaction studies; (2) optimal operational parameters for high-efficiency film retrieval; (3) practical insights for designing soil-engaging components in agricultural machinery.

Author Contributions

W.F.: methodology, data analysis, writing—original draft, and review and editing; X.W.: supervision, funding acquisition, and review and editing; D.H.: writing—review and editing; I.E.O.: writing—review and editing. All authors have read and agreed to the published version of the manuscript.

Funding

This study was supported by National Key R&D Program of China (No. 2022YFD2002403), the Ministry of Industry and Information Technology’s Residual Film Recycling Machine Project (No. zk20230359), the Priority Academic Program Development of Jiangsu Higher Education Institutions (No. PAPD-2023-87), the 2023 Open Project of Key Laboratory of Modern Agricultural Equipment and Technology (Jiangsu University), and the Ministry of Education and High-tech Key Laboratory of Agricultural Equipment and Intelligence of Jiangsu Province (No. MAET202327).

Data Availability Statement

The original contributions presented in this study are included in the article. Further inquiries can be directed to the corresponding author.

Conflicts of Interest

The authors declare no conflicts of interest.

References

  1. Yang, X.; Fan, W.; Wu, J.; Lv, Y.; Zhu, W.; Cai, H. Temporal and Spatial Distribution of Residual Film in Soil Profile under Continuous Film Mulching. Sustainability 2023, 15, 15534. [Google Scholar] [CrossRef]
  2. Jiang, D.; Yan, L.; Chen, X.; Mo, Y.; Yang, J. Design and experiment of nail tooth picking up device for strip type residual film recycling and baling machine. Int. J. Agric. Biol. Eng. 2023, 16, 85–96. [Google Scholar] [CrossRef]
  3. Zhang, Z.; Chen, X.; Wang, X.; Xue, S.; Li, J. Design and test of the arc-shaped nail-tooth roller residual film recovery machine from the sowing layer. Int. J. Agric. Biol. Eng. 2024, 17, 90–98. [Google Scholar] [CrossRef]
  4. Shi, Z.; Zhang, X.; Yan, J.; Jiang, Y.; Yao, J. Experiment and Analysis of Film-Soil Separation Motion Characteristics of a Chain Drive Residual Film Recovery Mechanism for the Tillage Layer. Appl. Sci. 2022, 12, 5884. [Google Scholar] [CrossRef]
  5. Yang, S.; Chen, X.; Yan, L.; Jiang, D. Performance of three different spades for residual plastic film recycling machine. Appl. Eng. Agric. 2020, 36, 187–195. [Google Scholar] [CrossRef]
  6. Shi, Z.; Zhang, X.; Liu, X.; Kang, M.; Yao, J.; Guo, L. Analysis and Test of the Tillage Layer Roll-Type Residual Film Recovery Mechanism. Appl. Sci. 2023, 13, 7598. [Google Scholar] [CrossRef]
  7. Guo, W.; Hu, C.; He, X.; Wang, L.; Hou, S.; Wang, X. Construction of virtual mulch film model based on discrete element method and simulation of its physical mechanical properties. Int. J. Agric. Biol. Eng. 2020, 13, 211–218. [Google Scholar] [CrossRef]
  8. Zhang, Y.; Zhao, Z.; Li, X.; Xue, Z.; Jin, M.; Deng, B. Near-Infrared-Based Measurement Method of Mass Flow Rate in Grain Vibration Feeding System. Agriculture 2024, 14, 1476. [Google Scholar] [CrossRef]
  9. Ma, Z.; Wu, Z.; Li, Y.; Song, Z.; Yu, J.; Li, Y.; Xu, L. Study of the grain particle-conveying performance of a bionic non-smooth-structure screw conveyor. Biosyst. Eng. 2024, 238, 94–104. [Google Scholar] [CrossRef]
  10. Wang, H.; Li, Y.; Wang, Y.; Zhang, Z.; Chen, H.; Wang, L. Design and field simulation test of throwing film nail tooth arc picking up device for residual film. Agric. Res. Arid Areas 2021, 39, 209–218. [Google Scholar] [CrossRef]
  11. Zhang, X.; Guo, L.; Yan, J.; Shi, Z.; Kang, M.; Yao, J. Simulation Analysis and Parameter Optimization of Residual Film Pickup Process Based on Finite Element Method. Agriculture 2024, 14, 524. [Google Scholar] [CrossRef]
  12. Zhang, Z.; Li, J.; Wang, X.; Zhao, Y.; Xue, S.; Su, Z. Parameters Optimization and Test of an Arc-Shaped Nail-Tooth Roller-Type Recovery Machine for Sowing Layer Residual Film. Agriculture 2022, 12, 660. [Google Scholar] [CrossRef]
  13. Dong, J.; Li, S.; Bi, X.; Wang, G.; Wang, J.; Wang, W.; Tong, N. Design and Experimental Research of a New Film-Picking Mulch Film Recovery Machine with Impurity Separation Function. Processes 2022, 10, 455. [Google Scholar] [CrossRef]
  14. Wang, G.; Zhang, W.; Ji, M.; Miao, H.; Jin, Z. Numerical simulation and parameter optimization of earth auger in hilly area using EDEM software. Sci. Rep. 2022, 12, 19526. [Google Scholar] [CrossRef] [PubMed]
  15. Liang, Z.; Huang, Y.; Li, D.; Wada, M.E. Parameter determination of a viscoelastic-plastic contact model for potatoes during transient collisions. Biosyst. Eng. 2023, 234, 156–171. [Google Scholar] [CrossRef]
  16. El Salem, A.; Wang, H.; Gao, Y.; Zha, X.; Abdeen, M.A.; Zhang, G. Effect of Biomimetic Surface Geometry, Soil Texture, and Soil Moisture Content on the Drag Force of Soil-Touching Parts. Appl. Sci. 2021, 11, 8927. [Google Scholar] [CrossRef]
  17. Zhou, D.; Hou, P.; Xin, Y.; Wu, B.; Tong, J.; Yu, H.; Qi, J.; Zhang, J.; Zhang, Q. Resistance and Consumption Reduction Mechanism of Bionic Vibration and Verification of Field Subsoiling Experiment. Appl. Sci. 2021, 11, 10480. [Google Scholar] [CrossRef]
  18. Kesner, A.; Choteborsky, R.; Linda, M.; Hromasova, M.; Katinas, E.; Sutanto, H. Stress distribution on a soil tillage machine frame segment with a chisel shank simulated using discrete element and finite element methods and validate by experiment. Biosyst. Eng. 2021, 209, 125–138. [Google Scholar] [CrossRef]
  19. Yang, Q.; Shi, L.; Shi, A.; He, M.; Zhao, X.; Zhang, L.; Addy, M. Determination of key soil characteristic parameters using angle of repose and direct shear stress test. Int. J. Agric. Biol. Eng. 2023, 16, 143–150. [Google Scholar] [CrossRef]
  20. Zhang, L.; Zhai, Y.; Wu, C.; Huang, S.; Zhang, Z. Modeling the interaction between a new four-bar subsoiling mechanism and red soil using the improved differential evolution algorithm and DEM. Comput. Electron. Agric. 2023, 208, 107783. [Google Scholar] [CrossRef]
  21. Li, X.; Luo, Z.; Hao, Z.; Zheng, E.; Yao, H.; Zhu, Y.; Wang, X. Investigation on tillage resistance and soil disturbance in wet adhesive soil using discrete element method with three-layer soil-plough coupling model. Powder Technol. 2024, 436, 193. [Google Scholar] [CrossRef]
  22. Zhu, D.; Shi, M.; Yu, C.; Yu, Z.; Kuang, F.; Xiong, W.; Xue, K. Tool-straw-paddy soil coupling model of mechanical rotary-tillage process based on DEM-FEM. Comput. Electron. Agric. 2023, 215, 108420. [Google Scholar] [CrossRef]
  23. Fang, W.; Wang, X.; Han, D.; Chen, X. Review of Material Parameter Calibration Method. Agriculture 2022, 12, 706. [Google Scholar] [CrossRef]
  24. Tamas, K.; Bernon, L. Role of particle shape and plant roots in the discrete element model of soil-sweep interaction. Biosyst. Eng. 2021, 211, 77–96. [Google Scholar] [CrossRef]
  25. Kim, Y.S.; Lee, S.D.; Baek, S.M.; Baek, S.Y.; Jeon, H.H.; Lee, J.H.; Siddique, M.A.; Kim, Y.J.; Kim, W.S.; Sim, T.; et al. Development of DEM-MBD coupling model for draft force prediction of agricultural tractor with plowing depth. Comput. Electron. Agric. 2022, 202, 107405. [Google Scholar] [CrossRef]
  26. Bahrami, M.; Naderi-Boldaji, M.; Ghanbarian, D.; Keller, T. Discrete element modelling of stress propagation in soil under a rigid wheel in a soil bin: A simulation of probe inducing stress deviation and wheel speed. Biosyst. Eng. 2023, 230, 159–170. [Google Scholar] [CrossRef]
  27. Liu, L.; Wang, X.; Zhang, X.; Cheng, X.; Wei, Z.; Zhou, H.; Zhao, K. The impact of ‘T’-shaped furrow opener of no-tillage seeder on straw and soil based on discrete element method. Comput. Electron. Agric. 2023, 213, 108278. [Google Scholar] [CrossRef]
  28. Liu, W.; Zeng, S.; Chen, X. Design and Experiment of Adaptive Profiling Header Based on Multi-Body Dynamics-Discrete Element Method Coupling. Agriculture 2024, 14, 105. [Google Scholar] [CrossRef]
  29. Li, S.; Hu, M.; Liu, Y.; Li, Y. DEM parameters of slope cultivated purple soil in Southwest China and interaction mechanism between very narrow tine. Sci. Rep. 2024, 14, 18089. [Google Scholar] [CrossRef]
  30. Ma, C.; Meng, H.W.; Zhang, J.; Zhang, C.; Zhao, Y.; Wang, L.H. Research and experiment on the trenching performance of orchard trenching device. Sci. Rep. 2023, 13, 18941. [Google Scholar] [CrossRef]
  31. Yuan, H.; Liang, S.; Wang, J.; Lu, Y. Numerical Simulation and Analysis of Vibrating Rice Filling Based on EDEM Software. Agriculture 2022, 12, 2013. [Google Scholar] [CrossRef]
  32. Liu, L.; Wang, X.; Zhang, X.; Zhong, X.; Wei, Z.; Geng, Y.; Cheng, X.; Zhao, K.; Bai, M. Determination and verification of parameters for the discrete element modelling of single disc covering of flexible straw with soil. Biosyst. Eng. 2023, 233, 151–167. [Google Scholar] [CrossRef]
  33. Shi, Y.; Jiang, Y.; Wang, X.; Thuy, N.T.D.; Yu, H. A mechanical model of single wheat straw with failure characteristics based on discrete element method. Biosyst. Eng. 2023, 230, 1–15. [Google Scholar] [CrossRef]
  34. Tang, H.; Xu, C.; Zhao, J.; Wang, J. Stripping mechanism and loss characteristics of a stripping-prior-to-cutting header for rice harvesting based on CFD-DEM simulations and bench experiments. Biosyst. Eng. 2023, 229, 116–136. [Google Scholar] [CrossRef]
  35. Du, C.; Han, D.; Song, Z.; Chen, Y.; Chen, X.; Wang, X. Calibration of contact parameters for complex shaped fruits based on discrete element method: The case of pod pepper (Capsicum annuum). Biosyst. Eng. 2023, 226, 43–54. [Google Scholar] [CrossRef]
  36. Wang, X.; Gao, P.; Yue, B.; Shen, H.; Fu, Z.; Zheng, Z.; Huang, Y. Optimization of installation parameters of subsoiler’ wing using the discrete element method. Comput. Electron. Agric. 2019, 162, 523–530. [Google Scholar] [CrossRef]
  37. Guo, J.; Zhang, Q.; Muhammad, S.M.; Ji, C.; Zhao, Z. Design and experiment of bionic mole’s toe arrangement serrated blade for soil-rototilling and straw-shattering. Trans. Chin. Soc. Agric. Eng. 2017, 33, 43–50. [Google Scholar] [CrossRef]
  38. Hu, G.; Quan, L.; Zou, Y.; Shen, H. Establishment and simulation test of membrane-soil separation model for mechanical recycling of agricultural residual film. J. Hunan Agric. Univ. 2021, 287, 344–350. [Google Scholar] [CrossRef]
  39. Fang, W.; Wang, X.; Han, D.; Zang, N.; Xue, G.; Israel, E.O. Parameter Optimization and Disturbance Analysis of the Film Picking Device of the Chain-Type Plough Layer Residual Film Recovery Machine Based on DEM-MBD Coupling. Comput. Electron. Agric. 2024, 222, 109041. [Google Scholar] [CrossRef]
  40. Meng, F. Biomimetic Design and Experiment of Sliding Trench Device. Chang. Jilin Univ. 2021, 16–21. [Google Scholar] [CrossRef]
  41. Jin, W.; Liu, J.; Xu, C.; Zhang, X.; Bai, S. Design, Simulation and Experimentation of a Polythene Film Debris Recovery Machine in Soil. Appl. Sci. 2022, 12, 1366. [Google Scholar] [CrossRef]
  42. Guo, W.; He, X.; Wang, L.; Zhao, P.; Hu, C.; Hou, S.; Wang, X. Development of a comb tooth loosening and pneumatic stripping plough layer residual film recovery machine. Trans. Chin. Soc. Agric. Eng. 2020, 36, 1–10. [Google Scholar] [CrossRef]
  43. Huang, W.; Wang, H.; Dai, W.; Zhang, M.; Ren, D.; Wang, W. Study on the throwing device of residual film recycling machine for the plough layer. Comput. Electron. Agric. 2024, 227, 109679. [Google Scholar] [CrossRef]
  44. Shi, Z.; Zhang, X.; Liu, X.; Guo, L.; Zhang, C.; Liu, L. Design and Test of Roll-type Tillage Layer Residual Film Recovery Machine. Trans. Chin. Soc. Agric. Mach. 2024, 55, 128–137. [Google Scholar]
  45. Peng, Q.; Li, K.; Wang, X.; Zhang, G.; Kang, J. Design and Test of Stripping and Impurity Removal Device for Spring-Tooth Residual Plastic Film Collector. Agriculture 2023, 13, 42. [Google Scholar] [CrossRef]
  46. Fang, W.; Wang, X.; Zhu, C.; Han, D.; Zang, N.; Chen, X. Analysis of Film Unloading Mechanism and Parameter Optimization of Air Suction-Type Cotton Plough Residual Film Recovery Machine Based on CFD-DEM Coupling. Agriculture 2024, 14, 1021. [Google Scholar] [CrossRef]
  47. Jin, W.; Zhang, X.; Ding, Y.; Bai, S.; Liu, W.; Zhou, X. Experiment on Suspension Separation of Residual Film and Impurity Based on EDEM-Fluent Coupling. Trans. Chin. Soc. Agric. Mach. 2022, 53, 89–98. [Google Scholar]
  48. Zhang, S.; Jia, X.; Dong, J.; Wang, X.; Zhao, H.; Chen, X.; Zhang, Z.; Huang, Y.; Shi, J. Optimization of operating angles of disc coulters for maize residue management using discrete element method. Comput. Electron. Agric. 2024, 218, 108691. [Google Scholar] [CrossRef]
  49. Deng, H.; Dai, F.; Shi, R.; Song, X.; Zhao, W.; Pan, H. Simulation of full-film double-row furrow roller hole fertiliser application based on DEM-MBD coupling and research on its water and fertiliser transport law. Biosyst. Eng. 2024, 239, 190–206. [Google Scholar] [CrossRef]
  50. Wang, X.; Zhang, Q.; Huang, Y.; Ji, J. An efficient method for determining DEM parameters of a loose cohesive soil modelled using hysteretic spring and linear cohesion contact models. Biosyst. Eng. 2022, 215, 283–294. [Google Scholar] [CrossRef]
Figure 1. Material sampling and characterization. (a) Five-point sampling method for field collection; (b) soil temperature and moisture content measurement; (c) bulk density determination using the cutting ring method; (d) particle size distribution analysis; (e) statistical evaluation of soil particle sizes.
Agronomy 15 01002 g001
Figure 2. Comparison of the simulation results with the test results for the stacking angle. (A) Stacking angle of the soil of simulation; (B) stacking angle of the soil from the experiment; (C) stacking angle of the residual film from the simulation; (D) stacking angle of the residual film from the experiment.
Agronomy 15 01002 g002
Figure 3. Schematic diagram of the overall structure of the residual film recovery machine. (A) Two-dimensional diagram of the overall structure; (B) three-dimensional diagram of the overall structure; (C) schematic diagram of the residual film movement path. 1. Tractor traction. 2. Front rotary tiller. 3. Chain-type film-picking and tooth assembly. 4. Upper air suction and unloading film assembly. 5. Lower air suction and unloading film assembly. 6. Lower lifting film component.
Agronomy 15 01002 g003
Figure 4. Force analysis during soil cutting by elastic teeth. (a) Microscopic analysis of elastic tooth traction forces; (b) dynamic pressure distribution in micro-scale analysis; (c) sliding friction resistance mechanism in micro-scale analysis.
Agronomy 15 01002 g004
Figure 5. Soil resistance to penetration measuring instrument. (A) Two-dimensional diagram of soil resistance to penetration measurement plan; (B) soil resistance to penetration measurement test equipment.
Agronomy 15 01002 g005
Figure 6. Single-tooth film-picking device and multi-tooth film-picking simulation model. (a) Single-tooth film-picking test device. (A1) Two-dimensional schematic diagram of a single-tooth film picker; (B1) three-dimensional and physical image of a single-tooth test device; (b) three-dimensional diagram of a multi-tooth simulation device, and schematic diagram of the unfolded multi-tooth film picker. (A2) Three-dimensional diagram of a multi-tooth simulation device; (B2) schematic diagram of the unfolded multi-tooth film picker.
Agronomy 15 01002 g006aAgronomy 15 01002 g006b
Figure 7. Film-lifting test device. (A) Diagram of the pressure measurement scheme for film-picking teeth; (B) multi-tooth film-lifting test device.
Agronomy 15 01002 g007
Figure 8. The influence of particle radius on soil cross section and soil throwing during the simulation process. (A) Soil cross-section diagram; (B) the variation trend of soil cross-sectional depth and width (after backfilling) after disturbance; (C) soil-throwing map.
Agronomy 15 01002 g008
Figure 9. Simulation and experimental analysis of soil firmness under different soil radii. (A) Simulation process of soil resistance to penetration; (B) simulation results of soil resistance to penetration with varying sizes of particles.
Agronomy 15 01002 g009
Figure 10. Response surface analysis of the effect of forward speed, soil penetration depth, and power wheel speed on the film-lifting rate. (A) Y 1 = ( X 1 , X 2 , 0 ) ; (B) Y 1 = ( X 1 , 0 , X 3 ) ; (C) Y 1 = ( 0 , X 2 , X 3 ) ; (D) optimization analysis chart (The closer to red, the higher the target value, and the closer to green, the lower the target value).
Agronomy 15 01002 g010
Figure 11. Single-tooth validation test and field validation test process. (A) Single-tooth film-lifting device film-lifting test; (B) multi-tooth film-lifting device film-lifting test; (C) soil moisture content measurement.
Agronomy 15 01002 g011
Figure 12. Simulation and experimental data analysis of the torque of the tooth. (A) Simulation process diagram of torque measurement; (B) comparison of torque values between the simulation and experiment; (C) test diagram for torque measurement; (D) soil depth measurement during the torque measurement process.
Agronomy 15 01002 g012
Figure 13. Stress analysis of the film-picking device under different rotational speeds. (A) Mathematical modeling simulation value; (B) DEM-MBD simulation and experimental result comparison analysis chart.
Agronomy 15 01002 g013
Figure 14. Comparative analysis of residual film–soil disturbance in the simulation and experiment under the action of the elastic tooth. (A) Simulation diagram of residual film motion path prediction; (B) residual film movement path test diagram; (C) the cross-sectional shape of the soil after film lifting (simulation); (D) the cross-sectional shape of the soil after film lifting (experiment).
Agronomy 15 01002 g014
Table 1. Summary of material intrinsic and contact parameters.
ParameterSoil65 Mn SteelResidual Plastic Film
Poisson’s ratio0.360.350.21
Shear modulus (Pa)1 × 1067.27 × 10101.12 × 106
Density (kg·m−3)1.610 × 1037.830 × 1030.915 × 103
Soil-65Mn steelSoil–Residual filmSoil–SoilResidual film–Residual filmResidual film–65Mn steel
coefficient of
static friction
0.500.550.740.520.45
coefficient of
rolling friction
0.310.460.220.40.4
coefficient of
collision recovery
0.430.50.520.570.5
Table 2. Experimental factors and levels.
LevelsMoving Speed
v ( m · s 1 )
Speed of Driving Wheel
of Conveyor Chain n ( r a d · s 1 )
Depth
into Soil h (mm)
−10.836.28100
01.398.37125
11.9410.47150
Table 3. Experimental design scheme and response values.
No. v / X 1 n / X 2 h / X 3 Residual   Film   Recovery   Rate   Y 1 / %
1−11087.29
200085.39
30−1179.28
4−10−183.09
500085.84
6−10178.51
701−187.61
810181.04
900086.01
10−11087.29
1100085.38
1200086.07
1311087.88
1401184.13
151−1084.19
160−1−182.59
1710−186.46
Table 4. Analysis of variance of the regression equation.
Source Residual   Film   Recovery   Rate   Y 1 /%
Sum of SquaresDegree of FreedomFSignificance Level
Model131.42945.84<0.0001 **
A-v12.05137.840.0005 **
B-n49.951156.81<0.0001 **
C-h35.241110.62<0.0001 **
AB1.8815.890.0456 *
AC0.176410.55380.4810
BC0.007210.02270.8845
A23.45110.830.0133 *
B20.208010.65290.4457
C227.55186.48<0.0001 **
Residual14.175
Lack of Fit9.5035.360.0692
Pure Error4.672
Cor Total226.0014
** represents extremely significant, * represents significant.
Disclaimer/Publisher’s Note: The statements, opinions and data contained in all publications are solely those of the individual author(s) and contributor(s) and not of MDPI and/or the editor(s). MDPI and/or the editor(s) disclaim responsibility for any injury to people or property resulting from any ideas, methods, instructions or products referred to in the content.

