
Responses of Soil Nitrogen Transformation and N2O Emission to Soil pH and Hydrothermal Changes


Abstract
:1. Introduction
2. Materials and Methods
2.1. Site Description and Soil Sampling
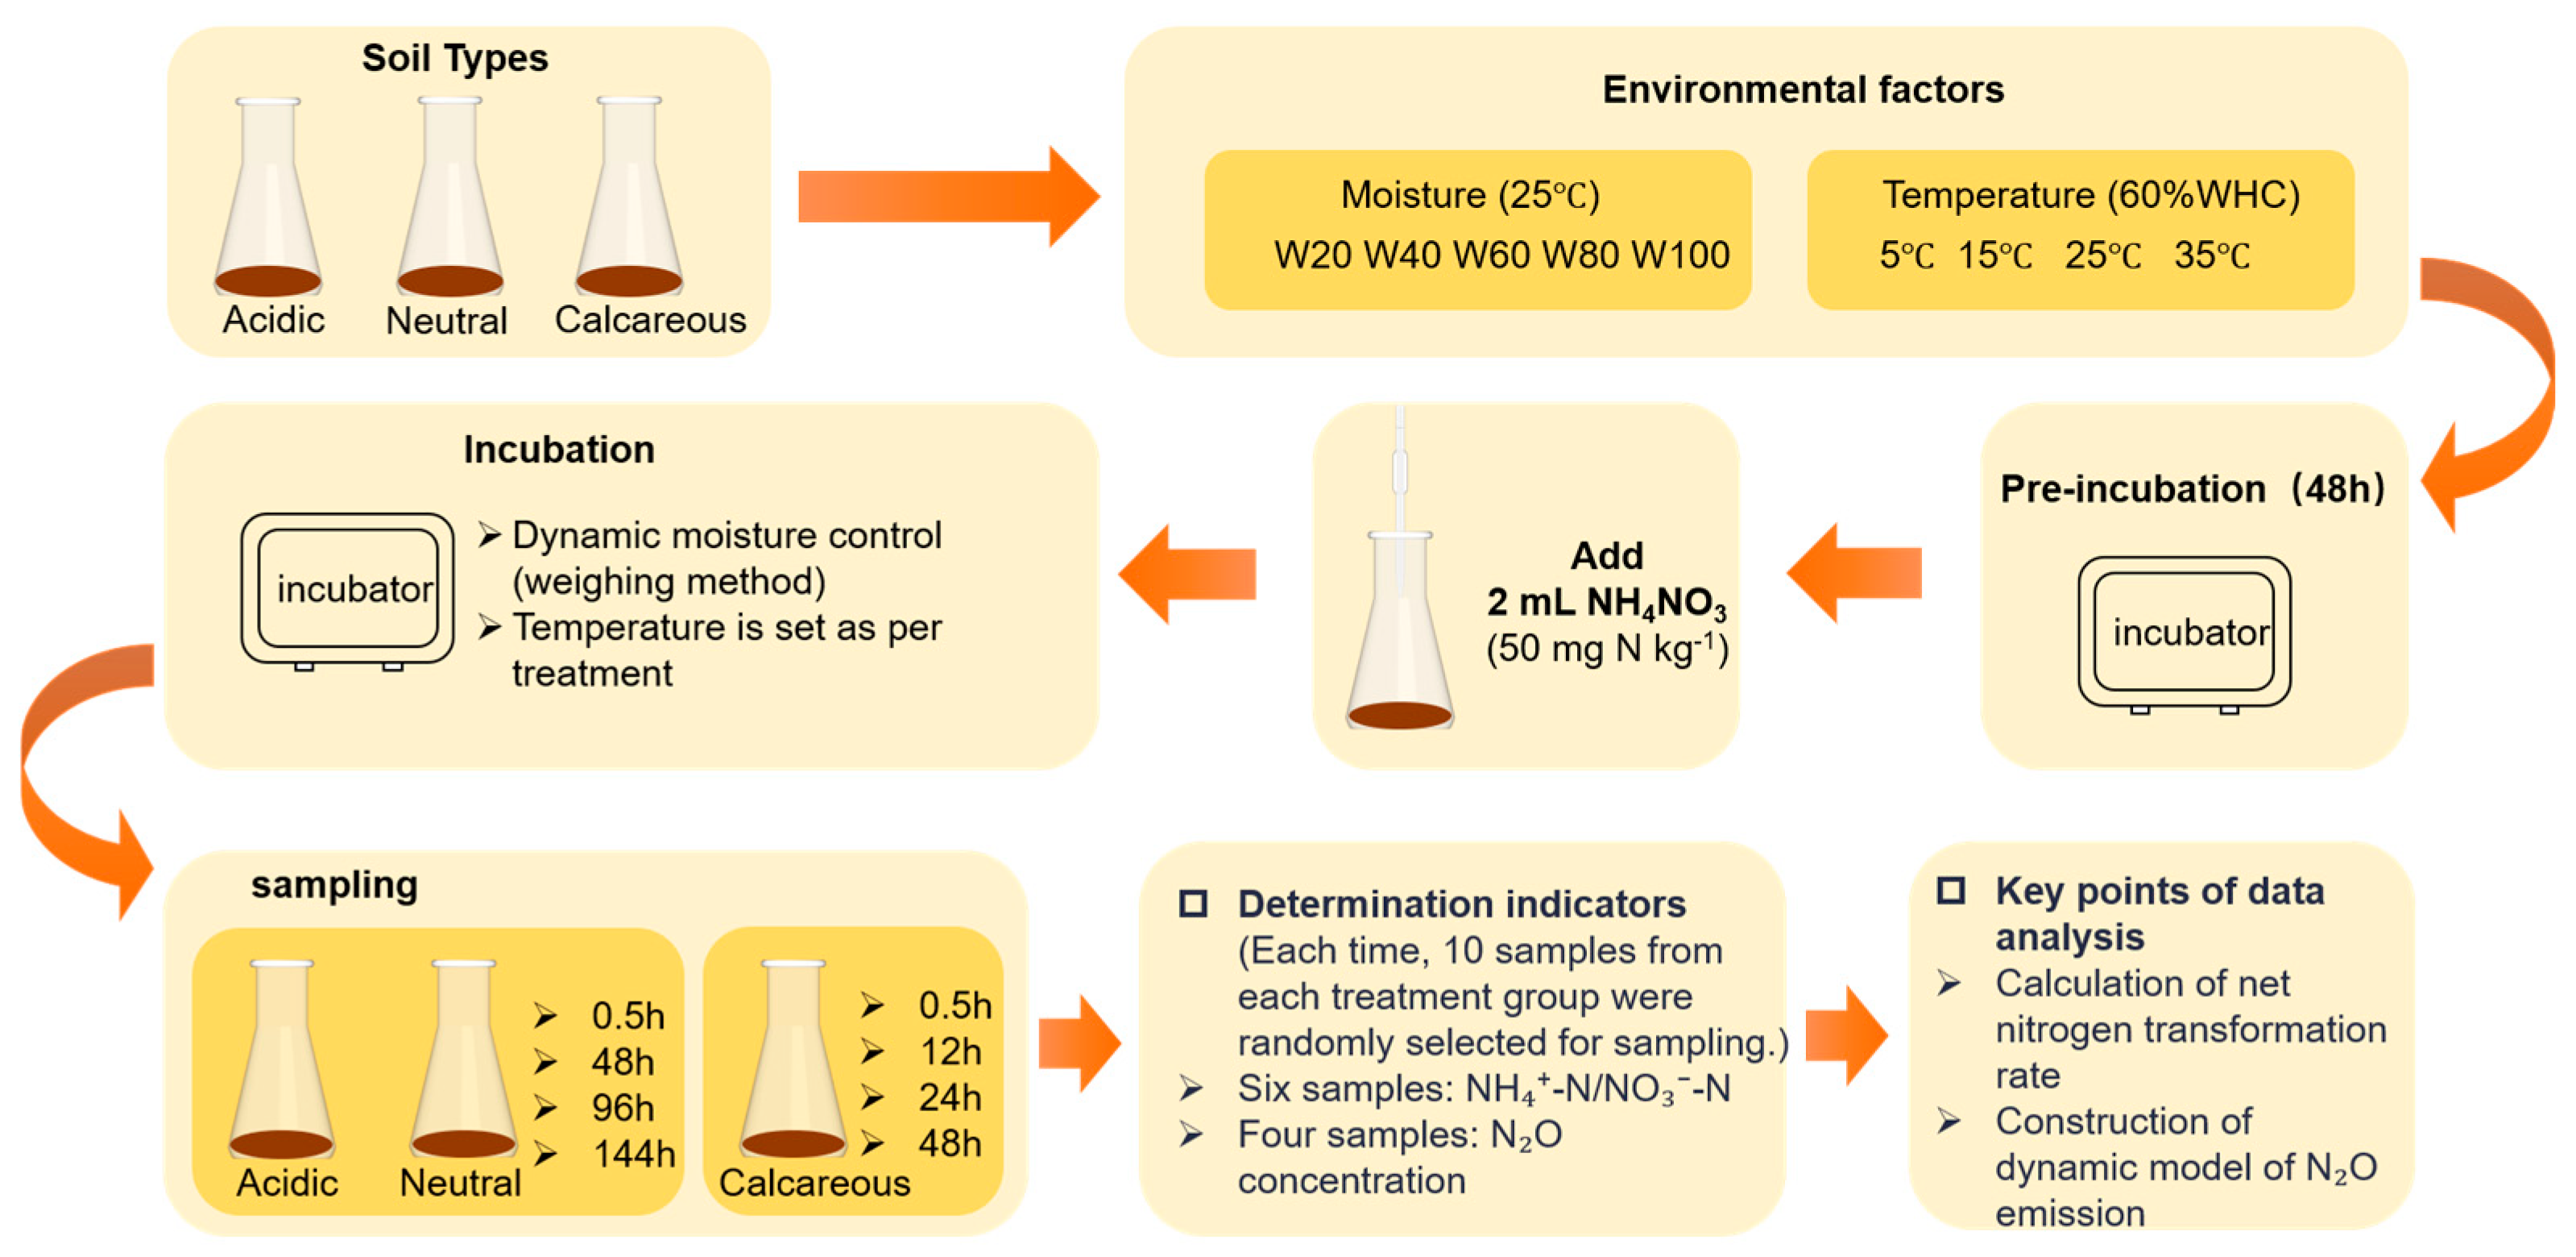
2.2. Experimental Setup
2.3. Analysis of Soil’s Physical and Chemical Properties
2.4. Calculations and Statistical Analysis
3. Results
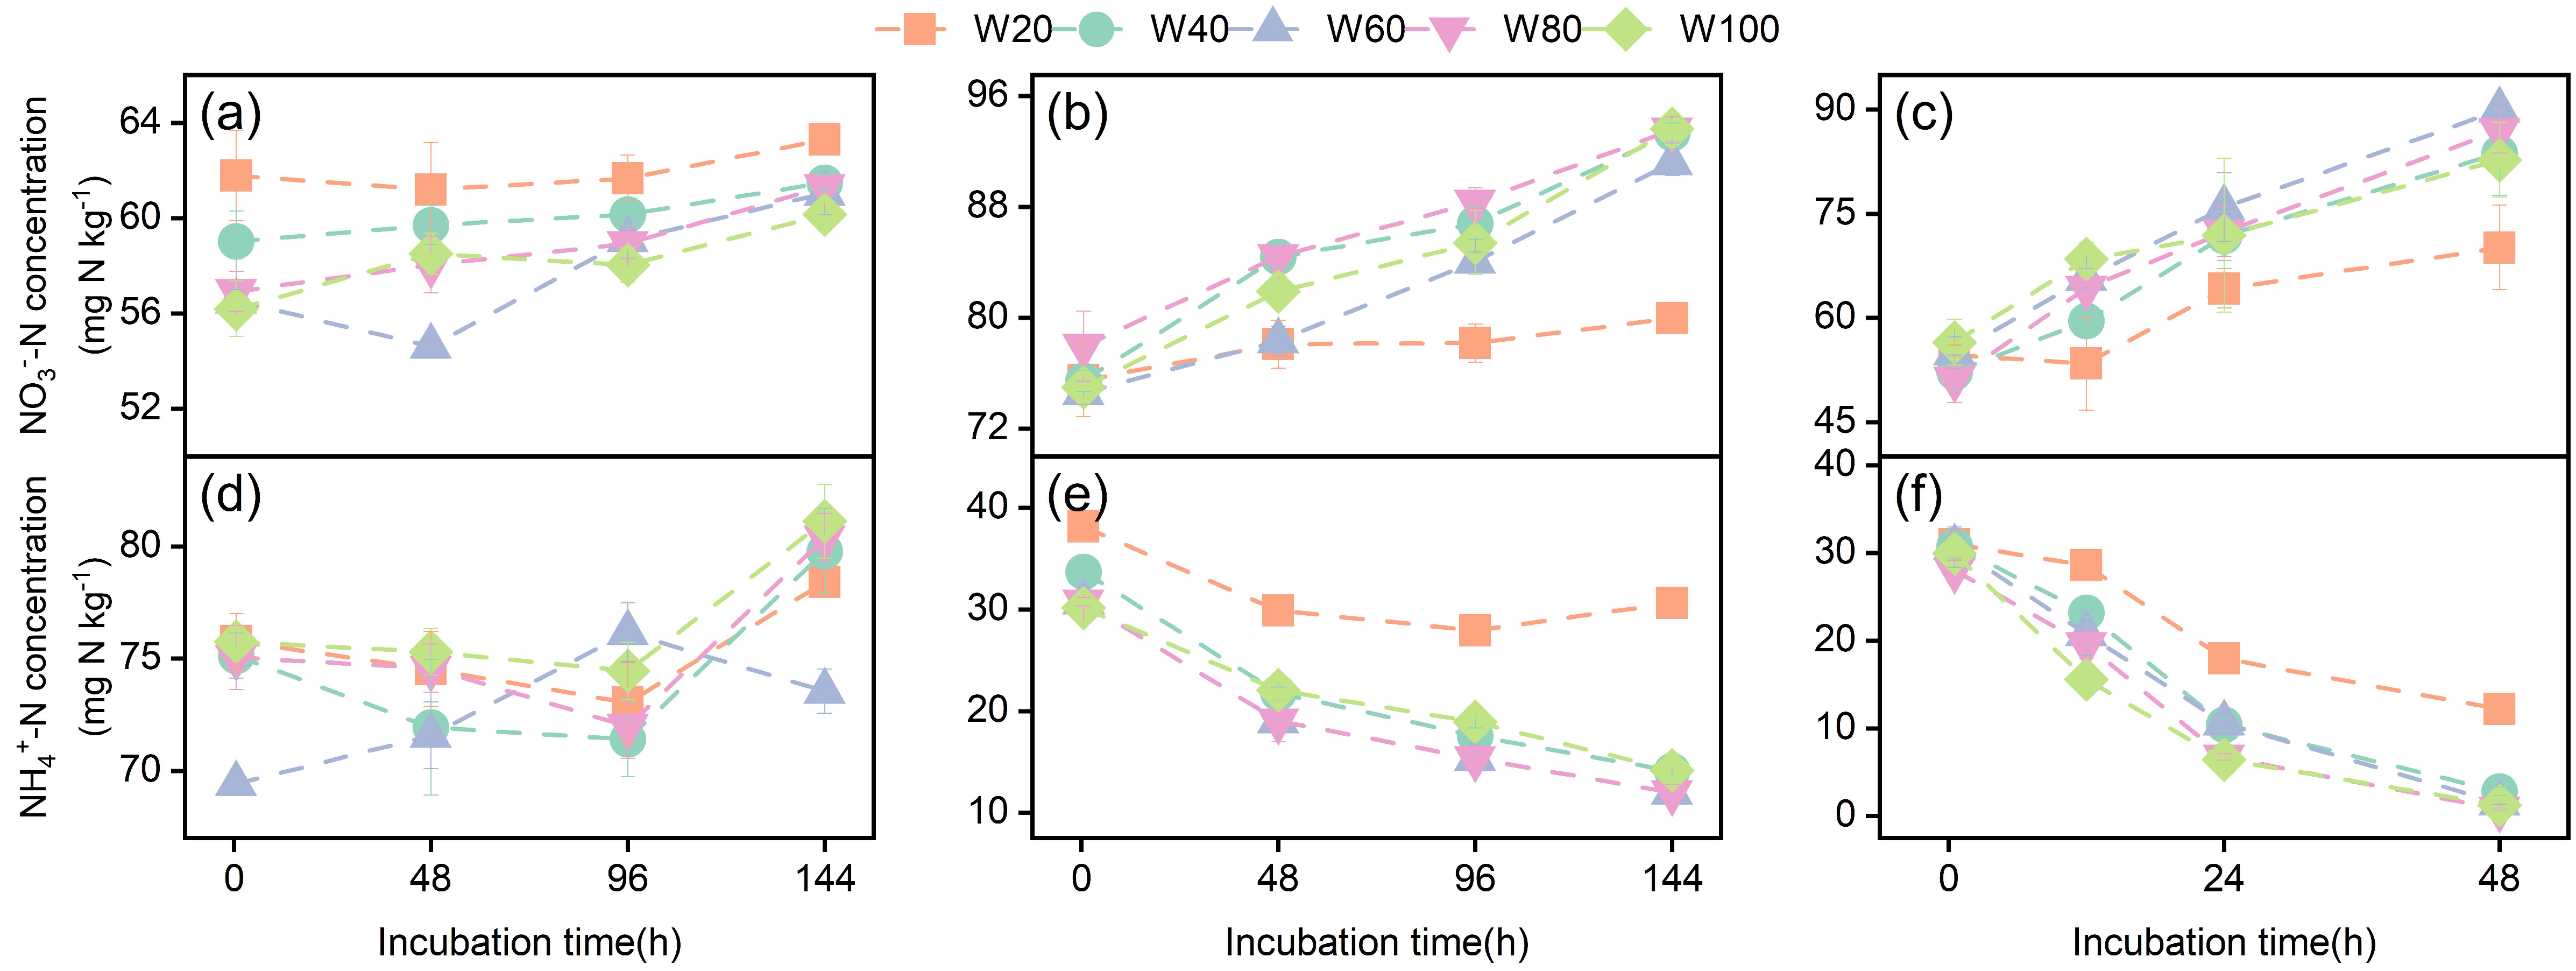
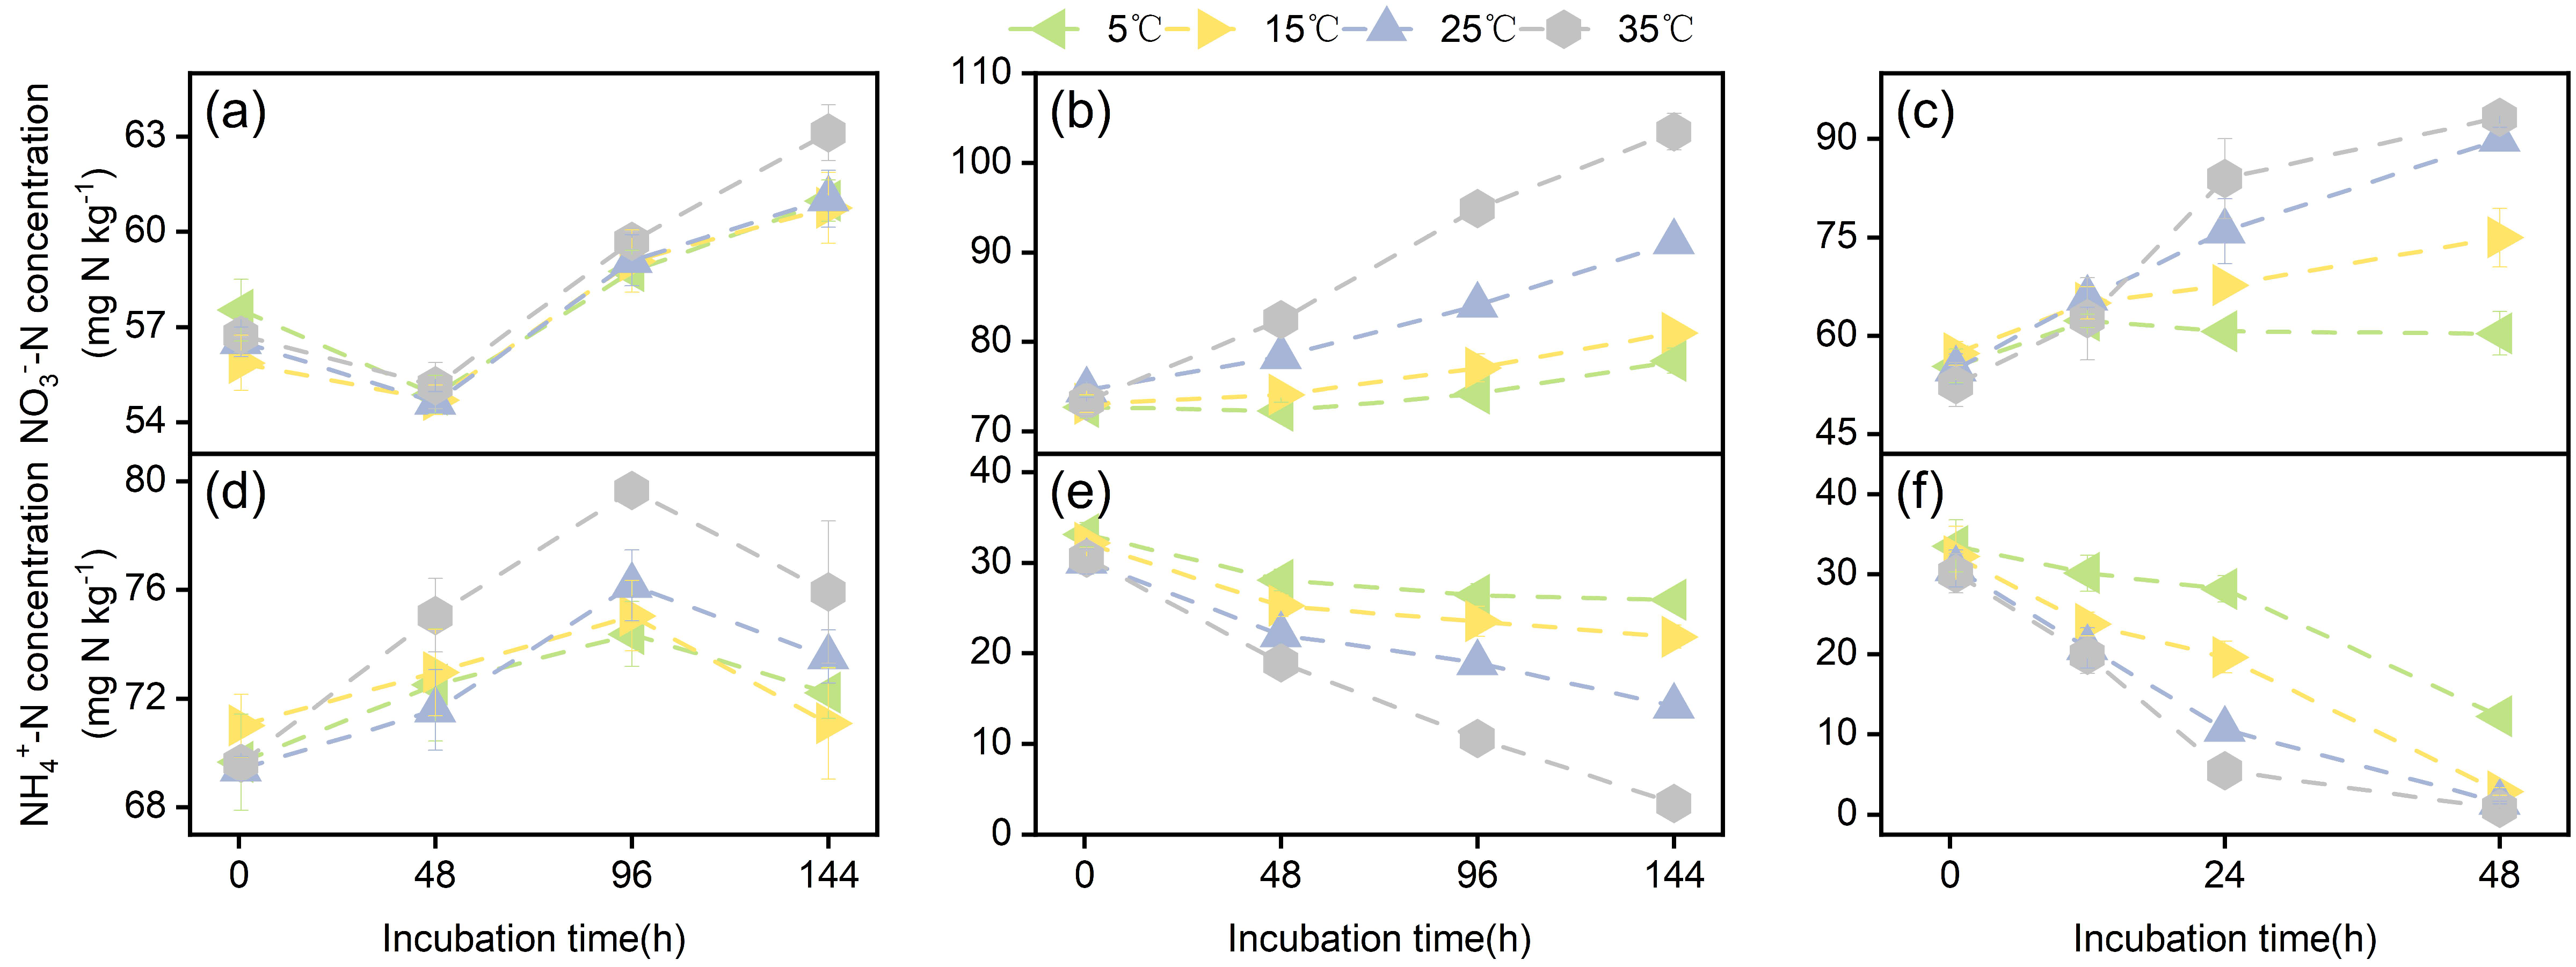
3.1. Soil NH4+-N and NO3−-N Concentrations During Incubation
3.2. Soil Net Nitrogen Transformation Rates
3.2.1. Soil Net Ammonification Rate
3.2.2. Soil Net Nitrification Rate
3.2.3. Soil Net Nitrogen Mineralization Rate
3.3. N2O Emissions
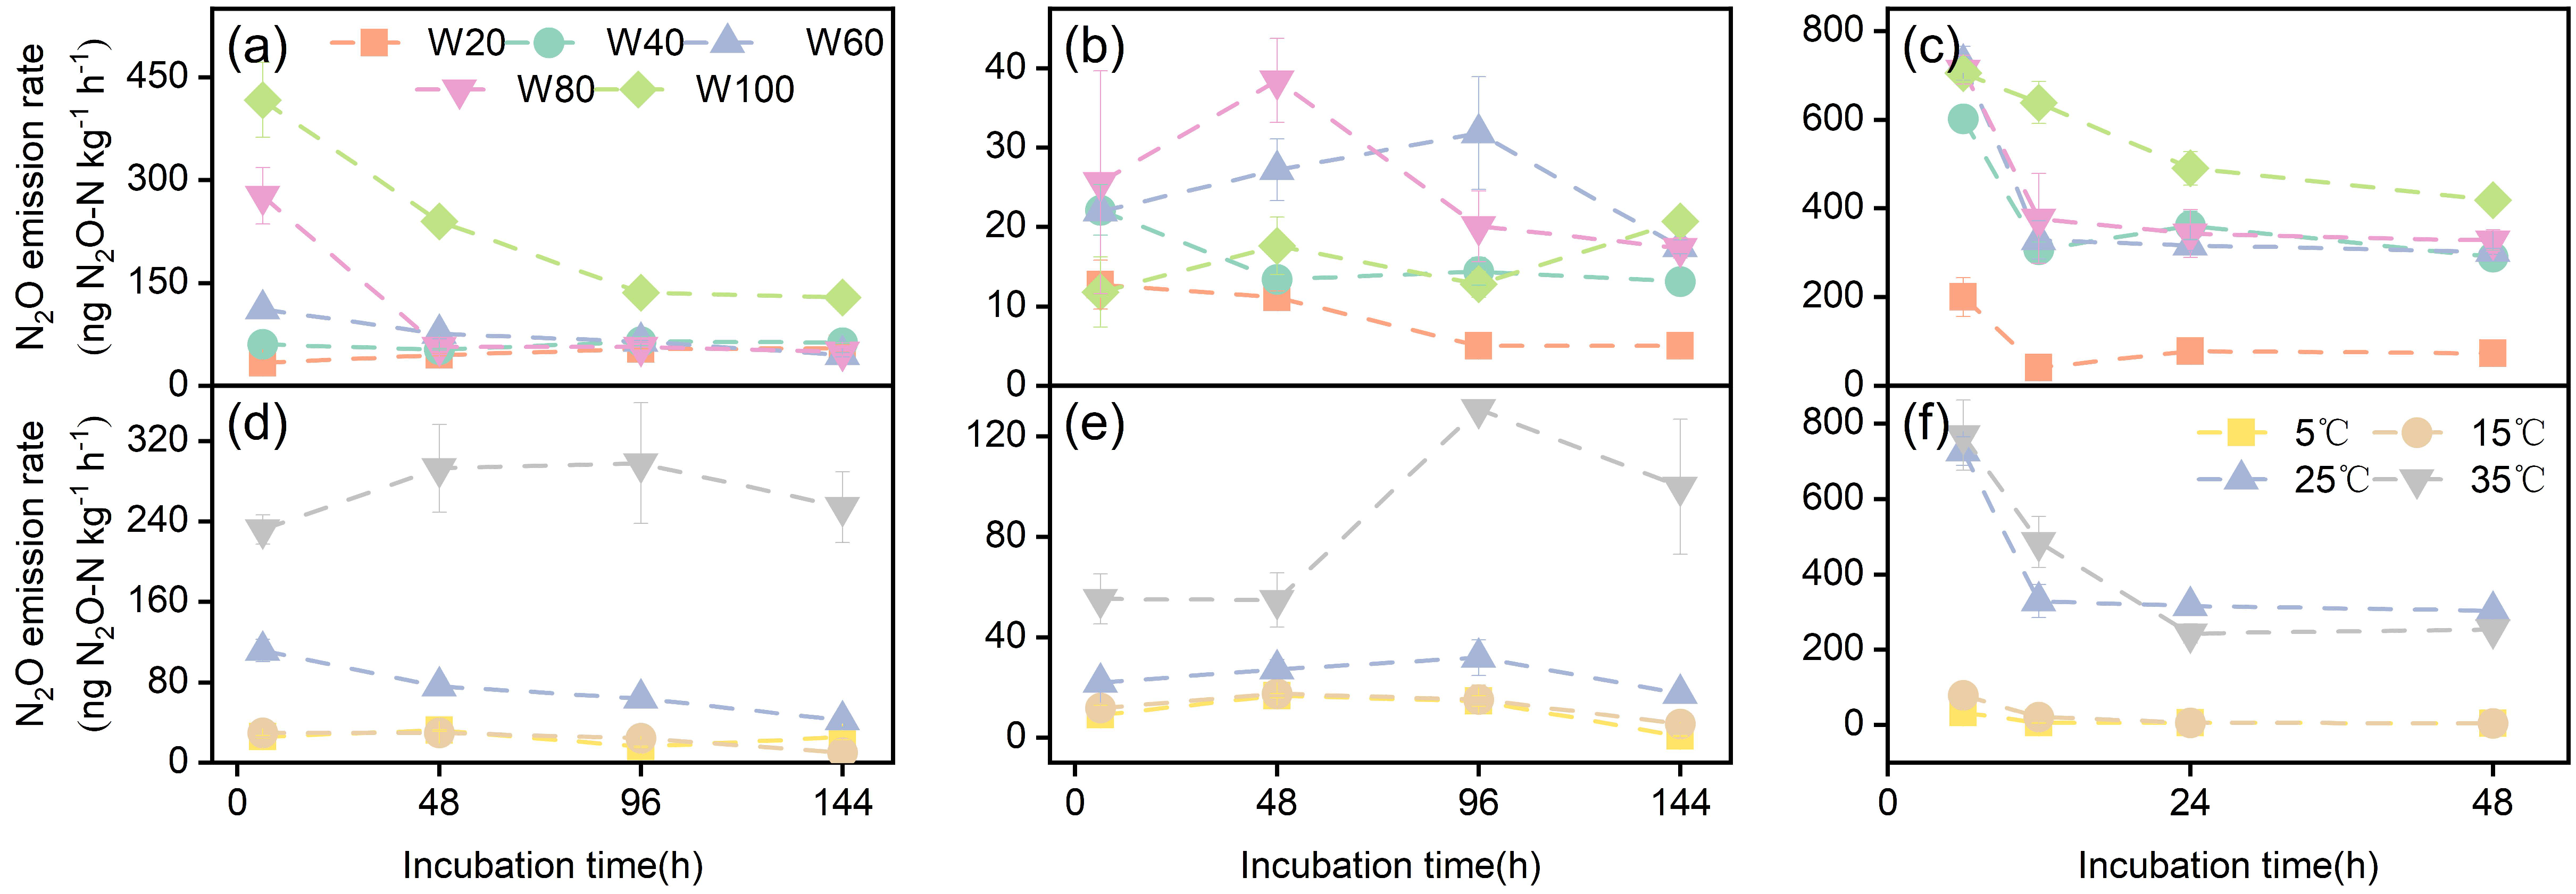
3.3.1. N2O Emission Rate
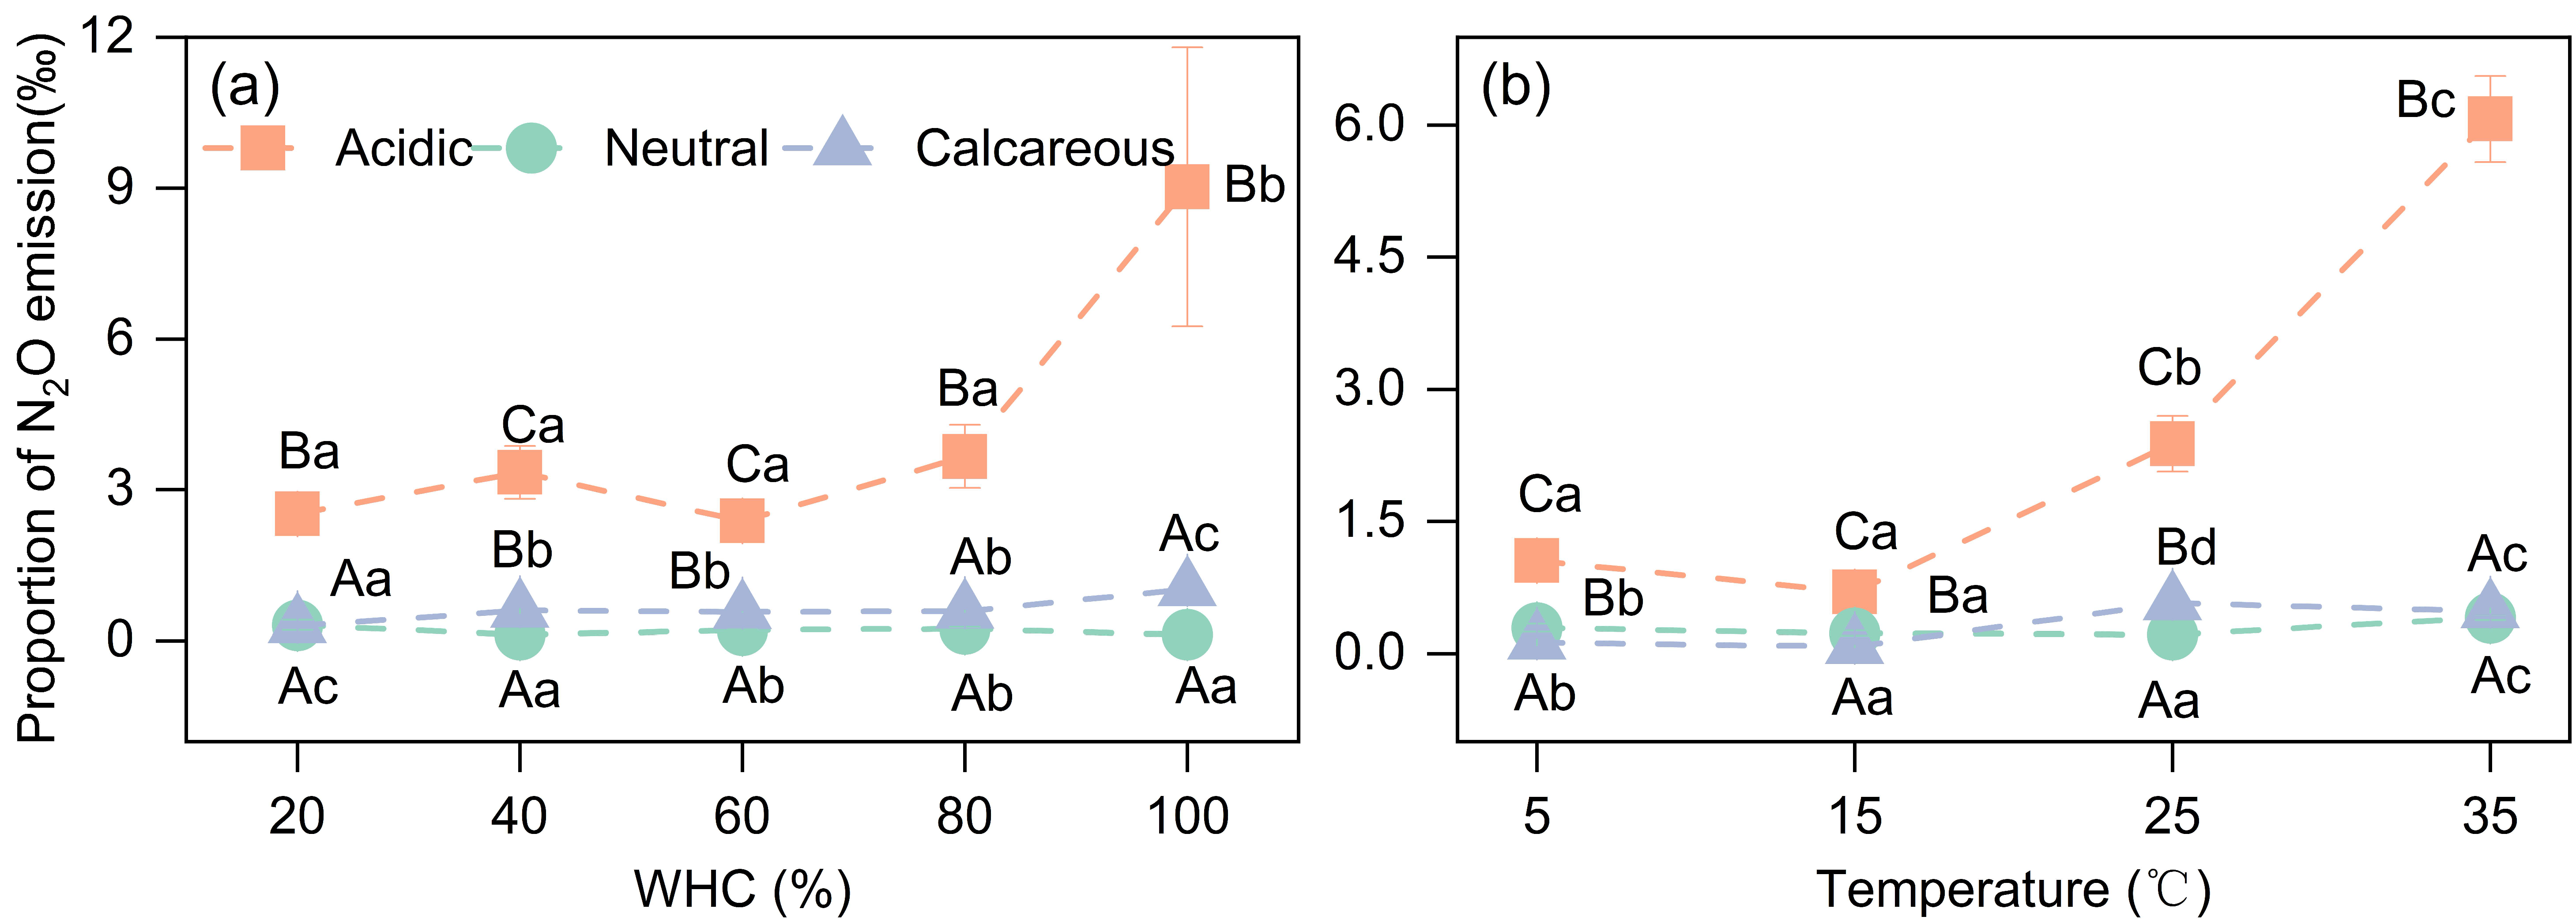
3.3.2. N2O Emission Ratio
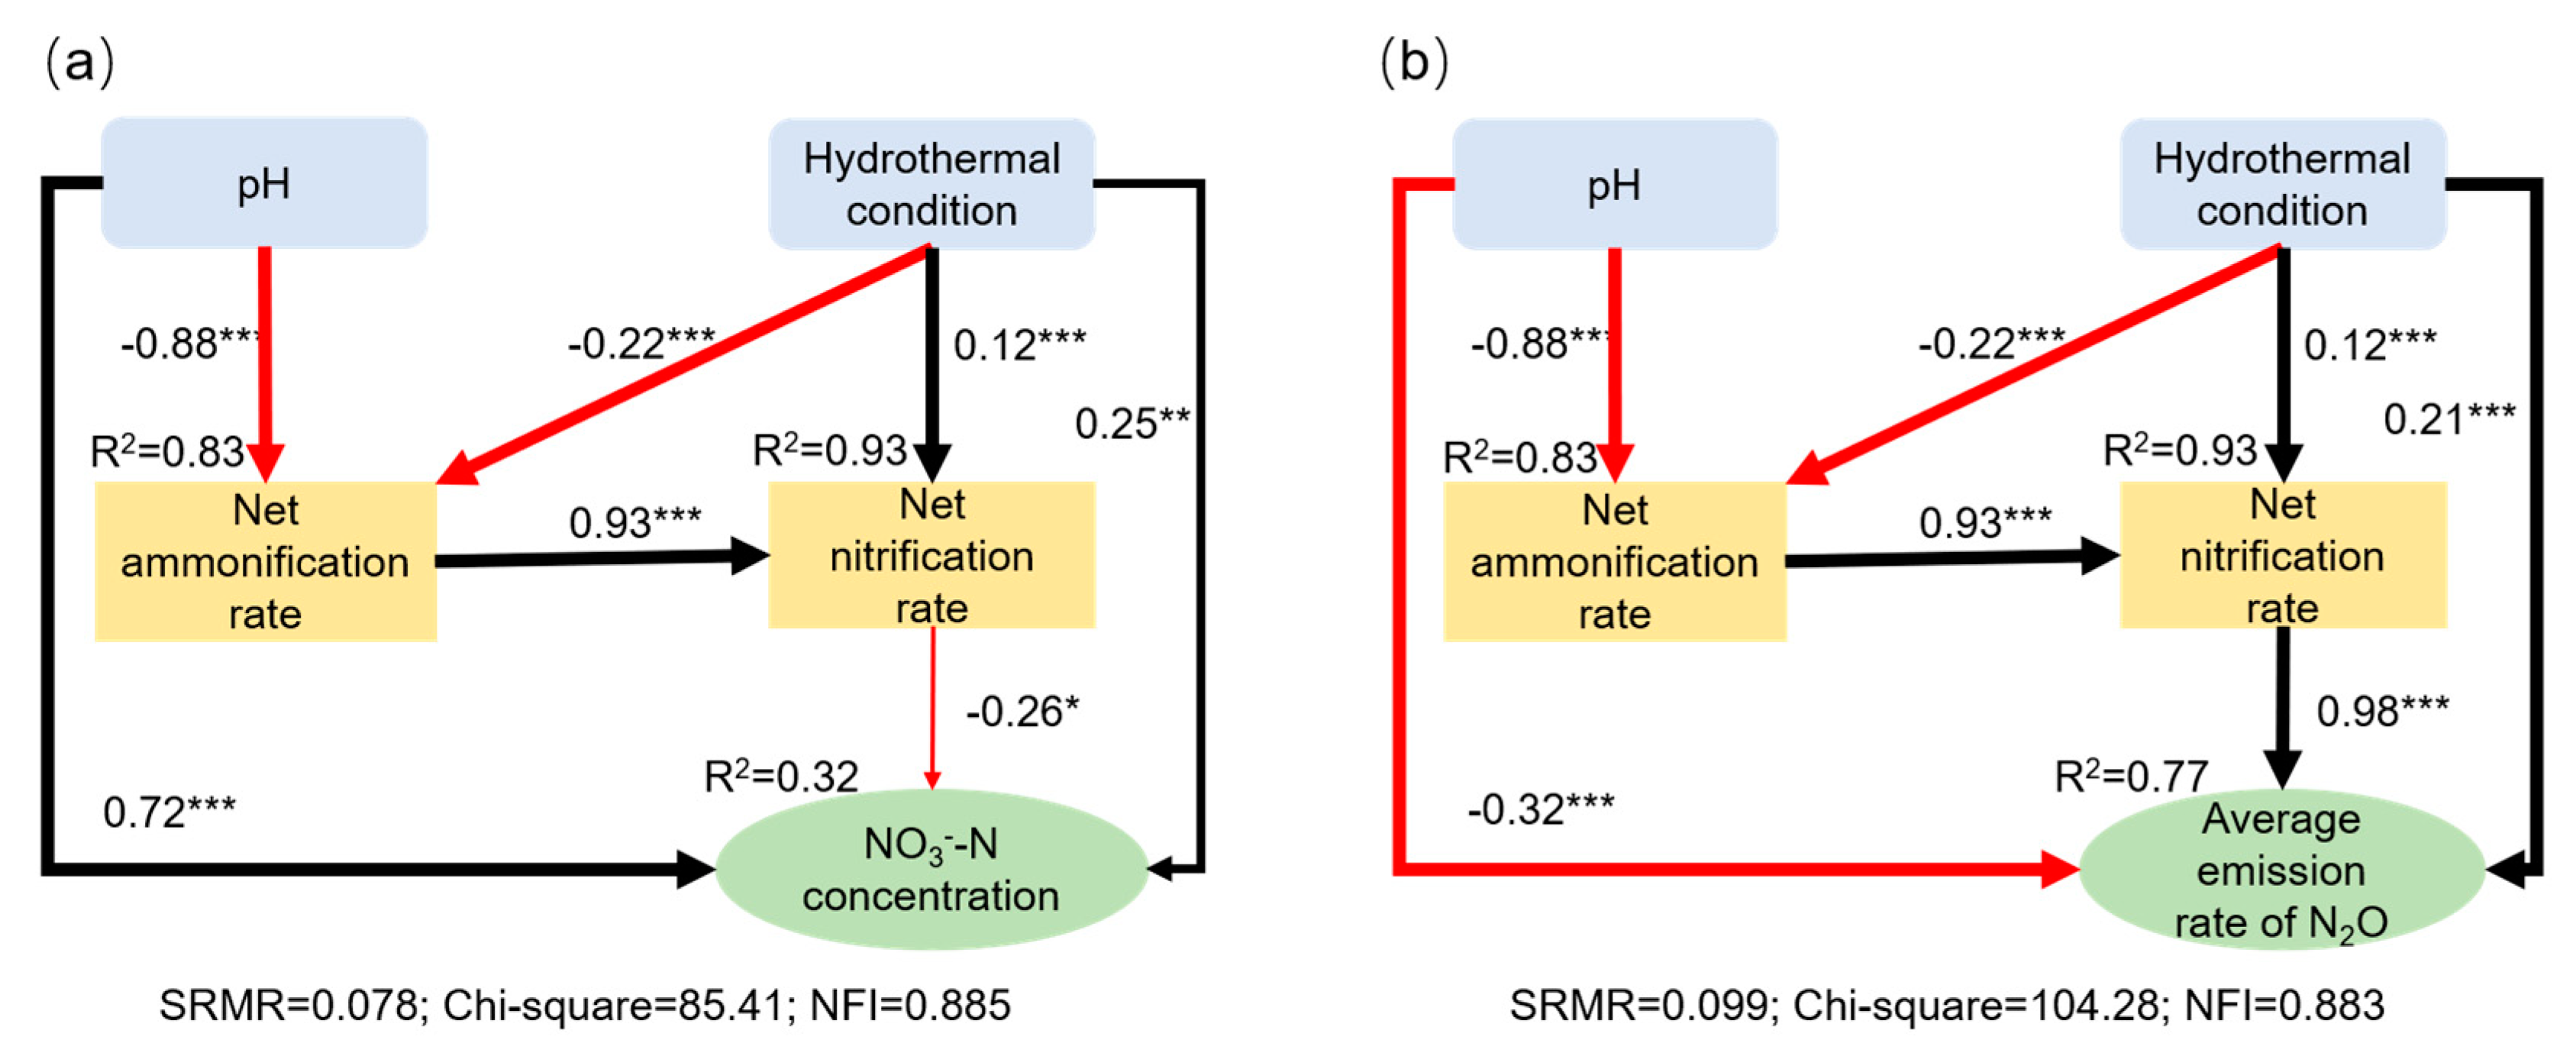
3.4. Factors Influencing the Net Nitrogen Transformation Rates and N2O Emissions in Soil
4. Discussion
4.1. The Influence of Soil Type and Hydrothermal Conditions on the Net Nitrogen Transformation Rates in Soil
4.1.1. The Impact of Soil pH on the Net Nitrogen Transformation Rates in Soil
4.1.2. The Impact of Soil on the Net Nitrogen Transformation Rate in Soil
4.1.3. The Impact of Temperature on the Net Nitrogen Transformation Rates in Soil
4.2. The Influence of Soil pH and Hydrothermal Conditions on Soil N2O Emissions
4.2.1. The Impact of Soil pH on Soil N2O Emissions
4.2.2. The Impact of Soil Moisture on Soil N2O Emissions
4.2.3. The Impact of Temperature on Net N2O Emissions in Soil
5. Conclusions
Author Contributions
Funding
Data Availability Statement
Conflicts of Interest
References
- Vitousek, P.M.; Porder, S.; Houlton, B.Z.; Chadwick, O.A. Terrestrial phosphorus limitation: Mechanisms, implications, and nitrogen-phosphorus interactions. Ecol. Appl. 2010, 20, 5–15. [Google Scholar] [CrossRef] [PubMed]
- Chen, X.; Cui, Z.; Fan, M.; Vitousek, P.; Zhao, M.; Ma, W.; Wang, Z.; Zhang, W.; Yan, X.; Yang, J.; et al. Producing more grain with lower environmental costs. Nature 2014, 514, 486–489. [Google Scholar] [CrossRef] [PubMed]
- Burgeon, V.; Fouche, J.; Garre, S.; Colinet, G.; Cornelis, J.-T.; Dehkordi, R.H. Young and century-old biochars strongly affect nutrient cycling in a temperate agroecosystem. Agric. Ecosyst. Environ. 2022, 328, 107847. [Google Scholar] [CrossRef]
- Gentile, R.M.; Boldingh, H.L.; Campbell, R.E.; Gee, M.; Gould, N.; Lo, P.; McNally, S.; Park, K.C.; Richardson, A.C.; Stringer, L.D.; et al. System nutrient dynamics in orchards: A research roadmap for nutrient management in apple and kiwifruit. A review. Agron. Sustain. Dev. 2022, 42, 64. [Google Scholar] [CrossRef]
- You, L.; Ros, G.H.; Chen, Y.; Zhang, F.; de Vries, W. Optimized agricultural management reduces global cropland nitrogen losses to air and water. Nat. Food 2024, 5, 995–1004. [Google Scholar] [CrossRef] [PubMed]
- Zhang, J.; Zhu, T.; Meng, T.; Zhang, Y.; Yang, J.; Yang, W.; Müller, C.; Cai, Z. Agricultural land use affects nitrate production and conservation in humid subtropical soils in China. Soil Biol. Biochem. 2013, 62, 107–114. [Google Scholar] [CrossRef]
- Gao, N.; Zhang, T.; Li, Z.; Tian, X.; Chen, J.; Zhang, J.; Mueller, C.; Li, S. Long-term effects of film mulching and fertilization regimes on gross N transformations in calcareous dryland soils. Appl. Soil Ecol. 2024, 204, 105747. [Google Scholar] [CrossRef]
- Liu, S.; Chi, Q.; Cheng, Y.; Zhu, B.; Li, W.; Zhang, X.; Huang, Y.; Mueller, C.; Cai, Z.; Zhang, J. Importance of matching soil N transformations, crop N form preference, and climate to enhance crop yield and reducing N loss. Sci. Total Environ. 2019, 657, 1265–1273. [Google Scholar] [CrossRef]
- Yang, L.; Zhu, G.; Ju, X.; Liu, R. How nitrification-related N2O is associated with soil ammonia oxidizers in two contrasting soils in China? Sci. Total Environ. 2021, 770, 143212. [Google Scholar] [CrossRef]
- Rousk, J.; Brookes, P.C.; Baath, E. Contrasting soil pH effects on fungal and bacterial growth suggest functional redundancy in carbon mineralization. Appl. Environ. Microbiol. 2009, 75, 1589–1596. [Google Scholar] [CrossRef]
- Cheng, Y.; Wang, J.; Mary, B.; Zhang, J.; Cai, Z.; Chang, S.X. Soil pH has contrasting effects on gross and net nitrogen mineralizations in adjacent forest and grassland soils in central Alberta, Canada. Soil Biol. Biochem. 2013, 57, 848–857. [Google Scholar] [CrossRef]
- Zhu, Q.; Liu, L.; Wang, C.; Wan, Y.; Yang, R.; Mou, J.; Liu, J.; Wu, Y.; Tang, S.; Zhu, T.; et al. Carbon and nitrogen fractions control soil N2O emissions and related functional genes under land-use change in the tropics. Environ. Pollut. 2023, 335, 122370. [Google Scholar] [CrossRef] [PubMed]
- Wang, H.; Hou, J.; Zhou, B.; Han, X. Effects of Water Supply Mode on Nitrogen Transformation and Ammonia Oxidation Microorganisms in a Tea Garden. Agronomy 2023, 13, 1279. [Google Scholar] [CrossRef]
- Qin, H.; Xing, X.; Tang, Y.; Zhu, B.; Wei, X.; Chen, X.; Liu, Y. Soil moisture and activity of nitrite- and nitrous oxide-reducing microbes enhanced nitrous oxide emissions in fallow paddy soils. Biol. Fertil. Soils 2020, 56, 53–67. [Google Scholar] [CrossRef]
- Mathieu, O.; Henault, C.; Leveque, J.; Baujard, E.; Milloux, M.J.; Andreux, F. Quantifying the contribution of nitrification and denitrification to the nitrous oxide flux using 15N tracers. Environ. Pollut. 2006, 144, 933–940. [Google Scholar] [CrossRef]
- Liu, R.; Suter, H.; He, J.; Hayden, H.; Chen, D. Influence of temperature and moisture on the relative contributions of heterotrophic and autotrophic nitrification to gross nitrification in an acid cropping soil. J. Soils Sediments 2015, 15, 2304–2309. [Google Scholar] [CrossRef]
- Wang, H.; Yan, Z.; Chen, Z.; Song, X.; Zhang, J.; Li, S.-L.; Mueller, C.; Ju, X.; Zhu-Barker, X. Microbial ammonium immobilization promoted soil nitrogen retention under high moisture conditions in intensively managed fluvo-aquic soils. Biol. Fertil. Soils 2025, 61, 641–651. [Google Scholar] [CrossRef]
- Osborne, B.B.; Baron, J.S.; Wallenstein, M.D. Moisture and temperature controls on nitrification differ among ammonia oxidizer communities from three alpine soil habitats. Front. Earth Sci. 2015, 10, 1–12. [Google Scholar] [CrossRef]
- Daebeler, A.; Bodelier, P.L.E.; Hefting, M.M.; Rutting, T.; Jia, Z.; Laanbroek, H.J. Soil warming and fertilization altered rates of nitrogen transformation processes and selected for adapted ammonia-oxidizing archaea in sub-arctic grassland soil. Soil Biol. Biochem. 2017, 107, 114–124. [Google Scholar] [CrossRef]
- Li, X.; Xie, J.; Zhang, Q.; Lyu, M.; Xiong, X.; Liu, X.; Lin, T.; Yang, Y. Substrate availability and soil microbes drive temperature sensitivity of soil organic carbon mineralization to warming along an elevation gradient in subtropical Asia. Geoderma 2020, 364, 114198. [Google Scholar] [CrossRef]
- Li, D.; Zhang, J.; Gruda, N.S.; Wang, Z.; Duan, Z.; Müller, C.; Li, X. The regulation of gross nitrogen transformation rates in greenhouse soil cultivated with cucumber plants under elevated atmospheric [CO2] and increased soil temperature. Geoderma 2023, 439, 116680. [Google Scholar] [CrossRef]
- Li, Z.; Zeng, Z.; Song, Z.; Tian, D.; Huang, X.; Nie, S.; Wang, J.; Jiang, L.; Luo, Y.; Cui, J.; et al. Variance and main drivers of field nitrous oxide emissions: A global synthesis. J. Clean. Prod. 2022, 353, 131686. [Google Scholar] [CrossRef]
- Huang, J.; Liu, R.; Wang, Q.; Gao, X.; Han, Z.; Gao, J.; Gao, H.; Zhang, S.; Wang, J.; Zhang, L.; et al. Climate factors affect N2O emissions by influencing the migration and transformation of nonpoint source nitrogen in an agricultural watershed. Water Res. 2022, 223, 119028. [Google Scholar] [CrossRef]
- Zhu, B.; Wang, T.; Kuang, F.; Luo, Z.; Tang, J.; Xu, T. Measurements of Nitrate Leaching from a Hillslope Cropland in the Central Sichuan Basin, China. Soil Sci. Soc. Am. J. 2009, 73, 1419–1426. [Google Scholar] [CrossRef]
- Zhou, M.; Wang, X.; Ke, Y.; Zhu, B. Effects of afforestation on soil nitrous oxide emissions in a subtropical montane agricultural landscape: A 3-year field experiment. Agric. For. Meteorol. 2019, 266–267, 221–230. [Google Scholar] [CrossRef]
- Xiao, Q.; Dong, Z.; Han, Y.; Hu, L.; Hu, D.; Zhu, B. Impact of soil thickness on productivity and nitrate leaching from sloping cropland in the upper Yangtze River Basin. Agric. Ecosyst. Environ. 2021, 311, 107266. [Google Scholar] [CrossRef]
- He, X.; Dai, S.; Meng, L.; He, M.; Wang, X.; Cai, Z.; Zhu, B.; Zhang, J.; Nardi, P.; Mueller, C. Effects of 18 years repeated N fertilizer applications on gross N transformation rates in a subtropical rain-fed purple soil. Appl. Soil Ecol. 2023, 189, 104952. [Google Scholar] [CrossRef]
- Liu, G. Protocols for Soil Physicochemical Analysis and Profile Description; China Standards Press: Beijing, China, 1996. [Google Scholar]
- Bao, S. Soil Agrochemical Analysis; China Agriculture Press: Beijing, China, 2000. [Google Scholar]
- Fierer, N.; Schimel, J.P. Effects of drying-rewetting frequency on soil carbon and nitrogen transformations. Soil Biol. Biochem. 2002, 34, 777–787. [Google Scholar] [CrossRef]
- Li, P.; Lang, M.; Li, M.; Wei, W.; Li, K.-K. Short-Term Effects of Different Fertilization Treatments on Greenhouse Gas Emissions from Northeast Black Soil. Environ. Sci. 2018, 39, 2360–2367. [Google Scholar] [CrossRef]
- Lang, M.; Li, P.; Wei, W. Regularity of net nitrogen transformation rates and greenhouse gas emissions in black soil of different textures. J. Agro-Environ. Sci. 2020, 39, 429–436. [Google Scholar]
- Li, Y.; Chapman, S.J.; Nicol, G.W.; Yao, H. Nitrification and nitrifiers in acidic soils. Soil Biol. Biochem. 2018, 116, 290–301. [Google Scholar] [CrossRef]
- Chen, T.; Cheng, R.; Xiao, W.; Zeng, L.; Shen, Y.; Wang, L.; Sun, P.; Zhang, M.; Li, J. Response of Nitrogen Mineralization in Soil Aggregates to Changes in Soil Moisture and Temperature in the Three Gorges Reservoir Area’s Typical Plantation. For. Res. 2024, 37, 27–38. [Google Scholar]
- Li, Z.; Zeng, Z.; Tian, D.; Wang, J.; Fu, Z.; Zhang, F.; Zhang, R.; Chen, W.; Luo, Y.; Niu, S. Global patterns and controlling factors of soil nitrification rate. Glob. Change Biol. 2020, 26, 4147–4157. [Google Scholar] [CrossRef]
- Islam, A.; Chen, D.; White, R.E. Heterotrophic and autotrophic nitrification in two acid pasture soils. Soil Biol. Biochem. 2007, 39, 972–975. [Google Scholar] [CrossRef]
- Qian, X.; Li, Q.; Chen, H.; Zhao, L.; Wang, F.; Zhang, Y.; Zhang, J.; Mueller, C.; Yi, Z.; Antoniadis, V.; et al. Enhancing Soil Nitrogen Retention Capacity by Biochar Incorporation in the Acidic Soil of Pomelo Orchards: The Crucial Role of pH. Agronomy 2023, 13, 2110. [Google Scholar] [CrossRef]
- Booth, M.S.; Stark, J.M.; Rastetter, E. Controls on Nitrogen Cycling in Terrestrial Ecosystems: A Synthetic Analysis of Literature Data. Ecol. Monogr. 2005, 75, 139–157. [Google Scholar] [CrossRef]
- Malhi, S.S.; McGill, W.B.; Nyborg, M. Effect of temperature, moisture, and substrate concentration on the rate of nitrification. Soil Biol. Biochem. 1990, 22, 733–737. [Google Scholar] [CrossRef]
- Burton, J.; Chen, C.; Xu, Z.; Ghadiri, H. Gross nitrogen transformations in adjacent native and plantation forests of subtropical Australia. Soil Biol. Biochem. 2007, 39, 426–433. [Google Scholar] [CrossRef]
- Butcher, K.R.; Nasto, M.K.; Norton, J.M.; Stark, J.M. Physical mechanisms for soil moisture effects on microbial carbon-use efficiency in a sandy loam soil in the western United States. Soil Biol. Biochem. 2020, 150, 107969. [Google Scholar] [CrossRef]
- Pandey, C.B.; Kumar, U.; Kaviraj, M.; Minick, K.J.; Mishra, A.K.; Singh, J.S. DNRA: A short-circuit in biological N-cycling to conserve nitrogen in terrestrial ecosystems. Sci. Total Environ. 2020, 738, 139710. [Google Scholar] [CrossRef]
- Kiese, R.; Hewett, B.; Butterbach-Bahl, K. Seasonal dynamic of gross nitrification and N2O emission at two tropical rainforest sites in Queensland, Australia. Plant Soil 2007, 309, 105–117. [Google Scholar] [CrossRef]
- Yu, S.; Zhang, L.; Xie, X.; Han, X. Effects of Water Regimes on Soil Nitrogen Dynamics in Tea Garden in Shandong Province. J. Soil Water Conserv. 2021, 35, 289–298. [Google Scholar]
- Moyano, F.E.; Manzoni, S.; Chenu, C. Responses of soil heterotrophic respiration to moisture availability: An exploration of processes and models. Soil Biol. Biochem. 2013, 59, 72–85. [Google Scholar] [CrossRef]
- Nguyen, L.T.T.; Broughton, K.; Osanai, Y.; Anderson, I.C.; Bange, M.P.; Tissue, D.T.; Singh, B.K. Effects of elevated temperature and elevated CO2 on soil nitrification and ammonia-oxidizing microbial communities in field-grown crop. Sci. Total Environ. 2019, 675, 81–89. [Google Scholar] [CrossRef]
- Liang, Y.; Wu, C.; Wei, X.; Liu, Y.; Chen, X.; Qin, H.; Wu, J.; Su, Y.; Ge, T.; Hu, Y. Characterization of nirS- and nirK-containing communities and potential denitrification activity in paddy soil from eastern China. Agric. Ecosyst. Environ. 2021, 319, 107561. [Google Scholar] [CrossRef]
- Kumar, N.; Shambhavi, S.; Das, A.; Yasmeen, S.; Ganguly, P.; Kumar, S.; Rakshit, R. Soil biological indicators associated with nitrogen mineralization patterns in rice soils under long-term integrated nutrient management. Soil Use Manag. 2024, 40, e12963. [Google Scholar] [CrossRef]
- Zhang, X.; Li, Q.; Gao, J.; Hu, Y.; Song, M.; Yue, Y. Effects of rainfall amount and frequency on soil nitrogen mineralization in Zoige alpine wetland. Eur. J. Soil Biol. 2020, 97, 103170. [Google Scholar] [CrossRef]
- Wang, J.; Cui, W.; Che, Z.; Liang, F.; Wen, Y.; Zhan, M.; Dong, X.; Jin, W.; Dong, Z.; Song, H. Effects of synthetic nitrogen fertilizer and manure on fungal and bacterial contributions to N2O production along a soil acidity gradient. Sci. Total Environ. 2021, 753, 142011. [Google Scholar] [CrossRef]
- Qiu, Y.; Zhang, Y.; Zhang, K.; Xu, X.; Zhao, Y.; Bai, T.; Zhao, Y.; Wang, H.; Sheng, X.; Bloszies, S.; et al. Intermediate soil acidification induces highest nitrous oxide emissions. Nat. Commun. 2024, 15, 2695. [Google Scholar] [CrossRef]
- Tzanakakis, V.A.; Taylor, A.E.; Bakken, L.R.; Bottomley, P.J.; Myrold, D.D.; Dörsch, P. Relative activity of ammonia oxidizing archaea and bacteria determine nitrification-dependent N2O emissions in Oregon forest soils. Soil Biol. Biochem. 2019, 139, 107612. [Google Scholar] [CrossRef]
- Wu, G.; Liang, F.; Wu, Q.; Feng, X.; Shang, W.; Li, H.; Li, X.; Che, Z.; Dong, Z.; Song, H. Soil pH differently affects N2O emissions from soils amended with chemical fertilizer and manure by modifying nitrification and denitrification in wheat-maize rotation system. Biol. Fertil. Soils 2023, 60, 101–113. [Google Scholar] [CrossRef]
- Cheng, Y.; Zhang, J.; Wang, J.; Cai, Z.; Wang, S. Soil pH is a good predictor of the dominating N2O production processes under aerobic conditions. J. Plant Nutr. Soil Sci. 2015, 178, 370–373. [Google Scholar] [CrossRef]
- Deng, N.; Gubry-Rangin, C.; Song, X.-T.; Ju, X.-T.; Liu, S.-Y.; Shen, J.-P.; Di, H.-J.; Han, L.-L.; Zhang, L.-M. AOB Nitrosospira cluster 3a.2 (D11) dominates N2O emissions in fertilised agricultural soils. J. Environ. Manag. 2024, 355, 120504. [Google Scholar] [CrossRef] [PubMed]
- Zheng, X.; Guo, B.; Liu, H.; Wu, Y.; Yu, J.; Ding, H.; Jiang, X.; Luo, Q.; Zhang, Y. Low pH inhibits soil nosZ without affecting N2O uptake. J. Soils Sediments 2022, 23, 422–430. [Google Scholar] [CrossRef]
- Zhang, Y.; Zhao, W.; Cai, Z.; Müller, C.; Zhang, J. Heterotrophic nitrification is responsible for large rates of N2O emission from subtropical acid forest soil in China. Eur. J. Soil Sci. 2018, 69, 646–654. [Google Scholar] [CrossRef]
- Xu, H.; Liu, S.; Ding, J.; Liu, L. Mapping crop-specific emission factors highlights hotspots of ammonia mitigation in China. Sci. Total Environ. 2024, 908, 168157. [Google Scholar] [CrossRef] [PubMed]
- Wei, X.; Zhu, Z.; Wei, L.; Wu, J.; Ge, T. Biogeochemical cycles of key elements in the paddy-rice rhizosphere: Microbial mechanisms and coupling processes. Rhizosphere 2019, 10, 100145. [Google Scholar] [CrossRef]
- Jayarathne, J.R.R.N.; Chamindu Deepagoda, T.K.K.; Clough, T.J.; Thomas, S.; Elberling, B.; Smits, K.M. Effect of aggregate size distribution on soil moisture, soil-gas diffusivity, and N2O emissions from a pasture soil. Geoderma 2021, 383, 114737. [Google Scholar] [CrossRef]
- Chen, X.; Wang, G.; Zhang, T.; Mao, T.; Wei, D.; Hu, Z.; Song, C. Effects of warming and nitrogen fertilization on GHG flux in the permafrost region of an alpine meadow. Atmos. Environ. 2017, 157, 111–124. [Google Scholar] [CrossRef]
- Tan, S.; Ni, X.; Yue, K.; Liao, S.; Wu, F. Increased precipitation differentially changed soil CO2 efflux in arid and humid areas. Geoderma 2021, 388, 114946. [Google Scholar] [CrossRef]
- Wang, J.; Liu, Q.; Zhao, S.; He, S.; Yang, B.; Wang, N.; Hou, P.; Xue, L.; Yang, L. Heavy rainfall stimulates more N2O emissions from wheat fields during basal and overwintering fertilization phases. Agric. Ecosyst. Environ. 2024, 376, 109227. [Google Scholar] [CrossRef]


| Soil Types | pH | SOC (g kg−1) | TN (g kg−1) | C/N | Clay (%) | Silt (%) | Sand (%) | WHC (%) |
|---|---|---|---|---|---|---|---|---|
| Acidic | 4.38 ± 0.13 C | 9.16 ± 0.08 A | 1.11 ± 0.82 A | 8.28 ± 0.48 A | 41.84 ± 5.14 A | 32.65 ± 5.77 A | 25.51 ± 3.91 A | 51.58 ± 2.26 B |
| Neutral | 6.40 ± 0.51 B | 9.32 ± 0.51 A | 1.05 ± 0.06 A | 8.91 ± 0.12 A | 41.84 ± 3.91 A | 38.78 ± 9.72 A | 19.39 ± 7.73 B | 57.83 ± 3.23 A |
| Calcareous | 8.16 ± 0.30 A | 5.77 ± 0.40 B | 0.82 ± 0.04 B | 7.03 ± 0.60 B | 32.45 ± 1.00 B | 42.44 ± 0.49 A | 25.11 ± 0.54 A | 54.21 ± 0.40 AB |
Disclaimer/Publisher’s Note: The statements, opinions and data contained in all publications are solely those of the individual author(s) and contributor(s) and not of MDPI and/or the editor(s). MDPI and/or the editor(s) disclaim responsibility for any injury to people or property resulting from any ideas, methods, instructions or products referred to in the content. |
© 2025 by the authors. Licensee MDPI, Basel, Switzerland. This article is an open access article distributed under the terms and conditions of the Creative Commons Attribution (CC BY) license (https://creativecommons.org/licenses/by/4.0/).
Share and Cite
Fu, Y.; Ren, X.; Zhu, B. Responses of Soil Nitrogen Transformation and N2O Emission to Soil pH and Hydrothermal Changes. Agronomy 2025, 15, 1005. https://doi.org/10.3390/agronomy15051005
Fu Y, Ren X, Zhu B. Responses of Soil Nitrogen Transformation and N2O Emission to Soil pH and Hydrothermal Changes. Agronomy. 2025; 15(5):1005. https://doi.org/10.3390/agronomy15051005
Chicago/Turabian StyleFu, Yan, Xiao Ren, and Bo Zhu. 2025. "Responses of Soil Nitrogen Transformation and N2O Emission to Soil pH and Hydrothermal Changes" Agronomy 15, no. 5: 1005. https://doi.org/10.3390/agronomy15051005
APA StyleFu, Y., Ren, X., & Zhu, B. (2025). Responses of Soil Nitrogen Transformation and N2O Emission to Soil pH and Hydrothermal Changes. Agronomy, 15(5), 1005. https://doi.org/10.3390/agronomy15051005