Abstract
This study explores biochar’s impact on soil fertility, greenhouse gas (GHG) emissions, grain yield, carbon footprint (CF), and net ecosystem carbon budget (NECB) in northwest China’s arid regions. A two-year field experiment tested three biochar rates (15, 30, and 45 t ha−1) against a control. The results showed that biochar significantly reduced overall soil GHG emissions, though the highest rate increased methane emissions. The 30 t ha−1 rate yielded the highest average grain production (13.9 t ha−1), boosted soil organic carbon storage by 76 kg ha−1, and decreased global warming potential (GWP) by 87.8 kg CO2 ha−1 and GHG emission intensity by 6.74 kg t−1. Biochar also lowered the CF and enhanced the NECB, primarily through increased net primary production and improved soil fertility and crop yields. CO2 emissions and fertilizer use were major CF contributors, but biochar reduced both the biomass-scaled and yield-scaled CFs. Overall, biochar improved crop yields, NECB, and soil carbon storage while reducing GWP, GHGI, and CF. This study recommends 30 t ha−1 biochar to optimize crop production, enhance carbon balance, and mitigate climate change impacts, highlighting biochar’s potential as a sustainable soil amendment in arid ecosystems.
1. Introduction
Over the past century, greenhouse gases (GHGs) have garnered increasing attention due to their critical global warming potential (GWP) and their substantial contribution to climate change [1,2]. The agricultural sector represents a major source of GHG emissions, with global estimates ranging from 5.0 to 5.8 gigagrams of carbon dioxide equivalents (Gg CO2-eq) annually [3,4]. Notably, China has emerged as one of the world’s predominant contributors to agricultural carbon emissions, demonstrating a significant 29.98% increase between 1990 and 2014 [5]. This escalating trend underscores the urgent need for optimizing agricultural practices to achieve an equilibrium between productivity and emission reduction, which is essential to advancing sustainable development goals.
Biochar application to agricultural soils has emerged as a promising strategy for climate change mitigation through enhanced soil carbon sequestration while concurrently improving soil fertility, water retention capacity, and crop productivity [1,6]. Recent studies demonstrate that biochar can significantly reduce GHG emissions, with Hu et al. [7] reporting a 23.6% decrease in soil-derived GHG fluxes following its application. This mitigation effect is attributed to biochar’s stable aromatic structure, which stabilizes soil chemical and microbial properties, thereby decelerating the decomposition rate of soil organic carbon (SOC) [8]. Furthermore, the adsorption of SOC onto biochar’s porous surfaces enhances microbial carbon use efficiency, fostering symbiotic interactions that preserve soil microbiota, nutrient availability, and organic substrates—collectively promoting SOC accumulation and reducing GHG emissions [7]. However, the net impact of biochar on soil GHG emissions remains contentious, with substantial variability being observed across different experimental conditions. Contrary to its mitigating effects, some studies suggest that biochar’s high porosity and extensive surface area may introduce labile C fractions, stimulating microbial activity and consequently increasing CO2 efflux. Supporting this observation, Zhao et al. [9] documented a dose-dependent rise in CO2 emissions following biochar amendments. Additionally, a life cycle assessment by Xia et al. [10] highlighted that biochar application may transiently elevate GHG emissions during its initial incorporation phase. These differences may be related to the cropping system, soil type, and biochar properties. It is, therefore, important to understand the impact of biochar on GHG emissions from agriculture soils.
In addition, evaluating the net ecosystem carbon budget (NECB) as a sustainability index based on carbon balance offers valuable insights for advancing sustainable agriculture [11]. By quantifying carbon absorption and release throughout the growth period, we can systematically assess the net carbon budget, including the ecosystem’s vegetation, soil, and human activities. Understanding the NECB is crucial to addressing climate change and protecting ecosystem health. Moreover, the concept of carbon footprint (CF) has gained widespread acceptance for characterizing GHG emissions throughout the entire agricultural production process, providing a comprehensive understanding of each link’s contribution to climate change [12]. While previous research has predominantly concentrated on examining the consequences of repeated biochar incorporation on greenhouse gas emissions and its potential contribution to global warming [13], there is a lack of research on the relationship between a single biochar application and crop yield, soil GHG emissions, CF, and NECB in arid regions.
This study comprehensively evaluated the impact of a single biochar application on soil fertility, SOC storage, and GHG in arid regions. By quantifying the responses of GWP, GHGI, CF, and NECB to different biochar application rates, we identified the optimal biochar dosage. Additionally, by using the TOPSIS and SEM methods, we determined the key factors through which biochar influences carbon balance. Ultimately, this study aims to contribute to global climate change mitigation and provide a theoretical foundation for sustainable agricultural development.
2. Materials and Methods
2.1. Field Experiment
2.1.1. Experimental Location
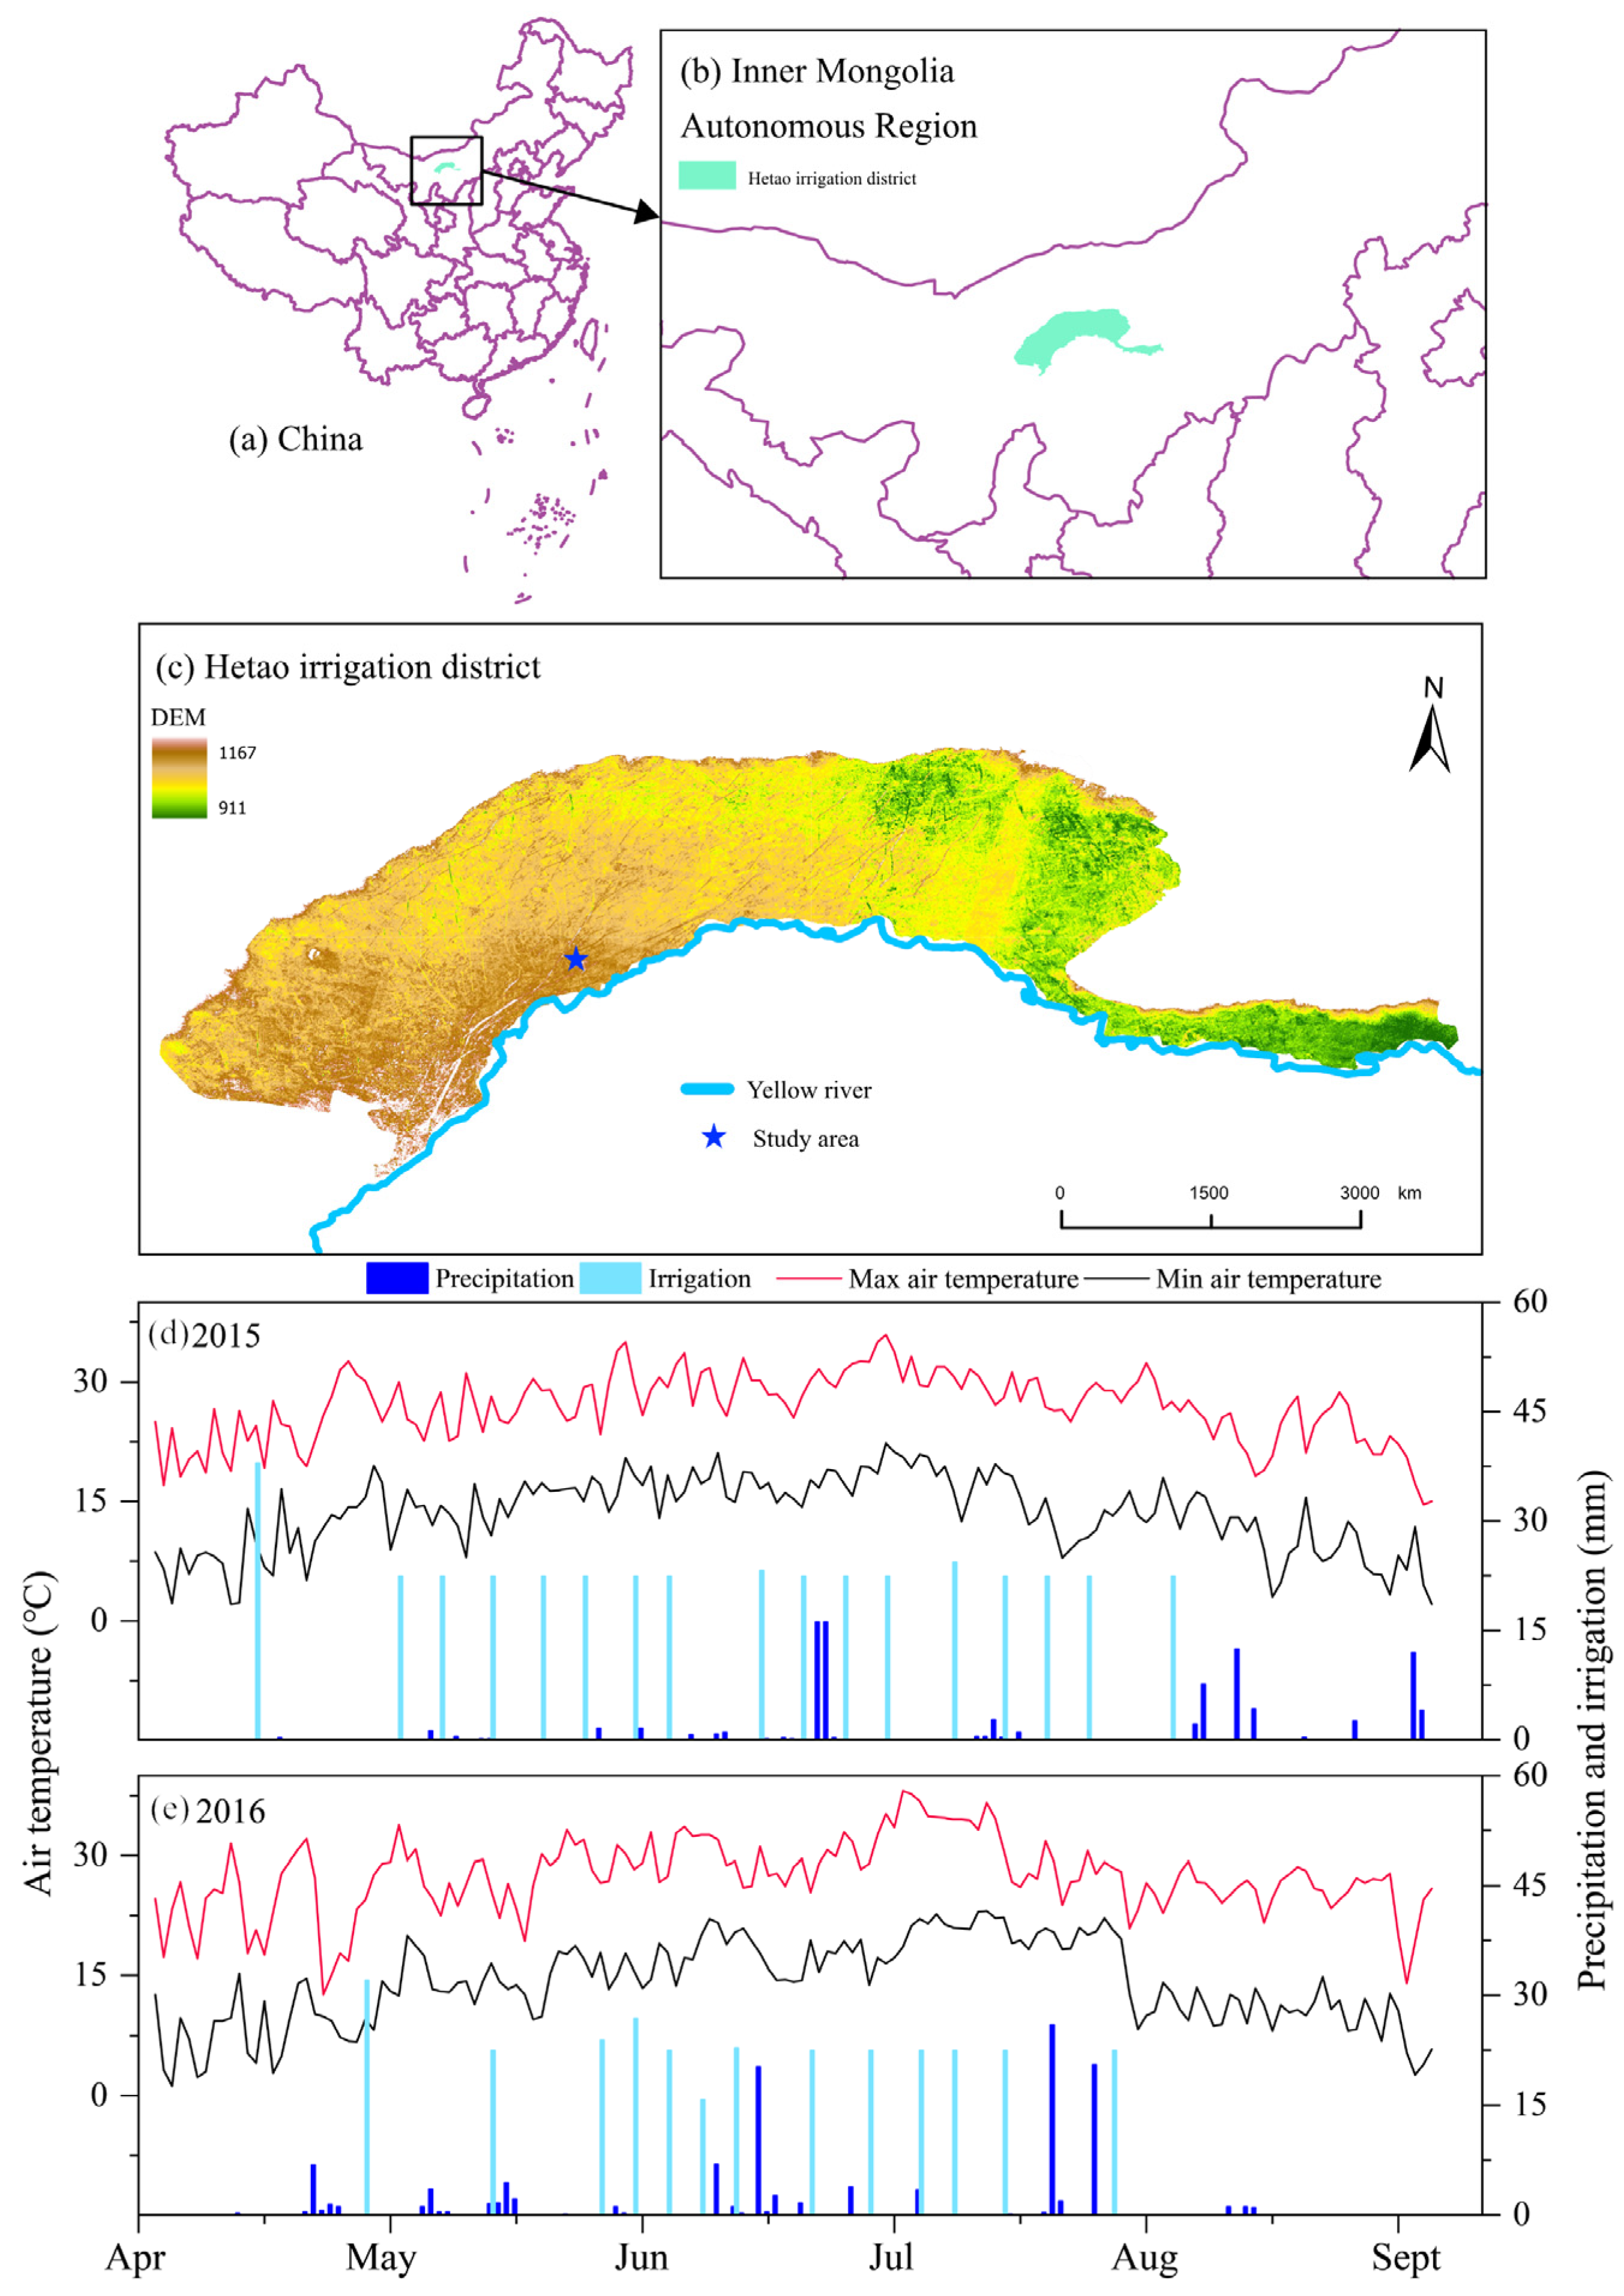
The Jiuzhuang Experimental Cooperative Center in Linhe City, Hetao Irrigation District (HID), Inner Mongolia, China, was the location for a field experiment conducted during the maize growing seasons of 2015 and 2016. The center is situated at an altitude of 1042 m above sea level, with the coordinates of 107°18′ E and 40°41′ N. The region experiences a mid-temperate semi-arid continental climate with limited cloud cover and precipitation. Annual precipitation averages around 140 mm, while the average air temperature is 6.8 °C. The area receives approximately 3230 annual sunshine hours, with a frost-free period of about 130 days. The soil in the upper 60 cm layer is primarily composed of sandy loam, according to the textural classification triangle [14] used in the United States.
2.1.2. Characteristics of Biochar and Field Application Scheme
The biochar utilized in this investigation was derived from maize residue via slow pyrolysis in a sealed stainless-steel carbonization furnace (Model XYZ-500, Liaoning Jinhefu Agricultural Development Co., Ltd., Shenyang, China) under oxygen-limited conditions (N2 purging at 1 L min−1). The pyrolysis was conducted at temperatures ranging from 400 to 500 °C, at a heating rate of 10 °C min−1; the sample was held at the highest temperature for 1 h and then cooled under continuous N2 flow. The total pyrolysis duration was 2 h, yielding approximately 50% of the initial maize stover mass. The biochar exhibited an organic matter content of 925.7 mg kg−1, with a carbon-to-nitrogen ratio of ~67. Available nitrogen (N), phosphorus (P), and potassium (K) levels were 159.2, 394.2, and 784.0 mg kg−1, respectively. Further physicochemical properties of the soil and biochar are provided in Table 1.

Table 1.
Main physical and chemical properties of the sandy loam soil and maize residue biochar used in this study.
The field experiment was conducted by using a randomized complete block design, incorporating three replicates to mitigate the impact of spatial heterogeneity. The treatments included three biochar application rates, i.e., 15 t ha−1 (B15), 30 t ha−1 (B30), and 45 t ha−1 (B45), along with a control (CK) receiving no biochar. Each plot had an area of 90 m2, with dimensions of 15 m in length and 6 m in width. In April 2015, biochar was evenly spread over uncultivated soil and incorporated to a depth of 30 cm by using a rotary tiller. No additional biochar was applied during the experimental period.
Maize (Zea mays L.) cultivar Simon No. 6, which is extensively cultivated in the HID region, was planted by using wide–narrow row spacings of 50 and 60 cm. To cover the wide rows, polypropylene film measuring 90 cm in width was utilized as mulch. The seeds were sown near the edges of the wide rows with a plant spacing of 30 cm, resulting in a planting density of 56,667 plants ha−1. Sowing and harvest occurred on 22 May and 26 September 2015 and on 23 May and 1 October 2016, respectively.
The drip irrigation system was managed by utilizing a tensiometer placed at a depth of 25 cm, maintaining a matric potential of −25 kPa. The irrigation quota applied was 22.5 mm. In the year 2015, irrigation was initiated on 17 occasions, resulting in a total application of 382.5 mm. Similarly, in the following year (2016), it was triggered 13 times with an overall amount of 292.5 mm. Figure 1 details the irrigation schedule for each treatment. To facilitate drip irrigation combined with plastic film mulching, 16 mm diameter internal embedded drip irrigation tape was employed. The tape had emitters placed at intervals of 30 cm and delivered water at a rate of 1.38 L h−1. It was strategically positioned beneath the mulch layer to effectively serve two rows of maize crops.
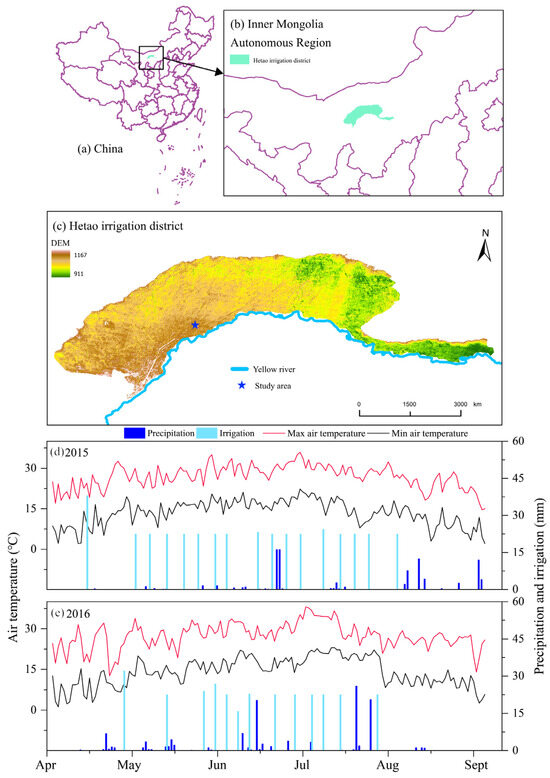
Figure 1.
(a–c) Location of study area; (d,e) Daily variations in precipitation, irrigation, and air temperature during 2015 and 2016 cropping seasons.
Irrigation, fertilization, and field management practices (e.g., weed control and spraying) were kept consistent across all treatments. Fertilizer applications in 2015 and 2016 consisted of 339 kg ha−1 N, 192 kg ha−1 phosphorus, and 17 kg ha−1 potassium. During both years, a total of 164 kg ha−1 N (48% of the overall nitrogen amount), along with all P and K fertilizers, was mechanically broadcasted at sowing. The remaining nitrogen was administered through drip irrigation in five separate doses: three during the jointing stage, one during the tasseling stage, and one during the grain-filling stage. Each application involved a quantity of 35 kg N ha−1.
2.2. Sampling and Measurements
2.2.1. Measurements of Soil GHG Fluxes
Throughout the growth period of maize, we employed a static dark chamber gas chromatography technique to monitor the fluxes of CO2, CH4, and N2O in the soil. Each experimental plot was equipped with three static dark chamber systems, and each treatment was replicated three times. The chambers consisted of a base frame (40 cm × 40 cm × 15 cm) inserted 10 cm into the soil and a movable top box (40 cm × 40 cm × 40 cm). To prevent air leakage, we applied a sealing strip at the bottom of the upper box and installed a small fan on its ceiling for uniform gas mixing. Placed between two rows of maize plants, with bare ground surrounding their bases, these static chambers ensured accurate measurements by periodically cleaning live plants within the base. We measured greenhouse gas emissions approximately every 10 days during most periods but increased frequency to every 2–3 days during fertilization periods. By using a syringe with a volume capacity of 60 mL, we collected gas samples at intervals of ten minutes (0 min, 10 min, 20 min, and 30 min) between 9:00 am and 11:00 am local time. Within 48 h of collection, the gas samples were promptly analyzed by using an Agilent6820 gas chromatograph located in Santa Clara, CA, USA.
2.2.2. Test Treated Samples
In each experimental plot, we collected three soil samples immediately from the surface layer (0–30 cm) surrounding the static chamber after gas collection. Additionally, post-harvest soil samples were annually collected at a depth of 30 cm. The determination of SOC and available nitrogen content was conducted by using volumetric–external heating with the potassium dichromate method and an ultraviolet spectrophotometer (UV-2365, Guangzhou Hu Ruiming Instrument Co., Ltd., Guanzhou, China), respectively [15]. Soil nitrate-nitrogen (NO3−-N), available phosphorus, and available potassium were measured through the ultraviolet spectrophotometry, NH4OAC extraction–flame photometry, and NaHCO3 extraction–Mo-Sb colorimetry methods, respectively [16]. Soil pH values were assessed by using a pH meter (PHS-3 C).
To determine the grain yield, we harvested 15 consecutive plants from the middle four rows in each plot on 23 September 2015 and 22 September 2016. The sampled plants were quickly dried at a temperature of 105 °C for one hour to deactivate enzymes and then further dried to constant weight at 75 °C. For analyzing the carbon content in maize samples, we took 50 mg of finely ground plant material with a particle size of 0.5 mm and enclosed it in tin foil cones. The C content was determined by using an element analyzer (Vario Macro CN, Frankfurt, Germany) [17].
2.3. Calculations
Soil comprehensive fertility was calculated by using SOC, NO3−, K, P, and pH indicators measured from soil samples [16,18], as follows:
where IFIi represents an indicator for assessing nutrient levels. The observed value of each nutrient level is denoted by “x”, while xa denotes its lower limit. Similarly, “xp” stands for its upper limit, and “xc” signifies a threshold based on grading criteria specific to each nutrient level (refer to Table S1 for detailed values). The overall soil fertility status can be determined by using IFI as a comprehensive fertility index. Additionally, min IFIi indicates minimum soil comprehensive fertility among all indices considered in this study. Furthermore, n corresponds to 5 reference indicators, namely, pH, SOC (NO3−), available P, and available K.
Soil organic carbon storage to a depth of 30 cm was calculated as follows:
where SCS represents the storage of soil organic carbon (kg ha−1), Si denotes the area covered by the soil (ha) for a specific soil layer, θi refers to the volume fraction of particles in the soil that are larger than 2 mm (kg kg−1), ρi indicates the bulk density of the soil (g cm−3), Ci represents the concentration of organic carbon in the soil (g kg−1), and Ti signifies the thickness of the soil layer (cm).
Regression analysis was employed to estimate the fluxes of GHG (CH4, CO2, and N2O) in soil by considering gas concentrations and time intervals. Cumulative GHG emissions over the specified period were calculated by using different methods.
The calculation of the global warming potential (GWP) for CH4 and N2O emissions over a 100-year time period was performed in the following manner [19,20]:
where E-N2O and E-CH4 represent the cumulative emissions of N2O and CH4, respectively, throughout the growth period of maize. Above, 298 and 25 are the CO2 equivalents (CO2-eq) of N2O and CH4, respectively.
Greenhouse gas emission intensity (GHGI) for each year was calculated as follows [20]:
where GY is the maize grain yield and GWP is the global warming potential.
The carbon footprint, expressed in CO2-eq using GWP values, was determined by using a lifecycle assessment.
where CF is determined by multiplying the input amount of each agricultural activity (such as fertilizers, irrigation, and pesticides; detailed data are provided in Table S2) with their respective emission parameters (EFi from Table S3). The carbon footprint of each cropping system was evaluated by using two metrics [21], i.e., emissions per unit of straw biomass produced (kg CO2-eq kg−1 biomass) and emissions per unit of grain harvested (kg CO2-eq kg−1 grain), following the climate-smart feedback guidelines outlined by the Intergovernmental Panel on Climate Change’s recommendations [22]. SCS (kg ha−1) was considered in the CF calculations only when accounting for changes in SOC.
The net carbon budget (NECB, kg C ha−1) of an ecosystem evaluates the equilibrium between carbon inputs and outputs. The calculation method employed for determining the NECB is as follows:
where we define GPP as the total amount of carbon fixed through photosynthesis (kg C ha−1). NPP represents the net primary production, which can be calculated by multiplying the aboveground dry biomass by its carbon content per hectare. Camendment refers to the carbon input derived from amendments applied per hectare. Rc denotes crop respiration measured in kilograms of carbon emitted per hectare. CO2 and CH4 indicate soil emissions of carbon dioxide and methane, respectively (kg C ha−1). Ch represents the amount of carbon output obtained from grain yield per hectare. Lastly, SCS (kg ha−1) stands for soil organic carbon storage. It should be noted that a constant ratio of 0.52 between NPP and GPP was assumed [23]. The estimation of root biomass is based on the allometric relationships described, where the proportion of roots is fixed at 10% of the aboveground plant parts. It is assumed that both aboveground and belowground parts contribute to 5% of litter in terms of dry matter, while two-thirds of the root C for maize is considered to be C rhizodeposition resulting from root turnover and exudates [24,25].
The Entropy-TOPSIS technique is employed for making decisions involving multiple objectives, aiming to identify the most feasible solution from a given set. This approach establishes both positive and negative ideal solutions for a specific problem, positioning the most viable solution as the one that is furthest away from the negative ideal solution. To ensure objectivity in determining index weights and minimize subjective biases inherent in methods like Delphi or analytic hierarchy process, the entropy weight method was utilized. The TOPSIS method was then used to calculate a comprehensive evaluation rank for each crop rotation, following the detailed equations and methodologies outlined.
2.4. Data Analysis
We employed structural equation modeling (SEM; acceptance threshold: p < 0.05) and analysis of variance (ANOVA; F-tests and post hoc comparisons) to examine the associations and impacts of various environmental factors. SEM was developed by using Smartpls 3.0 software to assess the direct and indirect influences of NECB, GHGI, GWP, SOCS, IFI, and yield. SEM offers significant advantages in investigating intricate relationships within environmental ecosystems, as it enables the examination of causal effects among multiple variables while distinguishing between direct and indirect predictors in the model [26,27]. The objective of employing SEM in this study was to elucidate the correlation between NECB and other environmental variables.
We utilized the maximum likelihood assessment procedure to compare the constructed SEM with the observed data. The model demonstrated a favorable fit with the observed data, as indicated by a non-significant test outcome (p > 0.05), the Akaike Information Criterion (AIC < 0.05), the goodness-of-fit index (GFI > 0.90), and the root square mean error of approximation (RMSEA < 0.05).
The statistical analysis was conducted by using IBM SPSS 22.0 software by IBM in the United States. A one-way ANOVA was employed to evaluate the impact of various straw return modes (CK, B15, B30, and B45) on the cumulative emissions of CH4, CO2, and N2O; SOC sequestration; NPP; and NECB. Significant differences among treatments were determined by using the least significant difference method with a significance level set to p = 0.05.
3. Results
3.1. Topsoil Organic Carbon Storage (SCS) and the Sub-Fertility Index
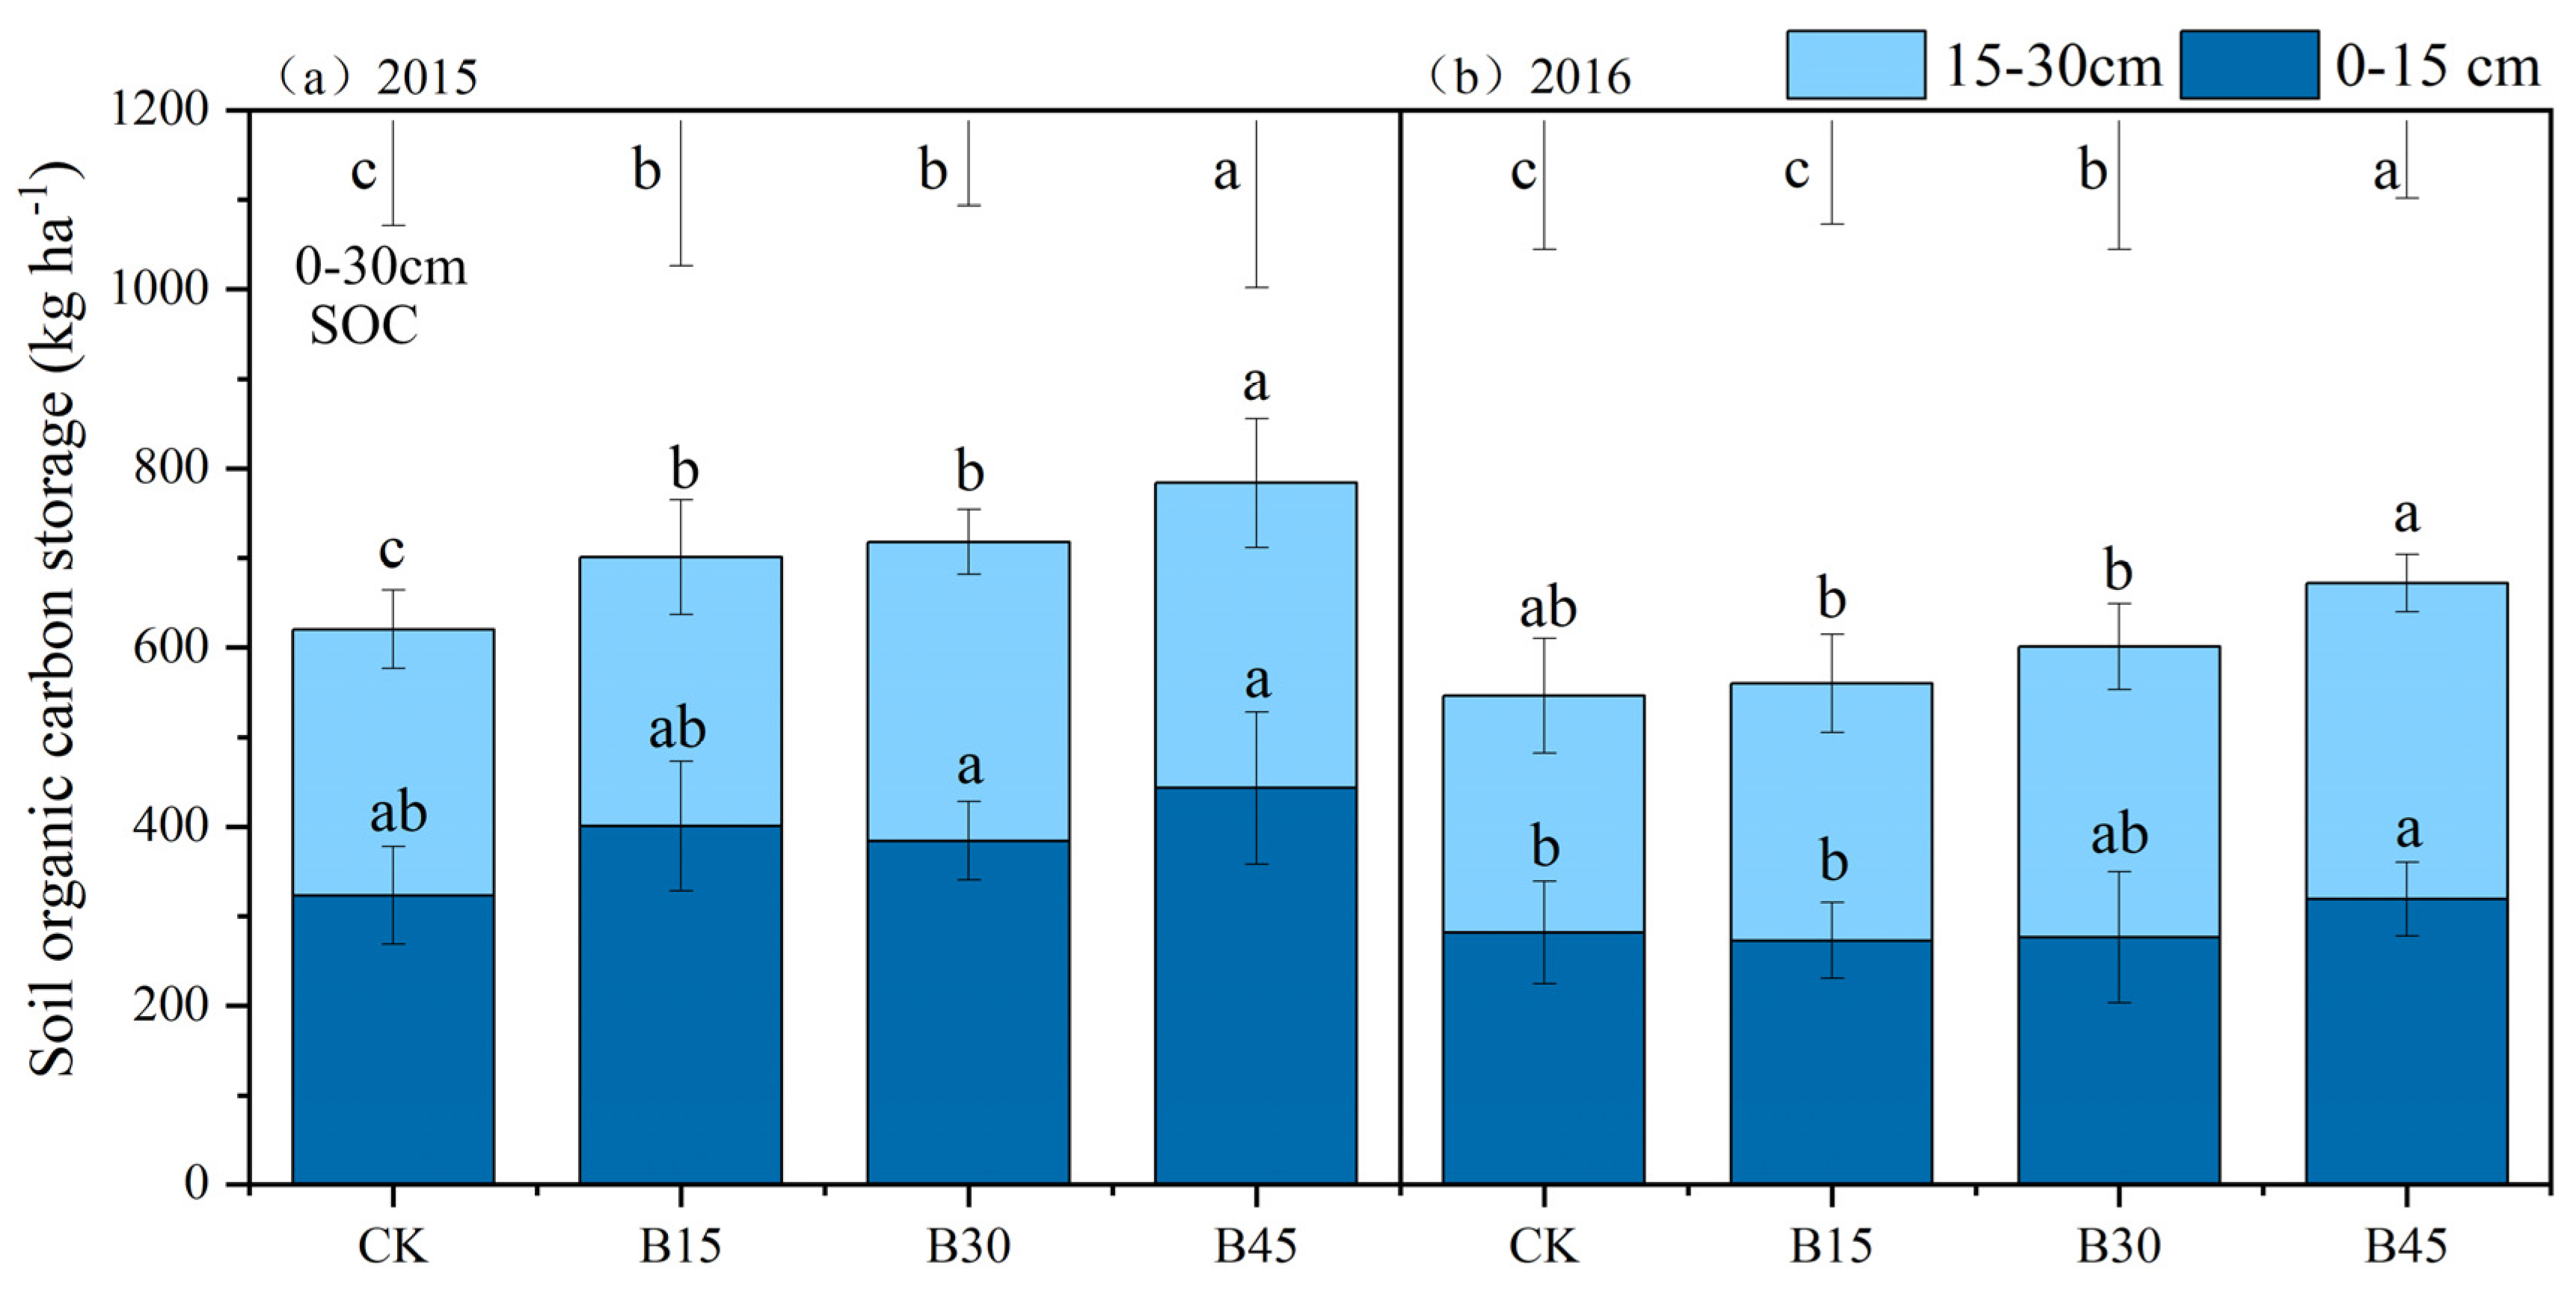
Biochar application significantly increased SOCS by 13–26% in 2015 and 3–23% in 2016, with the most pronounced effects in the B45 treatment (Figure 2). Biochar application in the first year (2015) increased SCS in the top 15 cm soil layer by 19–37% compared with the control group. However, this positive trend did not continue into the second year (2016). The 15–30 cm soil layer exhibited a different pattern. In 2015, SCS increased by 1–15% compared with the control, which became more significant in 2016 (9–34%).
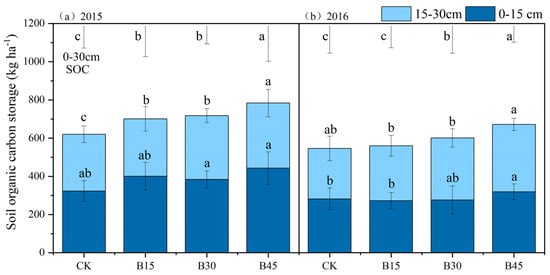
Figure 2.
Soil organic carbon storage under different biochar addition amounts in 2015 (a) and 2016 (b). Note: Error bars denote the standard deviation (n = 3). The error bars and letters at the top of the picture refer to 0–30 cm soil organic carbon error analysis and significance analysis. Different letters in the column indicate significant differences among treatments (p < 0.05, one-way ANOVA). Different letters following the values represent significant differences among biochar treatments at p < 0.05 within the 0–15 cm or 15–30 cm soil layers within a year. CK, B15, B30, and B45 denote the added biochar amounts of 0 (control), 15, 30, and 45 t ha−1, respectively.
Table 2 presents the soil nutrient parameters and their respective IFI in 2015 and 2016. Biochar addition resulted in an overall upward trend in each nutrient indicator. Among the different biochar treatments, soil pH showed little variation, ranging within 8.1–8.4 in 2015 and 8.4–8.6 in 2016. In 2015, there was a slight but insignificant increase in soil NO3−-N levels under B15 and B30 compared with the control, with little difference being observed under B45. In 2016, soil NO3−-N levels increased with an increase in the biochar rate by 16.3% and 22.2% under B30 and B45 compared with the control. Soil available P levels increased with an increase in the biochar rate by 72–133% in 2015 and 4–50% in 2016. Soil available K and SOC followed a similar trend to soil available N. Notably, in 2015, the soil available K content under B15 increased the most but decreased by 7% under B45 compared with the control. In 2016, biochar addition increased soil available K content by 44–78%, with the greatest increase under B45. In 2015, biochar application increased SOC content by 13–16% compared with the control, with the highest value under B30. In 2016, SOC content increased by 3–23%, with the highest value observed under B45. Biochar application increased IFI, ranging from 10% under B30 to 13% under B45 in 2015, whereas IFI gradually increased with the increase in the biochar application rate in 2016, ranging from 10 to 29%.
Table 2.
Soil pH, nitrogen, phosphorus, potassium, organic carbon, and sub-fertility index in the 0–30 cm layer in 2015 and 2016 following different biochar application amounts in 2015.
3.2. Soil Greenhouse Gas Emissions and Impacts
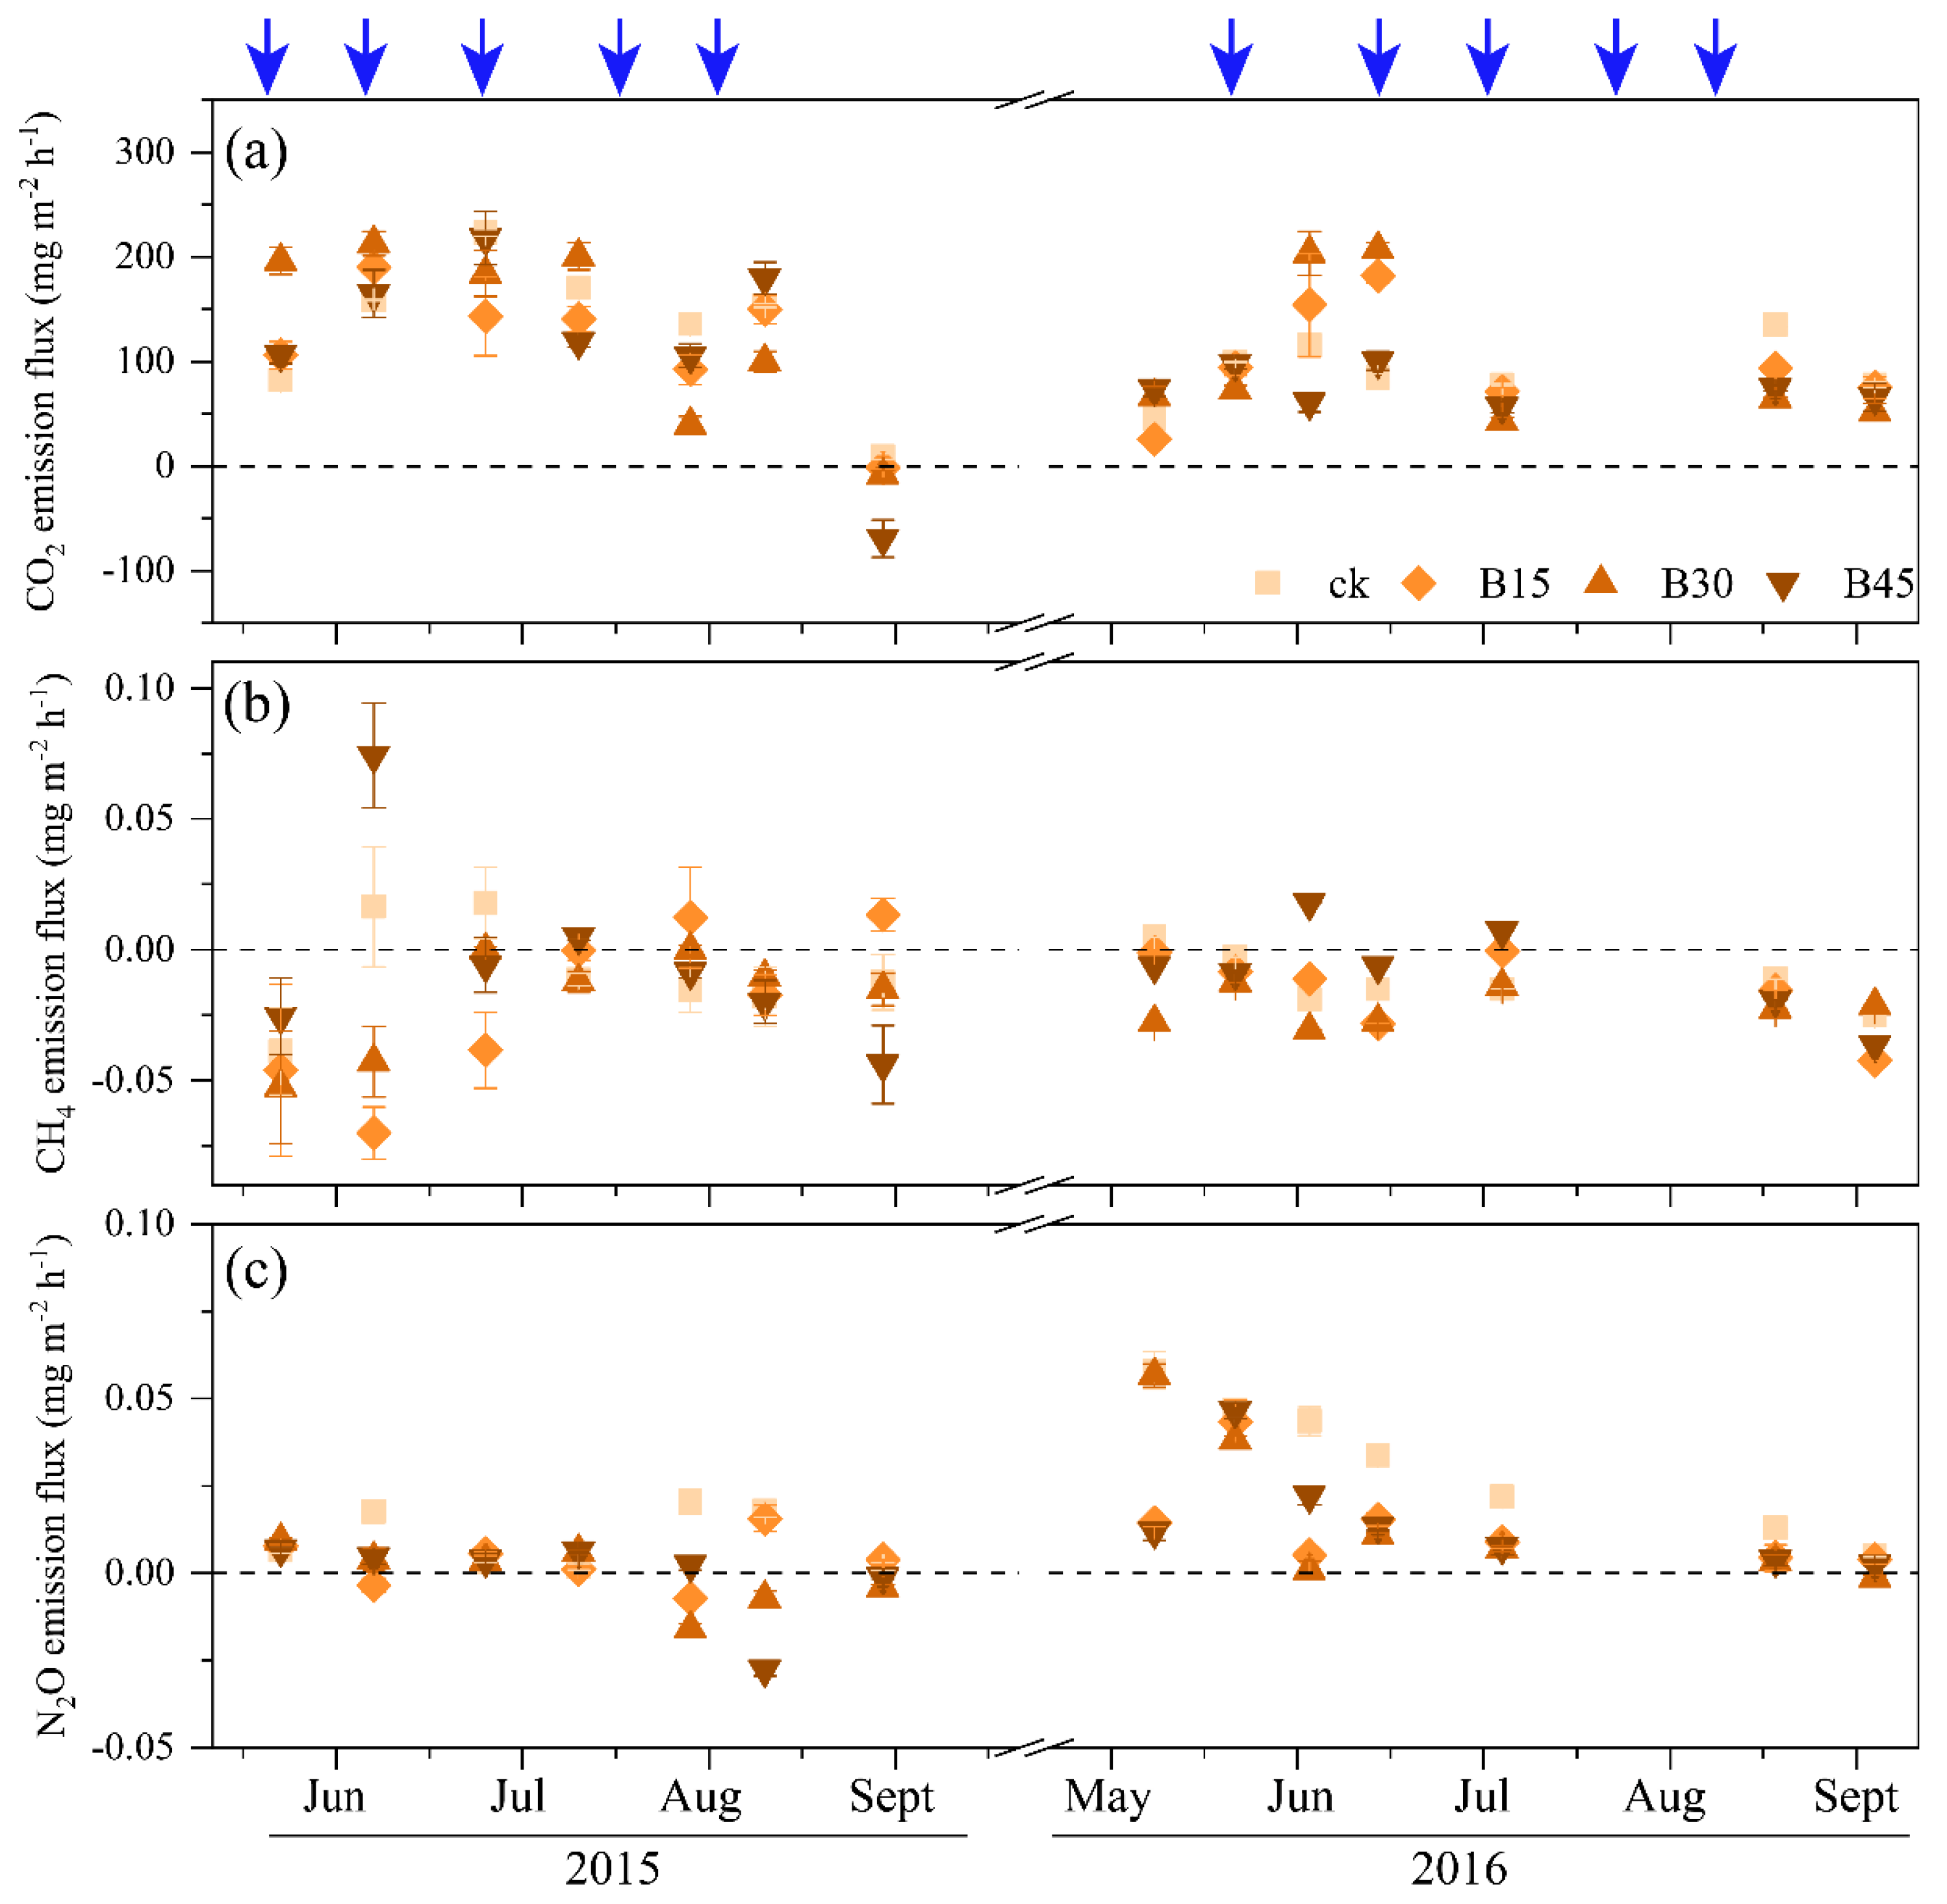
Figure 3 depicts the impact of biochar treatments on soil GHG emissions in 2015 and 2016. CO2 emissions initially increased and then decreased. In June 2015, as the soil temperature increased, CO2 emissions peaked at 218 mg m−2 h−1. As the soil temperature dropped (Supplementary Figure S1), the CO2 emission flux decreased, reaching the lowest in September, with B45 showing a negative flux (−69.1 mg m−2 h−1), indicating CO2 absorption. The pattern of CO2 emissions in 2016 was similar to that in 2015. Biochar application decreased CO2 emission flux by 18–25% in 2015 and 19–41% in 2016 compared with the control, with B45 being the most effective in suppressing CO2 emissions (Figure 3a).
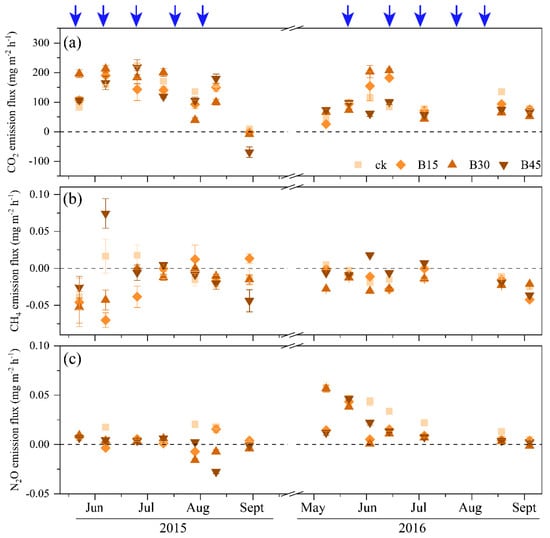
Figure 3.
Soil greenhouse gas (CO2, CH4, and N2O) emission fluxes during the 2015 and 2016 maize growing seasons. (a) CO2 emission fluxes during, (b) CH4 emission fluxes during, (c) N2O emission fluxes during. Note: Error bars denote the standard error (n = 3). Arrows denote the fertigation dates, which were the same for all field treatments. CK, B15, B30, and B45 denote the added biochar amounts of 0 (control), 15, 30, and 45 t ha−1, respectively. Positive and negative values represent the increase (emission) and decrease (absorption) in gases relative to atmospheric values.
CH4 emissions peaked in June and July each year. In mid-June 2015, B45 reached the maximum CH4 emission value (0.074 mg m−2 h−1), before gradually decreasing. In 2015, CH4 was primarily in an absorption state, except for the control and B45 treatment in June and the B15 treatment from August to September. In 2016, only B45 showed a discharge state between June and July, while the other treatments remained in an absorption state. Both B15 and B30 demonstrated a suppressive effect on the seasonal average emission flux of CH4 compared with the control (182–260% in 2015 and 3–63% in 2016), while B45 exhibited an increasing trend, with increases of 120% and 53% in 2015 and 2016, respectively (Figure 3b).
N2O emissions remained relatively stable in 2015. Between August and September, some biochar treatments showed an absorption state, with B45 exhibiting the largest N2O absorption flux (−0.016 mg m−2 h−1). In 2016, N2O emissions for the control and B30 exhibited a decreasing trend (0.058 mg m−2 h−1 and 0.057 mg m−2 h−1), while those for B15 and B30 exhibited an increasing and then decreasing trend, peaking at the end of May (B15, 0.043 mg m−2 h−1; B30, 0.047 mg m−2 h−1). The N2O emission fluxes ranged from −0.07 to 0.07 mg m−2 h−1 in 2015 and from −0.04 to 0.02 mg m−2 h−1 in 2016. Biochar application significantly decreased N2O emissions by 72–110% in 2015 and 39–47% in 2016 (Figure 3c).
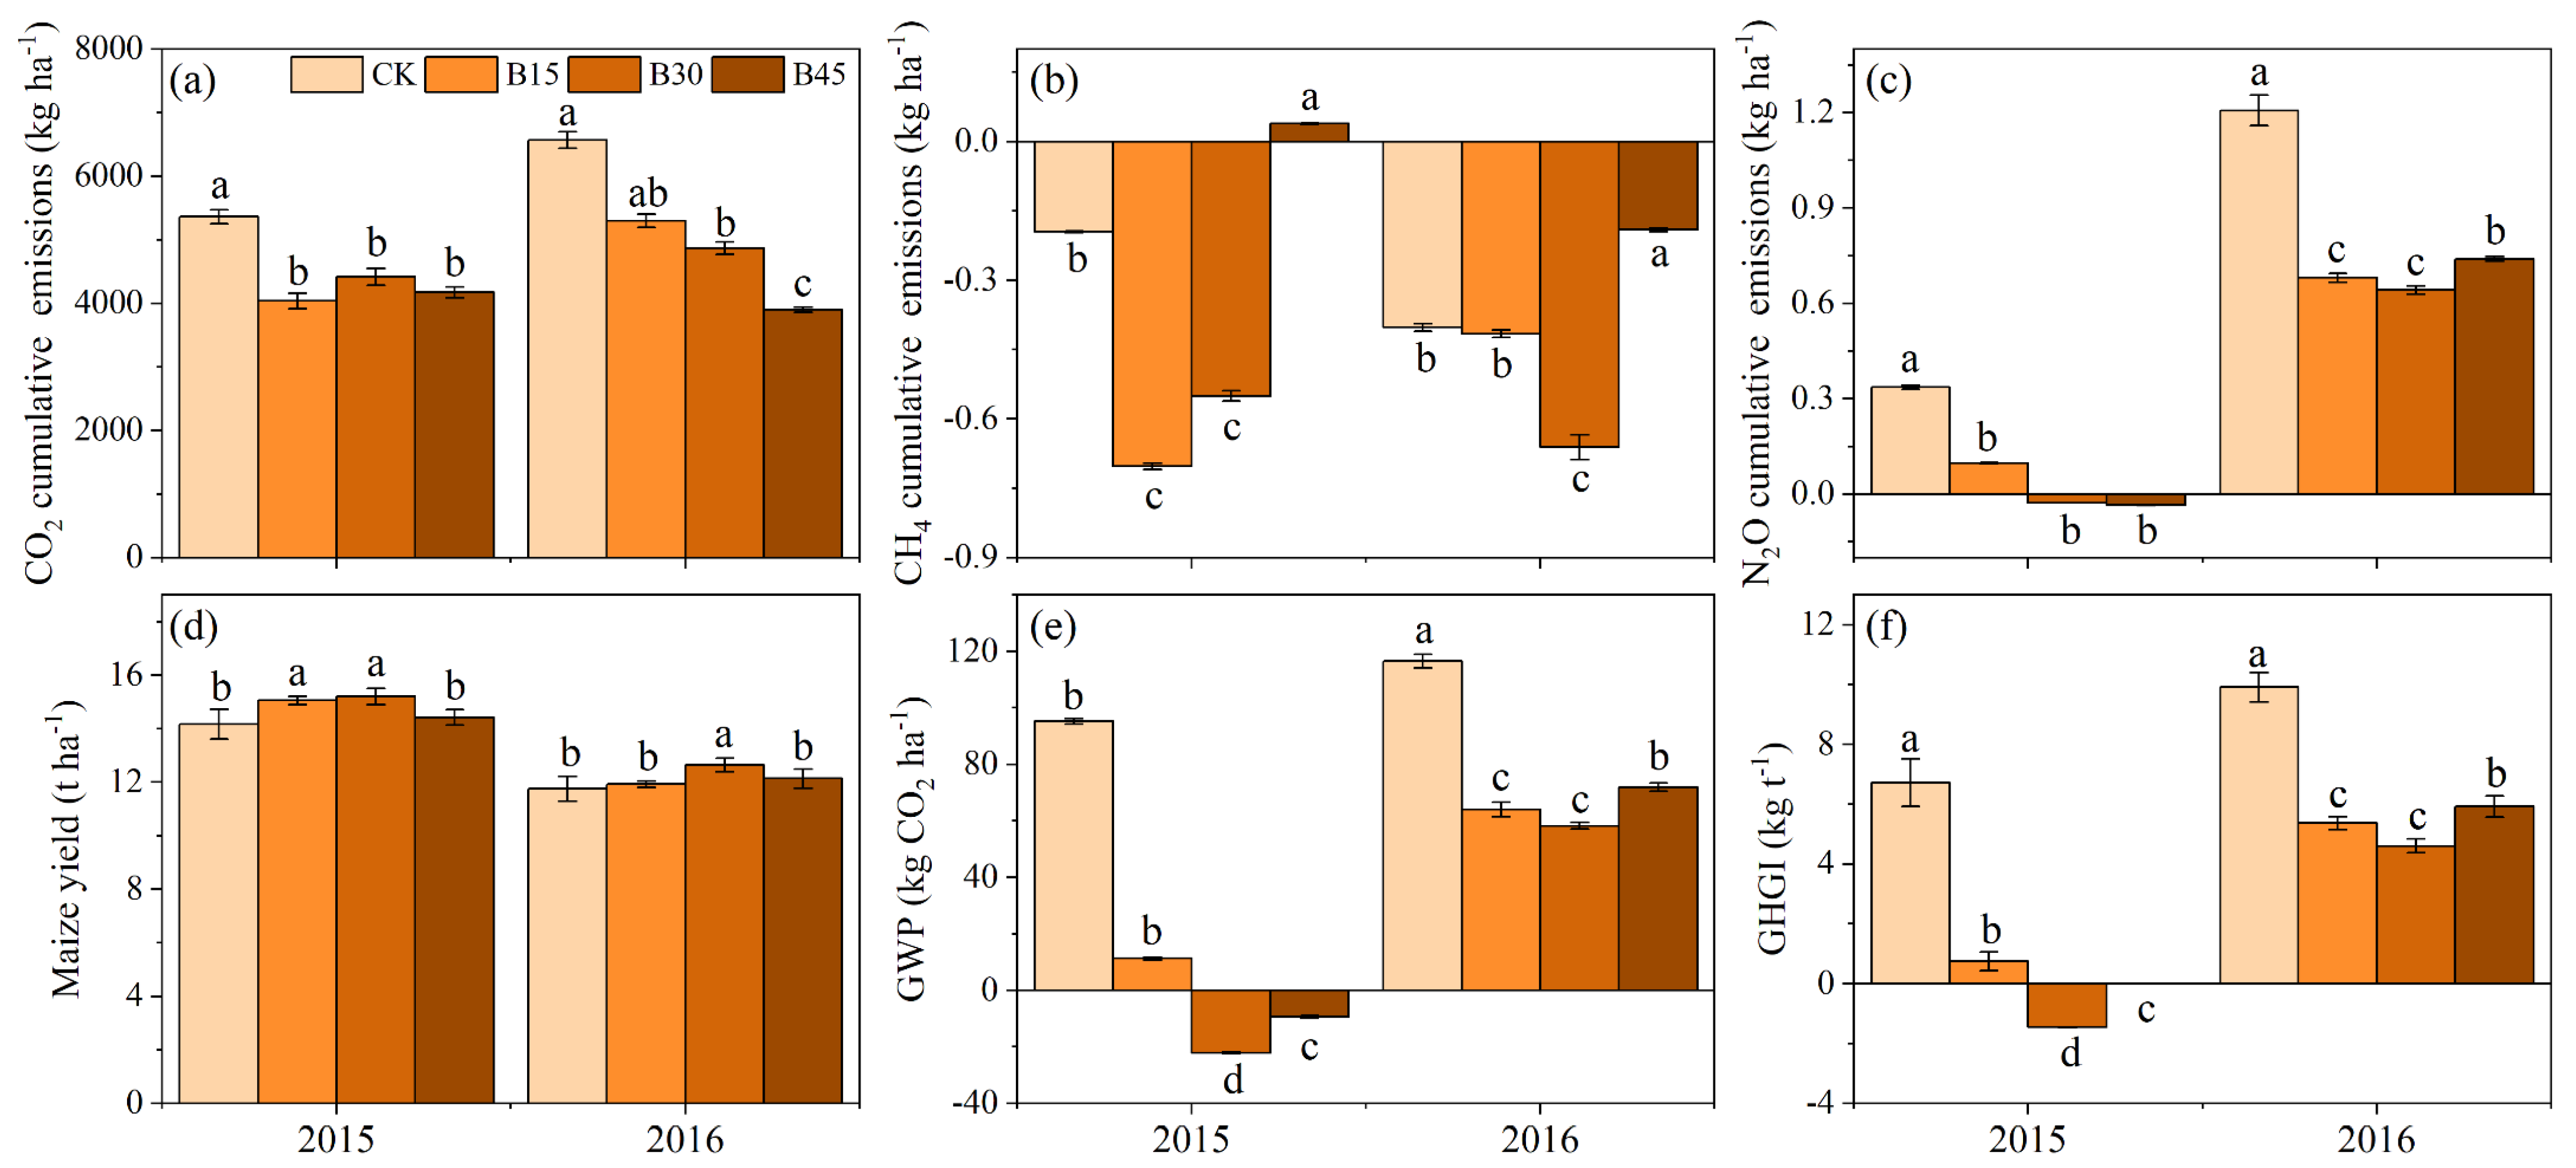
Figure 4 presents cumulative GHG emissions, maize yield, GWP, and GHGI. Biochar addition inhibited CO2 and N2O emissions (Figure 4a,c). In 2015, the biochar treatments had significantly lower total CO2 and N2O emissions than the control, with no significant differences between biochar treatments. In 2016, the biochar treatments continued to decrease total CO2 and N2O emissions significantly compared with the control, with B45 exhibiting the largest reduction in total CO2 emissions (41%), while B15 and B30 had significantly higher reductions in N2O emissions (44% and 47%, respectively) than B45 (39%). For CH4 emissions, the control, B15, and B30 exhibited absorption in 2015 and 2016, while B45 exhibited emission status in 2015 but decreased its absorption by 90% compared with the control in 2016 (Figure 4b). Biochar application increased maize yield, with significantly higher productivity under B30 than the other treatments (Figure 4d). Biochar application significantly decreased the warming trend, with negative GWP values for B30 and B45 in 2015, indicating no warming effect (Figure 4e). The B30 treatment exhibited the lowest GHGI in 2015 and 2016 (Figure 4f). Compared with the control, B15, B30, and B45 decreased GHGI by 89%, 122%, and 100% in 2015 and 46%, 54%, and 40 in 2016%, respectively.
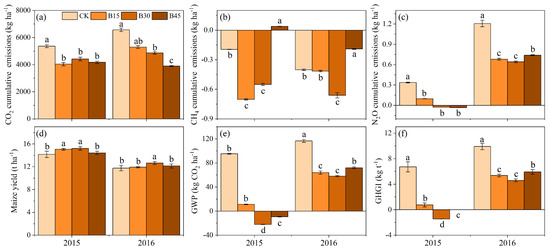
Figure 4.
(a) Soil CO2 cumulative emissions, (b) soil CH4 cumulative emissions, (c) soil N2O cumulative emissions, (d) maize yield, (e) global warming potential, and (f) greenhouse gas emission intensity under different biochar addition amounts. Note: Error bars denote the standard deviation (n = 3). Different letters following the values within each year indicate significant differences among biochar treatments at p < 0.05. CK, B15, B30, and B45 denote the added biochar amounts of 0 (control), 15, 30, and 45 t ha−1, respectively. Positive and negative values represent the increase (emission) and decrease (absorption) in gases relative to atmospheric values.
3.3. Carbon Footprint and Net Ecosystem Carbon Budget
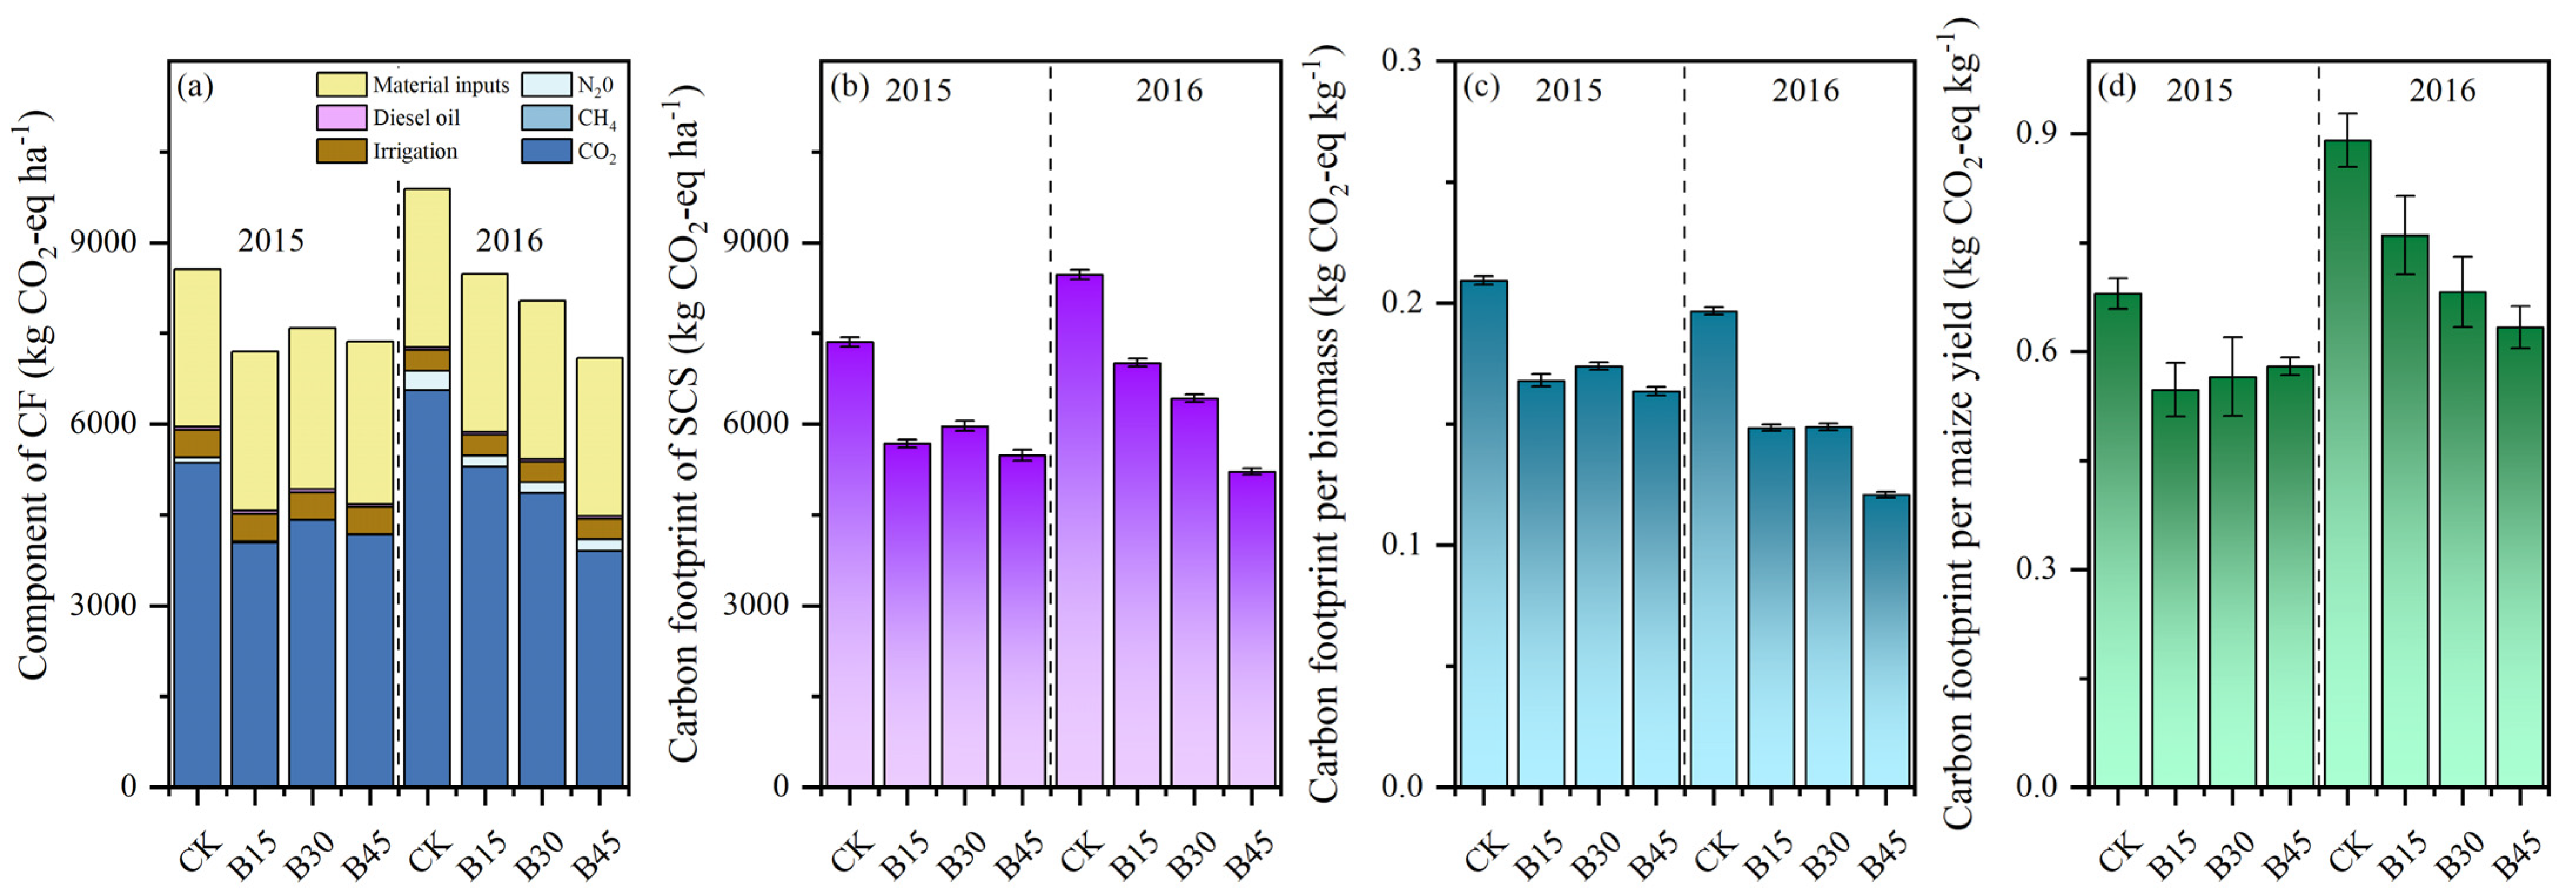
The comparative analysis of two CF methodologies considered scenarios with and without SOC. When SOC was not considered, the CF ranged from 8246 to 9632 kg CO2-eq ha−1 in 2015 and from 7685.69 to 10,474.98 kg CO2-eq ha−1 in 2016 (Figure 5a). The primary determinants influencing the CF were CO2 emissions (49–63%) and agricultural input utilization (33–45%). Biochar application decreased CO2 emissions on average by 13% in 2015 and 19% in 2016 compared with the control. The reduction in CF among the biochar treatments differed little in 2015 but ranged from 13 to 27% in 2016. When considering SOCS, the patterns of CF reduction remained consistent with those observed without SOCS; however, the reduction was more significant, ranging within 19–25% in 2015 and 17–38% in 2016 (Figure 5b).

Figure 5.
(a) Components of carbon footprint, (b) SCS carbon footprint considered, (c) carbon footprint per unit of straw biomass, and (d) grain yield. Note: Error bars denote the standard deviation (n = 3). CK, B15, B30, and B45 denote the added biochar amounts of 0 (control), 15, 30, and 45 t ha−1, respectively.
We calculated the CF for different levels of biochar addition in two matrixes: (1) in terms of straw biomass per unit (Figure 5c) and (2) based on the grain yield per hectare for each season (Figure 5d). Compared with the control, biochar application decreased the average CF per unit dry matter by 16%, with reductions ranging within 6–10% in 2015 and 3–23% in 2016. Moreover, biochar application decreased the CF per unit yield by 11%, with little difference among B15, B30, and B45, in 2015, but there was a more noticeable reduction with an increase in the biochar rate in 2016.
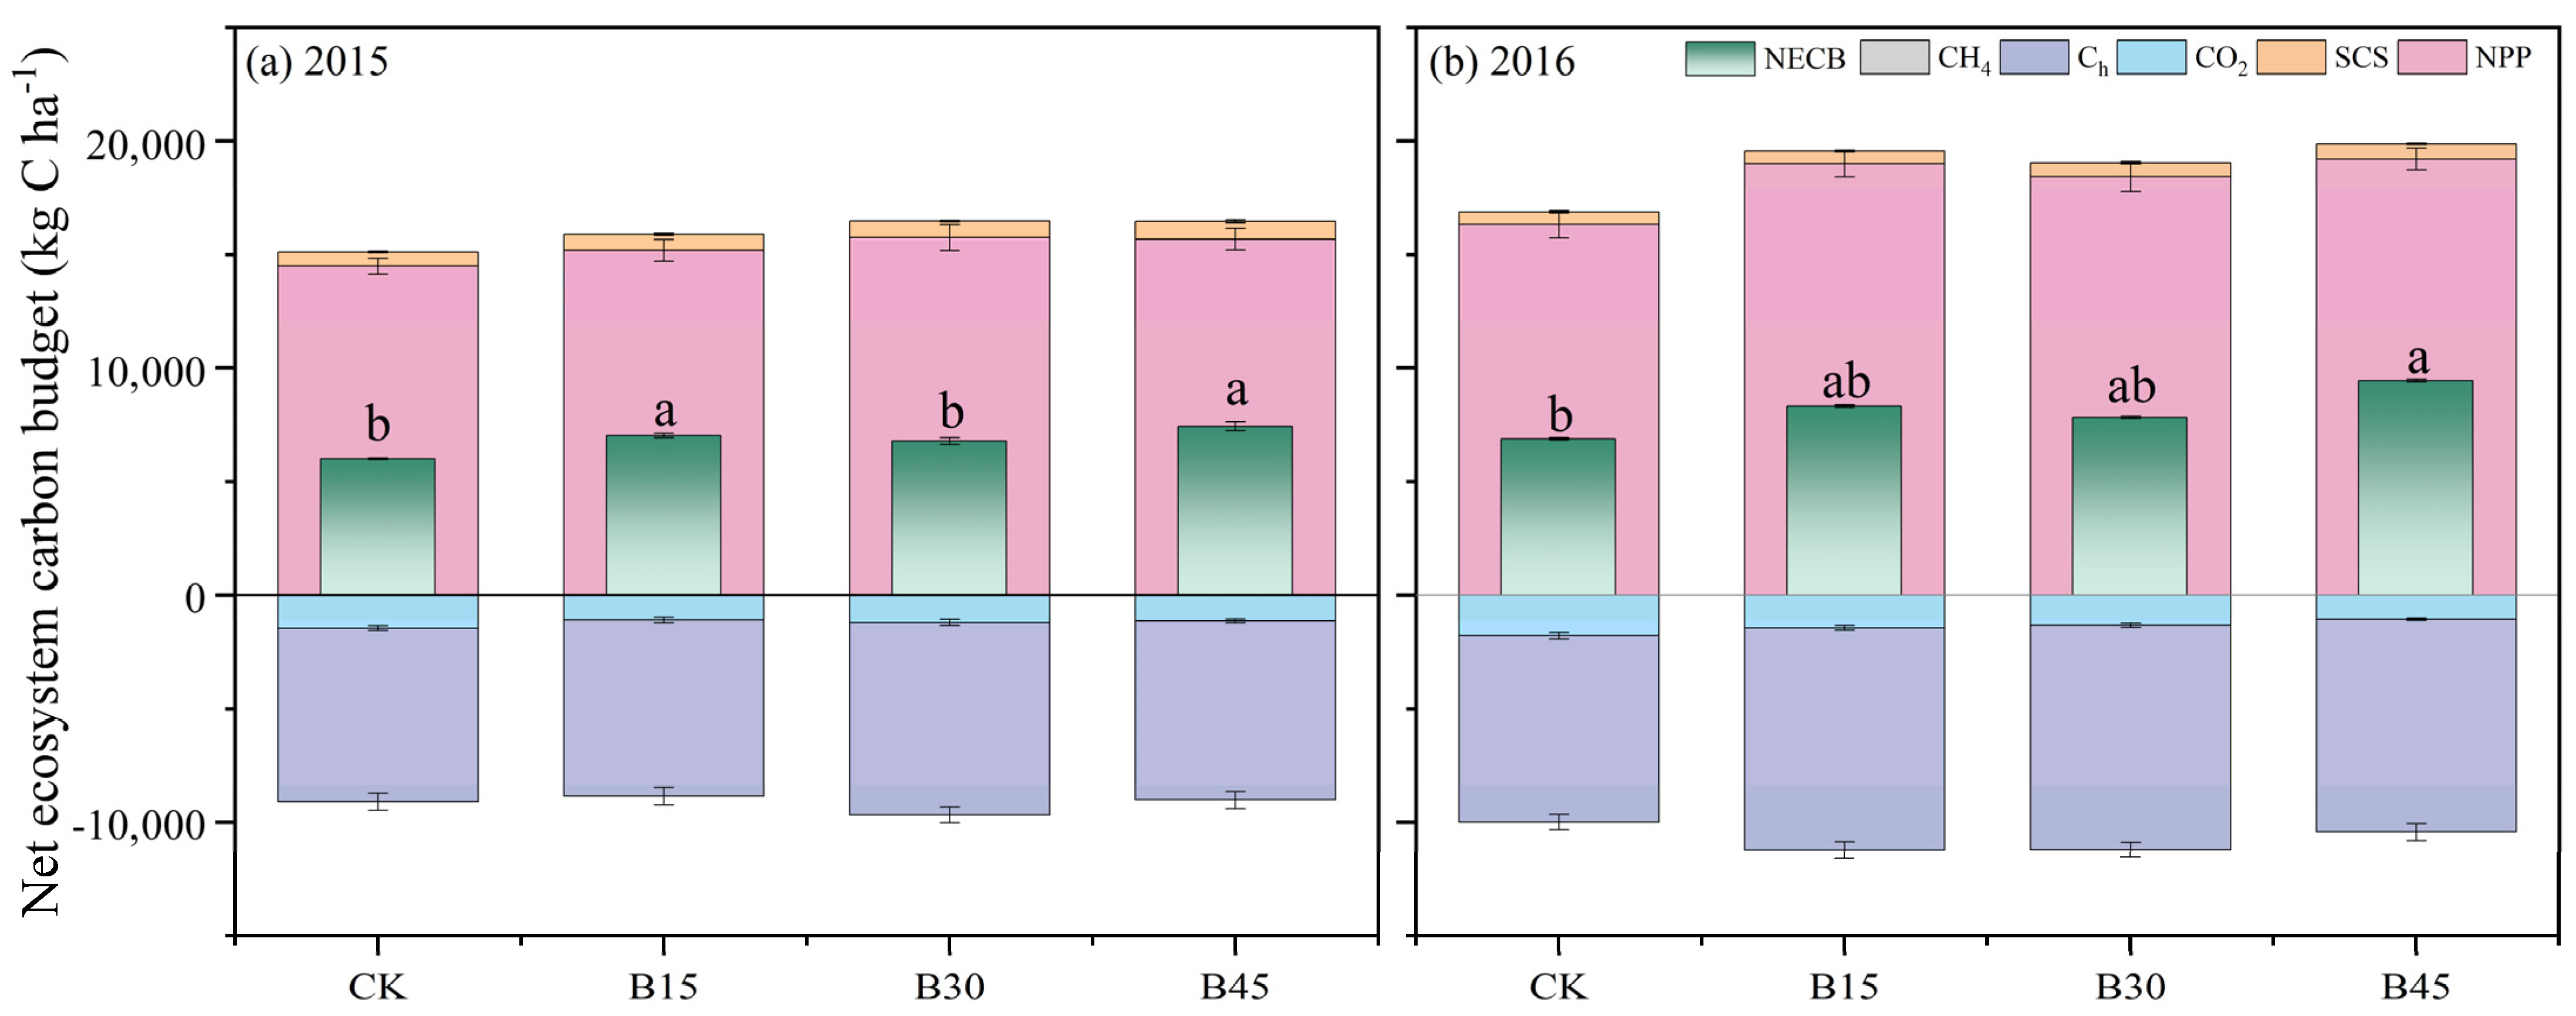
NPP represents the primary source of carbon input (Figure 6). In 2015, biochar application significantly increased SOCS, with a relatively small increase in NPP. In terms of carbon output, B15 and B30 significantly increased production compared with the control, with a relatively small increase under B45. However, when maize yield was converted, B30 demonstrated an 11% increase in yield compared with the control. Similarly, B15 and B45 showed 2% and 3% increases in yield, respectively. In the year 2015, there were significant rises of 17% and 24% in NECB under B15 and B45, respectively, compared with the control group. In 2016, biochar application increased NPP by 13–18% compared with the control, with the smallest increase under B30. In terms of carbon output, biochar application significantly increased yield, with the largest increase being observed under B30 (20%) and the smallest increase under B45 (14%). Ultimately, only B45 significantly increased NPP (37%) compared with the control, with 21% and 14% increases under B15 and B30, respectively.

Figure 6.
Net ecosystem carbon budget (NECB) for different biochar addition amounts. (a) NECB of 2015; (b) NECB of 2016. Note: Error bars denote the standard deviation (n = 3). Different letters following the values within each year indicate significant differences among biochar treatments at p < 0.05. Arrows denote fertigation dates, which were the same for all field treatments. NPP is net primary production, Ca is C input via amendment, SCS is soil organic carbon storage (kg ha−1), CO2 is soil CO2 cumulative emissions, Ch is C output via grain yield, and CH4 is soil CH4 cumulative emissions. CK, B15, B30, and B45 denote the added biochar amounts of 0 (control), 15, 30, and 45 t ha−1, respectively.
3.4. Comprehensive Evaluation of Effect of Adding Biochar to Farmland
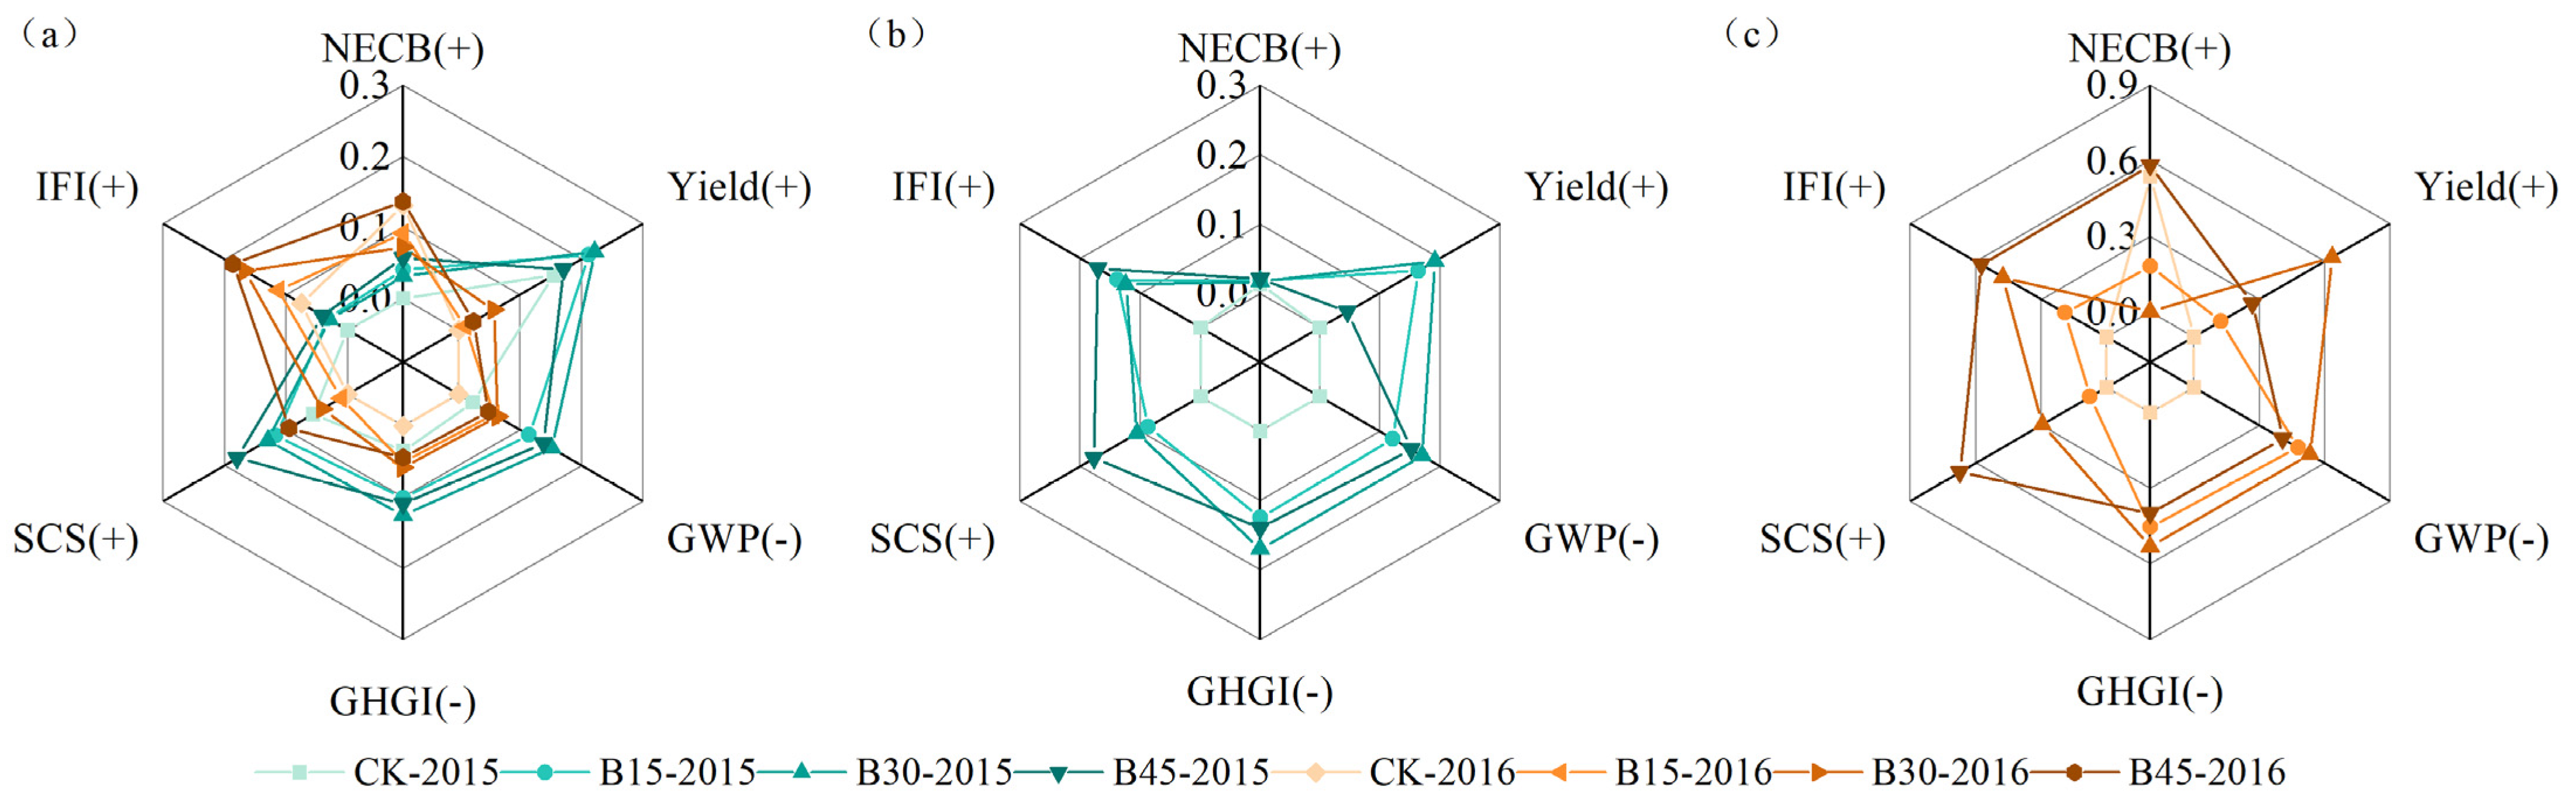
We used the CEI method to comprehensively evaluate the synergistic effects of adding different rates of biochar on various indicators, including IFI, SCS, GHGI, GWP, yield, and NECB (Figure S2). Figure 7 illustrates the contribution of each indicator. Biochar application had a greater impact in 2015 than in 2016, with the most significant impact under B30 (0.20), followed by B45 (0.19). Biochar application only resulted in greater contributions to the NECB and IFI in 2016 than in 2015 (Figure 7a). The production contribution in 2015 and 2016 varied greatly, with an average increase of 5%. We also separately compared the comprehensive impact of each indicator for 2015 and 2016 (Supplementary Figure S2b,c) and found that the ranking of results for individual years was consistent with the comprehensive results. In 2015, B30 (0.37) had the best overall effect, while in 2016, B45 (0.39) showed the best effect. However, significant differences occurred between the separate calculations of each indicator’s contribution in 2015, 2016, and the combined calculation (Figure 7b,c). In 2015, the contribution of various indicators generally remained between 0.1 and 0.2, with NECB being relatively small. In terms of yield, B45 (0.04) produced a much lower result than B15 (0.16) and B30 (0.19). In 2016, large differences in contribution occurred among various indicators. B45 made the largest contribution to NECB (0.58), IFI (0.57), and SCS (0.67), with the lowest contribution to yield (0.27). B30 contributed the most to yield (0.63), GWP (0.53), and GHGI (0.53), with the smallest contribution to NECB (0.01). The control treatment contributed almost nothing to all parameters, except for NECB, to which it made a contribution of 0.54, similar to that of B45.
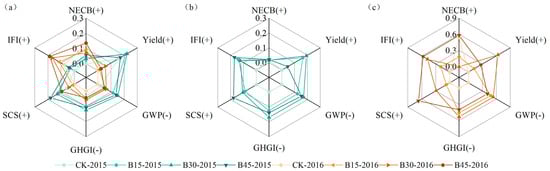
Figure 7.
Radar map of the multiple-objective analysis used to assess various rotation functions. Note: The Entropy-TOPSIS algorithm was used to calculate each factor in (a) 2015–2016, (b) 2015, and (c) 2016. CK, B15, B30, and B45 denote the added biochar amounts of 0 (control), 15, 30, and 45 t ha−1, respectively. Values are normalized. (+), positive variables, (−) negative variables.
4. Discussion
4.1. Adding Biochar Increased NECB and Improved Soil Environment by Increasing NPP and Reducing GHG Emissions
The quantification of the soil carbon balance in agricultural ecosystems can be achieved through the calculation of the NECB, which primarily entails evaluating carbon inputs and outputs to ascertain the net budget. The main factors influencing the NECB in this study were NPP, yield, and CO2 emissions (Figure 6). Biochar application in the first year significantly increased NECB with the increase in the biochar rate, while in the second year, the NECB only significantly differed from the control with the addition of 45 kg ha−1 biochar. Biochar application increased NPP by 1796 kg ha−1 (11.4%) and grain yield by 935 kg ha−1 (11.6%) compared with the control when averaged over both years. While the yield growth rate was similar to NPP, carbon sequestration capacity decreased, likely due to biochar’s ability to modulate soil pH, enhance nutrient bioavailability in soil and plant roots, and positively influence microbial community composition and activity. These effects collectively facilitate crop absorption and the utilization of essential nutrients [28,29]. Several studies have substantiated biochar’s effectiveness in mitigating soil GHG emissions through physical and chemical mechanisms. For instance, Thomas et al. [7] compared N2O and CO2 emissions in soils amended with biochar, demonstrating that gas emissions are primarily influenced by changes in the soil gas relative diffusion coefficient. Their findings confirmed that biochar application significantly reduces greenhouse gas emissions. Additionally, Mahbub et al. [30] conducted a meta-analysis on soil aggregate dynamics in response to biochar application and found that biochar effectively enhances soil aggregation. This increase in soil aggregates limits microbial and enzymatic interactions through a protective encapsulation mechanism, thereby suppressing greenhouse gas emissions. The unique physical structure of biochar enhances soil porosity and alters aggregate structure when incorporated into the soil [31]. These changes mitigate SOC decomposition, foster competition among microbial communities, reduce carbohydrate catabolism, and minimize soil metabolic entropy, ultimately decreasing soil GHG emissions. Biochar can also alter soil pH and nutrient composition [32,33].
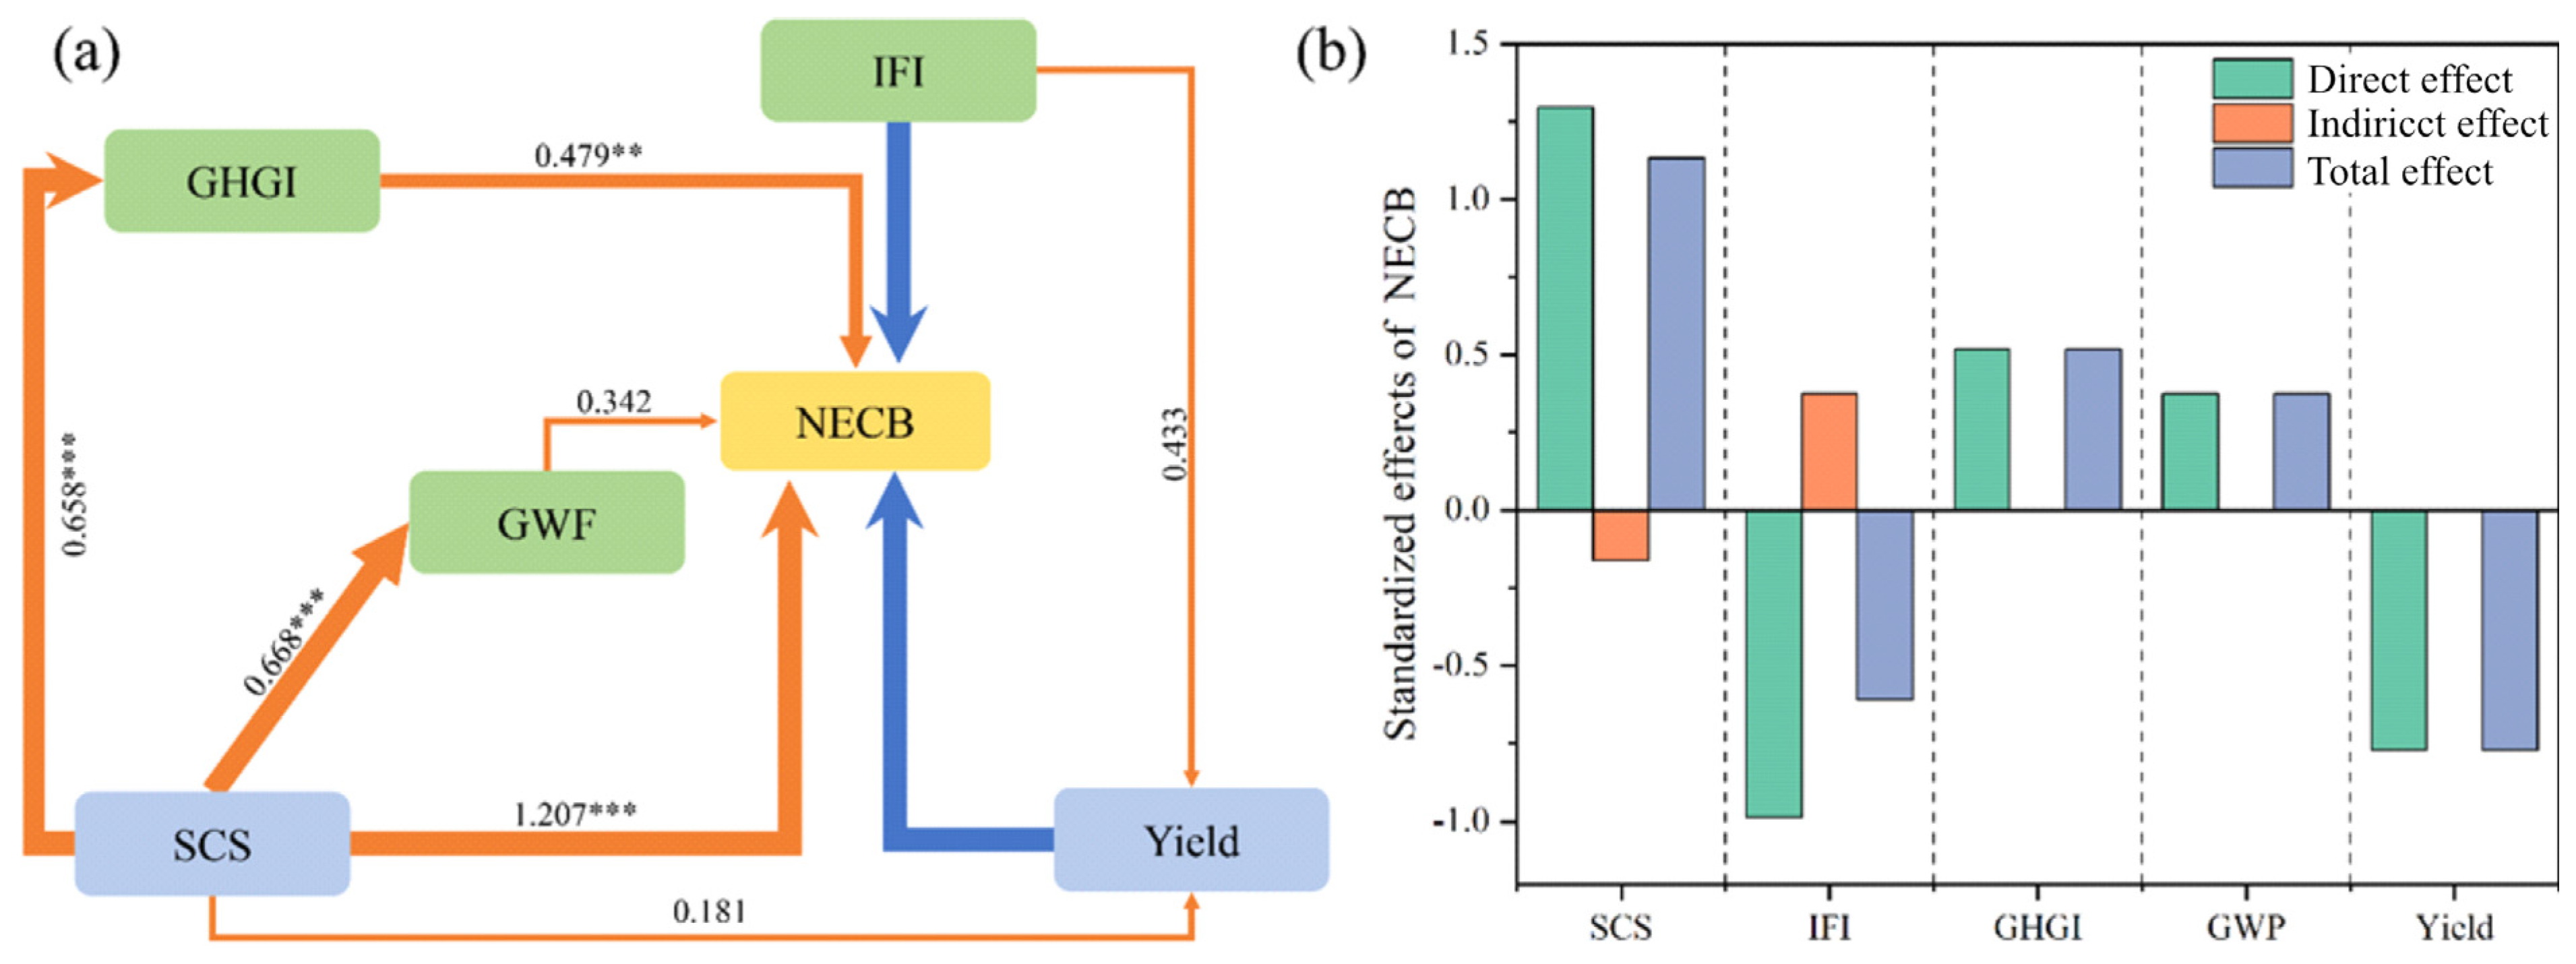
The SEM model explained 86% of the variance in the NECB (Figure 8a), positively impacted by SCS (r = 1.207, p < 0.0001), GHGI (r = 0.479, p < 0.001), and GWP (r = 0.342, p < 0.05) and negatively impacted by yield (r = −0.745, p < 0.0001) and IFI (r = −0.926, p < 0.0001). Soil carbon storage had the most significant direct impact on the NECB, although its indirect impact was negative (Figure 8b). Studies have shown that biochar addition increases SOC content, enriches soil microbial communities, promotes root activity, and increases NPP and yield [34,35], which explains the observed negative influence of SOC on the NECB. Moreover, the IFI serves as an indicator of soil fertility, promoting crop growth and the abundance of soil microbial communities and reducing net soil carbon loss [16,36]. Thus, the IFI may have a positive indirect effect on the NECB. In this study, we calculated soil carbon storage without distinguishing between changes in native organic matter and the contribution of biochar itself, which may have led to an overestimation of carbon sequestration. However, Lu et al. [37] analyzed microbial communities in biochar-amended farmland and found that biochar can inhibit the decomposition of native SOC. Similarly, Sun et al. [38], through an eight-year field experiment, demonstrated that biochar increases natural soil organic carbon content by altering the size distribution of soil aggregates and enhancing SOC accumulation within them.
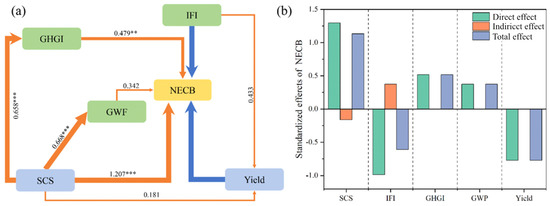
Figure 8.
(a) Structural equation modeling (SEM) of effects of direct and indirect relationships between net ecosystem carbon budget (NECB) and other factors and (b) standardized effects of NECB. Note: Soil organic carbon storage (SCS), sub-fertility index (IFI), global warming potential (GWP), greenhouse gas emission intensity (GHGI), and maize yield. Arrow thickness reflects strength of relationship (no arrow shown for non-significant effects). ** p < 0.01 and *** p < 0.001.
Multiple research studies have demonstrated the positive impact of incorporating biochar on enhancing soil fertility. Biochar effectively releases essential elements like N, P, and K into the soil, thereby augmenting its nutrient reservoir [16]. Biochar can improve the rate of N mineralization due to its aromatic enrichment, increasing N content [39]. Biochar reduces potassium leaching mainly due to its strong exchange capacity. Biochar effectively increases potassium adsorption in sandy soils with a lighter texture [40].
In 2015, soil K content peaked with 15 t ha−1 biochar addition but was 10 mg kg−1 lower than the control with 45 t ha−1 biochar. Possible factors that could contribute to this phenomenon include the potential utilization of a significant amount of K during the decomposition process of biochar by soil microorganisms [41], as well as the competition for K between plant roots and soil microorganisms due to an increase in both their abundance and activity [42]. In 2016, soil K content increased with higher biochar rates, suggesting that excessive biochar addition might have weakened the impact on soil nutrient pools over time.
4.2. Biochar Could Decrease CF by Enhancing Soil Carbon Sequestration and Reducing GHG Emissions from Soil
The primary factor influencing the CF of farmland in arid regions was CO2 emissions, followed by fertilizer use. Fertilizer contributed 34–45% of the CF output in 2015 (Figure 5), aligning with the findings of Bai et al. [43] and Zhang et al. [44]. Biochar addition reduces soil CO2 emissions, increases soil sequestration, and enhances crop yield, directly or indirectly reducing the CF. Zhang et al. [44] also demonstrated that incorporating electricity recovery during biochar production mitigated the CF within the cultivation system. Soil organic carbon storage is an important factor in CF assessments. Increasing SOCS can offset CO2 emissions during crop growth, reducing the CF, with biochar application being an effective method to increase SOCS [17]. Notably, in the first year following biochar application, we observed a distinct increase in CH4 emissions under the high-dose treatment (45 t ha−1), contrasting sharply with the trends under the other treatments. We attribute this phenomenon primarily to the excessive biochar application rate, which likely induced soil pore occlusion, thereby impeding oxygen diffusion and enhancing anaerobic conditions. This shift in soil micro-environment would favor the proliferation and activity of methanogens. Our findings align with those of [45], who reported similar CH4 elevation under high biochar loads in waterlogged soils. Our study also observed that biochar addition significantly reduced soil GHG emissions, though the increase in yield was small (Figure 4), resulting in a decrease in the CF per unit of straw biomass and grain yield (Figure 5c,d).
Excessive N fertilizer application is prevalent in China’s dryland agriculture, leading to fertilizer losses, adverse environmental impacts, and increased GHG emissions [45]. Zhang et al. [46] reported that increasing N fertilizer application from 200 to 320 kg ha−1 increased N2O emissions from 1 to 3.6 kg N2O ha−1. Moreover, adding 10 t ha−1 biochar and increasing N fertilizer application from 200 to 320 kg ha−1 only increased N2O emissions from 0.69 to 1.5 kg N2O ha−1. These findings demonstrate that while biochar addition can mitigate GHG emission risks, biochar production also entails carbon losses. Therefore, a detailed and comprehensive assessment of carbon emissions associated with agricultural product manufacturing, transportation, agricultural machinery usage, and field labor becomes imperative to fully understand the carbon dynamics and benefits of biochar application in agricultural systems.
5. Conclusions
Our two-year field experiment demonstrated that biochar application enhances soil fertility, reduces greenhouse gas emissions, and increases corn yields in the arid regions of northwest China. Additionally, we conducted a comprehensive evaluation of biochar’s impact on greenhouse gases by quantifying key indicators, including soil carbon storage, GHG, CF, and NECB, in biochar-amended corn farmland.
This study confirmed that biochar application increased soil carbon storage by 1–34% and improved soil fertility by 10–29%. Furthermore, biochar effectively reduced CO2 emissions and promoted carbon sequestration. The most significant reduction in greenhouse gas emissions occurred in the first year of biochar application, with a decrease of 89–122%. Although the reduction rate declined in the second year, emissions were still reduced by 40–54%. Biochar addition significantly lowered the carbon footprint while enhancing the net ecosystem carbon balance. Our findings indicate that the primary factors influencing the carbon footprint were CO2 emissions (49–63%) and agricultural input utilization (33–45%). On average, biochar applications reduced greenhouse gas emissions by 16%, contributing to a more sustainable farming system.
Based on NECB calculations, we found that NPP was the primary driver of NECB increases, with biochar application boosting NPP by an average of 18% per year. Finally, we employed the Entropy-TOPSIS method to comprehensively assess various indicators, including IFI, NECB, GHGI, GWP, SCS, and yield, under different biochar application rates. Based on our findings, we recommend applying 30 t ha−1 biochar in the arid regions of northwest China to achieve optimal corn yields and maximize greenhouse gas reduction through enhanced carbon sequestration.
Supplementary Materials
The following supporting information can be downloaded at: https://www.mdpi.com/article/10.3390/agronomy15051007/s1. Table S1. Grading standards of soil properties; Table S2. Coefficient of carbon emissions from different materials for agricultural production [47]; Table S3. GHG emissions from various components/categories related to crop production under different straw return treatments in 2015–2016; Figure S1. Soil temperatures from 2015 and 2016. Note: CK, B15, B30, and B45 denote added biochar amounts of 0 (control), 15, 30, and 45 t ha−1, respectively; Figure S2. Comprehensive evaluation index under different biochar addition amounts in (a) 2015–2016, (b) 2015 only, and (c) 2016 only. Note: Numbers indicate the rankings of different treatments; CK, B15, B30, and B45 denote added biochar amounts of 0 (control), 15, 30, and 45 t ha−1, respectively.
Author Contributions
All authors contributed to the conception and design of the study. Y.J.: Conceptualization, data analysis, and manuscript drafting and revision. Y.S.: Conceptualization, experimental design, sample collection, and chemical analysis. D.Z.: Conceptualization, experimental design, sample collection, and chemical analysis. J.P.: Conceptualization, data analysis, and manuscript revision. W.Y.: Conceptualization, data analysis, and manuscript revision. Z.Q.: Conceptualization, and manuscript review and critical revision for important intellectual content. K.H.M.S.: Manuscript review and critical revision for important intellectual content. All authors have read and agreed to the published version of the manuscript.
Funding
This research study was jointly supported by the National Key Research and Development Program of China (No. 2021YFC3201205), the Basic scientific research operating expenses of universities directly under the Inner Mongolia Autonomous Region (BR22-13-12), the National Natural Science Foundation of China Joint Fund Project (No. U24A20179), the First-Class Discipline Research Program (YLXKZX-NND-002), and the China Scholarship Council (CSC).
Data Availability Statement
The data presented in this study will be made available upon request from the corresponding author.
Acknowledgments
We would like to thank the editors and the anonymous reviewers for their appreciated work, helpful suggestions, and comments.
Conflicts of Interest
The authors declare no conflicts of interest.
References
- Xu, F.; Qu, Y.; Bento, V.A.; Song, H.; Qiu, J.; Qi, J.; Wan, L.; Zhang, R.; Miao, L.; Zhang, X.; et al. Understanding Climate Change Impacts on Drought in China over the 21st Century: A Multi-Model Assessment from CMIP6. NPJ Clim. Atmos. Sci. 2024, 7, 32. [Google Scholar] [CrossRef]
- Zheng, X.; Streimikiene, D.; Balezentis, T.; Mardani, A.; Cavallaro, F.; Liao, H. A Review of Greenhouse Gas Emission Profiles, Dynamics, and Climate Change Mitigation Efforts across the Key Climate Change Players. J. Clean. Prod. 2019, 234, 1113–1133. [Google Scholar] [CrossRef]
- Shi, Y.; Huang, G.; An, C.; Zhou, Y.; Yin, J. Assessment of Regional Greenhouse Gas Emissions from Spring Wheat Cropping System: A Case Study of Saskatchewan in Canada. J. Clean. Prod. 2021, 301, 126917. [Google Scholar] [CrossRef]
- Clark, M.A.; Domingo, N.G.G.; Colgan, K.; Thakrar, S.K.; Tilman, D.; Lynch, J.; Azevedo, I.L.; Hill, J.D. Global Food System Emissions Could Preclude Achieving the 1.5° and 2 °C Climate Change Targets. Science 2020, 370, 705–708. [Google Scholar] [CrossRef] [PubMed]
- Wang, L.; Li, L.; Cheng, K.; Pan, G. Comprehensive Evaluation of Environmental Footprints of Regional Crop Production: A Case Study of Chizhou City, China. Ecol. Econ. 2019, 164, 106360. [Google Scholar] [CrossRef]
- Bai, S.H.; Reverchon, F.; Xu, C.-Y.; Xu, Z.; Blumfield, T.J.; Zhao, H.; Van Zwieten, L.; Wallace, H.M. Wood Biochar Increases Nitrogen Retention in Field Settings Mainly through Abiotic Processes. Soil Biol. Biochem. 2015, 90, 232–240. [Google Scholar] [CrossRef]
- Hu, N.; Wang, B.; Gu, Z.; Tao, B.; Zhang, Z.; Hu, S.; Zhu, L.; Meng, Y. Effects of Different Straw Returning Modes on Greenhouse Gas Emissions and Crop Yields in a Rice–Wheat Rotation System. Agric. Ecosyst. Environ. 2016, 223, 115–122. [Google Scholar] [CrossRef]
- Chen, L.; Jiang, Y.; Liang, C.; Luo, Y.; Xu, Q.; Han, C.; Zhao, Q.; Sun, B. Competitive Interaction with Keystone Taxa Induced Negative Priming under Biochar Amendments. Microbiome 2019, 7, 77. [Google Scholar] [CrossRef]
- Zhao, J.; Qiu, Y.; Yi, F.; Li, J.; Wang, X.; Fu, Q.; Fu, X.; Yao, Z.; Dai, Z.; Qiu, Y.; et al. Biochar Dose-Dependent Impacts on Soil Bacterial and Fungal Diversity across the Globe. Sci. Total Environ. 2024, 930, 172509. [Google Scholar] [CrossRef]
- Xia, F.; Zhang, Z.; Zhang, Q.; Huang, H.; Zhao, X. Life Cycle Assessment of Greenhouse Gas Emissions for Various Feedstocks-Based Biochars as Soil Amendment. Sci. Total Environ. 2024, 911, 168734. [Google Scholar] [CrossRef]
- Adewale, C.; Reganold, J.P.; Higgins, S.; Evans, R.D.; Carpenter-Boggs, L. Agricultural Carbon Footprint Is Farm Specific: Case Study of Two Organic Farms. J. Clean. Prod. 2019, 229, 795–805. [Google Scholar] [CrossRef]
- Xiao, C.; Zhang, F.; Li, Y.; Fan, J.; Ji, Q.; Jiang, F.; He, Z. Optimizing Drip Irrigation and Nitrogen Fertilization Regimes to Reduce Greenhouse Gas Emissions, Increase Net Ecosystem Carbon Budget and Reduce Carbon Footprint in Saline Cotton Fields. Agric. Ecosyst. Environ. 2024, 366, 108912. [Google Scholar] [CrossRef]
- Zhang, S.; Xue, L.; Liu, J.; Xia, L.; Jia, P.; Feng, Y.; Hao, X.; Zhao, X. Biochar Application Reduced Carbon Footprint of Maize Production in the Saline−alkali Soils. Agric. Ecosyst. Environ. 2024, 368, 109001. [Google Scholar] [CrossRef]
- Gerakis, A.; Baer, B. A Computer Program for Soil Textural Classification. Soil Sci. Soc. Am. J. 1999, 63, 807–808. [Google Scholar] [CrossRef]
- Li, S.; Hu, M.; Shi, J.; Tian, X.; Wu, J. Integrated Wheat-Maize Straw and Tillage Management Strategies Influence Economic Profit and Carbon Footprint in the Guanzhong Plain of China. Sci. Total Environ. 2021, 767, 145347. [Google Scholar] [CrossRef] [PubMed]
- Wang, X.; Li, Y.; Feng, H.; Yu, Q.; Fan, X.; Liu, C.; Chen, J.; Yang, Z.; Biswas, A. Combining Biochar with Cotton-Sugarbeet Intercropping Increased Water-Fertilizer Productivity and Economic Benefits under Plastic Mulched Drip Irrigation in Xinjiang, China. Ind. Crops Prod. 2023, 192, 116060. [Google Scholar] [CrossRef]
- Hu, M.; Qu, Z.; Li, Y.; Xiong, Y.; Huang, G. Contrasting Effects of Different Straw Return Modes on Net Ecosystem Carbon Budget and Carbon Footprint in Saline-Alkali Arid Farmland. Soil Tillage Res. 2024, 239, 106031. [Google Scholar] [CrossRef]
- Bao, Y.X.; Xu, M.G.; Lv, F.T.; Huang, Q.H.; Nie, J.; Zhang, H.M.; Yu, H.Q. Evaluation Method on Soil Fertility under Long-Term Fertilization. Sci. Agric. Sin. 2012, 45, 4197–4204. [Google Scholar]
- Yang, W.; Feng, G.; Miles, D.; Gao, L.; Jia, Y.; Li, C.; Qu, Z. Impact of Biochar on Greenhouse Gas Emissions and Soil Carbon Sequestration in Corn Grown under Drip Irrigation with Mulching. Sci. Total Environ. 2020, 729, 138752. [Google Scholar] [CrossRef]
- Zhang, A.; Liu, Y.; Pan, G.; Hussain, Q.; Li, L.; Zheng, J.; Zhang, X. Effect of Biochar Amendment on Maize Yield and Greenhouse Gas Emissions from a Soil Organic Carbon Poor Calcareous Loamy Soil from Central China Plain. Plant Soil 2012, 351, 263–275. [Google Scholar] [CrossRef]
- Chai, Q.; Nemecek, T.; Liang, C.; Zhao, C.; Yu, A.; Coulter, J.A.; Wang, Y.; Hu, F.; Wang, L.; Siddique, K.H.M.; et al. Integrated Farming with Intercropping Increases Food Production While Reducing Environmental Footprint. Proc. Natl. Acad. Sci. USA 2021, 118, e2106382118. [Google Scholar] [CrossRef]
- Stocker, T. Climate Change 2013: The Physical Science Basis: Working Group I Contribution to the Fifth Assessment Report of the Intergovernmental Panel on Climate Change; Cambridge University Press: Cambridge, UK, 2014; ISBN 978-1-107-05799-9. [Google Scholar]
- Zhang, Y.; Xu, M.; Chen, H.; Adams, J. Global Pattern of NPP to GPP Ratio Derived from MODIS Data: Effects of Ecosystem Type, Geographical Location and Climate. Glob. Ecol. Biogeogr. 2009, 18, 280–290. [Google Scholar] [CrossRef]
- Buyanovsky, G.A.; Wagner, G.H. Crop Residue Input to Soil Organic Matter on Sanborn Field. In Soil Organic Matter in Temperate AgroecosystemsLong Term Experiments in North America; CRC Press: Boca Raton, FL, USA, 1996; ISBN 978-0-367-81169-3. [Google Scholar]
- Yang, X.; Xiong, J.; Du, T.; Ju, X.; Gan, Y.; Li, S.; Xia, L.; Shen, Y.; Pacenka, S.; Steenhuis, T.S.; et al. Diversifying Crop Rotation Increases Food Production, Reduces Net Greenhouse Gas Emissions and Improves Soil Health. Nat. Commun. 2024, 15, 198. [Google Scholar] [CrossRef] [PubMed]
- Grace, J.B. Structural Equation Modeling and Natural Systems; Cambridge University Press: Cambridge, UK, 2006; ISBN 978-1-139-45784-2. [Google Scholar]
- Yang, X.; Li, Z.; Ma, C.; Yang, Z.; Wei, J.; Wang, T.; Wen, X.; Chen, W.; Shi, X.; Zhang, Y.; et al. Microplastics Influence on Hg Methylation in Diverse Paddy Soils. J. Hazard. Mater. 2022, 423, 126895. [Google Scholar] [CrossRef]
- Xu, C.; Han, X.; Bol, R.; Smith, P.; Wu, W.; Meng, F. Impacts of Natural Factors and Farming Practices on Greenhouse Gas Emissions in the North China Plain: A Meta-Analysis. Ecol. Evol. 2017, 7, 6702–6715. [Google Scholar] [CrossRef]
- Keller, T.; Hüppi, R.; Leifeld, J. Relationship between Greenhouse Gas Emissions and Changes in Soil Gas Diffusivity in a Field Experiment with Biochar and Lime. J. Plant Nutr. Soil Sci. 2019, 182, 667–675. [Google Scholar] [CrossRef]
- Islam, M.U.; Jiang, F.; Guo, Z.; Peng, X. Does Biochar Application Improve Soil Aggregation? A Meta-Analysis. Soil Tillage Res. 2021, 209, 104926. [Google Scholar] [CrossRef]
- Yang, C.D.; Lu, S.G. Effects of Five Different Biochars on Aggregation, Water Retention and Mechanical Properties of Paddy Soil: A Field Experiment of Three-Season Crops. Soil Tillage Res. 2021, 205, 104798. [Google Scholar] [CrossRef]
- Case, S.D.C.; McNamara, N.P.; Reay, D.S.; Whitaker, J. The Effect of Biochar Addition on N2O and CO2 Emissions from a Sandy Loam Soil—The Role of Soil Aeration. Soil Biol. Biochem. 2012, 51, 125–134. [Google Scholar] [CrossRef]
- Wiedemeier, D.B.; Abiven, S.; Hockaday, W.C.; Keiluweit, M.; Kleber, M.; Masiello, C.A.; McBeath, A.V.; Nico, P.S.; Pyle, L.A.; Schneider, M.P.W.; et al. Aromaticity and Degree of Aromatic Condensation of Char. Org. Geochem. 2015, 78, 135–143. [Google Scholar] [CrossRef]
- Cao, Y.; Shan, Y.; Wu, P.; Zhang, P.; Zhang, Z.; Zhao, F.; Zhu, T. Mitigating the Global Warming Potential of Rice Paddy Fields by Straw and Straw-Derived Biochar Amendments. Geoderma 2021, 396, 115081. [Google Scholar] [CrossRef]
- Qian, R.; Guo, R.; Liu, Y.; Naseer, M.A.; Hussain, S.; Liu, D.; Zhang, P.; Chen, X.; Ren, X. Biodegradable Film Mulching Combined with Straw Incorporation Can Significantly Reduce Global Warming Potential with Higher Spring Maize Yield. Agric. Ecosyst. Environ. 2022, 340, 108181. [Google Scholar] [CrossRef]
- Lloret, F.; Casanovas, C.; Peñuelas, J. Seedling Survival of Mediterranean Shrubland Species in Relation to Root:Shoot Ratio, Seed Size and Water and Nitrogen Use. Funct. Ecol. 1999, 13, 210–216. [Google Scholar] [CrossRef]
- Lu, W.; Ding, W.; Zhang, J.; Li, Y.; Luo, J.; Bolan, N.; Xie, Z. Biochar Suppressed the Decomposition of Organic Carbon in a Cultivated Sandy Loam Soil: A Negative Priming Effect. Soil Biol. Biochem. 2014, 76, 12–21. [Google Scholar] [CrossRef]
- Sun, Z.; Zhang, Z.; Zhu, K.; Wang, Z.; Zhao, X.; Lin, Q.; Li, G. Biochar Altered Native Soil Organic Carbon by Changing Soil Aggregate Size Distribution and Native SOC in Aggregates Based on an 8-Year Field Experiment. Sci. Total Environ. 2020, 708, 134829. [Google Scholar] [CrossRef] [PubMed]
- Mohan, D.; Abhishek, K.; Sarswat, A.; Patel, M.; Singh, P.; Pittman, C.U. Biochar Production and Applications in Soil Fertility and Carbon Sequestration-a Sustainable Solution to Crop-Residue Burning in India. RSC Adv. 2018, 8, 508–520. [Google Scholar] [CrossRef]
- Rogovska, N.; Laird, D.A.; Rathke, S.J.; Karlen, D.L. Biochar Impact on Midwestern Mollisols and Maize Nutrient Availability. Geoderma 2014, 230, 340–347. [Google Scholar] [CrossRef]
- Wang, L.; Xue, C.; Nie, X.; Liu, Y.; Chen, F. Effects of Biochar Application on Soil Potassium Dynamics and Crop Uptake. J. Plant Nutr. Soil Sci. 2018, 181, 635–643. [Google Scholar] [CrossRef]
- Meena, V.S.; Maurya, B.R.; Verma, J.P. Does a Rhizospheric Microorganism Enhance K+ Availability in Agricultural Soils? Microbiol. Res. 2014, 169, 337–347. [Google Scholar] [CrossRef]
- Bai, J.; Song, J.; Chen, D.; Zhang, Z.; Yu, Q.; Ren, G.; Han, X.; Wang, X.; Ren, C.; Yang, G.; et al. Biochar Combined with N Fertilization and Straw Return in Wheat-Maize Agroecosystem: Key Practices to Enhance Crop Yields and Minimize Carbon and Nitrogen Footprints. Agric. Ecosyst. Environ. 2023, 347, 108366. [Google Scholar] [CrossRef]
- Zhang, S.; Liu, J.; Feng, Y.; Hao, X.; Liang, Y.; Xue, L.; Zhao, X. Optimized Fertilization Mitigated Carbon and Nitrogen Losses in a Solonchak. Eur. J. Soil Sci. 2024, 75, e13474. [Google Scholar] [CrossRef]
- Nazir, M.J.; Li, G.; Nazir, M.M.; Zulfiqar, F.; Siddique, K.H.; Iqbal, B.; Du, D. Harnessing soil carbon sequestration to address climate change challenges in agriculture. Soil Tillage Res. 2024, 237, 105959. [Google Scholar] [CrossRef]
- Zhang, G.; Liu, S.; Wang, X.; Wang, X.; Zhang, Y.; Zhao, D.; Wen, X.; Han, J.; Liao, Y. Mixed Application of Controlled-Release Urea and Normal Urea Can Improve Crop Productivity and Reduce the Carbon Footprint under Straw Return in Winter Wheat-Summer Maize Cropping System. Eur. J. Agron. 2023, 151, 127002. [Google Scholar] [CrossRef]
- Chen, S.; Lu, F.; Wang, X.K. Estimation of greenhouse gases emission factors for China’s nitrogen, phosphate, and potash fertilizers. Shengtai Xuebao 2015, 35, 6371–6383. [Google Scholar] [CrossRef]
Disclaimer/Publisher’s Note: The statements, opinions and data contained in all publications are solely those of the individual author(s) and contributor(s) and not of MDPI and/or the editor(s). MDPI and/or the editor(s) disclaim responsibility for any injury to people or property resulting from any ideas, methods, instructions or products referred to in the content. |
© 2025 by the authors. Licensee MDPI, Basel, Switzerland. This article is an open access article distributed under the terms and conditions of the Creative Commons Attribution (CC BY) license (https://creativecommons.org/licenses/by/4.0/).