Article

Influence of Groundwater Depth on Salt Migration and Maize Growth in the Typical Irrigation Area

1
Ordos Water Conservancy Development Center, Ordos Municipal Water Conservancy Bureau, Ordos 017000, China
2
College of Water Conservancy and Civil Engineering, Inner Mongolia Agricultural University, Hohhot 010018, China
3
Inner Mongolia Key Lab of Molecular Biology, School of Basic Medical Sciences, Inner Mongolia Medical University, Hohhot 010059, China
4
School of Materials Science and Engineering, Beihang University, Beijing 100191, China
*
Authors to whom correspondence should be addressed.
Agronomy 2025, 15(5), 1021; https://doi.org/10.3390/agronomy15051021
Submission received: 10 February 2025 / Revised: 25 March 2025 / Accepted: 18 April 2025 / Published: 24 April 2025
(This article belongs to the Section Farming Sustainability)

Abstract

:
Groundwater depth has a significant impact on salinization in irrigated areas. In this study, different groundwater depths were controlled via pit tests and we conducted pit tests with different groundwater depths (DGWs) to investigate the relationship between irrigation water volume and salt migration during the crop growth period, as well as the influence of DGW on maize growth and yield. The aim of this study was to determine an appropriate DGW for maize growth in the Hetao Irrigation District, the largest irrigation area of Asia, under the dual goals of water conservation and salt control. The results showed that the upward replenishment of groundwater was 179.60 mm, 139.17 mm, 119.98 mm, 68.62 mm, and 48.38 mm for each respective DGW, i.e., negatively correlated with DGW during the maize growth period. Soil electrical conductivity (EC) was exponentially related to DGW. For DGWs > 1.75 m, surface soil EC decreased significantly and soil EC exhibited less variation with DGW. Moreover, the desalination rate and depth after irrigation were improved at DGW values of 2.00 m and 2.25 m. Shallow DGW values resulted in increased evapotranspiration and intensified crop stress, which reduced water use efficiency. To reduce resource waste and salt stress on crops, we suggest that a DGW of 2.00~2.25 m is more suitable for maize growth and development. These results provide a reference for determining appropriate DGWs for maize growth in salinized irrigation areas.

1. Introduction

Water scarcity and salinization have been important issues of continuous concern in the world. As an important grain production base, the Hetao Irrigation District (HID), the largest irrigation area in Asia, faces major challenges, including soil salinization, drought, and agricultural non-point source pollution, which all restrict agricultural development in the district [1,2,3]. Moreover, restrictions on the use of the Yellow River for agricultural irrigation limit crop yields, with the HID water resource allocation reduced by more than 20% [4]. Furthermore, 63.8% of cultivated land in the district has salinized soil, a trend that is continually increasing, which severely restricts the economic sustainability of agriculture in the HID [5]. Groundwater is the main carrier of soil salt transport and migration, and its depth significantly affects soil moisture and salinity. Shallow groundwater can cause salt accumulation in crop root systems, thereby limiting plant growth and development [6,7,8]. However, owing to the large area of the HID, the groundwater depth exhibits an uneven spatial distribution, with distinct zoning and localized patches. The groundwater depth in the southern part of the district near the river is generally less than 2 m, whereas that in the northwest and northeast is relatively deep, reaching more than 10 m in some areas [9]. Therefore, in salinized irrigation districts, it is important to study the distribution of soil salinity and its impact on crop yield at different groundwater depths in order to prevent and control soil salinization and ensure sustainable development.
The HID is also one of the three largest irrigation districts in China, with an irrigation area of more than nine million acres. As a head-controlled irrigation district, timely irrigation is difficult. During the irrigation interval, groundwater is the main source of water for crop growth. Thus, a suitable groundwater depth is important for promoting crop growth and achieving the dual goals of water conservation and salt control in irrigation districts. Extensive research has been conducted on the relationship between groundwater depth and salt migration in salinized and drought-prone irrigation districts, with most research conducted on the irrigation district scale. For example, Xu et al. [10] determined the critical groundwater depths for moderately and mildly salinized topsoil at the end of April in the Jiefang Sluice irrigation district (2.00 m and 2.50 m, respectively). They found that the impact of groundwater depth on soil salt resistance was greater in March than at the end of April, indicating a lag effect [10]. In their regional-scale study, Wu et al. (2009) found that the salt in the HID was transported from cultivated land to wastelands through groundwater, with excess salt discharged from cultivated land through dry drainage [11]. Yuan et al. (2022) reported a strong spatial similarity between the zonal spatial distribution of groundwater and Haizi salt in the HID; when the groundwater depth was controlled between 1.70 m and 2.30 m [12], the Haizi salt storage function was most effective. However, shallow groundwater depths can exacerbate secondary soil salinization.
Therefore, identifying suitable groundwater depths is crucial for implementing water-saving plans in the HID. Wen et al. (2023) noted that evaporation and transpiration processes cause salt accumulation in the soil surface layer [13] that can lead to soil salinization. The shallower the groundwater level, the higher the degree of groundwater mineralization and the more severe the soil salinization in the root zone. To explore the relationship between groundwater depth and salinity, Ren et al. (2019) [14] found that groundwater depth is one of the dominant factors affecting soil salinization at the regional scale, with areas with shallower groundwater tables experiencing more severe soil salinization, which is particularly evident in low-lying topography. Field-scale studies have also been conducted in small areas. For example, Ao et al.’s (2024) study showed the enhanced SWAT-Salt model identified groundwater as the primary salt discharge source (98.7%) in the HID, emphasizing irrigation management’s significance in combating salinization [15]. Similar results were observed for a study in the HID [16], whereby a shallow groundwater depth of between 1.50 m and 2.50 m was conducive to crop growth. However, from the perspective of salinization control, the authors suggested controlling the groundwater depth to approximately 2.00–2.50 m. However, few studies have directly conducted multi-gradient quantitative analysis of groundwater depth through field-scale pit measurements [17].
Therefore, in this study, we perform pit experiments with different groundwater depths to investigate the relationship between irrigation water volume and salt migration (water and salt distribution) during crop growth in the HID, as well as the influence of groundwater depth on maize growth and yield. The aim of this study is to determine an appropriate groundwater depth for maize growth in the HID under the dual goals of water conservation and salt control.

2. Materials and Methods

2.1. Study Area

This study was conducted at the Shuguang Experimental Station in Bayannur City, HID, Inner Mongolia, China (40°46′ N, 107°24′ E, altitude 1039 m). The experimental station has good irrigation conditions and a temperate continental climate. The land is fertile with abundant sunlight, which makes it highly suitable for agricultural development. According to meteorological data from Linhe City, the average annual temperature at the Shuguang Experimental Station is 6.8 °C, with a frost-free period of 160 days, annual sunshine hours of 3189 h, relative humidity of 51%, and a wind speed of 2.7 m/s [16]. The groundwater depth at the experimental station during the maize growing season ranges from 2.20 m to 3.40 m. Groundwater with a mineralization of 1.1 g/L was used for irrigation in this study [18].
The experiment was conducted under the current agricultural production conditions in the HID, using standard measuring pits (equipped with underground observation rooms), two sets of large-scale weighing-type automatic evaporation meters, and large rain shelters. Indoor and pit tests were conducted, with five measuring pits plus bottom plates, all equipped with Mariotte bottles that could accurately control the depth of groundwater (DGW), measure the upward replenishment of groundwater (G_up), and measure the amount of groundwater replenished by irrigation (G_irr). The representative soil of the HID was used to backfill the pits and water was added for compaction. The soil in the experimental area was Yellow River irrigation silt classified as chestnut calcium soil. The particle size distribution was classified as loamy sand according to the United States Soil Texture Classification (dry method granulometer, HELOS&RODOS, Germany’s new Partec company, Clausthal-Zellerfeld, Germany), with an average soil bulk density of 1.51 g/cm3 and a pH value of approximately 8.0 at a depth of 0–120 cm. The study site is strongly representative of a typical salinization area within an irrigation district. Table 1 lists the soil textures in the experimental area.

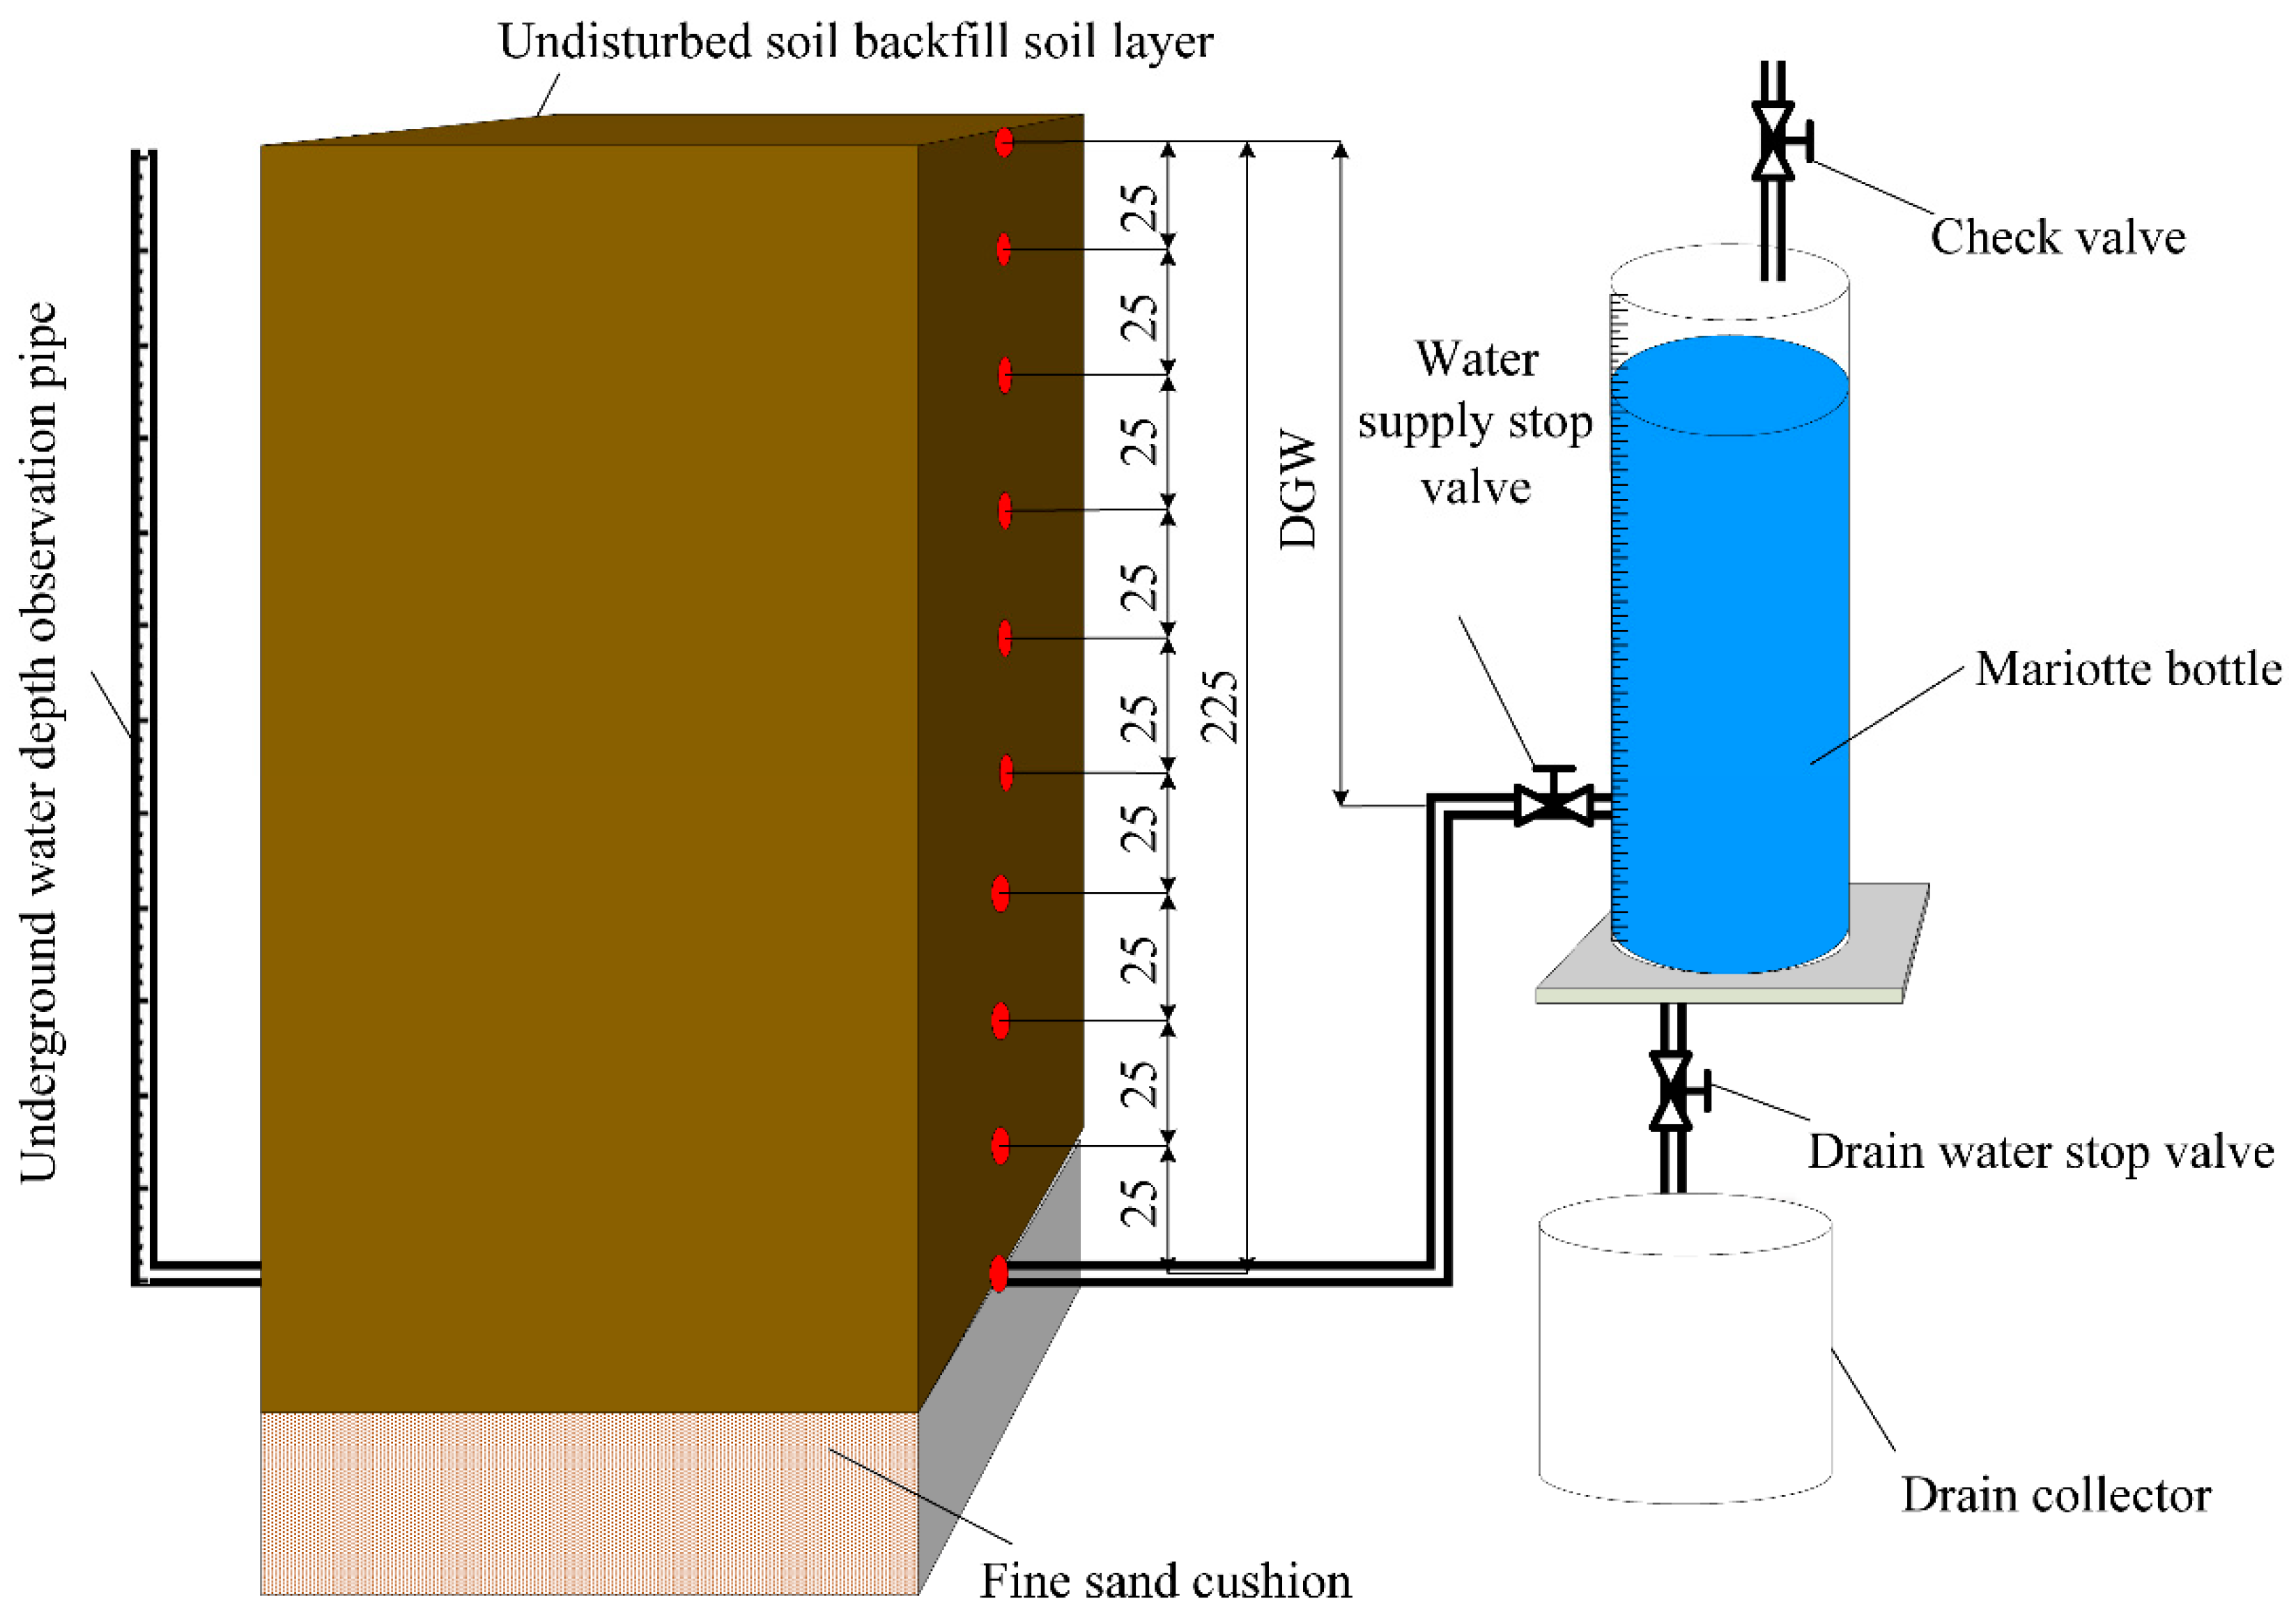
2.2. Experimental Methods

The local maize variety Ximon No. 6 (Inner Mongolia Ximon Seed Industry Co., Ltd. Bayannur, China) was selected for this study [18], with five different DGW values of 1.25 m, 1.50 m, 1.75 m, 2.00 m, and 2.25 m. Mariotte bottles were filled with water before sowing, which was carried out after the DGW was replenished to the set value. Sowing was conducted on 6 May 2020, and harvested occurred on 29 September 2020 (147 days after sowing). Manual sowing was performed using a handheld seeder according to the local sowing depth. All experimental plots were covered with an ordinary plastic film, and a base fertilizer (diammonium phosphate and urea in a ratio of 5:1) was applied before sowing. Two top dressings were applied during the growing period using urea at an application rate of 450 kg/hm2. The plot area was 6.6 m2, with a planting density of 75,800 plants/hm2. Irrigation was conducted according to the Yellow River water arrival date and the local irrigation method (ridge irrigation). In this study, a single irrigation quota was set, with a total of four irrigations during the maize growing period, divided into the maize seedling, jointing, tasseling, and ear-filling stages. Table 2 shows the irrigation and fertilization management of the experimental area (irrigation quota unit: mm). The irrigation volume was accurately controlled using a water meter with a precision of 0.0001 m3. Figure 1 shows the design of the experimental plots with the DGW controlled by Mariotte bottles.

2.3. Measurement Items and Methods

Meteorological data were collected from a HOBO automatic weather station installed near the experimental plot for real-time monitoring; these included temperature (°C), average relative humidity (%), precipitation (mm), wind speed (m/s), and other data. To monitor soil moisture content and salinity, each treatment plot was equipped with a water and salt automatic monitoring device (model: Fleb-30c, moisture content accuracy: ±4%) produced by Shenyang Weitu Technology Corporation. G_up and G_irr were measured daily at 08:00 and 20:00 Beijing time, respectively, by recording the scale readings of Mariotte bottles and the drainage volume in the drainage collector below the drainage outlet in the underground observation room.
Maize growth indicators and yield maize biomass were monitored at different growth stages. Maize plant height, leaf area index, and stem thickness were measured using a box ruler and Vernier caliper. At maize maturity, the yield of all maize was measured in each treatment plot, then the maize was placed in an oven at 105 °C for 30 min to kill the green maize. The temperature was adjusted to 65 °C and the crop was dried to a constant mass for maize seed testing and yield measurement.
S = 0.75 a b
Here, S is the leaf area (m2), a is the leaf length (m), and b is the leaf width (m).
The soil water storage was calculated as follows:
SWS = 10 i = 1 7 h i θ i
where SWS is the soil water storage (mm); hi is the depth of each calculated soil layer; and θi is the soil volumetric water content (cm−3 cm−3) in the sampled soil layers of 0–10, 10–20, 20–40, 40–60, 60–80, 80–100, and 100–120 cm, giving a total of seven layers.
To determine crop evapotranspiration, the change in soil water storage was calculated from the difference in soil water storage before sowing and after the autumn harvest. The irrigation volume was controlled via a water meter; during the growing period, a rain shelter was provided, enabling precipitation to be ignored. Moreover, no surface runoff was generated during irrigation in the growing period.
ET = SWC + P + I + G R 0 D
Here, ET is the crop evapotranspiration (mm), SWC is the change in soil water storage (mm), I is the irrigation volume during the growing period (mm), G is the groundwater recharge during the growing period (mm), R0 is the surface runoff (mm), D is deep percolation during the growing period (mm), and P is the precipitation.
The total soil salt content and leaching desalination rate was calculated as follows [19]:
S t = 3.7657 × EC 1 : 5 0.2405
where St is the total soil salt content (g/kg) and EC1:5 is the soil electrical conductivity (dS/m) [20,21].
S a i = S t i × D i × L i × A
Here, Sai is the soil salt storage (kg) in the volume of each soil layer from the surface to 120 cm, Sti is the total soil salt content (g/kg), Di is the soil bulk density (g/cm3) of each soil layer from the surface to 120 cm, Li is the soil layer depth (m), and A is the treatment area (m2) [22,23].
N i = S a i 1 S a i 2 S a i 1 × 100 %
Here, Ni is the soil leaching desalination rate (%) of each soil layer from the surface to 120 cm, where positive values indicate desalination and negative values indicate salt accumulation, Sai1 is the soil salt storage (kg) in the volume of each soil layer from the surface to 120 cm before irrigation, and Sai2 is the soil salt storage (kg) in the volume of each soil layer from the surface to 120 cm after irrigation [24].
The water use efficiency (WUE) was calculated as follows:
WUE = Y ET
where WUE is the water use efficiency (kg/m3), Y is the yield (kg/hm2), and ET is the crop evapotranspiration (mm).

2.4. Data Analysis

The experimental data were processed using Excel 2019 and fitted using a linear regression equation. One-way ANOVA was performed using SPSS software (version 21.0) for single-factor analysis and multiple comparison analysis, and the statistical significance was set to p < 0.05. Visio 2019, Origin Pro 2018, and Surfer12 were used for graphing.

3. Results

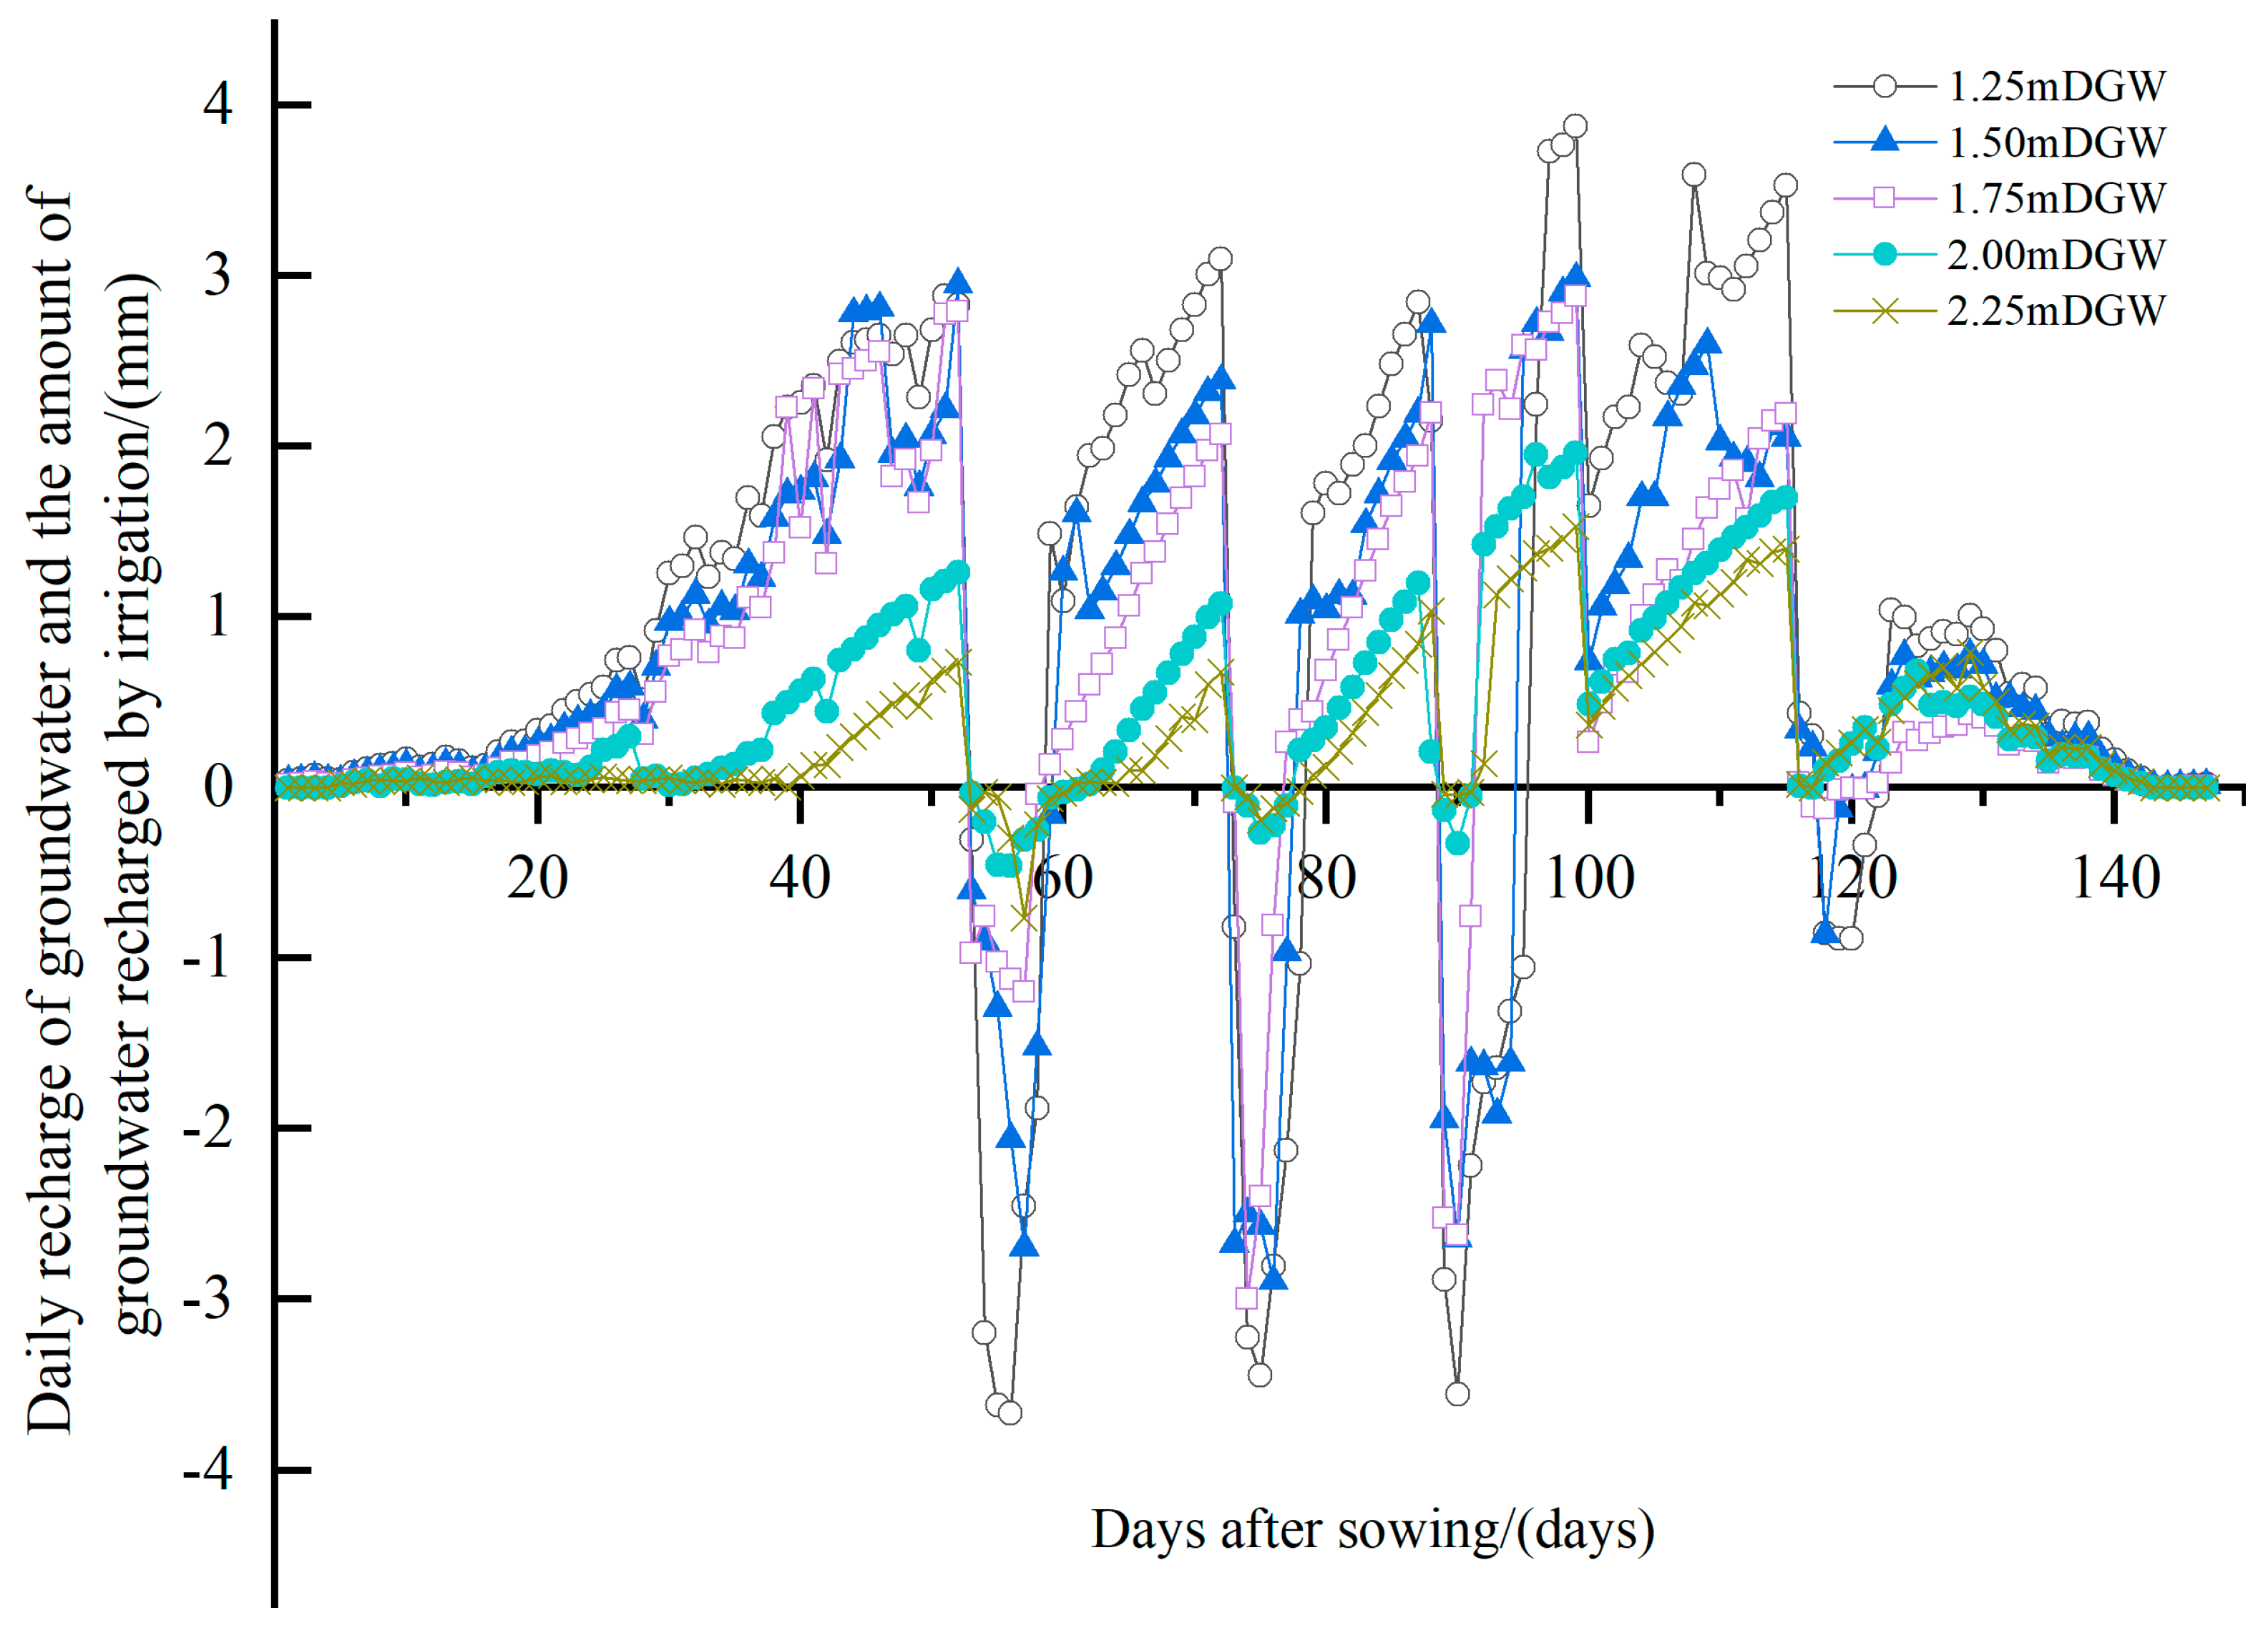
3.1. Influence of DGW on G_up and G_irr in Summer Maize Fields

During the maize growth period, groundwater replenishment was primarily used for evapotranspiration. As the depth of the groundwater increases, the amounts of daily and total upward groundwater recharge decrease. Figure 2 shows the daily G_up and G_irr values according to DGW. As shown in Figure 2, G_up gradually increased from the seedling stage to the filling stage for all DGW values, reaching a maximum during the maize filling stage and then decreasing in the later stage of growth. This occurred due to the low atmospheric temperature and low crop transpiration in the early stage of growth. As the growth period progresses, the atmospheric temperature increases and maize water consumption increases, leading to an increase in evapotranspiration; in the later stage of maize growth, rainfall increases, atmospheric temperature decreases, humidity increases, and the maize gradually matures, consuming less water. As such, G_up values decreased in the later stage of growth under each DGW treatment.
As the groundwater depth increased, both G_up and total G_up decreased, with there being a statistically significant relationship between G_up and DGW. During the growth period of maize, the total G_up values for the five DGW treatments (1.25 m, 1.50 m, 1.75 m, 2.00 m, and 2.25 m) were 179.60 mm, 139.17 mm, 119.98 mm, 68.62 mm, and 48.38 mm, respectively, indicating a negative correlation with DGW. The total G_up at a DGW of 1.25 m was 29.1% higher than that at 1.50 m, G_up at 1.25 m was also higher than that at 1.50 m, and total G_up at 1.50 m was 15.9% higher than that at 1.75 m. However, total G_up at 2.00 m was significantly lower than that at 1.25 m, 1.50 m, and 1.75 m (61.8%, 50.6%, and 42.8% lower, respectively). The total G_up at 2.25 m was significantly reduced by approximately 29.5% from that at 2.00 m. G_up at 2.25 m was smaller during the maize seedling stage, ranging from zero to 0.73 mm.
Owing to the significant influence of atmospheric temperature and humidity on evapotranspiration, we also observed an indirect effect on G_up. Linear analysis confirmed that total G_up was negatively correlated with DGW during the growth period, with a determination coefficient R2 of 0.920–0.993, indicating a good linear relationship. The irrigation area is characterized by water scarcity, high evaporation intensity, and severe secondary salinization of soil, whereas the DGW2.00 m and DGW2.25 m treatments can better utilize groundwater and reduce the increase in soil salinity caused by interplant evaporation.
During the growth period of maize, the total G_irr for DGW values of 1.25–2.25 m was 45.97 mm, 33.25 mm, 17.59 mm, 3.00 mm, and 2.17 mm, respectively. Under the same irrigation quota at different DGWs, G_irr decreased as DGW increased; however, the difference between DGW2.00 m and DGW2.25 m was not significant. Because the soil moisture content at shallow depths is higher near the groundwater depth, irrigation caused an increase in G_irr, which was also negatively correlated with groundwater depth. The linear relationship between G_irr and DGW during the growth period was G_irr = −33.288 DGW + 211 (R2 = 0.9814). As shown in Figure 2, four irrigations were performed during the growth period, and the G_irr after each irrigation was higher in the DGW1.25 m treatment than in the other four treatments, with irrigation WUE values of 72.0%, 81.3%, 80.0%, and 94.4% for the four irrigations. The total irrigation WUE increased in the following order: DGW1.25 m < DGW1.50 m < DGW1.75 m < DGW2.00 m < DGW2.25 m. When the DGW was greater than 1.75 m, the D of each treatment decreased significantly and the irrigation WUE increased, with no significant difference between DGW2.00 m and DGW2.25 m. In summary, to reduce deep percolation and increase the utilization efficiency of irrigation water, DGW2.00 m and DGW2.25 m are superior treatments.

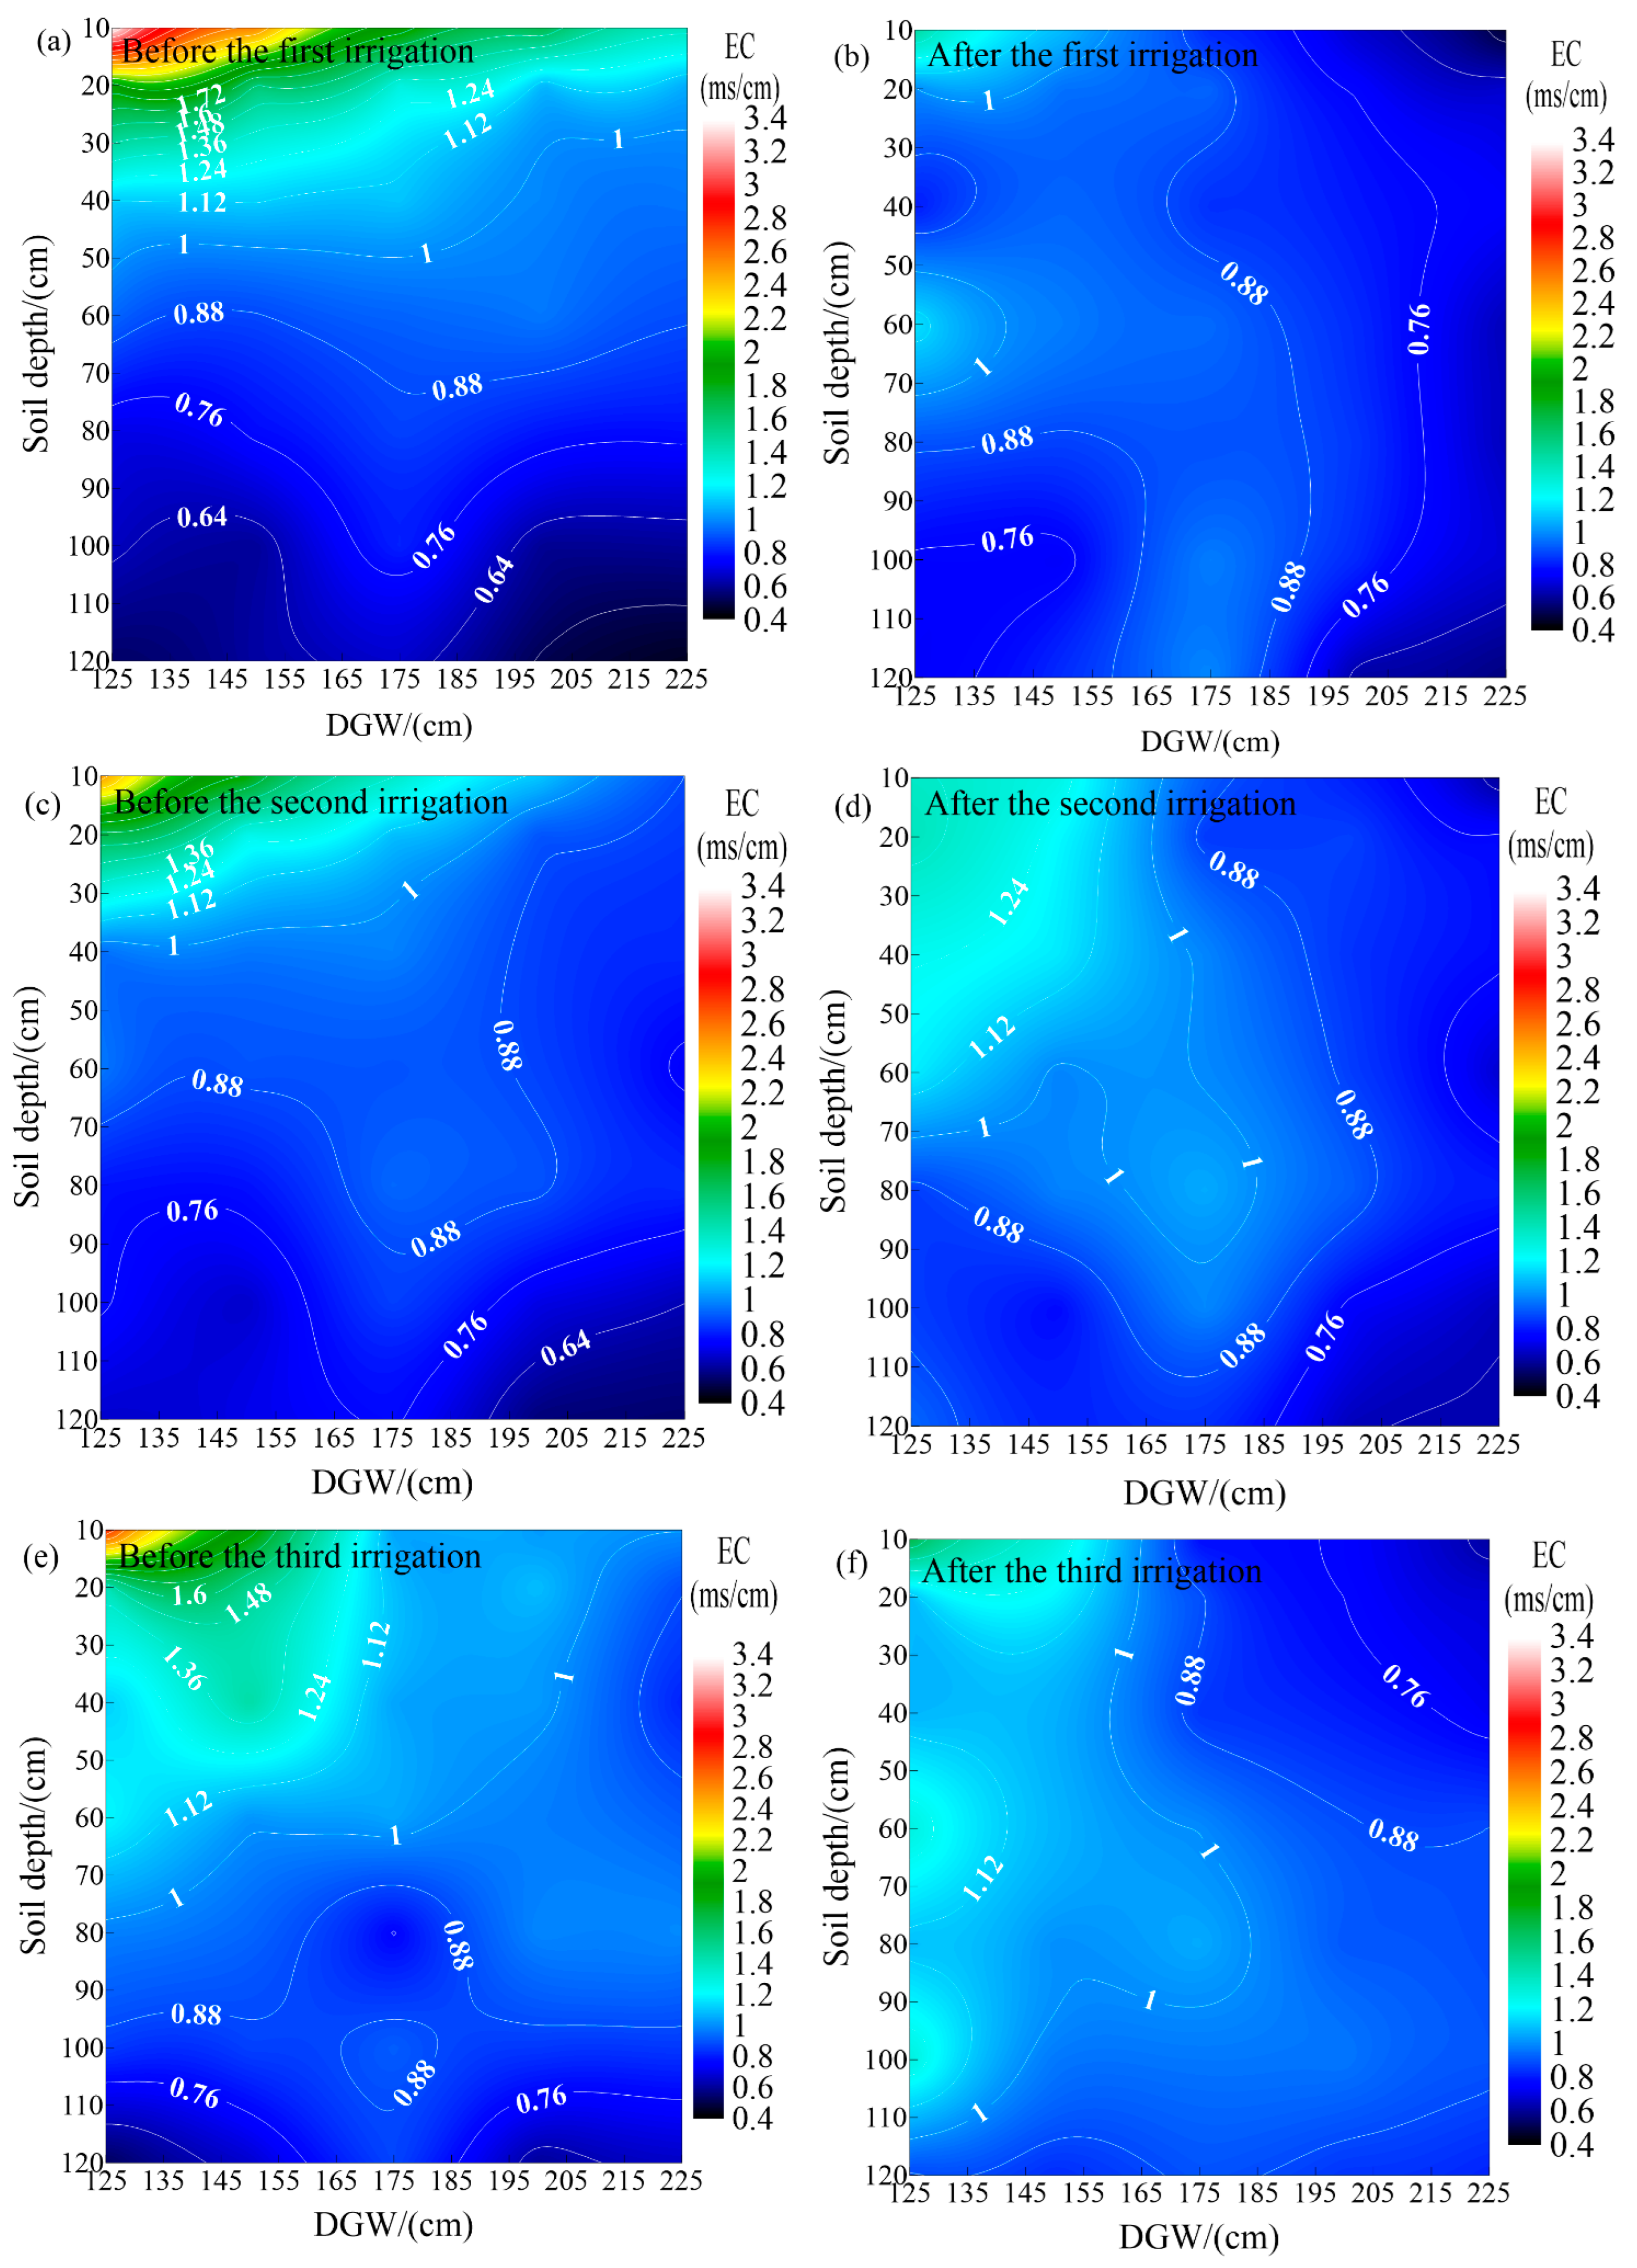
3.2. Effect of Irrigation on Soil Electrical Conductivity Under Different DGWs

3.2.1. Effect of Irrigation on Soil Electrical Conductivity

Soil electrical conductivity (EC) directly reflects the salt content. Therefore, the relationship between salt content and DGW can be analyzed by determining the EC values of different soil layers. Shallow DGW values can lead to the interaction of soil water and groundwater salts, which can easily cause secondary soil salinization [25]. Excessive groundwater recharge can also affect crop growth; however, rainfall and irrigation processes can redistribute salt in the soil profile [26]. In our experiment, rain shelters were used during the crop growth period; therefore, the effect of rainfall on the salt content of the soil profile was ignored. Figure 3 shows soil EC values before and after irrigation. Clearly, irrigation and DGW had a significant impact on the redistribution of soil salt content. The EC of the surface soil before irrigation was negatively correlated with a shallow DGW, and the salt content of surface soil was higher than that of deep soil at the same DGW. As shown in Figure 3a,c,e, irrigation during the growth period reduced the salt content of surface soil, with a higher soil EC before the first irrigation than before the second and third irrigations. Because water is the only solvent in the soil, strong soil evaporation occurs in spring and soil salt accumulates on the surface upon evaporation of the solvent. Thus, the shallower the DGW, the greater the recharge and evaporation and the more intense the exchange of soil water and groundwater salt content, resulting in a significantly higher salt content in surface soil than in deep soil. Moreover, the high atmospheric temperature and strong soil evaporation in August led to a higher soil EC before the third irrigation than before the second irrigation, which was attributed to the salt leaching effect of irrigation during the growth period.
As shown in Figure 3b,d,f, the EC values of surface soil one day after irrigation were significantly reduced, with the most significant reduction occurring in the 0–20 cm layer. With salt leaching by irrigation water, more salts are transported to deeper soil layers. The EC values of the main root layer (40–80 cm) of maize in the DGW2.00 m and DGW2.25 m treatments were less than 1 dS/m, which is beneficial for crop growth and development. When groundwater is shallow, soil water easily exchanges with the groundwater. As the soil water evaporates, groundwater replenishes the soil through capillary action and salt in the groundwater easily interacts with that in the soil, thereby increasing the salt content of the surface soil. Therefore, the extent of soil EC reduction was similar after each irrigation treatment. The coefficients of variation for the decrease in surface soil EC values after irrigation were 19.0% and 39.8% for DGW1.25 m and DGW2.25 m, respectively, both indicating moderate variability. After the soil salt content of the DGW1.25 m, DGW1.50 m, and DGW1.75 m treatments was leached by irrigation, the salt content in the main root layer increased significantly, causing severe salt stress on the crops. Fifteen days after the first irrigation (before the second irrigation), the soil EC in the 0–20 cm layer of the DGW1.25 m, DGW1.50 m, and DGW1.75 m treatments increased by 15.3–41.3% from that one day after irrigation, indicating a significant salt rebound. Throughout the growth period, the DGW1.25 m and DGW1.50 m treatments showed significant soil whitening and severe salinization of the surface soil before irrigation and before harvest. This phenomenon was not observed in DGW1.75 m; however, compared to DGW2.00 nm and DGW2.25 m, the maize seedlings in this treatment took longer to emerge, the plants were shorter, and the maize ears were smaller, indicating poorer growth. Therefore, the recommended DGW for crop growth and development is between 2.00 m and 2.25 m.

3.2.2. Effect of Irrigation on the Leaching Effect of Soil Salinity at Different DGWs

The leaching desalination rate reflects the effect of irrigation on salinity [27]. Here, we examined the leaching effect on salinity one day after the first irrigation during the growth period, 15 days after irrigation, and throughout the entire growth period. After stratified calculations, the leaching desalination rates for irrigation at different groundwater depths were obtained, as shown in Table 3. The leaching desalination rates at various DGWs decreased with increasing soil depth and gradually changed from a state of desalination to one of salinization. As shown in Figure 3a, the initial salt content in the surface soils of the DGW1.25 m, DGW1.50 m, and DGW1.75 m treatments was relatively large, with conductivity values of 3.41, 2.55, and 1.90 dS/m, respectively. For the same irrigation quota, when the solution concentration reaches saturation at DGW1.75 m, the excess solute cannot be dissolved or transported with the irrigation water because a constant amount of solute can be dissolved in the same solvent, resulting in the salt remaining in the soil. This led to a lower soil salt leaching rate for DGW1.25 m, DGW1.50 m, and DGW1.75 m than for the other treatments one day after irrigation. The leaching desalination amounts of the 0–10 cm surfaces of the DGW1.50 m and DGW1.75 m treatments were 9.02 kg and 6.67 kg, respectively. Because of the higher utilization rate of leaching water with a high soil moisture content [22,28] and the lower transpiration of corn during the seedling stage, water consumption is predominantly from soil evaporation. Groundwater recharge and soil moisture content were greater in areas with shallower DGWs. Therefore, the DGW1.25 m, DGW1.50 m, and DGW1.75 m treatments exhibited greater surface desalination. Because of the high soil salt content and smaller drainage rate at shallower DGWs [29], the DGW1.25 m, DGW1.50 m, and DGW1.75 m treatments began to accumulate salt in the main crop root zone below 40 cm, whereas the other treatments exhibited deepening of the desalination layer as the DGW increased, which reduced salt stress in the crop root zone.
Fifteen days after irrigation, all treatments began to accumulate salt in the 0–10 cm surface of soil. The EC of DGW1.25 m, DGW1.50 m, and DGW1.75 m increased by 1.03, 0.75, and 0.55 dS/m, respectively. Therefore, the amount of accumulated salt was negatively correlated with DGW. However, desalination occurred at 40–80 cm for DGW1.25 m, DGW1.50 m, and DGW1.75 m, possibly because of the upward migration of salt and a certain lag effect of irrigation on salt leaching at shallow DGWs. Compared to that before irrigation, the salt content increased again 15 days after irrigation and accumulated in the surface layer because of crop root water absorption and soil evaporation, which was mainly reflected in a decreased surface soil desalination rate as the DGW decreased; the desalination rate of the 10–40 cm soil layer decreased significantly and the salinization rate of the salinization layer decreased in all treatments. The 15-day post-irrigation salinization rate of DGW2.00 m and DGW2.25 m was lower than that of DGW1.25 m, DGW1.50 m, and DGW1.75 m. Owing to the stronger capillary replenishment effect of shallow DGW than deep DGW, salt is more likely to accumulate in the surface layer. Compared to that before sowing, the salinization rate after harvest was generally positively correlated with DGW; the rates within the 100 cm soil layer for DGW1.25 m, DGW1.50 m, and DGW1.75 m were 40.9%, 26.0%, and 11.1% higher than those for DGW2.00 m, respectively. We observed no significant differences in the salinization rates of DGW2.00 m and DGW2.25 m. In summary, the optimal DGWs for saving water and suitable crop growth are DGW2.00 m and DGW2.25 m.

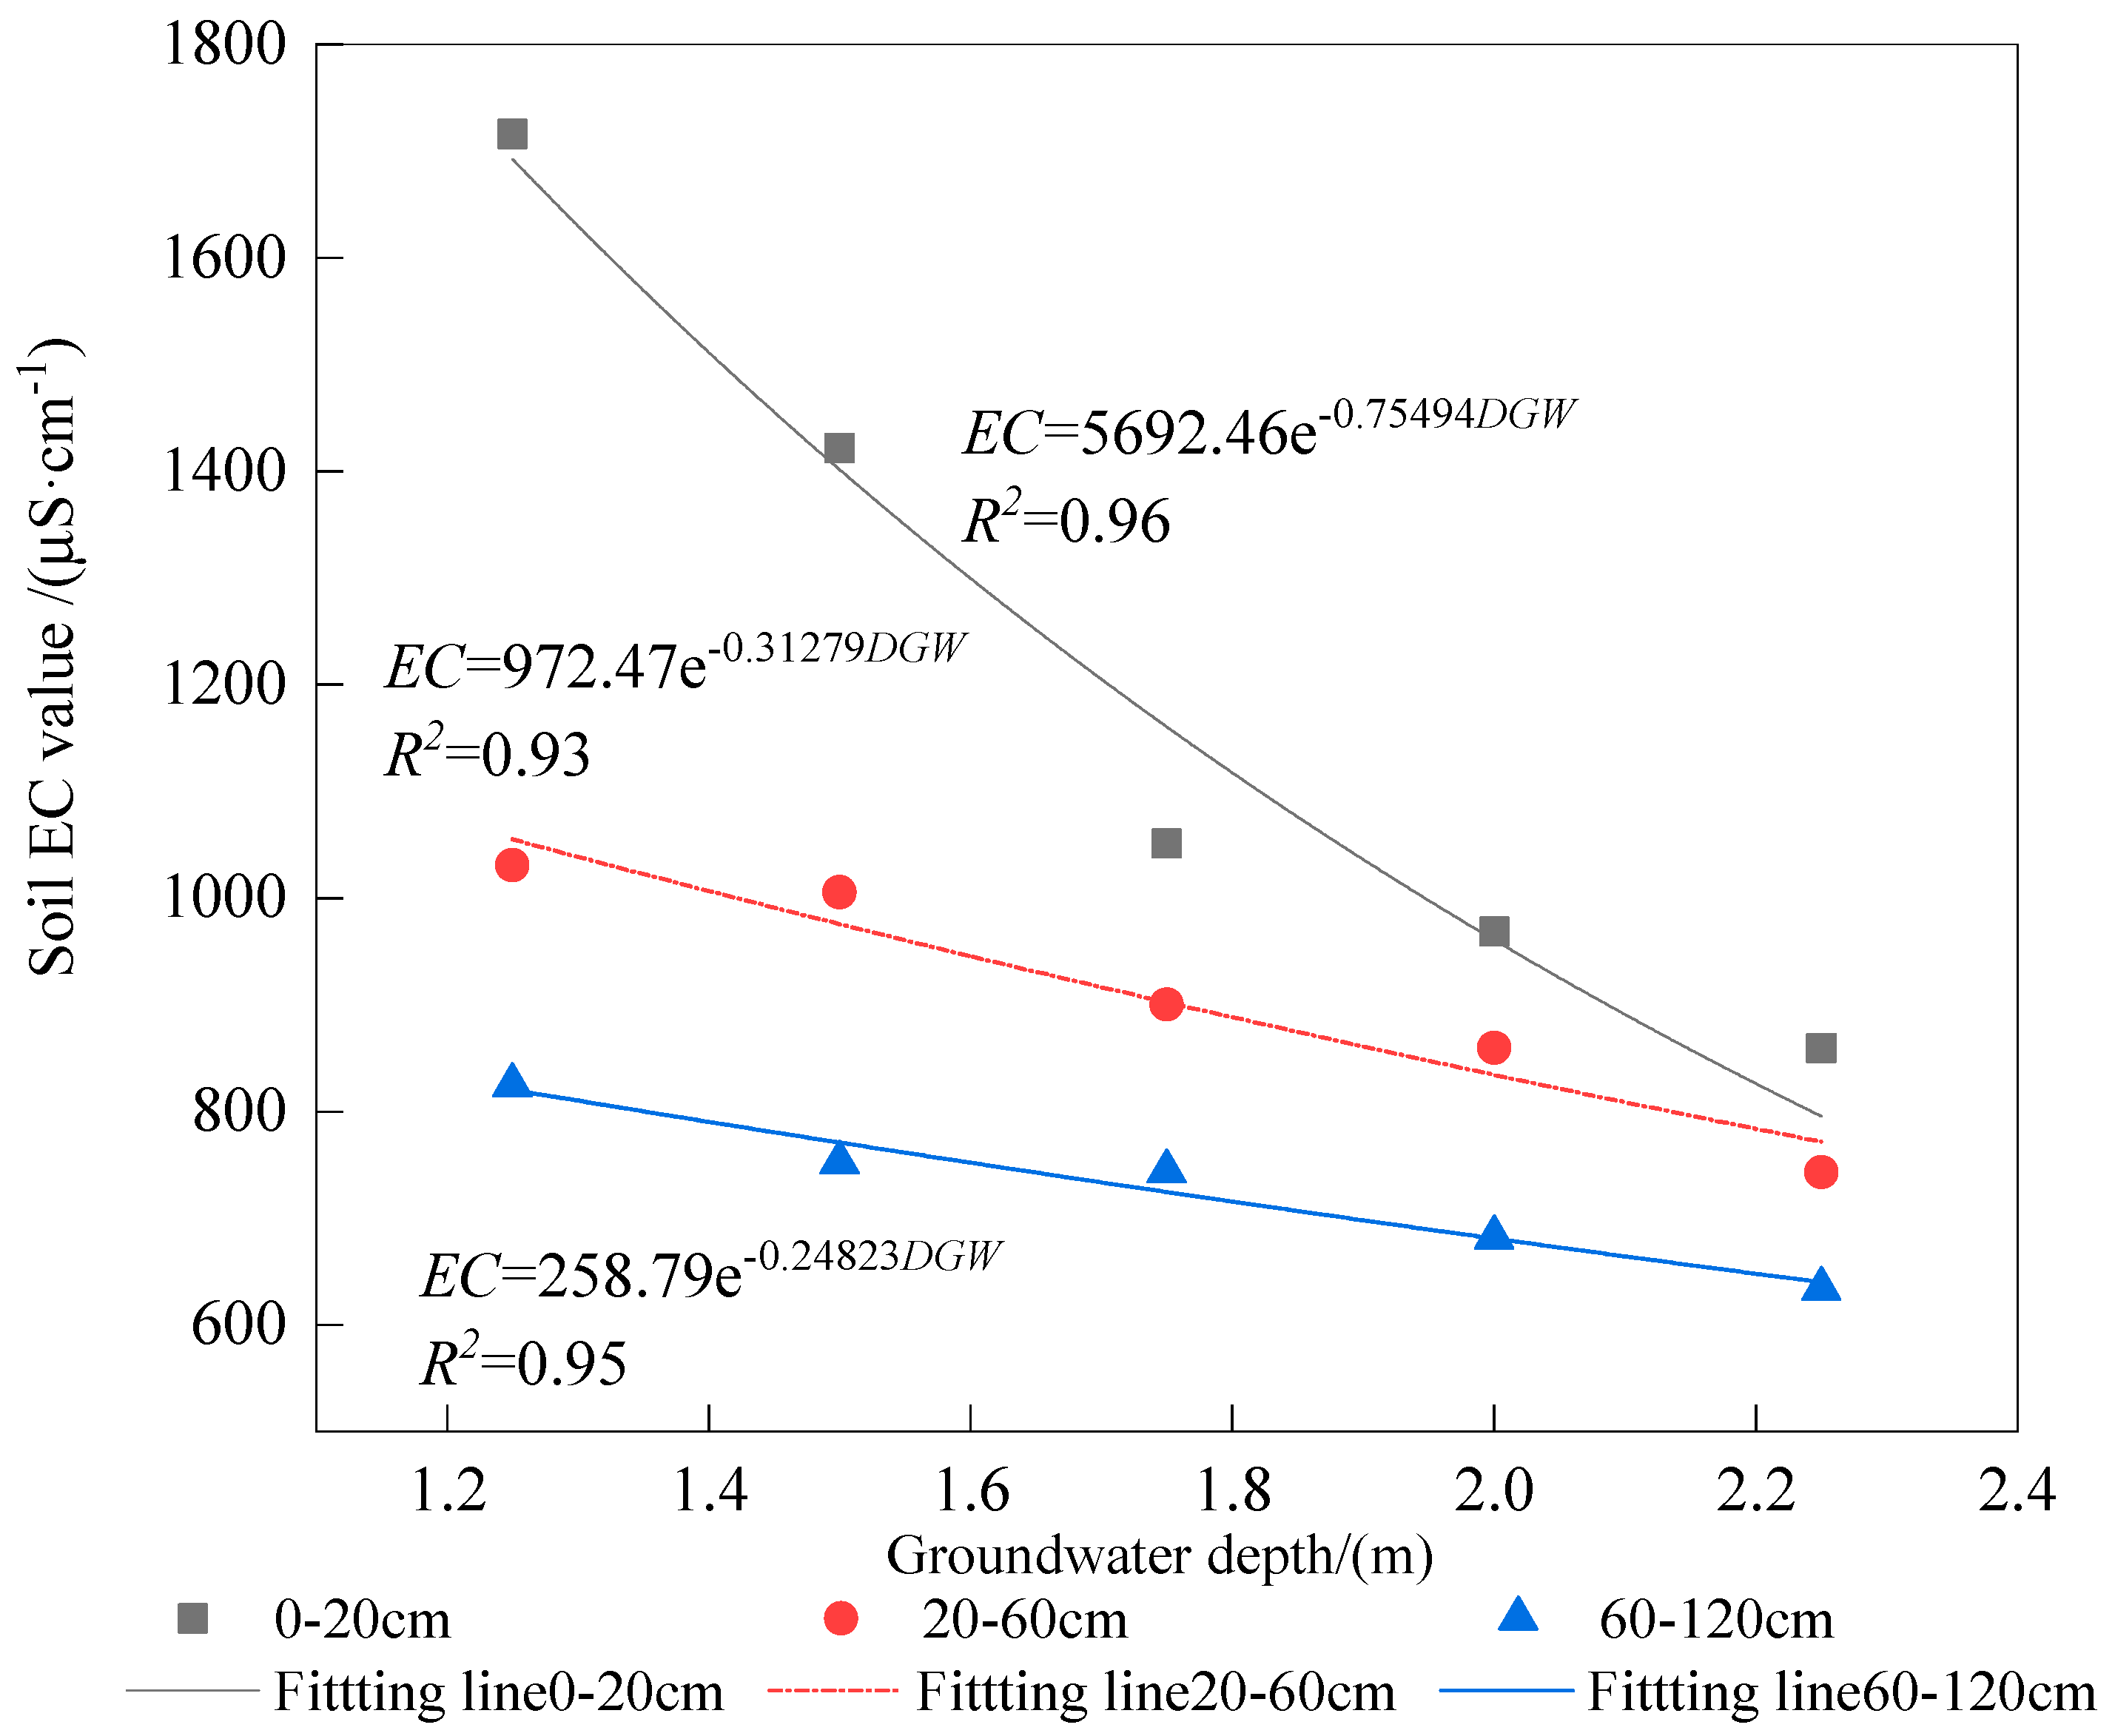
3.3. Effect of DGW on Soil EC

The HID is characterized by an arid climate with little rainfall and high evaporation intensity during the crop growth period. When the groundwater depth is shallow, salt easily accumulates on the soil surface through capillary tension with water movement, thereby exacerbating soil salinization. Therefore, the DGW can have a significant effect on soil salinity. After taking the average of multiple soil EC values for each treatment and soil layers during the growth period, a fitted relationship graph was established between soil EC (μS·cm−1) and DGW, as shown in Figure 4. The R2 value was greater than 0.9 and greater under the fitted index than that of the linear fit, indicating a better index relationship. As shown in the graph, soil salinity in the 0–20 cm surface layer was significantly affected by the DGW. As the soil layer depth increased, the soil EC values at depths of 20–60 cm and 60–120 cm were less affected by the DGW. For DGWs > 1.75 m, the soil EC values in the surface layer decreased significantly, and the magnitude of changes in soil EC values with DGW also decreased. In summary, a DGW of 2.00–2.25 m is preferable for crop growth in saline–alkali irrigation areas.

3.4. Effect of DGW on Maize Yield and WUE

The effect of irrigation on salt leaching can be characterized using indicators such as the maize yield. The yield indices and WUE of each treatment were analyzed for significant differences. Table 4 shows the impact of DGW on maize yield indices and WUE. As shown in Table 4, for the same irrigation quota, the yield increased with an increase in DGW, showing a positive correlation. In the DGW1.25 m treatment, maize growth was affected by salt stress during the growing period. After harvesting, the maize plants in this treatment were small and stunted, with small shriveled mature maize kernels. The hundred-grain weight, dry matter, and yield were 14.2%, 31.5%, and 22.4% lower than those in the DGW2.25 m treatment, respectively (p < 0.05). However, we observed no significant differences in yield components or WUE between DGW1.25 m and DGW1.50 m (p > 0.05). The number of grains per ear and the hundred-grain weight determine the maize yield. According to the differences in these two indicators in response to various treatments, yield was significantly different between DGW1.75 m and DGW2.25 m but not between DGW2.00 m and DGW2.25 m. According to our analysis of maize growth during the growing period, plant height was similar for DGW2.00 m and DGW2.25 m and higher than that for DGW1.25 m, DGW1.50 m, and DGW1.75 m. According to WUE analysis, if the DGW was too shallow, groundwater recharge and soil evaporation increased and the salt content in the soil increased with increasing capillary action, which increased evapotranspiration and intensified the saline–alkali soil stress on the crops. In contrast, as the DGW increased, WUE decreased. WUE did not differ significantly between DGW2.00 m and DGW2.25 m (p > 0.05). In summary, to reduce resource waste and salt stress on crops, we recommend an optimal DGW for maize growth and development in the HID of 2.00–2.25 m.

4. Discussion

The pronounced evaporative conditions prevalent during summer months in the HID region induce a dynamic interaction between groundwater and soil water systems. This hydrological interplay facilitates the vertical migration of soluble salts, thereby exacerbating soil salinization—a critical constraint on agricultural productivity. Existing studies corroborate that both the depth to groundwater (DGW) and elevated mineralization levels constitute the primary drivers of salt accumulation in surface soils [30,31]. Empirical observations from this investigation further demonstrate that shallow groundwater tables amplify soil evaporation rates, subsequently elevating crop transpiration demands. These findings align with earlier research outcomes [32], reinforcing the mechanistic link between DGW dynamics and soil moisture redistribution.
The hydrological patterns governing groundwater recharge and deep percolation identified in this study exhibit consistency with prior regional investigations [33,34]. A statistically significant inverse relationship emerges between groundwater recharge capacity and DGW magnitude. Notably, under equivalent DGW conditions, recharge rates demonstrate sensitivity to atmospheric temperature fluctuations, with enhanced recharge occurring during peak crop growth phases (July–August), characterized by elevated thermal regimes. Parallel analyses reveal that deep percolation losses exhibit negative correlation with DGW at constant irrigation volumes. Such hydrological interdependencies suggest that optimized DGW management could achieve dual objectives: maximizing groundwater utilization efficiency while minimizing irrigation-induced percolation losses. Furthermore, regulated groundwater levels may enhance root-zone water availability, creating favorable edaphic conditions for crop development. These processes are modulated by a complex interplay of factors including DGW variations, crop phenological stages, and atmospheric parameters (temperature and humidity).
Irrigation practices exert significant influence on soil salinity redistribution through solute transport mechanisms. Comparative analysis of pre- and post-irrigation salt contents reveals that excessively shallow groundwater tables promote substantial salt accumulation in the root zone, imposing physiological stress on crops. Controlled irrigation events effectively remove salts from shallow groundwater systems, reducing salinity stress and enhancing irrigation productivity, which aligns with the established scientific consensus [35]. However, suboptimal DGW management necessitates excessive irrigation volumes to counteract the effects of salinity, resulting in unsustainable water resource utilization. Under fixed irrigation regimes, crop yields become compromised by growth-stage stress responses, concomitant with reduced water use efficiency (WUE). Additionally, shallow groundwater conditions may induce hypoxic stress in rhizosphere environments, further depressing crop productivity [31]. These findings collectively underscore that strategic DGW regulation represents a critical intervention for optimizing both yield outputs and WUE.
Experimental data indicate superior crop performance metrics (height, leaf area index, yield) when the DGW is 2.00–2.25 m, with concurrent reductions in topsoil salinity levels. This optimal range aligns with the findings reported by Ramos et al. [17], suggesting universal applicability across similar agroecological contexts. Previous investigations establish threshold values for crop tolerance, indicating minimal yield impacts for maize, wheat, and sunflower when DGW exceeds 1.50 m, coupled with soil electrical conductivity (EC) below 0.8 dS/m [35]. Wang et al. [19] further substantiate these thresholds, reporting negligible crop effects at DGW 1.75 m with equivalent EC levels. The observed inverse relationship between DGW depth and WUE in this study corroborates these established patterns.
Statistical analysis of the experimental treatments reveals non-significant differences (p > 0.05) in yield and WUE between the DGW1.75 m and DGW2.00 m regimes, whereas DGW2.25 m demonstrates significantly enhanced yield indices compared to DGW1.75 m (p < 0.05). Groundwater irrigation in this study used water with a percolation level of 1.1 g/L, significantly higher than the 0.58 g/L typically found in Yellow River irrigation systems, which are known to contribute to soil salt accumulation [36]. Consequently, under elevated mineralization conditions, maintaining DGW within 2.00–2.25 m emerges as a strategic compromise to balance water conservation objectives with salinity control measures for maize cultivation in the HID region. This recommendation remains consistent with prior scientific evaluations [35], validating its applicability within the study’s operational constraints.

5. Conclusions

During the corn growth period, both the upward and irrigation recharge of groundwater were negatively correlated with groundwater depth. For the same irrigation quota, the groundwater recharge and deep percolation of treatments with groundwater depths of 1.25 m, 1.50 m, and 1.75 m were greater than those of other treatments, and the irrigation water use efficiency was lower than that for groundwater depths of 2.00 m and 2.25 m.
Irrigation can effectively wash away salts from the soil, and the salt content of the surface soil changed significantly during the growth period. After irrigation, a shallow groundwater depth can lead to most of the salts washing into the crop root zone; thus, crops were more significantly affected by salt stress at groundwater depths of <1.75 m. One day after irrigation, the desalination rate and depth were better at groundwater depths of 2.00 m and 2.25 m, whereas 15 days after irrigation, soil layers showed a more significant salt rebound at groundwater depths of 1.25 m, 1.50 m, and 1.75 m.
The soil EC value is exponentially related to the groundwater depth. When the degree of groundwater mineralization was 1.1 g/L and the groundwater depth was greater than 1.75 m, the surface soil EC value decreased significantly and the amount of soil EC variation with groundwater depth decreased. Compared to before sowing, soil layer EC during the corn growth period increased less at groundwater depths of 2.00 m and 2.25 m.
When the depth of groundwater is too shallow, the amount of water transported to the crop root zone soil through capillary action increases, leading to higher crop transpiration water consumption and increased agricultural evaporation rates. Thus, the shallower the groundwater depth, the smaller the WUE. However, we observed no significant difference in WUE between groundwater depths of 2.00 m and 2.25 m. Therefore, to reduce resource waste and salt stress on crops, we recommend an optimal groundwater depth of 2.00–2.25 m for corn growth and development in the HID.

Author Contributions

L.D.: Writing—Original Draft; Q.M.: Formal analysis and Investigation; H.S.: Conceptualization, Methodology, Validation, Supervision and Project administration; Z.F.: Experimental operation, data analysis, and drawing; Y.L. (Yuxin Li) and Y.L.(Yong Liu): Review and Editing; Y.X. and R.X.: Data analysis; W.F.: Review and Editing, Supervision, and funding. All authors have read and agreed to the published version of the manuscript.

Funding

This research was jointly supported by the National Natural Science Foundation of China (U2443210), State Key Program of the National Natural Science Foundation of China (2021YFD1900602-06), Science and Technology Major Projects of Inner Mongolia (zdzx2018059), National Natural Science Foundation of China (52269014, 52009056), Key Special Project of the “Revitalizing Inner Mongolia through science and technology” Initiative (2022EEDSKJXM004), and Science and Technology Plan Project of the Inner Mongolia Autonomous Region (2022YFHH0044).

Data Availability Statement

The data are contained within the manuscript.

Conflicts of Interest

The authors declare that they have no competing financial interests or personal relationships that may have influenced the work reported in this study.

References

  1. Cui, X.; Han, W.; Zhang, H.; Cui, J.; Ma, W.; Zhang, L.; Li, G. Estimating soil salinity under sunflower cover in the Hetao Irrigation District based on unmanned aerial vehicle remote sensing. Land Degrad. Dev. 2023, 34, 84–97. [Google Scholar] [CrossRef]
  2. Sun, S.; Wu, P.; Wang, Y.; Zhao, X.; Liu, J.; Zhang, X. The impacts of interannual climate variability and agricultural inputs on water footprint of crop production in an irrigation district of China. Sci. Total Environ. 2013, 444, 498–507. [Google Scholar] [CrossRef]
  3. Ding, Z.; Wang, Y.; Ding, J.; Ren, Z.; Liao, J. Dynamics of carbon and water vapor fluxes in three typical ecosystems of Heihe River Basin, Northwestern China. Sci. Total Environ. 2024, 929, 172611. [Google Scholar] [CrossRef] [PubMed]
  4. Xu, X.; Huang, G.H.; Qu, Z.Y.; Pereira, L.S. Assessing the groundwater dynamics and impacts of water saving in the Hetao Irrigation District, Yellow River basin. Agric. Water Manag. 2010, 98, 301–313. [Google Scholar] [CrossRef]
  5. Zhao, Y.; Shi, H.; Miao, Q.; Yang, S.; Hu, Z.; Hou, C.; Yu, C.; Yan, Y. Analysis of Spatial and Temporal Variability and Coupling Relationship of Soil Water and Salt in Cultivated and Wasteland at Branch Canal Scale in the Hetao Irrigation District. Agronomy 2023, 13, 2367. [Google Scholar] [CrossRef]
  6. Zhang, W.-T.; Wu, H.-Q.; Gu, H.-B.; Feng, G.-L.; Wang, Z.; Sheng, J.-D. Variability of Soil Salinity at Multiple Spatio-Temporal Scales and the Related Driving Factors in the Oasis Areas of Xinjiang, China. Pedosphere 2014, 24, 753–762. [Google Scholar] [CrossRef]
  7. Arslan, H. Spatial and temporal mapping of groundwater salinity using ordinary kriging and indicator kriging: The case of Bafra Plain, Turkey. Agric. Water Manag. 2012, 113, 57–63. [Google Scholar] [CrossRef]
  8. Zeng, L.; Shannon, M.C.; Lesch, S.M. Timing of salinity stress affects rice growth and yield components. Agric. Water Manag. 2001, 48, 191–206. [Google Scholar] [CrossRef]
  9. Xiong, L.; Xu, X.; Engel, B.; Huang, Q.; Huo, Z.; Xiong, Y.; Han, W.; Huang, G. Modeling agro-hydrological processes and analyzing water use in a super-large irrigation district (Hetao) of arid upper Yellow River basin. J. Hydrol. 2021, 603, 12701. [Google Scholar] [CrossRef]
  10. Xu, Y.; Ge, Z.; Wang, J.; Li, W.; Feng, S. Study on relationship between soil salinization and groundwater table depth based on indicator Kriging. Trans. Chin. Soc. Agric. Eng 2019, 35, 123–130. [Google Scholar]
  11. Wu, J.; Zhao, L.; Huang, J.; Yang, J.; Vincent, B.; Bouarfa, S.; Vidal, A. On the effectiveness of dry drainage in soil salinity control. Sci. China Ser. E Technol. Sci. 2009, 52, 3328–3334. [Google Scholar] [CrossRef]
  12. Yuan, H.; Yang, S.; Wang, B. Hydrochemistry characteristics of groundwater with the influence of spatial variability and water flow in Hetao Irrigation District, China. Environ. Sci. Pollut. Res. 2022, 29, 71150–71164. [Google Scholar] [CrossRef]
  13. Wen, Y.; Wan, H.; Shang, S. A monthly distributed water and salt balance model in irrigated and non-irrigated lands of arid irrigation district with shallow groundwater table. J. Hydrol. 2023, 616, 12881. [Google Scholar] [CrossRef]
  14. Ren, D.; Wei, B.; Xu, X.; Engel, B.; Li, G.; Huang, Q.; Xiong, Y.; Huang, G. Analyzing spatiotemporal characteristics of soil salinity in arid irrigated agro-ecosystems using integrated approaches. Geoderma 2019, 356, 113935. [Google Scholar] [CrossRef]
  15. Ao, C.; Jiang, D.; Bailey, R.T.; Dong, J.; Zeng, W.; Huang, J. Water, Salt, and Ion Transport and Its Response to Water-Saving Irrigation in the Hetao Irrigation District Based on the SWAT-Salt Model. Agronomy 2024, 14, 953. [Google Scholar] [CrossRef]
  16. Liu, M.; Paredes, P.; Shi, H.; Ramos, T.; Tay, V.; Dai, L.; Pereira, L. Impacts of a shallow saline water table on maize evapotranspiration and groundwater contribution using static water table lysimeters and the dual Kc water balance model SIMDualKc. Agric. Water Manag. 2022, 273, 107887. [Google Scholar] [CrossRef]
  17. Ramos, T.B.; Liu, M.; Paredes, P.; Shi, H.; Feng, Z.; Lei, H.; Pereira, L.S. Salts dynamics in maize irrigation in the Hetao plateau using static water table lysimeters and HYDRUS-1D with focus on the autumn leaching irrigation. Agric. Water Manag. 2023, 283, 108306. [Google Scholar] [CrossRef]
  18. Feng, Z.; Miao, Q.; Shi, H.; Feng, W.; Li, X.; Yan, J.; Liu, M.; Sun, W.; Dai, L.; Liu, J. Simulation of water balance and irrigation strategy of typical sand-layered farmland in the Hetao Irrigation District, China. Agric. Water Manag. 2023, 280, 108236. [Google Scholar] [CrossRef]
  19. Wang, G.; Shi, H.; Li, X.; Yan, J.; Miao, Q.; Li, Z.; Akae, T. A Study on Water and Salt Transport, and Balance Analysis in Sand Dune–Wasteland–Lake Systems of Hetao Oases, Upper Reaches of the Yellow River Basin. Water 2020, 12, 3454. [Google Scholar] [CrossRef]
  20. Xu, X.; Huang, G.; Sun, C.; Pereira, L.S.; Ramos, T.B.; Huang, Q.; Hao, Y. Assessing the effects of water table depth on water use, soil salinity and wheat yield: Searching for a target depth for irrigated areas in the upper Yellow River basin. Agric. Water Manag. 2013, 125, 46–60. [Google Scholar] [CrossRef]
  21. Zhao, Y.; Li, Y.; Wang, J.; Pang, H.; Li, Y. Buried straw layer plus plastic mulching reduces soil salinity and increases sunflower yield in saline soils. Soil Tillage Res. 2016, 155, 363–370. [Google Scholar] [CrossRef]
  22. Wang, Q.; Huo, Z.; Zhang, L.; Wang, J.; Zhao, Y. Impact of saline water irrigation on water use efficiency and soil salt accumulation for spring zmaize in arid regions of China. Agric. Water Manag. 2016, 163, 125–138. [Google Scholar] [CrossRef]
  23. Asadi, Z.; Mohammadi, M.H.; Shorafa, M.; Farahbakhsh, M. Using maize to evaluate the Mohammadi–Khataar (M–K) model as a salinity weighting function for the integral water capacity. Soil Res. 2022, 60, 719–730. [Google Scholar] [CrossRef]
  24. Shi, X.; Wang, H.; Song, J.; Lv, X.; Li, W.; Li, B.; Shi, J. Impact of saline soil improvement measures on salt content in the abandonment-reclamation process. Soil Tillage Res. 2021, 208, 104867. [Google Scholar] [CrossRef]
  25. Guo, G.; Tan, X.; He, Y.; Guo, J.; Yu, J.; Zhuang, W.; Liu, C. Transport of heat, water, and salts in freeze–thaw soils under flood irrigation: Experiment and simulation. J. Hydrol. 2025, 652, 132688. [Google Scholar] [CrossRef]
  26. Liu, Y.; Ao, C.; Zeng, W.; Srivastava, A.K.; Gaiser, T.; Wu, J.; Huang, J. Simulating water and salt transport in subsurface pipe drainage systems with HYDRUS-2D. J. Hydrol. 2021, 592, 125823. [Google Scholar] [CrossRef]
  27. Du, L.; Zheng, Z.; Li, T.; Zhang, X. Effects of irrigation frequency on transportation and accumulation regularity of greenhouse soil salt during different growth stages of pepper. Sci. Hortic. 2019, 256, 108568. [Google Scholar] [CrossRef]
  28. Bai, L.L.; Cai, J.B.; Liu, Y.; Chen, H.; Zhang, B.Z.; Huang, L.X. Responses of field evapotranspiration to the changes of cropping pattern and groundwater depth in large irrigation district of Yellow River basin. Agric. Water Manag. 2017, 188, 1–11. [Google Scholar] [CrossRef]
  29. Li, Z.; Meng, Q.; Li, L.; Bai, Z.; Li, Y.; Liu, H.; Li, P.; Wang, T. Integrated deep vertical rotary tillage and subsurface pipe drainage techniques for sustainable soil salinization management and cotton production in arid regions. Agric. Water Manag. 2025, 312, 109429. [Google Scholar] [CrossRef]
  30. Chen, L.-J.; Feng, Q.; Li, F.-R.; Li, C.-S. A bidirectional model for simulating soil water flow and salt transport under mulched drip irrigation with saline water. Agric. Water Manag. 2014, 146, 24–33. [Google Scholar] [CrossRef]
  31. Hu, Y.; Guo, N.; Hill, R.L.; Wu, S.; Dong, Q.g.; Ma, P. Effects of the combined application of biomaterial amendments and polyacrylamide on soil water and maize growth under deficit irrigation. Can. J. Soil Sci. 2019, 99, 182–194. [Google Scholar] [CrossRef]
  32. Li, X.; Zhang, C.; Huo, Z.; Adeloye, A.J. A sustainable irrigation water management framework coupling water-salt processes simulation and uncertain optimization in an arid area. Agric. Water Manag. 2020, 231, 105994. [Google Scholar] [CrossRef]
  33. Zhang, Y.; Wang, J.; Gong, S.; Xu, D.; Sui, J.; Wu, Z.; Mo, Y. Effects of film mulching on evapotranspiration, yield and water use efficiency of a maize field with drip irrigation in Northeastern China. Agric. Water Manag. 2018, 205, 90–99. [Google Scholar] [CrossRef]
  34. Zhao, Y.; Li, F.; Wang, Y.; Jiang, R. Evaluating the Effect of Groundwater Table on Summer Maize Growth Using the AquaCrop Model. Environ. Model. Assess. 2020, 25, 343–353. [Google Scholar] [CrossRef]
  35. Huo, Z.; Feng, S.; Huang, G.; Zheng, Y.; Wang, Y.; Guo, P. Effect of groundwater level depth and irrigation amount on water fluxes at the groundwater table and water use of wheat. Irrig. Drain. 2012, 61, 348–356. [Google Scholar] [CrossRef]
  36. Dou, C.-Y.; Kang, Y.-H.; Wan, S.-Q.; Hu, W. Soil Salinity Changes Under Cropping with Lycium barbarum L. and Irrigation with Saline-Sodic Water. Pedosphere 2011, 21, 539–548. [Google Scholar] [CrossRef]
Figure 1. Schematic diagram showing the design of pit tests at different groundwater depths (cm).
Agronomy 15 01021 g001
Figure 2. Daily groundwater recharge and deep leakage at different groundwater depths.
Agronomy 15 01021 g002
Figure 3. Soil electrical conductivity values before and after irrigation.
Agronomy 15 01021 g003
Figure 4. Relationship between groundwater depth and soil electrical conductivity values.
Agronomy 15 01021 g004
Table 1. Description of soil textures in each treatment (depth).
Soil Layer
(cm)
Bulk Density
(g/cm3)
Particle Size Distribution %Soil Texture
>0.05 mm0.002–0.05
mm
<0.002 mm
0–101.4617.2775.157.58Silty loam
10–201.4415.0376.208.77Silty loam
20–401.5220.6073.236.17Silty loam
40–601.5626.0466.447.52Silty loam
60–801.5322.4170.726.87Silty loam
80–1001.5322.5170.676.82Silty loam
100–1201.5524.4567.488.07Silty loam
Table 2. Irrigation and fertilization management during the experiment.
Treatment26 June 202017 July 20201 August 2020 30 August 2020Irrigation
Times
Irrigation
Quota
Fertilization and Irrigation (mm)Irrigation (mm)Fertilization and Irrigation (mm)Irrigation (mm)
DGW1.25 m547272544252
DGW1.50 m547272544252
DGW1.75 m547272544252
DGW2.00 m547272544252
DGW2.25 m547272544252
Table 3. Desalination rate of each treatment in different periods (%).
TreatmentPeriodSoil Depth/cm
0–1010–2020–4040–6060–8080–100100–120
DGW1.25 m 1 d desalination rate after irrigation (%)58.149.330.6−26.1−28.4−15.7−42.0
DGW1.50 m58.842.018.7−11.7−12.7−24.5−39.3
DGW1.75 m58.930.325.8−1.2−3.2−21.3−52.3
DGW2.00 m62.431.921.115.2−7.1−42.8−23.3
DGW2.25 m68.838.223.929.518.1−15.4−29.2
DGW1.25 m15 d desalination rate after irrigation (%)27.212.316.5−3.3−12.1−19.4−28.7
DGW1.50 m28.821.315.7−2.8−1.4−12.6−17.4
DGW1.75 m29.116.712.03.3−8.0−6.8−16.4
DGW2.00 m35.417.413.710.6−14.1−20.9−11.2
DGW2.25 m38.620.314.717.8−6.3−7.2−22.8
DGW1.25 m(%) Desalination rate after autumn harvest (%)−80.9−80.4−91.4−86.1−76.5−52.9−63.2
DGW1.50 m−58.2−77.6−86.9−68.4−43.3−51.5−74.9
DGW1.75 m−46.1−69.5−74.2−50.5−27.5−33.5−35.4
DGW2.00 m−26.9−31.1−35.2−40.4−46.0−39.5−39.2
DGW2.25 m−20.5−22.1−35.5−29.6−29.3−42.8−17.9
Table 4. Effects of DGW on number of grains, grain weight, 100-grain weight, dry matter, yield, and water use efficiency.
TreatmentsNumber of GrainGrain Weight (g)100-Grain Weight (g)Dry Matter (g)Yield (kg/hm2)Water Use Efficiency (kg/m3)
DGW1.25 m393.40 b161.62 c33.65 ± 0.49 b156.34 ± 3.14 b 9091.01 c2.17 ± 0.04 c
DGW1.50 m432.80 ab162.34 c34.03 ± 0.14 b188.02 ± 5.71 ab 9131.63 c2.31 ± 0.19 c
DGW1.75 m436.40 ab176.04 c38.74 ± 0.39 a207.48 ± 5.92 ab10,357.35 b2.56 ± 0.13 b
DGW2.00 m444.40 ab192.38 b38.11 ± 0.45 a222.08 ± 5.42 a10,821.60 b2.72 ± 0.22 ab
DGW2.25 m457.40 a208.37 a39.20 ± 0.11 a228.36 ± 7.66 a11,720.70 a2.91 ± 0.20 a
Note: Different letters in the same column indicate significant differences (p < 0.05).
Disclaimer/Publisher’s Note: The statements, opinions and data contained in all publications are solely those of the individual author(s) and contributor(s) and not of MDPI and/or the editor(s). MDPI and/or the editor(s) disclaim responsibility for any injury to people or property resulting from any ideas, methods, instructions or products referred to in the content.

