Article

Tuber Growth and Nutritional Traits in Deficit Irrigated Potatoes

1
Dipartimento di Agricoltura, Alimentazione e Ambiente (Di3A), University of Catania, Via S. Sofia 100, 95123 Catania, Italy
2
Institute of BioEconomy, National Research Council (CNR-IBE), Via P. Gaifami 18, 95126 Catania, Italy
*
Author to whom correspondence should be addressed.
Agronomy 2025, 15(5), 1019; https://doi.org/10.3390/agronomy15051019
Submission received: 25 March 2025 / Revised: 19 April 2025 / Accepted: 22 April 2025 / Published: 24 April 2025

Abstract

:
Knowledge of tuber growth and nutritional traits response of early potatoes to dynamic deficit irrigation is lacking. This study aimed to evaluate, over two growing seasons and using two potato cultivars (Arinda and Timate), the effects of five irrigation regimes on mean tuber weight and nutritional profile (starch, dry matter, protein, reducing sugars, and ash content) during tuber growth and at final harvest. The irrigation treatments included I0 (dry control), I100 (100% ETm from tuber initiation to the end of tuber growth), I100-0 (100% ETm until 50% of tuber growth, then no irrigation), I100-50 (100% ETm until 50% of tuber growth, then 50% ETm), and I100-75 (100% ETm until 50% of tuber growth, then 75% ETm). Regardless of cultivars and seasons, I100-50 led to higher starch content and comparable mean tuber weight, dry matter, protein, reducing sugars, and ash contents compared to I100, with a saving of irrigation water of about 800 m3 ha−1 per season. Moreover, I100-0 did not substantially modify mean tuber weight compared to I100 but improved tubers’ nutritional profile by higher starch and dry matter contents and comparable values of reducing sugars and ash, providing a water saving of about 1500 m3 ha−1 per season. The studied cultivars behaved similarly with respect to the irrigation regimes. In conclusion, it was possible to effectively apply dynamic deficit irrigation to save irrigation water without compromising tuber weight and nutritional traits.

1. Introduction

Potato (Solanum tuberosum L.) is a vital non-cereal crop and a staple food in many countries worldwide due to its high production, versatile usage, and easy market accessibility [1]. Currently, global potato production is approximately 360 million tons, harvested from around 16.5 million ha [2]. In the Mediterranean Basin, where about 3 million hectares are dedicated to potato cultivation with an overall production of 28 million tons of tubers [2], potatoes are grown not only in the typical spring–summer cycle but also in a winter–spring cycle (from November–January to March–early June) for “early production” [3]. Early potatoes, defined as “potatoes harvested before they are completely mature, marketed immediately after harvesting, and whose skin can be easily removed without peeling” (UNECE of Geneva, FFV-30/2001), are highly valued for their freshness and are primarily exported to Northern European countries, generating substantial profit [3]. These potatoes are mainly intended for fresh consumption, making their nutritional characteristics critical factors influencing both economic yield and consumers’ acceptability [4]. At harvest, potatoes typically contain approximately 75–84% water and 16–25% dry matter, the latter of which plays a critical role in determining key quality attributes such as nutritional value, taste, texture, and resistance to mechanical damage [5]. Early potato tubers are rich in soluble sugars, primarily sucrose, glucose, and fructose, making them highly popular for certain culinary uses but unsuitable for processing; additionally, potato tubers are a significant source of starch, high-quality proteins, and various essential minerals [3]. As is known, potato crops are highly sensitive to water deficits, requiring a soil water content above 50% of the maximum available water in the root zone to achieve high yields [6]. Early potato production is particularly vulnerable to water stress, which affects not only yield but also earliness [7]. As a result, irrigation plays a critical role in ensuring high yields, as well as maintaining tuber size, grade, and quality [8,9]. However, in the Mediterranean basin, as well as in various regions worldwide, irrigation water is becoming increasingly scarce and costly, with aquifers being depleted. Consequently, implementing irrigation strategies that enhance water-use efficiency in crop production is essential. One of the most extensively studied water-saving strategies in potato cultivation is deficit irrigation (DI), which involves under-irrigating the crop either throughout the entire growth season (static deficit irrigation—SDI) or during specific growth stages (dynamic deficit irrigation—DDI) [10]. DDI is an irrigation strategy that focuses on supplying water during the drought-sensitive (critical) growth stages of a crop while deliberately applying reduced water inputs during stages that are less sensitive to water scarcity. In potatoes, the tuber bulking phase is widely recognized as the most critical stage for water availability, whereas the early vegetative stage and the late bulking stage are considered less sensitive [10]. Studies evaluating the impact of DDI on potato productivity in semi-arid Mediterranean environments [7,8,11,12,13,14] have consistently demonstrated the effectiveness of this approach in conserving irrigation water while simultaneously enhancing irrigation water use efficiency (IWUE). Nonetheless, there is still little information about how such irrigation regimes influence tuber growth, tuber quality, and nutritional composition. Moreover, findings related to the impact of DDI on the nutritional characteristics of tubers found in the literature [11,15,16,17,18,19,20,21,22,23,24,25,26] come from research conducted in environmental contexts completely different from the semi-arid Mediterranean one and refer to main-crop tubers, noticeably different compared to early potato crops [7]. Furthermore, but not less important, there are no findings on the effects of DDI on the nutritional characteristics of tubers monitored during growth, whose knowledge is crucial for early potato crops, as these tubers are often harvested at various growth stages, depending on the market price for potatoes in national and international markets [3]. Moreover, it is well established that potato cultivars respond differently to water deficit, highlighting the importance of genotype-specific evaluations. An exception is only one research on early potatoes conducted in a Mediterranean environment on the effects of DDI on tuber weight and nutritional traits throughout tuber growth [27], involving severe water deficit (no irrigation) in certain stages of crop. In particular, this research investigated the effects of water deficit during two phases of tuber growth: the first phase (from tuber initiation to approximately 50% of tuber development) and the second phase (from 50% of tuber development to its completion). In each case, the other phase received full irrigation (100% of ETm). The study found that when it is not possible to meet the crop’s water requirements throughout the entire growth cycle, it is more beneficial, both in terms of yield and quality, to prioritize irrigation during the first half of the tuber development period rather than the second half. However, these findings require further validation. Additionally, they highlight the need for further research into crop responses to varying levels of water supply during the second half of tuber growth, particularly involving less severe water deficits and/or irrigation at levels below 100% of ETm. Moreover, it becomes essential to assess the effects of DDI on tuber growth and nutritional traits in cultivars that are increasingly adopted in the Mediterranean region but remain underexplored in this context. With this in mind, the present study aimed to investigate, under field conditions, the impact of DDI on tuber growth dynamics and the nutritional composition of two potato cultivars at various developmental stages and at the final harvest. The experiment was conducted across two growing seasons to capture the influence of seasonal variability in rainfall and temperature—two key factors modulating water availability, tuber development, and nutrient accumulation.

2. Materials and Methods

2.1. Site, Climate and Soil

A field experiment was conducted over two growing seasons on the coastal plain South of Siracusa, Sicily (37°03′ N, 15°18′ E, 15 m a.s.l.), a region known for early potato cultivation. The area features a semi-arid Mediterranean climate characterized by mild winters and typically dry summers. During the potato growing season (from January to May), the 30-year (1987–2016) monthly average temperatures were 12.1 °C in January and February, 13.5 °C in March, 16.2 °C in April, and 19.8 °C in May, with average rainfall totaling approximately 280 mm over the same the period. The soil, classified as Calcixerollic Xerochrepts [28], was analyzed up to a depth of 0.30 m, where around 90% of potato roots are active. Pre-experiment soil characteristics were 30% clay, 25% silt, 45% sand, 2.0% organic matter, pH 8.4, 1.8‰ total nitrogen, 78 kg ha−1 assimilable P2O5, and 337 kg ha−1 exchangeable K2O. Soil physical properties were: field capacity at −0.03 MPa 0.29 g g−1 dry weight, wilting point at −1.5 MPa 0.11 g g−1 dry weight, bulk density 1.2 g cm−3. All analyses followed procedures approved by the Italian Society of Soil Science [29].

2.2. Experimental Design, Plant Material, and Management Practices

The experiment was conducted in 2012 and 2013 (hereafter referred to as Season I and Season II), from January to May (Season I) and from January to June (Season II), using a randomized split-plot design with three replications. The main plots consisted of 5 irrigation regimes, while the sub-plots included 2 potato cultivars, i.e., Arinda and Timate. The 5 irrigation regimes were as follows:
  • I0 (dry control): irrigation only at plant emergence;
  • I100 (irrigated control): irrigation supplying 100% of maximum evapotranspiration (ETm) from tuber initiation up to the end of tuber growth;
  • I100-0: 100% ETm supplied from tuber initiation up to 50% tuber growth, and then no irrigation supplied up to the end of the tuber growth;
  • I100-50: 100% ETm supplied from tuber initiation to 50% tuber growth and then 50% ETm supplied up to the end of the tuber growth;
  • I100-75: 100% ETm supplied from tuber initiation to 50% tuber growth, then 75% ETm supplied up to the end of the tuber growth.
The I100-0 regime, previously studied [27], was included to validate earlier findings. ‘Arinda’ and ‘Timate’ are two widely grown cultivars in the Mediterranean region for early potato production, whose origin, morphological, and productive characteristics were previously reported [14]. Virus-free whole seed tubers, imported from Northern European countries, were planted in January during both growing seasons. The planting was carried out with a spacing of 0.3 m between plants and 0.7 m between rows, corresponding to a planting density of 4.76 plants m−2. The experimental units were 4.2 × 3.0 m in size, containing 60 plants per plot, with 2 m-wide borders separating the different irrigation treatments. Details on fertilization management were previously reported [14]. Plant emergence occurred 40 days after planting in Season I and 43 days after planting in Season II. Tuber harvest was carried out when approximately 80% of the foliage had senesced, which corresponded to 88 days after emergence (DAE) in Season I and 96 DAE in Season II.

2.3. Irrigation Treatments

The irrigation strategy for the experimental plots, including the unirrigated control, was structured to ensure that all plants received one irrigation (30 mm) upon complete emergence. Subsequent irrigations for the other treatments were started at tuber initiation and adjusted according to the specified percentages of maximum evapotranspiration (ETm) as described in 2.2, as outlined: in Season I, tuber initiation began on 24 March (26 DAE), 50% of tuber growth was reached by 51 DAE, and irrigation continued until 17 May (80 DAE), marking the end of tuber growth; in Season II, tuber initiation began on 5 April (32 DAE), 50% of tuber growth was reached by 60 DAE, and irrigation continued until 3 June (90 DAE), the end of tuber growth. The soil was carefully excavated around tubers from three plants per sub-plot every 10 days from 20 DAE to 80 DAE in Season I and from 20 DAE to 90 DAE in Season II to track key tuber growth stages (initiation, 50% of tuber growth, and the end of growth) [30]. The tuber growth stage was evaluated based on visual observation of tuber size. As the cultivars under study are widely grown in the Mediterranean region, the approximate final size their tubers can reach is known.
The maximum crop evapotranspiration (ETm) was calculated using the formula:
ETm = 0 n   E · K c · K p  
where n = the number of days since the last irrigation; E = daily evaporation from an unscreened Class A Pan, positioned about 100 m from the crop and covered with a mesh to prevent contamination; Kc = crop coefficient, varying from 0.45 to 1.15, depending on the crop’s growth stage; Kp = pan coefficient, set at 0.8 chosen because it is the one defined by Doorembos and Kassam [31] for the Mediterranean area. Based on crop observations, we used the Kc values reported by Doorembos and Kassam [31] for the different development stages of potatoes, specifically 0.4–0.5 for the initial stage, 0.7–0.8 during crop development, 1.05–1.2 for mid-season, 0.85–0.95 for the late season, and 0.7–0.75 at harvest. Irrigation was administered via a drip system when the accumulated daily evaporation, adjusted for effective rainfall, reached 30 mm, which corresponded to approximately 50–60% of the available soil water content in the 0–0.30 m soil layer for plots irrigated at 100% of maximum evapotranspiration (ETm). Drip lines equipped with pressure-compensating emitters were spaced 0.30 m apart, aligned along planting rows with a 0.70 × 0.30 m configuration. Only rainfall events exceeding 5 mm within a 25 h window were considered effective and included in the accumulated evaporation calculations. Water meters were installed to monitor and quantify the total volume of irrigation water applied to each treatment. The total water amounts and number of irrigation events for each regime across both growing seasons are presented in Table 1. The number of irrigations includes the irrigation intervention (supplying 30 mm) carried out upon complete emergence on all plants. The experimental field was flat, and the drip irrigation system minimized potential runoff and downward flux below the root zone, ensuring that observed differences in treatment outcomes were solely due to the varying amounts of irrigation.

2.4. Data Collection

2.4.1. Tuber Growth

To assess the effects of the treatments during tuber growth, four destructive samplings were conducted in Season I (at 50, 59, 70, and 79 days after emergence (DAE)) and in Season II (at 59, 68, 75, and 85 days DAE). Final harvest was performed manually at 88 and 96 DAE in Seasons I and II, respectively, on the remaining plants in each plot. During each sampling and at the final harvest, tubers were classified as marketable (individual weight > 20 g) or unmarketable (<20 g, deformed, green, or diseased), then counted and weighed separately. Marketable tuber yield at final harvest, regardless of cultivars and seasons, was 19.8 t ha−1 in dry control (I0), 37.8 t ha−1 in I100, 31.1 t ha−1 in I100-0, and 35.8 t ha−1 in both I100-50 and I100-75, as previously reported [14].

2.4.2. Nutritional Traits

Analyses were performed on a representative sample of approximately 30 marketable tubers per replicate, randomly collected from around 20 plants for each irrigation regime and cultivar at each sampling. Within four hours of harvest, the samples were transported to the CNR-IBE laboratory and stored in the dark at 15 ± 1 °C. On the following day, all tubers were washed with tap water to remove residual soil and gently dried using paper towels. Nutritional traits were assessed using peeled tubers, following established analytical methods. For each growing season, a total of 120 samples (2 cultivars × 5 irrigation regimes × 4 samplings × 3 replicates) were analyzed for each chemical parameter. Ten tubers per replicate were homogenized using a commercial hand blender (Braun Multiquick MR400, Aschaffenburg, Germany) and immediately analyzed for starch content, which was determined using the Fehling method by acid hydrolysis [32] and expressed as grams per 100 g of fresh weight (g 100 g−1 FW). Dry matter (DM) content was measured by slicing ten tubers into small cubes (~1 cm3) and drying them in a thermoventilated oven (Binder, Tuttlingen, Germany) at 65 °C until constant weight [32]. The dehydrated material was then finely ground using a mill (IKA, Labortechnick, Staufen, Germany) with a 1.0 mm sieve. The ground material was used to analyze total protein, reducing sugars, and ash contents. The total protein content of tubers was determined from the total N content of 1 g of dehydrated tuber sample, using the Kjeldahl method (Kjeltec 2300 Auto Analyzer; Foss-Tecator, Hilleroed, Denmark). Protein content was calculated by multiplying the N content × 6.25 and expressed as g 100 g−1 DW. Reducing sugars were quantified using the 3,5-dinitrosalicylic acid (DNS) method [33] on the dry material and expressed as g 100 g−1 fresh weight (FW). Ash content was measured by first determining the weight of a clean, dry porcelain crucible. Five grams of the dry sample were then placed in a muffle furnace at 550 °C for 24 h [32]. The ash content was calculated using the formula: (W2/W1) × 100, where W2 is the weight of the ash, and W1 is the weight of the original dried sample [32]. Results were expressed as g 100 g−1 DW.

2.5. Data Analysis

The normality of data distributions was confirmed using the Shapiro–Wilk test [34], and the homogeneity of variances was verified using Levene’s test [35]. On each growth season, all data preceding the final harvest were subjected to a 3-way analysis of variance (ANOVA), considering the combination between irrigation regimes (5), cultivars (2), and sampling dates (4). Data collected at the final harvest were subjected to a 3-way ANOVA deriving from 5 irrigation regimes × 2 cultivars × 2 growth seasons. Before the ANOVA, percentage data were Bliss transformed [36] (untransformed data are reported). Standardized tuber traits at final harvest were subjected to principal component analysis (PCA, one per growth season) to determine the most effective traits in discriminating between treatments and genotypes. The first two components explaining the maximum variance were selected for the ordination analysis, and the correlation between the original traits and the respective principal component was calculated. Hierarchical cluster analysis (HCA) was effected using the Wards method of agglomeration and Euclidean distances. All calculations were performed using Excel® version 2016 (Microsoft Corporation, Redmond, WA, USA), CoStat® version 6.003 (CoHort Software, Monterey, CA, USA), and Minitab® version 16.1.1 (Minitab Inc., State College, PA, USA).

2.6. Temperature and Rainfall

Meteorological variables (Table 2) were recorded daily throughout the growing seasons using a data logger (CR21, Campbell Scientific, Logan, UT, USA) connected to a meteorological station situated approximately 20 m from the experimental field. During Season II, both maximum and minimum temperatures were lower compared to Season I and the 30-year average (1987–2016). Notably, the differences in maximum temperatures between the two seasons were significant, reaching 1.0 °C in January, 4.1 °C in February, 4.4 °C in March, and 3.2 °C in April. For minimum temperatures, the differences were 2.4 °C in January, 0.6 °C in February, 1.9 °C in March, and 0.9 °C in April. Rainfall distribution also varied significantly between the two seasons. Season I, from January to June, recorded 132 mm of rainfall, which was lower than the 30-year mean (290 mm); in contrast, Season II experienced substantially higher precipitation (424 mm), occurring approximately 60% in January and February and the remaining 40% in April. The differences in temperature and rainfall between the two seasons, compared to historical averages, likely influenced the growth and development of the potato crop, as well as the effects of irrigation regimes on tuber growth and nutritional traits.

3. Results

The significance of the effects of irrigation regime (I), cultivar (C), and sampling date (S) (before final harvest), as well as irrigation regime (I), cultivar (C), and growth season (Se) (at final harvest), and their interactions, resulting from the ANOVA (Fisher–Snedecor F-test), is reported in Supplementary Tables S1 and S2. The corresponding effects on the mean values of the measured variables are presented in Table 3, Table 4 and Table 5 and Figure 1, Figure 2, Figure 3 and Figure 4.

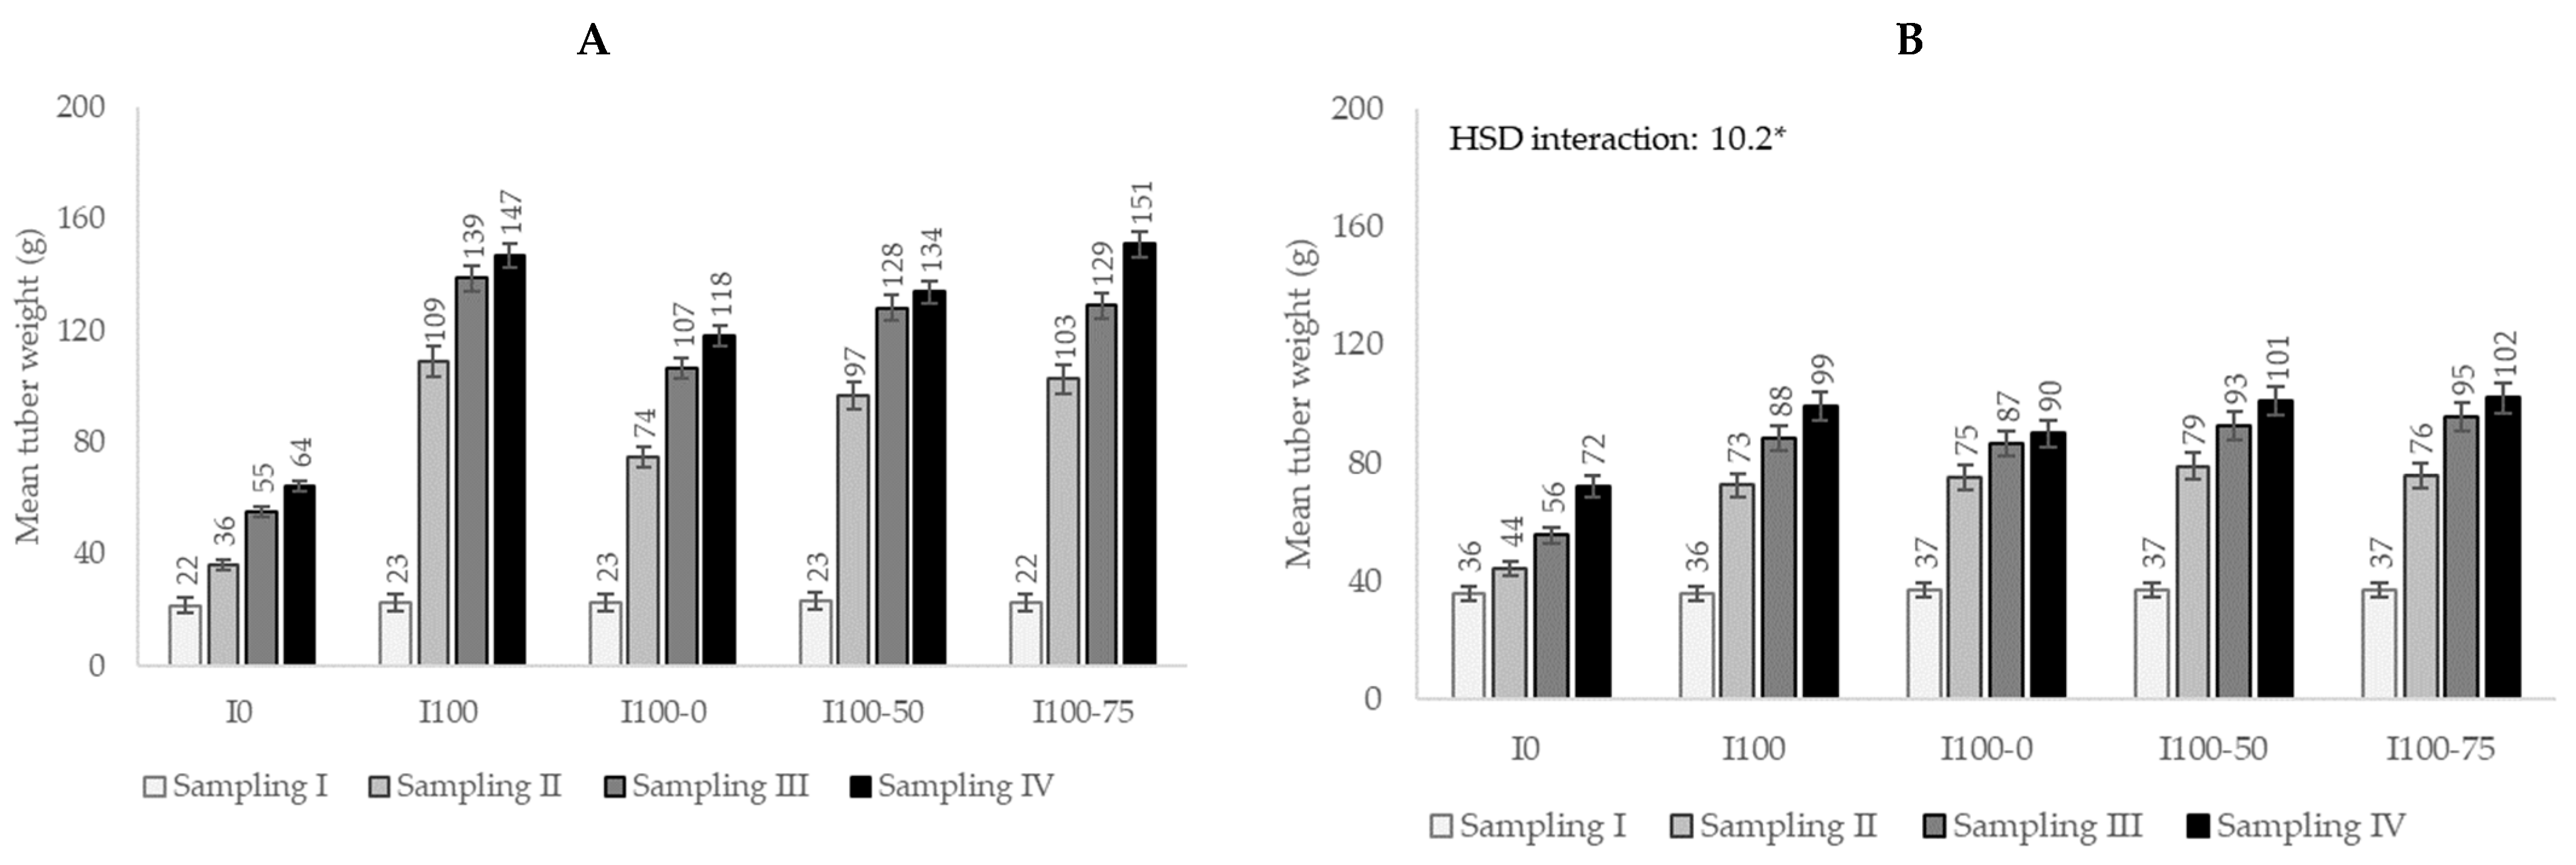
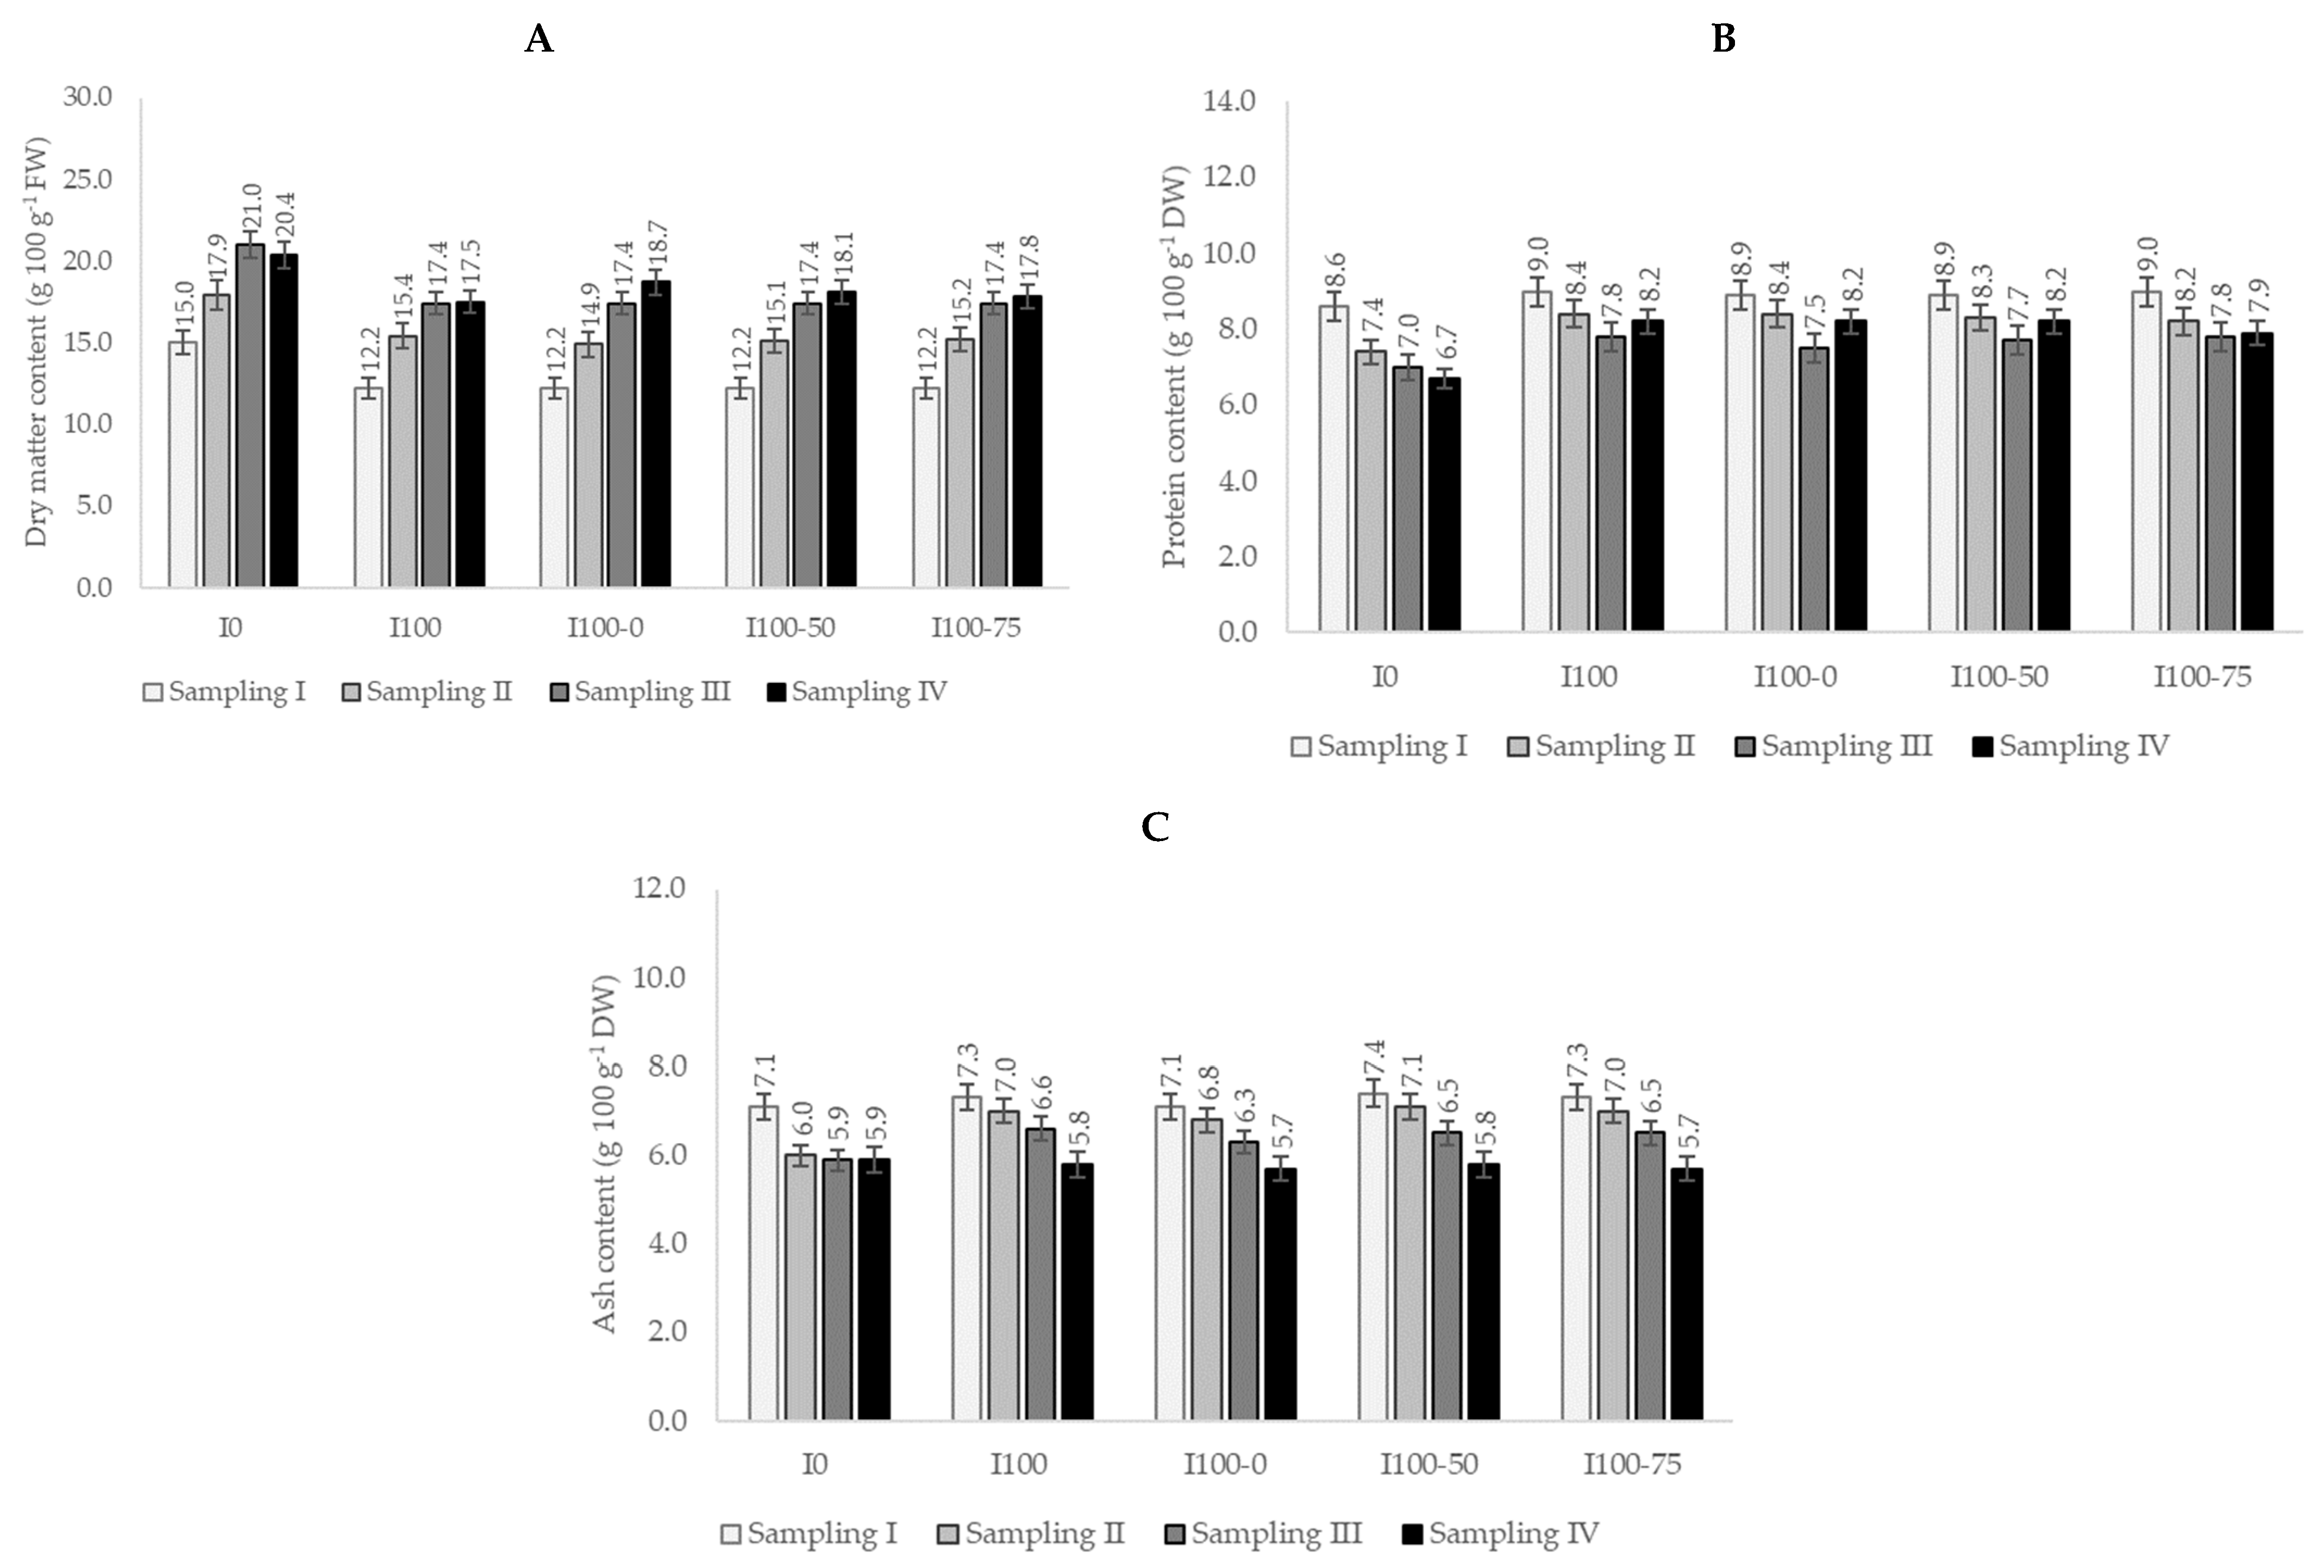
3.1. Tuber Weight and Nutritional Traits During Tuber Growth

Regardless of the other factors, in Season I, the highest mean tuber weight was found both in I100 and I100-75 (105 g, on average); this value was significantly lower in I100-50 (97 g) and even more by I100-0 (82 g). In Season II, all irrigation regimes, regardless of the amount supplied, led to an increase in mean tuber weight compared to the non-irrigated control (I0), with an average increase of 52% (Table 3).
Table 3. Tuber weight and nutritional traits throughout tuber growth as affected by the main factors in Seasons I and II.
Mean Tuber Weight (g)Starch
(g 100 g−1 FW)
Dry Matter
(g 100 g−1 FW)
Protein
(g 100 g−1 DW)
Reducing Sugars
(g 100 g−1 FW)
Ash
(g 100 g−1 DW)
S1S2S1S2S1S2S1S2S1S2S1S2
Irrigation
I045 d50 b17.0 a13.9 a21.1 a18.7 a8.0 c7.5 b0.22 a0.18 a4.7 c6.3 a
I100106 a72 a12.6 c12.3 b16.5 d15.7 b9.1 a8.4 a0.20 a0.19 a6.3 a6.7 a
I100-082 c76 a14.3 b13.7 a17.7 b15.9 b8.6 b8.3 a0.18 a0.18 a5.6 b6.5 a
I100-5097 b79 a13.5 bc13.0 ab17.1 c15.8 b8.8 ab8.4 a0.19 a0.19 a5.9 ab6.7 a
I100-75103 a78 a13.1 bc12.7 b16.8 cd15.7 b8.9 ab8.2 a0.19 a0.19 a6.1 a6.7 a
F************************NSNS***NS
Cultivar
Arinda98 a79 a13.7 b12.6 b17.0 b15.5 b8.9 a8.2 a0.18 b0.18 b5.8 a6.5 a
Timate75 b63 b14.5 a13.6 a18.7 a17.2 a8.5 b8.2 a0.21 a0.19 a5.6 a6.5 a
F******************NS**NSNS
Sampling
I23 d35 d10.0 d9.9 d16.2 c12.7 d9.6 a9.0 a0.26 a0.24 a5.4 a7.1 a
II84 c69 c12.9 c12.6 c17.3 b15.7 c8.4 b8.1 b0.22 a0.20 b5.7 a6.8 b
III111 b84 b15.1 b14.1 b18.5 a18.2 b8.3 b7.6 c0.14 b0.13 c5.6 a6.4 c
IV122 a93 a17.9 a15.5 a18.7 a18.5 a8.5 b7.6 c0.16 b0.16 c6.1 a5.8 d
F******************************NS***
S1 and S2: Season I and Season II, respectively. Different letters within each column’s factor indicate significance at Tukey’s HSD (p ≤ 0.05). NS not significant; *, ** and ***: significant at p < 0.05, 0.01, and 0.001, respectively. F: Fisher–Snedecor test.
In both seasons, the interaction between irrigation and sampling was statistically significant (Figure 1). The differences between the irrigated regimes emerged at the second sampling, during which mean tuber weight of I100 and I100-75 (106 g, on average) was reduced by I100-50 (97 g, −9%) and I100-0 (74 g, −30%), then remained almost constant in subsequent samplings (Figure 1A). In Season II, the differences between regimes emerged in the second sampling as well, during which the irrigated treatments (I100, I100-0, I100-50, and I100-75) led to a higher mean tuber weight (76 g, on average) compared to I0 (44 g). These differences were consolidated in the third sampling (+39%), while in the fourth sampling, it was noted that, compared to the other regimes (excluding I0), I100-0 reduced the tuber weight by about 11% (Figure 1B).
Figure 1. Mean tuber weight as affected by the ‘irrigation regime × sampling’ interaction in Season I (A) and Season II (B). *: significant at p = 0.05.
Agronomy 15 01019 g001
Regardless of samplings, the starch content in Season I displayed the lowest value in I100 (12.6 g 100 g−1 FW), while it peaked in I100-0 (14.3 g 100 g−1 FW), with regimes I100-50 and I100-75 featuring intermediate values (Table 3). In Season II, the lowest starch content was found in I100 and I100-75 (12.5 g 100 g−1 FW, on average), while the highest one was recorded mostly in both I0 and I100-0 (13.8 g 100 g−1 FW, on average) (Table 3). The dry matter content was differently affected by irrigation regimes in the two seasons. Indeed, while I0 always showed the highest values for this variable, in Season I and throughout all samplings, the lowest dry matter was found in the tubers harvested from I100, I100-75, and I100-50 (between 16.5 and 17.1 g 100 g−1 FW), while I100-0 promoted this trait up to 17.7 g 100 g−1 FW (Table 3). In season II, from sampling I to sampling III, the lowest dry matter content was found in all the irrigated regimes, without significant differences among them, with an average reduction, referred to I0, of about 17% (Figure 2A); however, at sampling IV, in I100-0 it was found a higher tubers’ dry matter (18.7 g 100 g−1 FW) compared to both I100 and I100-75 (17.7 g 100 g−1 FW, on average) (Figure 2A). Regarding total protein content, in Season I, throughout all samplings, the highest value was found in I100 (9.1 g 100 g−1 DW), but it was significantly reduced by I100-0 (8.6 g 100 g−1 DW), while I100-50 and I100-75 displayed intermediate values (Table 3). In Season II, at sampling I, no significant differences emerged between treatments, but from sampling II onward, all the irrigation regimes promoted the protein content of tubers compared to I0 (Figure 2B). On the contrary, reducing sugar content in both seasons was not affected by the irrigation regime, ranging from 0.18 to 0.22 g 100 g−1 FW in Season I and from 0.18 to 0.19 g 100 g−1 FW in Season II (Table 3). The ash content in Season I showed the lowest value in I0 (4.7 g 100 g−1 DW) and intermediate value in I100-0 (5.6 g 100 g−1 DW), whereas both I100 and I100-75 proved the highest values (6.2 g 100 g−1 DW, on average). In the second season and at samplings I and IV, no significant differences emerged between treatments; however, at samplings II and III, compared to I0 (6.0 g 100 g−1 DW, on average), all the irrigation treatments promoted the ash content of tubers (6.7 g 100 g−1 DW, on average) (Figure 2C).
Figure 2. Dry matter (A), protein (B), and ash contents (C) as affected by ‘irrigation regime × sampling’ interaction (Season II).
Agronomy 15 01019 g002
Regardless of irrigation regimes and samplings, in both seasons, ‘Arinda’ showed significantly higher fresh tuber weight and protein content than ‘Timate’ but had lower starch, dry matter, and reducing sugar contents (Table 3). As expected, in both seasons, passing from sampling I to IV, there was a progressive and significant increase in mean tuber weight, starch content, and dry matter. Additionally, a decreasing trend was observed for protein, reducing sugars, and ash contents (Table 3).

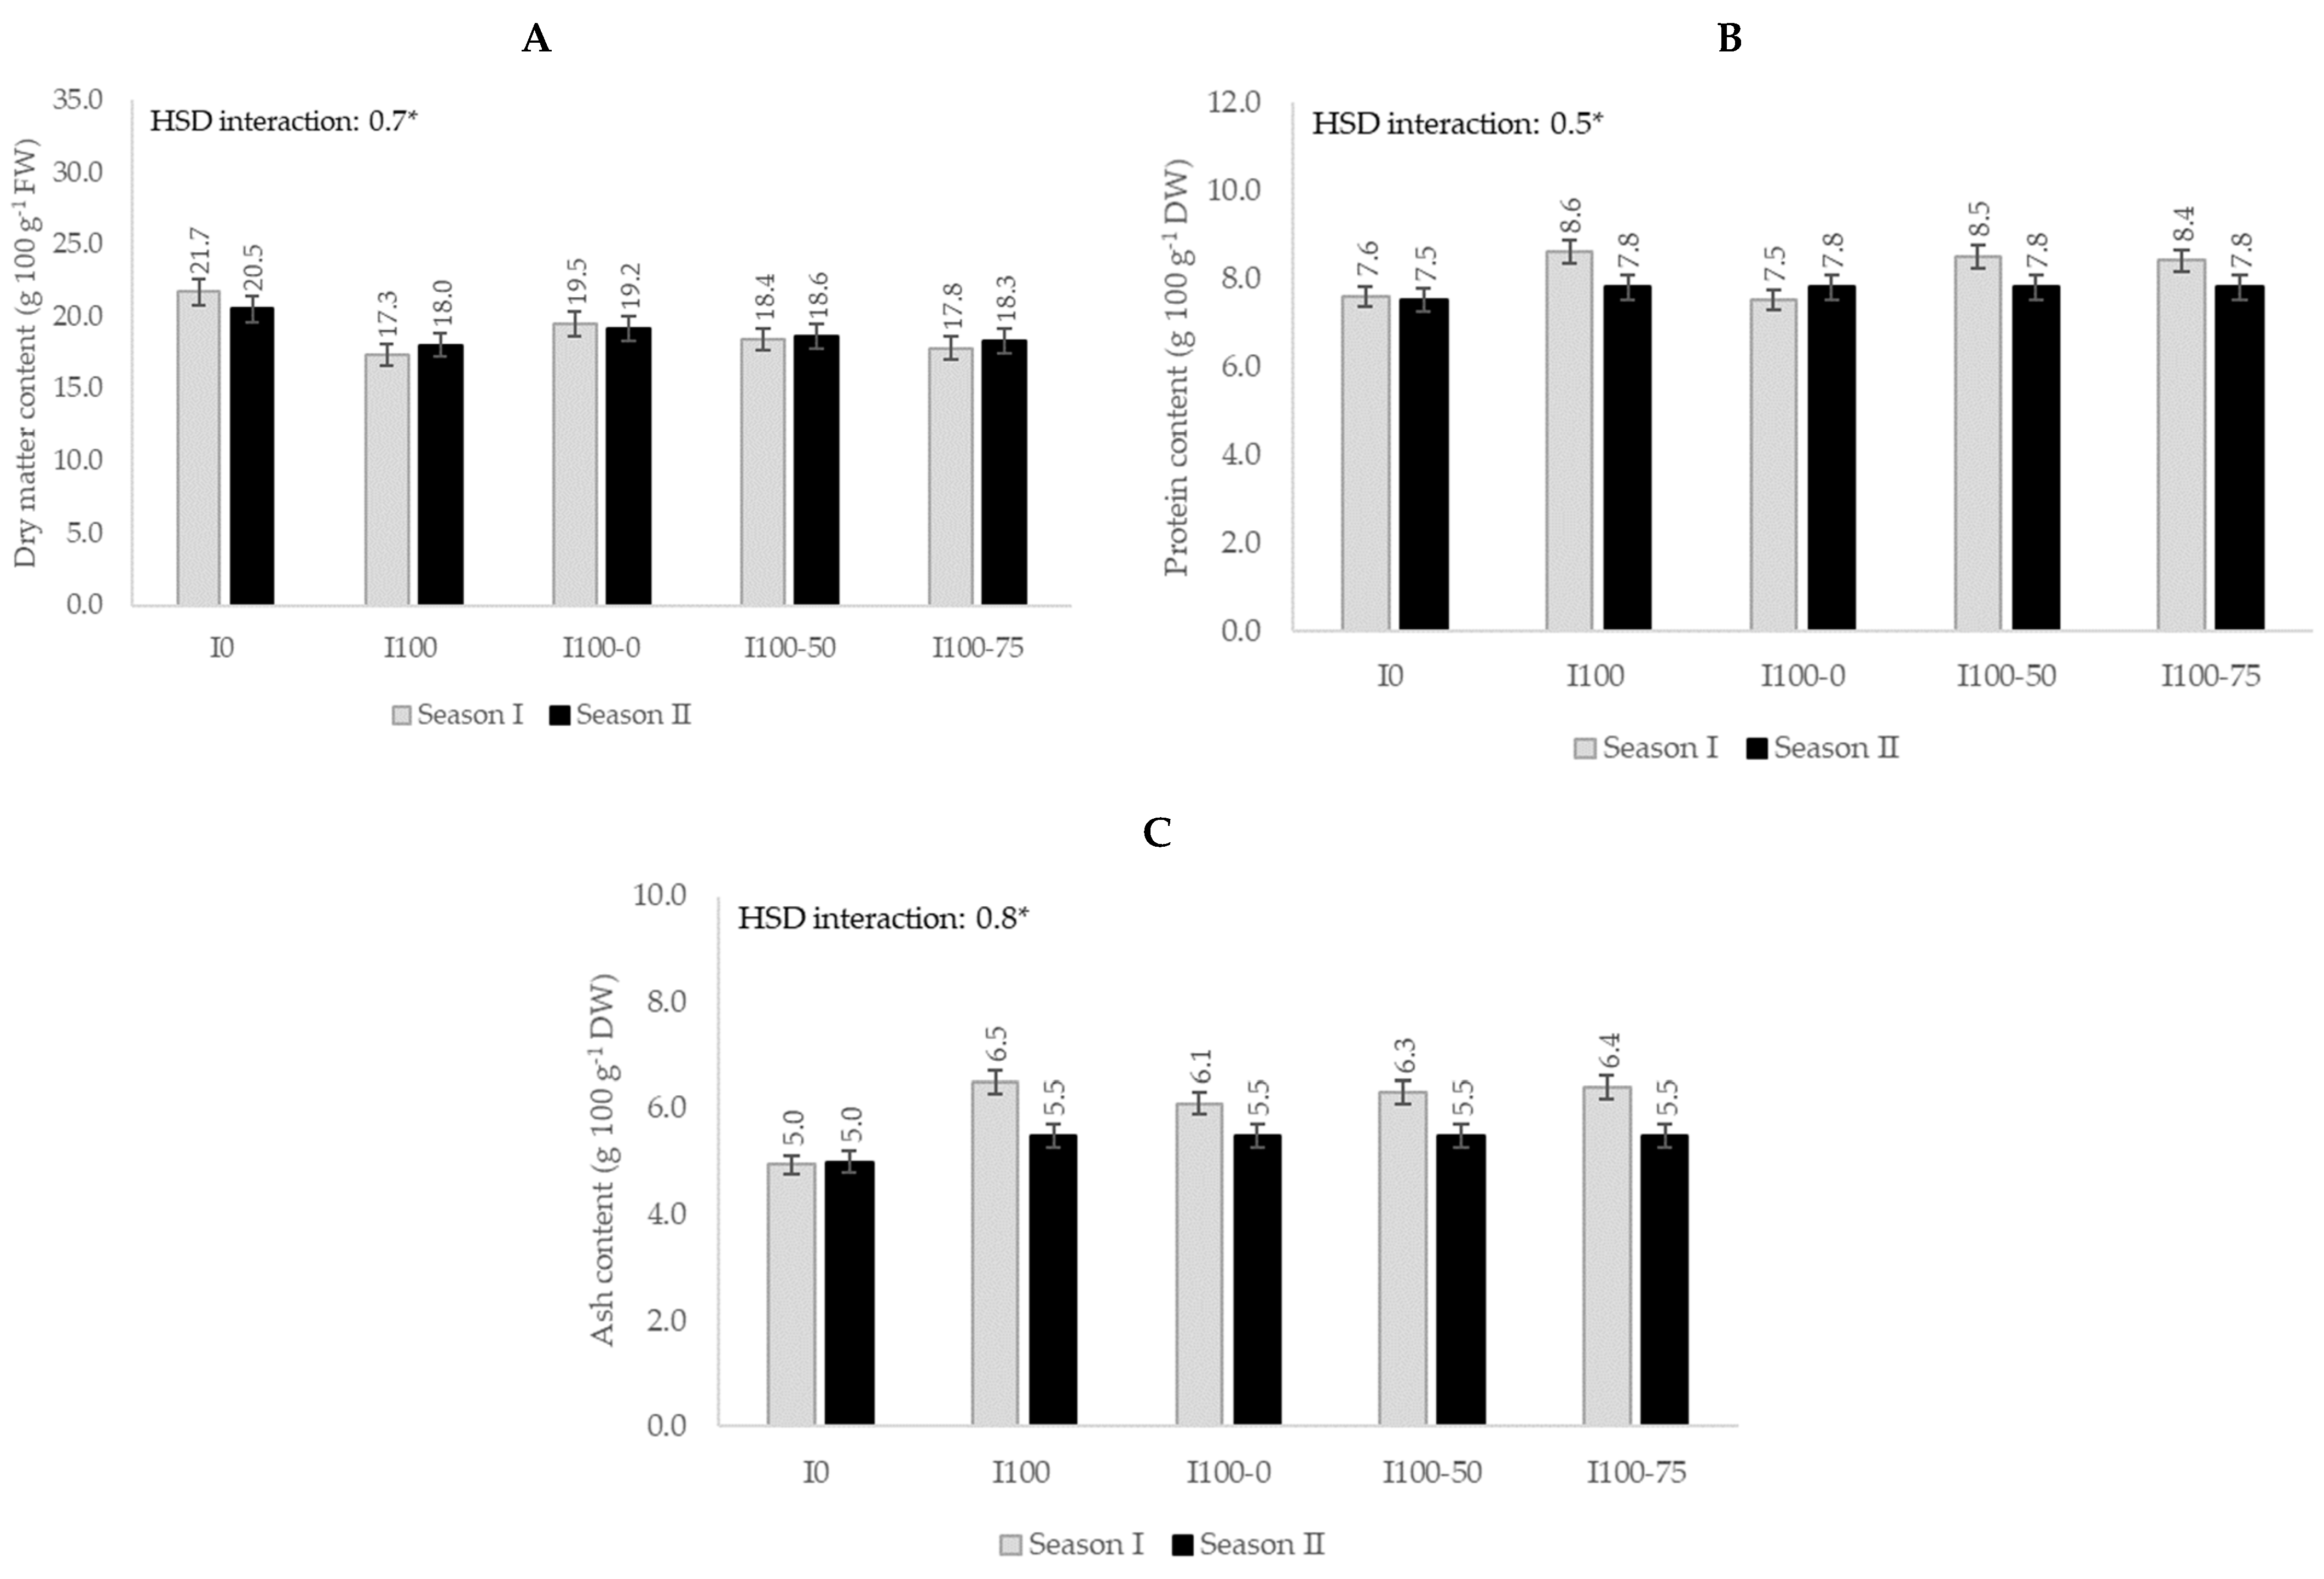
3.2. Tuber Weight and Nutritional Traits at Final Harvest

The effects of irrigation regimes at the final harvest were evident on mean tuber weight and all nutritional traits, except for reducing sugar content (Table 4).
Table 4. Tuber weight and nutritional traits at final harvest as affected by the main factors.
Mean Tuber Weight (g)Starch
(g 100 g−1 FW)
Dry Matter
(g 100 g−1 FW)
Protein
(g 100 g−1 DW)
Reducing Sugars
(g 100 g−1 FW)
Ash
(g 100 g−1 DW)
Irrigation
I071 c18.4 a21.1 a7.6 b0.14 a5.0 b
I100129 a14.6 c17.6 c8.2 a0.15 a6.0 a
I100-0110 b17.9 a19.3 bc7.6 b0.15 a5.8 a
I100-50123 ab16.2 b18.5 b8.1 a0.15 a5.9 a
I100-75133 a15.4 bc18.0 c8.1 a0.15 a5.9 a
F***********NS**
Cultivar
Arinda125 a15.0 b18.3 b8.2 a0.14 b5.7 a
Timate102 b18.0 a20.4 a7.6 b0.16 a5.8 a
F*************NS
Season
I129 a16.7 a19.0 a8.1 a0.15 a6.0 a
II98 b16.3 b18.9 a7.7 b0.15 a5.4 b
F******NS***NS*
Different letters within each column’s factor indicate significance at Tukey’s HSD (p ≤ 0.05). NS not significant; *, ** and ***: significant at p < 0.05, 0.01, and 0.001, respectively. F: Fisher–Snedecor test.
Regardless of cultivar and season, the highest mean tuber weight was recorded both in I100 and I100-75 (131 g, on average), but it was significantly reduced in I100-0 (110 g) and I0 (71 g) (Table 4). On the contrary, the highest starch content was recorded in these last two regimes (18.1 g 100 g−1 FW, on average), whereas I100 displayed the lowest starch content (14.6 g 100 g−1 FW) (Table 4). The effects of irrigation regimes on dry matter, protein, and ash contents were different between the two seasons. Indeed, while the I100-0 regime showed stable values for these quality parameters over the two-year period, significant variations in tuber dry matter content were observed passing from Season I to Season II under I0 (from 21.7 to 20.5 g 100 g−1 FW) and I100 (from 17.3 to 18.0 g 100 g−1 FW) (Figure 3A). On the other hand, the latter irrigation regime also showed the strongest variations between Season I and Season II in terms of tuber protein content (which decreased from 8.6 to 7.8 g 100 g−1 DW) and tuber ash content (from 6.5 to 5.5 g 100 g−1 DW), whereas less marked variations in these quality traits were recorded under the I100-50 and I100-75 irrigation regimes (Figure 3B,C).
Figure 3. Dry matter (A), protein (B), and ash (C) contents as affected by the ‘irrigation regime × growth season’ interaction. *: significant at p = 0.05.
Agronomy 15 01019 g003
Regardless of irrigation regimes and seasons, ‘Arinda’ compared to ‘Timate’ produced tubers with a higher mean weight (125 vs. 102 g) and protein content (8.2 vs. 7.6 g 100 g−1 DW), but lower starch (15.0 vs. 18.0 g 100 g−1 FW), dry matter (18.3 vs. 20.4 g 100 g−1 FW), and reducing sugar contents (0.14 vs. 0.16 g 100 g−1 FW) (Table 4). On the other hand, compared to Season II, in Season I, both cultivars produced tubers with higher mean tuber weight (129 vs. 98 g), starch (16.7 vs. 16.3 g 100 g−1 FW), protein (8.1 vs. 7.7 g 100 g−1 DW), and ash contents (6.0 vs. 5.4 g 100 g−1 DW) (Table 4).

3.3. Multivariate Analysis

The results of the multivariate analysis (conducted separately for Seasons I and II) are shown in Table 5 and Figure 4.
Table 5. Correlation coefficients for each variable with respect to the first 2 principal components, eigenvalues, relative and cumulative proportion of explained variance.
Variable Common Principal Component Coefficients
Season ISeason II
PC1PC2PC1PC2
Mean tuber weight−0.4640.1940.467−0.052
Starch 0.4230.024−0.4370.165
Dry matter 0.4940.061−0.4560.223
Protein −0.4250.0120.3940.438
Reducing sugars0.1340.9610.237−0.714
Ash−0.4050.183−0.414−0.468
Eigenvalue 3.991.084.151.26
Variability66.6%16.4%69.2%21.1%
Accumulated variability66.6%83.0%69.2%90.3%
Figure 4. PCA score plots (A,C) and HCA dendrograms (B,D) obtained in each growth season on the basis of the considered tuber traits. Circles: ‘Arinda’; squares: ‘Timate’.
Agronomy 15 01019 g004
In both seasons, the first two components had eigenvalues >1, explaining 83.0% (Season I) and 90.3% (Season II) of the total variance. In Season I, strong positive correlations were observed for tuber dry matter, starch, and reducing sugars (PC1), as well as for reducing sugars, mean tuber weight, and ash content (PC2). Negative correlations in PC1 were found for mean tuber weight, protein, and ash content (Table 5). In Season II, PC1 showed mainly positive correlations for mean tuber weight, protein, and reducing sugars; PC2 for protein, dry matter, and starch. Negative correlations were found in PC1 for dry matter, starch, and ash content, and in PC2 for reducing sugars, ash content, and mean tuber weight (Table 5).
The score plot for Season I separated the treatments into two main groups, primarily along PC1 (Figure 4A). The most distinct clusters on the right side of PC1 included Arinda-I0 and Timate-I0 (due to higher dry matter and starch contents) and Timate-I100-0 (due to its higher tuber-reducing sugar content). The HCA dendrogram showed that the remaining main cluster was divided into two subclusters (Figure 4B), whose separation, except for Arinda-I100, was mainly genotype-dependent, as it mirrored the higher mean tuber weight and protein content observed in ‘Arinda’. The Season II score plot (Figure 4C) identified two main groups. The first group, lying on the positive side of PC1, included Arinda-I100, Arinda-I100-75, and Arinda-I100-50, associated with higher mean tuber weight, protein, and reducing sugar contents. The second group, more heterogeneous, was divided into two subgroups by cluster analysis (Figure 4D): one comprising Arinda-I100-0 and Timate-I100-0, and a second including the remaining treatments, with Timate-I0 being the most distinct thesis due to its high tuber dry matter, starch, and ash contents.

4. Discussion

Water is becoming increasingly scarce and costly, mostly in semi-arid regions, making the adoption of efficient irrigation strategies, such as deficit irrigation, essential for conserving water resources while maintaining high crop yields and product quality. This is particularly crucial for early potato crops, which require substantial water input to meet the qualitative standards required by markets. Indeed, early potatoes are highly sensitive to water deficits, necessitating careful water management to balance resource efficiency with optimal production quality. The present study clearly demonstrates that different irrigation regimes derived from dynamic deficit irrigation had a significant impact on tuber weight and the nutritional composition of potato tubers.
In Season I, the I100-50 regime, from sampling II (59 DAE) onward, produced tubers with mean tuber weight, starch, dry matter, protein, and ash contents statistically similar to those of fully irrigated (I100) plots. It is well-established that adequate water availability throughout tuber growth increases leaf size and leaf area duration, resulting in enhanced light interception and assimilating translocation to tubers [37]. This suggests that, in our experiment, the supply of 50% ETm in the second part of tuber growth did not cause any significant stress conditions to the plants. Differently, compared to I100, the I100-0 regime led to higher starch and dry matter contents during tuber growth but resulted in marginally lower tuber weight, protein, and ash contents. Although statistically significant, the small magnitude of the reductions we recorded is consistent with the known lower sensitivity of the late tuber bulking stage in potatoes to water stress [7,14,27]. During Season II, no significant differences in tuber weight or nutritional composition were observed among the irrigated treatments (I100-0, I100-50, I100-75, and I100) throughout the tuber growth period. Indeed, all irrigated plots, irrespective of the specific regime, demonstrated an average increase in weight, starch, and dry matter and a reduction in protein content relative to I0. This could be attributed to the high rainfall in April (160 mm) in Season II, which likely met the plants’ water requirements, thereby reducing the differences in water availability between the various irrigation regimes and minimizing their impact on tuber quality traits assessed through samplings carried out from 59 to 85 DAE (i.e., from 2 to 28 May). The April rain likely reset the evaporation readings from the Class A pan evaporimeter at least twice. Consequently, in Season II, fewer irrigation events were needed compared to Season I, further reducing the differences between irrigation regimes. In addition, regardless of irrigation regimes, throughout tuber growth, Season II tubers were characterized by significantly lower mean tuber weight, starch, dry matter, protein, and ash contents compared to Season I. The cooler temperatures experienced in Season II may be responsible for the longer time necessary for the conversion of intercepted radiation into dry matter [7]. Indeed, temperature is known to influence key physiological and biochemical processes—such as photosynthesis, respiration, and transpiration—that ultimately affect the rate of nutrient accumulation in potato tubers [5]. Furthermore, adequate water availability is crucial to sustain transpiration and metabolic activities during potato development, whereas imbalances such as flooding or drought can negatively impact nutrient formation and partitioning [38]. In both seasons, the reducing sugar content was not affected by the irrigation regimes but varied throughout tuber growth, decreasing from sampling I to IV. This was accompanied by a progressive increase in mean tuber weight, starch, and dry matter contents, highlighting the continuous growth and maturation of the tubers. Indeed, once carbohydrate accumulation is complete, the tubers fully develop their solid matter and convert sugars into starch [3]. Consistent with previous studies [27], in this experiment, protein and ash contents showed a declining trend throughout tuber growth. This observation is crucial for off-season potatoes, whose tubers are often harvested before full maturity [39]. The resulting high sugar content in these early tubers enhances flavor but limits their use in frying and baking; in addition, the low starch content affects the nutritional value and culinary properties, such as crispness and browning during frying [40]. However, the high reducing sugar content and low starch of early tubers do not compromise their marketability because, as is known, they are intended for fresh consumption rather than processing. Indeed, their popularity is high in certain culinary uses (boiling, salads, and stews) where browning and acrylamide formation are not concerns [3]. The effects of dynamic deficit irrigation regimes throughout tuber growth were evident in tuber weight and nutritional composition at the final harvest. Irrespective of season and cultivar, the I100, I100-75, and I100-50 regimes yielded the highest mean tuber weight at the final harvest. Instead, the I100-0 regime reduced the mean tuber weight compared to I100 by only about 14%. This aligns with findings by other researchers who, after imposing a two-week water deficit during bulking, observed that its impact on tuber size was less significant than deficits at vegetative or tuberization stages [21]. In both seasons, the I100 and I100-75 regimes showed similarly low starch content. Conversely, I100-0 increased the starch content by 23% compared to I100, consistent with previous research carried out in the same environment [27]. Our findings align with those of other authors who reported an increase in starch content under water stress conditions or with decreasing irrigation volumes [15,16,22]. On the other hand, these results diverge from previous studies that reported either higher starch content in irrigated treatments compared to dry controls or no significant differences in starch levels [19,24,41,42]. These discrepancies suggest that the relationship between soil water availability and starch accumulation in tubers may be influenced by additional factors such as genotypic differences, environmental conditions, or irrigation management practices. In our experiment, a similar pattern was observed for tuber dry matter, with no significant variations among the I100, I100-50, and I100-75 regimes. These results are consistent with findings indicating that irrigation regimes of 100%, 75%, and 50% of ET, when applied during the late tuber bulking and maturation stages, do not significantly affect dry matter content [17]. In contrast, the I100-0 regime resulted in a 10% increase in tuber dry matter, corroborating findings from research that implemented a two-week irrigation cessation during tuber bulking and ripening [11] and studies that demonstrated increased dry matter content following water supply reduction after tuberization [16]. Moreover, these findings align with previous studies that reported that prolonged water deficit throughout the growth period resulted in the highest tuber-specific gravity [15,23,43]. Our results indicate that variations in tuber dry matter content were primarily influenced by the total amount of water received, in accordance with other authors [8,44]. The ash content, indicative of total mineral content in potato tubers, showed no significant variations among the irrigated regimes (I100, I100-0, I100-50, and I100-75). However, a substantial increase in ash content was observed in all irrigated treatments relative to I0, suggesting that frequent irrigation promotes favorable soil moisture conditions, thereby facilitating nutrient absorption by the crop [45]. This indicates that the implementation of the I100-0 regime, rather than I100, enables a water saving of approximately 150 mm on average (equivalent to 1500 m3 ha−1 per season) while preserving elevated ash content. This is advantageous for human nutrition, given that potatoes provide many essential minerals in the human diet [3]. Similarly, the I100-0 regime, compared to I100, typically improves tuber quality by increasing both dry matter content (which enhances texture and crispiness in fried products while minimizing susceptibility to mechanical damage during harvesting and transportation) and starch content (which yields a fluffy, mealy texture suitable for baking, mashing, and frying) [40]. Tuber protein content under the I100-0 regime was comparable to the dry control (I0), whereas the highest protein levels were consistently observed in I100, I100-50, and I100-75. This suggests that deficit irrigation regimes supplying 75% or 50% of water during the later stages of tuber development can optimize protein content for nutritional benefits. These findings are consistent with research demonstrating a significant reduction in tuber protein content with water deficit during tuber expansion [22] and a decrease in protein levels with declining irrigation [19,23,46]. Nonetheless, our current results diverge from other research that reported significant increases in crude protein under both moderate and severe stress conditions [24], as well as from our prior investigation where the I100-0 irrigation regime yielded comparable protein levels to full irrigation [27]. These discrepancies highlight the complexity of the relationship between irrigation, nitrogen uptake, and protein accumulation in potatoes, suggesting that other factors, such as soil type, fertilization strategies, and cultivar differences, may influence the final protein content in tubers. Reducing sugar content, both during tuber growth and at final harvest, was not significantly affected by irrigation regimes. This contradicts findings by other researchers [19,22,23,24,25,47,48] who observed a trend of decreasing sugars with increased water application, and vice versa. These contrasting findings suggest that the impact of irrigation regimes on sugar accumulation is likely genotype-dependent, emphasizing the need for cultivar-specific studies to optimize potato irrigation.
Concerning the genotypes utilized, although both cultivars responded similarly to deficit irrigation, the study revealed significant differences between the two cultivars examined. Specifically, ‘Arinda’ displayed consistently higher mean tuber weight and protein content, while ‘Timate’ showed higher dry matter, starch, and sugar contents throughout all tuber sampling dates. This was expected, as ‘Arinda’ typically exhibits greater vigor, developing a larger canopy and root system than ‘Timate’, which shows traits indicative of a high tolerance to mild water deficit, a characteristic previously identified in ecophysiological studies [14].

5. Conclusions

This study provided data on the response of potato crops to dynamic deficit irrigation, aiming to determine whether irrigation water could be reduced without negatively affecting tuber growth and nutritional profile. The results highlighted that, compared to I100 (supplying 100% ETm from tuber initiation to the end of tuber growth), applying 100% ETm during the initial phase of tuber growth and reducing it to 50% ETm in the later phase resulted in a higher starch content while maintaining comparable mean tuber weight, dry matter, protein, reducing sugars, and ash content, saving up to 820 m3 ha−1 per season. Moreover, reducing irrigation to 0% ETm in the second phase of tuber growth led to a slight but non-drastic reduction in mean tuber weight compared to I100. However, it improved the nutritional composition of the tubers, increasing starch and dry matter contents while maintaining comparable levels of reducing sugars and ash, achieving water savings of up to 1500 m3 ha−1 per season. The two cultivars responded similarly to the different irrigation regimes. The findings of this study underscore the potential of dynamic deficit irrigation as a viable water-saving strategy in potato cultivation, particularly in semi-arid regions where water scarcity is a growing concern. By tailoring irrigation schedules to the crop’s phenological sensitivity—prioritizing water supply during critical growth stages such as early tuber bulking while allowing moderate deficits during less sensitive phases—dynamic deficit irrigation can maintain yield and tuber quality while significantly reducing water use. Moving forward, integrating dynamic deficit irrigation into precision irrigation planning and decision-support systems could enhance the sustainability of potato production. Future research and on-farm trials across different cultivars and agro-climatic zones will be essential to refine these strategies and promote their widespread adoption.

Supplementary Materials

The following supporting information can be downloaded at https://www.mdpi.com/article/10.3390/agronomy15051019/s1, Table S1: F-values of the main factors and their interactions related to the observed variables, with the significance resulting from the ANOVA. Data refer to tubers’ growth before final harvest; Table S2: F-values of the main factors and their interactions related to the observed variables, with the significance resulting from the ANOVA. Data refer to tubers at final harvest.

Author Contributions

Investigation, A.I.; methodology, A.I. and R.P.M.; writing–original draft, A.I. and R.P.M.; writing–review and editing, A.I. and R.P.M.; supervision, A.I. All authors have read and agreed to the published version of the manuscript.

Funding

This research received no external funding.

Data Availability Statement

All data are available via email request to the corresponding author.

Acknowledgments

The authors are grateful to Alessandra Pellegrino (CNR-IBE) and Salvatore La Rosa (CNR-IBE) for their excellent technical assistance.

Conflicts of Interest

The authors declare no conflicts of interest.

References

  1. Zaheer, K.; Akhtar, M.H. Potato production, usage, and nutrition—A review. Crit. Rev. Food Sci. Nutr. 2016, 56, 711–721. [Google Scholar] [CrossRef] [PubMed]
  2. Faostat Crops and Livestock Products. Available online: https://www.fao.org/faostat/en/#data/QCL (accessed on 30 October 2023).
  3. Scavo, A.; Mauromicale, G.; Ierna, A. Genotype × environment interactions of potato tuber quality characteristics by AMMI and GGE biplot analysis. Sci. Hortic. 2023, 310, 111750. [Google Scholar] [CrossRef]
  4. Leo, L.; Leone, A.; Longo, C.; Lombardi, D.A.; Raimo, F.; Zacheo, G. Antioxidant compounds and antioxidant activity in ‘early potatoes’. J. Agric. Food Chem. 2008, 56, 4154–4163. [Google Scholar] [CrossRef]
  5. Kita, A. The influence of potato chemical composition on crisp texture. Food Chem. 2002, 76, 173–179. [Google Scholar] [CrossRef]
  6. Harris, P.M. Water. In The Potato Crop; Harris, P.M., Ed.; Springer: Boston, MA, USA, 1978; pp. 244–277. [Google Scholar]
  7. Ierna, A.; Mauromicale, G. Tuber yield and irrigation water productivity in early potatoes as affected by irrigation regime. Agric. Water Manag. 2012, 115, 276–284. [Google Scholar] [CrossRef]
  8. Fabeiro, C.; Martín De Santa Olalla, F.; De Juan, J.A. Yield and size of deficit irrigated potatoes. Agric. Water Manag. 2001, 48, 255–266. [Google Scholar] [CrossRef]
  9. Onder, S.; Caliskan, M.E.; Onder, D.; Caliskan, S. Different irrigation methods and water stress effects on potato yield and yield components. Agric. Water Manag. 2005, 73, 73–86. [Google Scholar] [CrossRef]
  10. Geerts, S.; Raes, D. Deficit irrigation as an on-farm strategy to maximize crop water productivity in dry areas. Agric. Water Manag. 2009, 96, 1275–1284. [Google Scholar] [CrossRef]
  11. Karam, F.; Amacha, N.; Fahed, S.; EL Asmar, T.; Domínguez, A. Response of potato to full and deficit irrigation under semiarid climate: Agronomic and economic implications. Agric. Water Manag. 2014, 142, 144–151. [Google Scholar] [CrossRef]
  12. Ahmadi, S.H.; Agharezaee, M.; Kamgar-Haghighi, A.A.; Sepaskhah, A.R. Effects of dynamic and static deficit and partial root zone drying irrigation strategies on yield, tuber sizes distribution, and water productivity of two field grown potato cultivars. Agric. Water Manag. 2014, 134, 126–136. [Google Scholar] [CrossRef]
  13. Badr, M.A.; El-Tohamy, W.A.; Salman, S.R.; Gruda, N. Yield and water use relationships of potato under different timing and severity of water stress. Agric. Water Manag. 2022, 271, 107793. [Google Scholar] [CrossRef]
  14. Ierna, A.; Mauromicale, G. Eco-physiological and productive response of deficit irrigated potatoes. Agronomy 2023, 13, 591. [Google Scholar] [CrossRef]
  15. Alenazi, M.; Wahb-Allah, M.A.; Abdel-Razzak, H.S.; Ibrahim, A.A.; Alsadon, A. Water regimes and humic acid application influences potato growth, yield, tuber quality and water use efficiency. Am. J. Potato Res. 2016, 93, 463–473. [Google Scholar] [CrossRef]
  16. Wegener, C.B.; Jürgens, H.U.; Jansen, G. Drought stress affects nutritional and bioactive compounds in potatoes (Solanum tuberosum L.) relevant to human health. Funct. Foods Health Dis. 2017, 7, 17–35. [Google Scholar] [CrossRef]
  17. Muttucumaru, N.; Powers, S.J.; Elmore, J.S.; Mottram, D.S.; Halford, N.G. Effects of water availability on free amino acids, sugars, and acrylamide-forming potential in potato. J. Agric. Food Chem. 2015, 63, 2566–2575. [Google Scholar] [CrossRef]
  18. Ahmadi, S.H.; Agharezaee, M.; Kamgar-Haghighi, A.A.; Sepaskhah, A.R. Water-saving irrigation strategies affect tuber water relations and nitrogen content of potatoes. Int. J. Plant Prod. 2016, 10, 275–288. [Google Scholar] [CrossRef]
  19. Carli, C.; Yuldashev, F.; Khalikov, D.; Condori, B.; Mares, V.; Monneveux, P. Effect of different irrigation regimes on yield, water use efficiency and quality of potato (Solanum tuberosum L.) in the lowlands of Tashkent, Uzbekistan: A field and modeling perspective. Field Crops Res. 2014, 163, 90–99. [Google Scholar] [CrossRef]
  20. Crosby, T.W.; Wang, Y. Effects of different irrigation management practices on potato (Solanum tuberosum L.). Sustainability 2021, 13, 10187. [Google Scholar] [CrossRef]
  21. Günel, E.; Karadoǧan, T. Effect of irrigation applied at different growth stages and length of irrigation period on quality characters of potato tubers. Potato Res. 1998, 41, 9–19. [Google Scholar] [CrossRef]
  22. Li, F.; Deng, H.; Wang, Y.; Li, X.; Chen, X.; Liu, L.; Zhang, H. Potato growth, photosynthesis, yield, and quality response to regulated deficit drip irrigation under film mulching in a cold and arid environment. Sci. Rep. 2021, 11, 15888. [Google Scholar] [CrossRef]
  23. Li, S.; Kupriyanovich, Y.; Wagg, C.; Zheng, F.; Hann, S. Water deficit duration affects potato plant growth, yield and tuber quality. Agriculture 2023, 13, 2007. [Google Scholar] [CrossRef]
  24. Wagg, C.; Hann, S.; Kupriyanovich, Y.; Li, S. Timing of short period water stress determines potato plant growth, yield and tuber quality. Agric. Water Manag. 2021, 247, 106731. [Google Scholar] [CrossRef]
  25. Zhang, H.; Chen, X.; Xue, D.; Zhang, W.; Li, F.; Teng, A.; Zhang, C.; Lei, L.; Ba, Y. Dry matter accumulation, water productivity and quality of potato in response to regulated deficit irrigation in a desert oasis region. Plants 2024, 13, 1927. [Google Scholar] [CrossRef] [PubMed]
  26. Elhani, S.; Haddadi, M.; Csákvári, E.; Zantar, S.; Hamim, A.; Villányi, V.; Douaik, A.; Bánfalvi, Z. Effects of partial root-zone drying and deficit irrigation on yield, irrigation water-use efficiency and some potato (Solanum tuberosum L.) quality traits under glasshouse conditions. Agric. Water Manag. 2019, 224, 105745. [Google Scholar] [CrossRef]
  27. Ierna, A.; Mauromicale, G. How irrigation water saving strategy can affect tuber growth and nutritional composition of potato. Sci. Hortic. 2022, 299, 111034. [Google Scholar] [CrossRef]
  28. USDA (United States Department of Agriculture). Soil Taxonomy—A Basic System of Soil Classification for Making and Interpreting Soil Surveys, 2nd ed.; Natural Resources Conservation Service, Ed.; Superintendent of Documents, U.S. Government Printing Office: Washington, DC, USA, 1999. [Google Scholar]
  29. Violante, P. (Ed) Metodi di Analisi Chimica del Suolo; Franco Angeli Editore: Milano, Italy, 2000; ISBN 8846422406. [Google Scholar]
  30. Hack, H.; Gal, H.; Klemke, T.H.; Klose, R.; Meier, U.; Stauss, R.; Witzenberger, A. The BBCH scale for phenological growth stages of potato (Solanum tuberosum L.). In Growth Stages of Mono-and Dicotyledonous Plants BBCH Monograph; Meier, U., Ed.; Federal Biological Research Centre for Agriculture and Forestry: Berlin, Germany, 2001; pp. 7–16. ISBN 2738004997. [Google Scholar]
  31. Doorenbos, J.; Kassam, A.H. Yield Response to Water; FAO Irrigation and Drainage Paper No. 33; Food and Agriculture Organization of the United Nations: Rome, Italy, 1979; ISBN 92-5-100744-6. [Google Scholar]
  32. AOAC Official Methods of Analysis, 22nd Edition (2023)—AOAC INTERNATIONAL. Available online: https://www.aoac.org/official-methods-of-analysis/ (accessed on 4 March 2025).
  33. Jain, A.; Jain, R.; Jain, S. Quantitative analysis of reducing sugars by 3, 5-dinitrosalicylic acid (DNSA method). In Basic Techniques in Biochemistry, Microbiology and Molecular Biology; Humana: New York, NY, USA, 2020; pp. 181–183. ISBN 978-1-4939-9861-6. [Google Scholar]
  34. Shapiro, S.S.; Wilk, M.B. An analysis of variance test for normality (complete samples). Biometrika 1965, 52, 591–611. [Google Scholar] [CrossRef]
  35. Levene, H. Robust tests for equality of variances. In Contributions to Probability and Statistics: Essays in Honor of Harold Hotelling; Olkin, I., Ed.; Stanford University Press: Palo Alto, CA, USA, 1960; pp. 278–292. [Google Scholar]
  36. Snedecor, G.W.; Cochran, W.G. Statistical Methods; Wiley-Blackwell: Hoboken, NJ, USA, 2021; ISBN 9780128230435. [Google Scholar]
  37. Jefferies, R.A. Responses of potato genotypes to drought. I. Expansion of individual leaves and osmotic adjustment. Ann. Appl. Biol. 1993, 122, 93–104. [Google Scholar] [CrossRef]
  38. Muller, C.; Pretorius, B.; Schönfeldt, H.C. Evaluating the effect of external conditions on the quality attributes of potatoes. Potato Res. 2023, 66, 525–542. [Google Scholar] [CrossRef]
  39. Mustonen, L. Yield formation and quality characteristics of early potatoes during a short growing period. Agric. Food Sci. 2004, 13, 390–398. [Google Scholar] [CrossRef]
  40. Yari, A.; Gilbert, L.; Madramootoo, C.A.; Woods, S.A.; Adamchuk, V.I. Optimum irrigation strategy to maximize yield and quality of potato: A case study in southern Alberta, Canada. Irrig. Drain. 2021, 70, 609–621. [Google Scholar] [CrossRef]
  41. Jefferies, R.A.; Mackerron, D.K.L. Responses of potato genotypes to drought. II. Leaf area index, growth and yield. Ann. Appl. Biol. 1993, 122, 105–112. [Google Scholar] [CrossRef]
  42. Ávila-Valdés, A.; Quinet, M.; Lutts, S.; Martínez, J.P.; Lizana, X.C. Tuber yield and quality responses of potato to moderate temperature increase during Tuber bulking under two water availability scenarios. Field Crops Res. 2020, 251, 107786. [Google Scholar] [CrossRef]
  43. Chang, D.C.; Jin, Y.I.; Nam, J.H.; Cheon, C.G.; Cho, J.H.; Kim, S.J.; Yu, H.S. Early drought effect on canopy development and tuber growth of potato cultivars with different maturities. Field Crops Res. 2018, 215, 156–162. [Google Scholar] [CrossRef]
  44. Shock, C.C.; Holmes, Z.A.; Stieber, T.D.; Eldredge, E.P.; Zhang, P. The effect of timed water stress on quality, total solids and reducing sugar content of potatoes. Am. Potato. J. 1993, 70, 227–241. [Google Scholar] [CrossRef]
  45. Wang, F.X.; Wu, X.X.; Shock, C.C.; Chu, L.Y.; Gu, X.X.; Xue, X. Effects of drip irrigation regimes on potato tuber yield and quality under plastic mulch in arid Northwestern China. Field Crops Res. 2011, 122, 78–84. [Google Scholar] [CrossRef]
  46. He, M.; Dijkstra, F.A. Drought effect on plant nitrogen and phosphorus: A meta-analysis. New Phytol. 2014, 204, 924–931. [Google Scholar] [CrossRef] [PubMed]
  47. Eldredge, E.P.; Holmes, Z.A.; Mosley, A.R.; Shock, C.C.; Stieber, T.D. Effects of transitory water stress on potato tuber stem-end reducing sugar and fry color. Am. Potato J. 1996, 73, 517–530. [Google Scholar] [CrossRef]
  48. Abbas, H.; Ranjan, R.S. Effect of soil moisture deficit on marketable yield and quality of potatoes. Can. Biosyst. Eng. 2015, 57, 1.25–1.37. [Google Scholar] [CrossRef]
Table 1. List of irrigation regimes, water supplied, and number of irrigations during both seasons.
CodeIrrigation RegimeSeason ISeason II
WA 1N 2WAN
I0Irrigation only at plant emergence301301
I100Irrigation supplying 100% of ETm from tuber initiation up to the end of tuber growth272102289
I100-0The supply of 100% ETm from tuber initiation up to 50% tuber growth, then no irrigation up to the end of the tuber growth10261006
I100-50ETm supplied from tuber initiation to 50% tuber growth and then 50% ETm supplied up to end of the tuber growth178101589
I100-75ETm supplied from tuber initiation to 50% tuber growth and then 75% ETm supplied up to end of the tuber growth224101939
1 water applied (mm); 2 number of irrigations.
Table 2. Monthly maximum and minimum air temperatures (°C) and total rainfall (mm) recorded during the growing seasons and long-term period (1987–2016).
Season January February MarchApril May June
TmaxI16.215.420.721.225.327.9
II15.211.316.318.025.131.9
Long-term15.815.917.620.424.429.2
TminI9.77.211.011.615.018.7
II7.36.69.110.715.420.8
Long-term8.58.49.412.015.319.5
RainfallI6233119170
II1161343161100
Long-term857773322410
Disclaimer/Publisher’s Note: The statements, opinions and data contained in all publications are solely those of the individual author(s) and contributor(s) and not of MDPI and/or the editor(s). MDPI and/or the editor(s) disclaim responsibility for any injury to people or property resulting from any ideas, methods, instructions or products referred to in the content.

