Article

Optimized Agronomic Management in North China Plain to Maintain Wheat (Triticum aestivum L.) Yield While Reducing Water and Fertilizer Inputs

by
Jiayu Ma
1,
Chong Shang
1,
Xuecheng Zhang
1,
Baozhong Yin
2,* and
Wenchao Zhen
1,*
1
State Key Laboratory of North China Crop Improvement and Regulation/Key Laboratory of North China Water-Saving Agriculture, Ministry of Agriculture and Rural Affairs/Key Laboratory of Crop Growth Regulation of Hebei Province/College of Agronomy, Hebei Agricultural University, Baoding 071001, China
2
College of Plant Protection, Hebei Agricultural University, Baoding 071001, China
*
Authors to whom correspondence should be addressed.
Agronomy 2025, 15(5), 1053; https://doi.org/10.3390/agronomy15051053
Submission received: 1 April 2025 / Revised: 18 April 2025 / Accepted: 24 April 2025 / Published: 27 April 2025
(This article belongs to the Section Water Use and Irrigation)

Abstract

:
Optimizing farmers’ crop production management is an effective strategy to synergize yields, resource utilization, and environmental conservation. However, the mechanisms by which agronomic management in the North China Plain (NCP) determines the wheat yield, water use efficiency (WUE), and physiological performance remain largely unexplored. To address this knowledge gap, a field experiment was conducted from 2022 to 2024 to investigate the effects of conventional farmer practices (CK) and a Integrated High-Yield and Efficiency Cultivation Management (HHL) strategy incorporating pre-sowing soil moisture creation, optimized tillage, fertilization, and irrigation on the yield, water consumption characteristics, leaf photosynthetic physiology, and root traits. The results demonstrated that HHL significantly enhanced the root morphology in winter wheat compared to CK. Specifically, HHL increased the net photosynthetic rate (Pn), chlorophyll content, and leaf area index (LAI) at the flowering stage by 20.5%, 8.8%, and 11.1%, respectively, thereby boosting dry matter accumulation by 40.3% and yields by 10.9%. Furthermore, HHL reduced soil water evaporation by 12.1% and the total water consumption by 112.1 mm, while improving the WUE by 25.4% and nitrogen fertilizer partial productivity by 38.7%, alongside a 12.5% increase in economic benefits. Through rigorous field experimentation, this study elucidates the potential of HHL in water conservation, yield enhancement, and comprehensive benefit improvement, offering an effective cultivation paradigm for the wheat production systems in the NCP. The findings indicate that this management strategy exhibits superior water-saving and yield-enhancing effects, with promising prospects for widespread adoption and application.

1. Introduction

The North China Plain (NCP) constitutes 71% of winter wheat production in China. During the wheat growing season (October–June), the region receives merely 20–30% of its total annual precipitation (60–180 mm), which satisfies only 25–40% of the crop’s water requirements [1]. Consequently, spring drought has emerged as the primary limiting factor for winter wheat cultivation in this agroecosystem [2]. Supplemental irrigation during spring is indispensable in sustaining optimal growth and yield potential. Approximately 70% of irrigation water is derived from groundwater sources to meet agricultural demands [3]. However, decades of excessive groundwater extraction for irrigation have led to severe hydrological consequences, including aquifer depletion, soil degradation, and ecological deterioration [4]. Concurrently, nitrogen (N) management represents another critical determinant of grain production [5]. The prevailing agricultural practices, characterized by intensive fertilization regimes, have resulted in substantial nitrogen leaching and elevated risks of groundwater contamination, primarily due to excessive nitrogen application and inefficient flood irrigation methodologies [1,6]. These dual challenges—groundwater overexploitation and nitrogen misuse—highlight the urgent need for more efficient and sustainable management strategies.
Considering these pressing challenges, the strategic management of water and nitrogen inputs is imperative to ensure sustainable resource utilization. Empirical evidence suggests that suboptimal resource allocation frequently contributes to yield gaps, whereas controlled water stress or multiple resource limitations may not necessarily compromise yields and could potentially enhance productivity under specific conditions [7]. In water-scarce regions, optimized crop management strategies have been demonstrated to enhance both the yield and resource use efficiency [8]. Consequently, a variety of targeted agronomic measures have been proposed and evaluated, each addressing a specific constraint in wheat production. For instance, adjusting the pre-sowing soil moisture levels has been suggested as a means to improve early seedling establishment and synchronize water use during critical growth periods [9]. Similarly, tillage optimization strategies (e.g., subsoiling tillage) enhance the root penetration capacity and delay root senescence [10]. Studies focusing on the timing and precision of fertilizer application have highlighted the potential benefits of combining drip irrigation with split nitrogen application, which enhance the nitrogen delivery efficiency and contribute to improved crop performance under limited water conditions [11].
While these individual practices are effective in isolation, their combined effects under an integrated high-yield, high-efficiency cultivation system remain insufficiently studied [12]. Integrated agronomic management systems, encompassing tillage practices, nutrient optimization, and water management strategies, have shown potential in addressing yield limitations that cannot be resolved through singular management approaches. For instance, such integrated systems have been shown to improve the summer maize productivity and nitrogen use efficiency through optimized canopy light interception and nitrogen partitioning [13]. Similarly, enhanced tiller development and biomass allocation have been associated with improved winter wheat yields and nitrogen utilization efficiency in the NCP [14]. These findings highlight the need to evaluate whether integrating effective individual practices can lead to synergistic improvements in wheat performance, particularly under water-limited conditions. However, the physiological and ecological mechanisms by which these combined management strategies influence crop outcomes remain poorly understood. In particular, the root system architecture and function play a central role in determining the water uptake capacity and ultimately the grain yield [15]. Key root traits—such as the length density, surface area, and physiological activity—directly affect the resource acquisition efficiency and indirectly modulate aboveground biomass accumulation and yield formation [16]. Despite their recognized importance, the mechanistic responses of root and physiological traits to different agronomic regimes—especially under integrated systems—remain inadequately characterized.
To address this knowledge gap, the present study conducted systematic field experimentation to (1) quantify the variations in physiological and root parameters across different cultivation systems and (2) elucidate the relationships between wheat’s physiological performance, yield potential, and resource use efficiency under varying management strategies.

2. Materials and Methods

2.1. Study Site

The experiment was conducted at the Xinji Experimental Station of Hebei Agricultural University (37.58° N, 115.47° E). The experimental area has a typical warm continental monsoon climate, with the rainfall mainly concentrated in summer (July to September). The average annual rainfall amount is 472.5 mm, the average annual temperature is 12.5 °C, the frost-free period is 188 days, and the average annual sunshine duration is 2571 h. Reliable meteorological statistics were obtained from the China Meteorological Data Network (http://data.cma.cn/) (accessed on 1 July 2024). The soil at the experimental station was classified as brown soil (USDA soil classification), with an average bulk density of 1.56 g cm−3. The surface layer (0–20 cm) of the experimental field had organic matter, total nitrogen, available potassium, and available phosphorus content of 14.2 g kg−1, 1.21 g kg−1, 120.6 mg kg−1, and 23.8 mg kg−1, respectively. The initial soil pH was 7.6. Before the experiment, summer maize was planted before wheat each year. The experimental area was equipped with an automatic weather station to record daily climate data, including precipitation, solar radiation, temperature, wind speed, relative humidity, and standard atmospheric pressure data. The daily average temperature and precipitation during the wheat growing seasons from 2022 to 2024 are shown in Figure 1.

2.2. Experimental Design and Field Management

The experimental design comprised two distinct agronomic management strategies, with each treatment plot measuring 80 m2 (4 m × 20 m), arranged in a completely randomized design with three replicates. The winter wheat cultivar ML1 (Jishenmai 20218011) was selected as the test variety. Two experimental treatments were implemented: (1) conventional cultivation management (CK) according to the local farmers’ irrigation, fertilization, and tillage methods; (2) Integrated High-Yield and Efficiency Cultivation Management (HHL), consisting of optimized farming methods, irrigation, and fertilizer application. Details of the different tillage methods and irrigation and fertilizer management are shown in Table 1. Both cultivation cycles were initiated on 10 October with a planting density of 3.75 × 10⁶ plants ha−1, concluding with harvests on 10 June 2023 and 7 June 2024.

2.3. Sampling and Laboratory Analysis

2.3.1. Root Physiological and Ecological Indicators

Root sampling was conducted at critical phenological stages, including overwintering, regreening, jointing, flowering, milking, and maturing. A stratified sampling protocol was implemented using rectangular quadrats to select 20 cm sample segments of uniformly growing plants within the same row, extending 0.5 times the plant spacing in both the length and width directions. The root systems were excavated in two soil layers (0–20 cm and 20–40 cm), meticulously cleaned to remove impurities, and subsequently scanned for phenotypic analysis. Root morphological parameters, including the root length and surface area, were quantified using the WinRHIZO analysis software (version 2021a; Regent Instruments Inc., Québec, QC, Canada). The root length density (RLD, cm cm−3), root mass density (RMD, mg cm−3), root surface area density (RSD, cm2 cm−3), and root-to-shoot ratio were calculated as follows:
R L D = R o o t   l e n g t h S o i l   v o l u m e
R M D = R o o t   d r y   w e i g h t S o i l   v o l u m e
R S D = R o o t   s u r f a c e   a r e a S o i l   v o l u m e
Root physiological activity was assessed through multiple analytical approaches. The root reduction capacity was determined using the triphenyl tetrazolium chloride (TTC) colorimetric method [20]. The root abscisic acid (ABA) content was quantified via high-performance liquid chromatography (HPLC) [21], while root nitrate reductase activity was measured using the sulfanilamide colorimetric method [22].

2.3.2. Aboveground Growth and Physiological Parameter Analysis

Aboveground samples were collected at key developmental stages, including overwintering (WS), regreening (RGS), jointing (JS), flowering (FS), milking (MKS), and maturing (MTS). Fully expanded flag leaves were excised, with the midribs removed, and finely sectioned. A 0.20 g subsample was immersed in 95% ethanol within a 50 mL amber volumetric flask and stored in darkness until complete chlorophyll extraction was achieved. The chlorophyll a content was determined spectrophotometrically [23]. The leaf area per plant was measured using a CI-203 leaf area meter (CID Bio-Science, Camas, WA, USA), and the population-level leaf area index (LAI) was derived. Photosynthetic rates were quantified using a LI-6800 portable photosynthesis system (LI-COR, Lincoln, NE, USA).

2.3.3. Flowering and Grain-Setting Characteristics

Spikelet development was monitored from the jointing stage using an EMZ dissecting microscope (Meiji Techno, Tokyo, Japan) at 3-day intervals. The developmental stages of the main stem florets were classified according to Waddington’s scale [24], with samples collected at five critical stages (W7.5, W8.5, W9, W9.5, and W10). At the flowering stage (W10), five uniformly developed plants per treatment (three replicates) were selected for detailed analysis. The main stem spikes were partitioned into basal (first four spikelets), middle (intermediate spikelets), and apical (terminal four spikelets) sections. Fertile florets, characterized by intact green anthers and feathery stigmas, were enumerated across spike sections, with the grain number per spikelet recorded at physiological maturity using standardized protocols [24].

2.3.4. Soil Water Use

Inter-row evaporation was quantified using micro-lysimeters (MLS) constructed according to Allen’s methodology [25]. MLS units were installed post-sowing, with daily soil mass measurements recorded. Soil cores were replaced every 3–5 days or following precipitation/irrigation events. The inter-row evaporation rate (Ei, mm d−1) was calculated as
E i = 10 × ( M i M i + 1 ) / S
where Mi and Mi + 1 represent the total soil mass (g) within the micro-lysimeter measured at 08:00 on consecutive days, and S denotes the soil surface area (cm2) within the micro-lysimeter.
The field total water consumption (ΔS, mm) was calculated based on soil moisture measurements conducted using a TRIME-PICO portable moisture meter (TDR, IMIKO, Essen, Germany). The soil water content was measured at 20 cm intervals from 0 to 200 cm depths at the beginning and end of specific growth stages. The calculation for ΔS is as follows:
S = 10 × ( θ t 1 θ t 2 ) × h i
where θt1 and θt2 represent the soil water content (%) at the beginning and end of the specific growth stage, and hi is the thickness of the soil layer (cm) at each interval.
Field water consumption was determined via the water balance method:
ET = ΔS + I + P0
where ET is the evapotranspiration (mm) during the growth of the succeeding crop; ΔS denotes the field total water consumption (mm); I is the total irrigation (mm); P0 is precipitation (mm); and K signifies groundwater recharge (mm). Given that the groundwater depth exceeded 2.5 m in the experimental area, K was considered negligible.
The water use efficiency (WUE, kg ha−1 mm−1) was calculated as
WUE = Y/ET
where Y represents the grain yield (kg ha−1).

2.3.5. Nitrogen Fertilizer Partial Productivity (PFPN) and Economic Benefit Evaluation

PFPN was calculated as
PFPN = Y/N
where Y denotes the grain yield (kg ha−1) and N signifies the total nitrogen fertilizer input (kg ha−1).
Economic inputs and outputs were evaluated based on local market prices (2022–2024). Economic benefits were calculated using the following formula:
Total investment = costs for fertilizers + tillage + pesticides + irrigation + labor + machinery;
Gross output = grain yield × market price of wheat;
Input–output ratio = gross output/total investment.

2.4. Statistical Analysis

Data were analyzed using SPSS 20.0 (IBM Corp., Armonk, NY, USA). An analysis of variance (ANOVA) was performed, with the treatment means compared using Fisher’s least significant difference (LSD) test at p < 0.05. Principal component analysis (PCA) was employed to elucidate the relationships between the leaf area index and root morphological characteristics.

3. Results

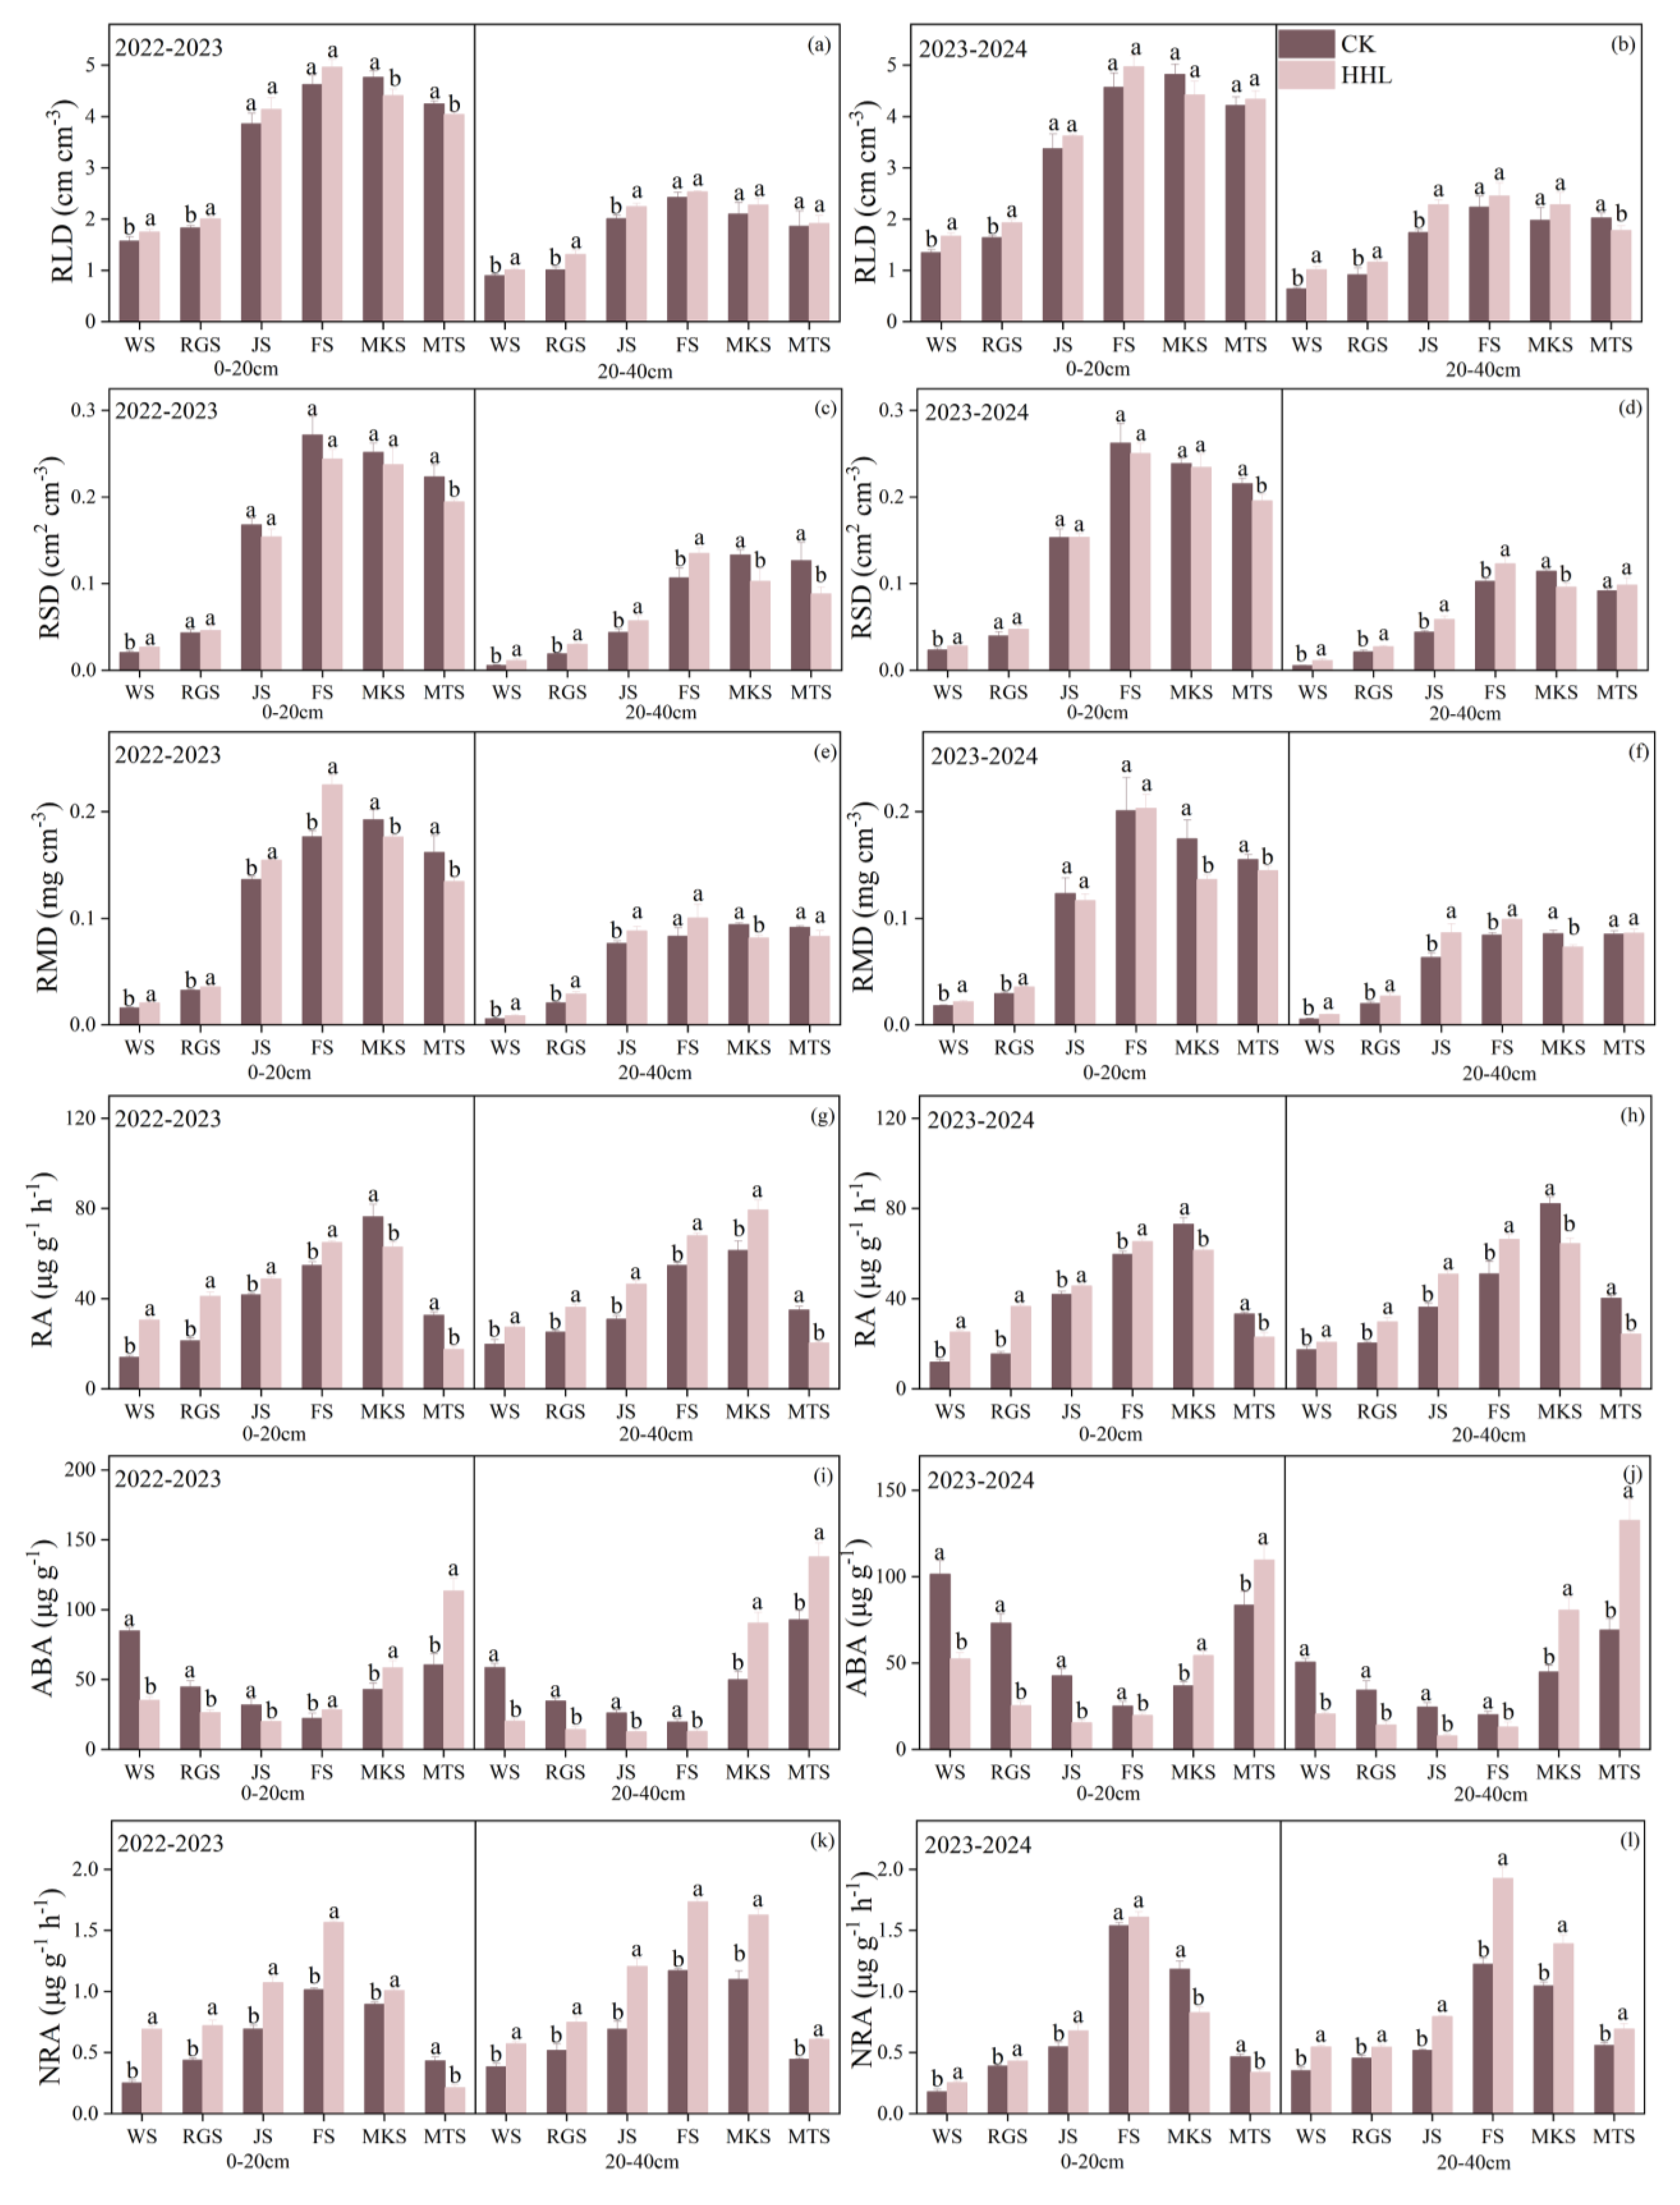
3.1. Effects of Different Agronomic Management Strategies on Wheat Root Traits

The HHL strategy improved the root morphology of wheat (Figure 2a–f). Compared to CK, the HHL strategy increased the RLD in the 0–20 cm layer at the WS, RGS, JS, and FS stages by 17.6%, 13.6%, 7.3%, and 8.0%, respectively, and increased the RLD in the 20–40 cm layer by 35.6%, 28.2%, 21.5%, and 7.0%, respectively. The RSD in the 20–40 cm layer at the WS, RGS, JS, and FS stages increased by 106.2%, 43.0%, 32.3%, and 23.2%, respectively. The RMD in the 0–40 cm layer from WS to FS increased by 4.0–68.7%.
The HHL strategy increased the root activity and nitrate reductase activity from WS to FS and simultaneously inhibited ABA synthesis (Figure 2g–l). Compared to CK, the HHL strategy increased RA in the 0–20 cm layer at the WS, RGS, JS, and FS stages by 115.1%, 114.2%, 12.9%, and 14.1%, respectively, and increased RA in the 20–40 cm layer by 28.4%, 44.9%, 45.4%, and 27.1%, respectively. The NRA in the 20–40 cm layer from WS to MTS increased by 29.7–52.7%. The ABA in the 0–40 cm layer from WS to FS decreased by 62.3%, 58.7%, 59.8%, and 34.9%, respectively.

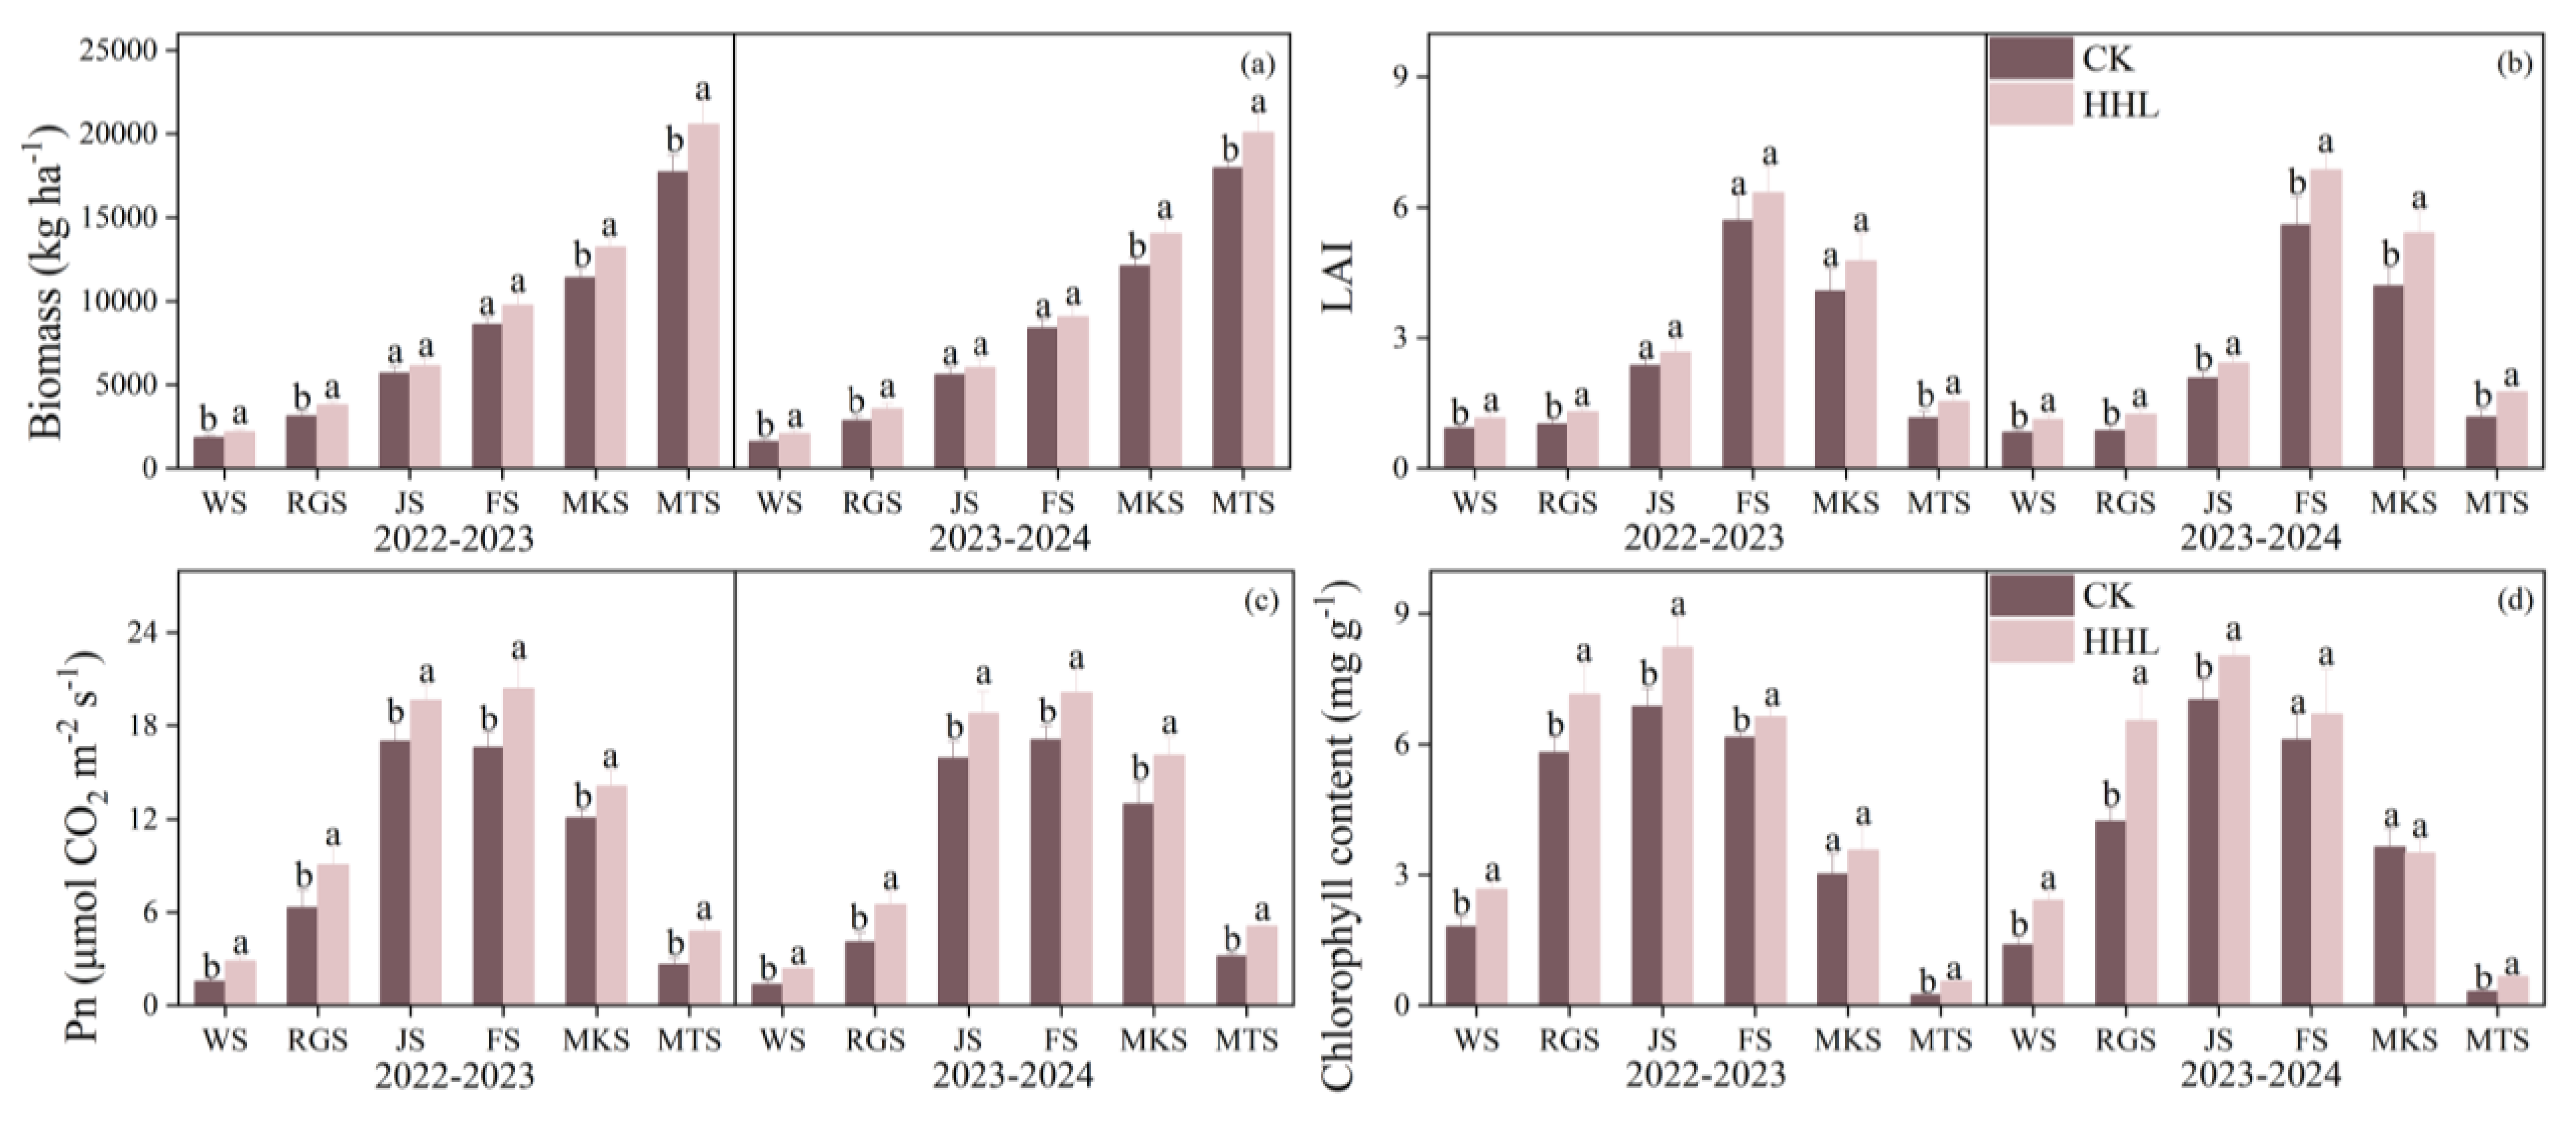
3.2. Population and Individual Growth and Physiology of Wheat Under Different Agronomic Management Strategies

In both wheat growing seasons, compared to the control, HHL significantly increased the Pn, chlorophyll content, leaf area index, and dry matter accumulation of wheat throughout the growing period (Figure 3a–d). Among them, the Pn, chlorophyll content, and LAI under HHL increased by 38.4%, 37.01%, and 33.47%, respectively, at the WS. The Pn, chlorophyll content, and LAI under HHL increased by 40.75%, 27.01%, and 26.37%, respectively, at the RGS. The Pn, chlorophyll content, and leaf area index at the flowering stage under HHL increased by 20.5%, 8.8%, and 11.1%, respectively. The final dry matter accumulation under HHL increased by 40.3%.

3.3. Water Consumption Characteristics of Wheat Fields Under Different Agronomic Management Strategies

Compared to CK, the HHL strategy significantly optimized the water use dynamics and reduced the total water consumption throughout the wheat growth period. During the sowing-to-wintering (SO–WS) phase, plant transpiration (PT) and field total water consumption (ΔS) under HHL increased, while, in the later stages—from the overwintering to jointing stage (WS–JS) and flowering stage to maturity stage (FS–MTS)—the inter-row soil evaporation rate (Ei) and ΔS were markedly reduced (Table 2). Specifically, during the SO–WS period, PT and ΔS under HHL decreased by 40.5% and 6.5%, respectively. In contrast, Ei was reduced by 38.2%, 14.4%, and 22.8% during the WS–JS, JS–FS, and FS–MTS, respectively. Meanwhile, ΔS during the WS–JS and FS–MTS periods declined by 20.0% and 19.2%, and PT during FS–MTS decreased by 18.6%. Moreover, regarding the sources and proportions of water consumption, the HHL strategy exhibited greater reliance on soil water storage, which contributed 26.8% to the total evapotranspiration—5.9% higher than that under the CK treatment (Table 3).

3.4. Yield Structure and Comprehensive Benefit Evaluation Under Different Agronomic Management Strategies

The numbers of spikelets and fertile spikelets of wheat in the HHL strategy were higher than those in the CK treatment, with an average increase of 6.5% and 8.2% over the two growing seasons (Table 4). The numbers of differentiated florets and fertile florets in the HHL strategy were significantly higher than those in the other treatments, both 1.2 times that of the conventional cultivation management (CK) treatment, but there was no significant difference in the proportion of floret degeneration among the treatments. The number of grains per spike and the number of grains in the HHL treatment were 6.2% and 6.7% higher than those in the CK treatment over the two years. The yield, water use efficiency, nitrogen fertilizer partial productivity, and economic benefits of the HHL treatment were 10.9%, 25.4%, 38.7%, and 12.5% higher than those of the CK treatment, respectively (Table 5 and Table 6).

3.5. Interaction Between Canopy and Roots Under Different Agronomic Management Strategies

The PCA analysis showed that the first two components explained 89.9%, 86.3%, 78.1%, 69.6%, 68.9%, and 87.9% of the total variation at the WS, RGS, JS, FS, MKS, and MTS, respectively (Figure 4). At the WS and RGS, the root characteristics (RSD, RWD, RA, RLD, and NRA) were positively correlated with the leaf characteristics (LAI, Pn, and Chla), as well as with the biomass, PFPN, WUE, and yield. At the MKS and MTS, the root characteristics (RSD, RWD, RA, RLD, and NRA) were negatively correlated with the leaf characteristics (LAI, Pn, and Chla), as well as with the biomass, PFPN, WUE, and yield. Under the same root morphological indicators per plant, the LAI of HHL was higher than that of CK (Figure 5). In addition, as the root morphological indicators per plant increased, the LAI of HHL increased more significantly than that of CK. For example, throughout the growing season, when the RMD decreased by one unit, CK and HHL decreased by 1.05, 0.06 kg ha−1, and 0.45%, respectively. The interaction between stems and roots showed that, compared to the CK treatment, the HHL treatment exhibited stronger resilience.

4. Discussion

4.1. Mechanisms of Water Saving and Yield Enhancement in Wheat Fields Under Different Agronomic Management Strategies

A suitable population structure can optimize the plant canopy distribution, increase the leaf area index, enhance light transmittance, and contribute to the full utilization of light energy and the extension of the photosynthetic functional period of leaves [26]. Numerous studies have shown that scientific management systems can improve the ability of crops to regulate the population structure, improve the canopy light distribution and light-receiving area, and significantly increase the leaf photosynthetic capacity at various growth stages [27,28,29]. In this study, although the annual water and nitrogen fertilizer use was reduced by 33.3% and 20.1%, respectively, the optimized irrigation and fertilization system increased the amount of nitrogen fertilizer applied later, achieving a high degree of matching between water and fertilizer inputs and plant nutrient requirements, greatly improving plant nutrient absorption, compensating for the growth disadvantages caused by reduced water and fertilizer inputs, and ultimately showing a higher leaf area index than the CK strategy. The leaf area index at the jointing and flowering stages significantly increased by 19.0–40.1% and 21.6–36.7%, respectively, laying the foundation for improvements in the net photosynthetic rate and chlorophyll content at various growth stages.
Subsoiling measures can improve the ecological conditions for root growth, promote root growth, and significantly increase the root dry weight [30,31]. Pressing and creating soil moisture after wheat sowing can ensure uniform wheat emergence, increase the root diameter, and ensure that the roots are in close contact with the soil, improving the absorption of soil nutrients [32]. This study showed that the optimized cultivation management strategy, HHL, which included pre-sowing soil moisture creation, optimized tillage, optimized fertilization, and optimized irrigation, could effectively ensure wheat root growth from sowing to regreening through fine tillage and scientific water and fertilizer coupling. It could also promote increases in the root surface area and length, facilitate dry matter accumulation, and improve the root activity and nitrate reductase activity, while simultaneously inhibiting ABA synthesis (Figure 2). This is of positive significance in ensuring the formation of sufficient populations and robust individuals to resist winter low-temperature stress. This also verifies the reports that pressing can mitigate the impacts of low temperatures [33]. Although the widespread distribution of roots in the surface soil helps crops to absorb more water and nutrients, under drought stress, this distribution pattern intensifies internal competition in plants, which may inhibit crop photosynthesis [34,35,36]. The results of this study showed that, after the flowering stage, the root surface area and dry matter accumulation under the HHL treatment were significantly limited, the root distribution decreased, and the root activity and nitrate reductase activity also decreased, which also explains why the photosynthetic rate of the HHL treatment was higher than that of the CK treatment after the flowering stage (Figure 3c). In addition, when considering the same root morphological indicators, the LAI of HHL was always higher than that of CK (Figure 5). The dynamic interaction between the stems and roots demonstrated the resilience of HHL.
This study observed and analyzed the flowering and grain setting characteristics of wheat, and the results showed that the HHL treatment could increase the numbers of spikes, fertile spikelets, and grains per spike of wheat and also promote floret differentiation and increase the proportion of fertile florets (Table 4). Previous studies have shown that the period from overwintering to jointing in winter wheat in the North China Plain is generally the spike differentiation and elongation stage to the floret primordium differentiation stage, which is the critical period for determining the number of spikes, grains, and florets [37]. The fine tillage measures in the HHL treatment fully ensured the growth of crop individuals at this stage, as evidenced by the aforementioned growth and physiological indicators, directly ensuring spikelet number differentiation and glume differentiation at the early stage of spike differentiation, forming sufficient spikelets and florets, and laying a good foundation for an increase in the number of grains per spike.

4.2. Comprehensive Benefit Evaluation of Wheat Fields Under Different Agronomic Management Strategies

Compared to the CK treatment, the HHL treatment reduced the total water consumption by 11.6% over the two growing seasons (Table 3). This reduction is attributed to the synergistic effects of the full incorporation of maize straw residues, single-pass deep tillage using a deep loosening rotary tiller, and pre- and post-sowing compaction [32]. These integrated practices collectively improved the soil structure, enhanced the porosity and water-holding capacity, and ultimately reduced the total field water consumption [38]. Additionally, the higher LAI of the HHL treatment during the sowing-to-wintering phase, which provided better soil coverage, was crucial in reducing soil evaporation [39]. Although the HHL strategy was designed to reduce the overall water input, lower water consumption does not inherently signify superior agronomic performance. Optimal water use should strike a balance between resource efficiency and crop physiological needs. For instance, during the sowing-to-wintering period, HHL utilized pre-sowing irrigation to regulate the soil moisture, ensuring sufficient water availability for uniform germination and early seedling development [9]. In contrast, the CK treatment lacked such regulation, resulting in lower water consumption at this stage, but possibly at the expense of suboptimal early growth. The increase in total water consumption under HHL during this period was primarily due to increased plant transpiration rather than the inter-row soil evaporation rate, as confirmed by our measurements (Table 2). This indicates that water was efficiently utilized for crop physiological functions rather than being lost through non-productive pathways.
Under limited irrigation conditions, increasing the planting density to construct a reasonable population structure; optimizing the varieties; rationally selecting the irrigation times, amounts, and timing; and adopting drip irrigation with integrated water and fertilizer can improve the water use efficiency by 14.2–39.2% [40,41,42,43]. This study found that the optimized cultivation management strategy, HHL, which included pre-sowing soil moisture creation, optimized tillage, optimized fertilization, and optimized irrigation, could ensure a yield comparable to that of conventional cultivation management, with an input reduction of CNY 460 per hectare. It could also save 60 mm of groundwater and reduce labor inputs by a factor of two, essentially achieving a balance between economic, ecological, and social benefits, with particularly outstanding ecological benefits (Table 6). Currently, the annual wheat planting area in the North China Plain exceeds 7 million hectares [44]. If this optimized cultivation management strategy can be adopted in wheat planting, it could save 420 million mm of groundwater resources annually and reduce labor inputs by 14 million, and it would also play an important role in conserving soil and water, purifying the air environment, and motivating farmers to cultivate. If more efficient tillage machinery can be developed in the future through the combination of agricultural machinery and agronomy, reducing the operating costs, this will further reduce the inputs and enhance the practicality and promotion value of this cultivation management strategy.

5. Conclusions

In wheat production systems in the North China Plain, the optimized cultivation management strategy, HHL, can effectively promote wheat root growth and development before regreening, improve its ability to resist stress, and further enable the aboveground part to obtain more water and nutrients at this stage. Thus, it effectively promotes growth and development, ensuring the formation of sufficient populations and robust individuals, laying a good foundation for resilience under water shortage stress in the later stage, and ultimately achieving water savings and high yields. It also reduces labor inputs, with broad application prospects in wheat production in the North China Plain.

Supplementary Materials

The following supporting information can be downloaded at: https://www.mdpi.com/article/10.3390/agronomy15051053/s1, Table S1: Soil bulk density and field water-holding capacity in different soil layers of 0–200 cm.

Author Contributions

J.M.: conceptualization, data curation, resources, investigation, software, visualization, writing–original draft. C.S.: writing—review and editing; X.Z.: data curation, investigation. B.Y.: conceptualization, formal analysis, writing—original draft, writing—review and editing. W.Z.: funding acquisition, supervision, writing—review and editing. All authors have read and agreed to the published version of the manuscript.

Funding

This work was supported by the National Key R&D Program of China (2023YFD2301502) and the Hebei Natural Science Foundation (C2023204182).

Data Availability Statement

The data included in this research are available upon request by contact with the corresponding author.

Conflicts of Interest

The authors declare that the research was conducted in the absence of any commercial or financial relationships that could be construed as a potential conflict of interest.

References

  1. Yuan, Y.; Lin, F.; Maucieri, C.; Zhang, Y. Efficient Irrigation Methods and Optimal Nitrogen Dose to Enhance Wheat Yield, Inputs Efficiency and Economic Benefits in the North China Plain. Agronomy 2022, 12, 273. [Google Scholar] [CrossRef]
  2. Liu, X.; Pan, Y.; Zhu, X.; Yang, T.; Bai, J.; Sun, Z. Drought evolution and its impact on the crop yield in the North China Plain. J. Hydrol. 2018, 564, 984–996. [Google Scholar] [CrossRef]
  3. Zhang, Z.; Lu, C. Spatio-Temporal Pattern Change of Winter Wheat Production and Its Implications in the North China Plain. Sustainability 2019, 1, 3028. [Google Scholar] [CrossRef]
  4. van Oort, P.A.J.; Wang, G.; Vos, J.; Meinke, H.; Li, B.G.; Huang, J.K.; van der Werf, W. Towards groundwater neutral cropping systems in the Alluvial Fans of the North China Plain. Agric. Water Manag. 2016, 165, 131–140. [Google Scholar] [CrossRef]
  5. Rahaman, M.A.; Zhan, X.; Zhang, Q.; Li, S.; Lv, S.; Long, Y.; Zeng, H. Ammonia Volatilization Reduced by Combined Application of Biogas Slurry and Chemical Fertilizer in Maize-Wheat Rotation System in North China Plain. Sustainability 2020, 12, 4400. [Google Scholar] [CrossRef]
  6. Liang, W.-L.; Carberry, P.; Wang, G.-Y.; Lü, R.-H.; Lü, H.-Z.; Xia, A.-P. Quantifying the yield gap in wheat-maize cropping systems of the Hebei Plain, China. Field Crops Res. 2011, 124, 180–185. [Google Scholar] [CrossRef]
  7. Zhang, M.-M.; Dong, B.-D.; Qiao, Y.-Z.; Shi, C.-H.; Yang, H.; Wang, Y.-K.; Liu, M.-Y. Yield and water use responses of winter wheat to irrigation and nitrogen application in the North China Plain. J. Integr. Agric. 2018, 17, 1194–1206. [Google Scholar] [CrossRef]
  8. Jin, L.; Hu, K.; Deelstra, J.; Li, B.; Wei, D.; Wang, H. Evaluation of nitrogen fate, water and nitrogen use efficiencies of winter wheat in North China Plain based on model approach. Acta Agric. Scand. Sect. B—Soil Plant Sci. 2014, 63, 127–138. [Google Scholar] [CrossRef]
  9. Baboev, S.; Kulmamatova, D. Influence of Pre-Sowing Irrigation on Seed Generation in Winter Wheat. BIO Web Conf. 2023, 78, 3014. [Google Scholar] [CrossRef]
  10. Yin, B.; Hu, Z.; Wang, Y.; Zhao, J.; Pan, Z.; Zhen, W. Effects of optimized subsoiling tillage on field water conservation and summer maize (Zea mays L.) yield in the North China Plain. Agric. Water Manage. 2021, 247, 106732. [Google Scholar] [CrossRef]
  11. Hou, Y.; Xu, X.; Kong, L.; Zhang, Y.; Zhang, L.; Wang, L. Film-mulched drip irrigation achieves high maize yield and low N losses in semi-arid areas of northeastern China. Eur. J. Agron. 2023, 146, 126819. [Google Scholar] [CrossRef]
  12. Liu, B.-Y.; Zhao, X.; Li, S.-S.; Zhang, X.-Z.; Virk, A.L.; Qi, J.-Y.; Kan, Z.-R.; Wang, X.; Ma, S.-T.; Zhang, H.-L. Meta-analysis of management-induced changes in nitrogen use efficiency of winter wheat in the North China Plain. J. Clean. Prod. 2020, 251, 119632. [Google Scholar] [CrossRef]
  13. Yu, N.; Ren, B.; Zhao, B.; Liu, P.; Zhang, J. Optimized agronomic management practices narrow the yield gap of summer maize through regulating canopy light interception and nitrogen distribution. Eur. J. Agron. 2022, 137, 126517. [Google Scholar] [CrossRef]
  14. Han, S.; Wang, C.; Zheng, Y.; Lu, Z.; Dang, Y.P.; Si, J.; Li, H.; Zhao, X.; and Zhang, H. The yield and nitrogen use efficiency of winter wheat in the North China Plain could be improved through enhanced tiller formation and biomass transport. Field Crops Res. 2024, 318, 109570. [Google Scholar] [CrossRef]
  15. Li, X.; Wang, R.; Lou, F.; Ji, P.; Wang, J.; Dong, W.; Tao, P.; Zhang, Y. Subsoiling Combine with Layered Nitrogen Application Optimizes Root Distribution and Improve Grain Yield and N Efficiency of Summer Maize. Agronomy 2024, 14, 1228. [Google Scholar] [CrossRef]
  16. Zhai, L.; Wang, Z.; Zhai, Y.; Zhang, L.; Zheng, M.; Yao, H.; Lv, L.; Shen, H.; Zhang, J.; Yao, Y.; et al. Partial substitution of chemical fertilizer by organic fertilizer benefits grain yield, water use efficiency, and economic return of summer maize. Soil Tillage Res. 2022, 217, 105287. [Google Scholar] [CrossRef]
  17. Liu, X.-J.; Yin, B.; Hu, Z.-H.; Bao, X.-Y.; Wang, Y.-D.; Zhen, W.-C. Physiological response of flag leaf and yield formation of winter wheat under different spring restrictive irrigation regimes in the Haihe Plain, China. J. Integr. Agric. 2021, 20, 2343–2359. [Google Scholar] [CrossRef]
  18. Bao, X.; Zhang, B.; Dai, M.; Liu, X.; Ren, J.; Gu, L.; Zhen, W. Improvement of grain weight and crop water productivity in winter wheat by light and frequent irrigation based on crop evapotranspiration. Agric. Water Manage. 2024, 301, 108922. [Google Scholar] [CrossRef]
  19. Sun, X.; Zhang, B.; Dai, M.; Jing, C.; Ma, K.; Tang, B.; Li, K.; Dang, H.; Gu, L.; Zhen, W.; et al. Accurate irrigation decision-making of winter wheat at the filling stage based on UAV hyperspectral inversion of leaf water content. Agric. Water Manage. 2024, 306, 109171. [Google Scholar] [CrossRef]
  20. Knievel, D.P. Procedure for estimating ratio of live to dead root dry matter in root core samples. Crop Sci. 1973, 13, 124–126. [Google Scholar] [CrossRef]
  21. Han, Q.-F.; Meng, H.-T.; Jia, Z.-K.; Xu, L.-F.; Wu, F.-P.; and Ding, R.-X. Characteristics of Endogenous Hormone Variations in the Roots of Alfalfa (Medicago sativa L.) Cultivars of Different Fall Dormancies During Spring Regrowth Stage. Agric. Sci. China 2011, 10, 1032–1040. [Google Scholar] [CrossRef]
  22. Berges, J.A.; Harrison, P.J. Nitrate reductase activity quantitatively predicts the rate of nitrate incorporation under steady state light limitation: A revised assay and characterization of the enzyme in three species of marine phytoplankton. Limnol. Oceanogr. 1995, 40, 82–93. [Google Scholar] [CrossRef]
  23. Inskeep, W.P.; Bloom, P.R. Extinction coefficients of chlorophyll a and b in N,N-dimethylformamide and 80% acetone. Plant Physiol. 1985, 77, 483–485. [Google Scholar] [CrossRef]
  24. Waddington, S.R.; Cartwright, P.M.; Wall, P.C. A quantitative scale of spike initial and pistil development in barley and wheat. Ann. Bot. 1983, 51, 145–153. [Google Scholar] [CrossRef]
  25. Allen, S.J. Measurement and estimation of evaporation from soil under sparse barley crops in northern Syria. Agric. For. Meteorol. 1990, 49, 291–309. [Google Scholar] [CrossRef]
  26. Liu, G.; Yang, Y.; Liu, W.; Guo, X.; Xie, R.; Ming, B.; Xue, J.; Zhang, G.; Li, R.; Wang, K.; et al. Optimized canopy structure improves maize grain yield and resource use efficiency. Food Energy Secur. 2022, 11, e390. [Google Scholar] [CrossRef]
  27. Li, P.; Yin, W.; Zhao, L.; Wan, P.; Fan, Z.; Hu, F.; Nan, Y.; Sun, Y.; Fan, H.; He, W.; et al. No tillage with straw mulching enhanced radiation use efficiency of wheat via optimizing canopy radiation interception and photosynthetic properties. Field Crops Res. 2025, 326, 109854. [Google Scholar] [CrossRef]
  28. Wu, B.; Zuo, W.; Yang, P.; Zhang, W. Optimal water and nitrogen management increases cotton yield through improving leaf number and canopy light environment. Field Crops Res. 2023, 290, 108767. [Google Scholar] [CrossRef]
  29. Wang, X.; Li, L.; Wang, C.; Wang, Z.; Li, M.; Tan, X.; Zhang, L.; Wang, T.; Zhou, Y.; Xie, X.; et al. Micro-ridge-furrow planting increases rapeseed yield and resource utilization efficiency through optimizing field microenvironment and light-nitrogen matching. Crop J. 2025, 13, 587–596. [Google Scholar] [CrossRef]
  30. Cai, H.; Ma, W.; Zhang, X.; Ping, J.; Yan, X.; Liu, J.; Yuan, J.; Wang, L.; Ren, J. Effect of subsoil tillage depth on nutrient accumulation, root distribution, and grain yield in spring maize. Crop J. 2014, 2, 297–307. [Google Scholar] [CrossRef]
  31. Liu, X.; Zhang, X.; Chen, S.; Sun, H.; Shao, L. Subsoil compaction and irrigation regimes affect the root–shoot relation and grain yield of winter wheat. Agric. Water Manag. 2015, 154, 59–67. [Google Scholar] [CrossRef]
  32. Yu, C.; Mawodza, T.; Atkinson, B.S.; Atkinson, J.A.; Sturrock, C.J.; Whalley, R.; Hawkesford, M.J.; Cooper, H.; Zhang, X.; Zhou, H.; et al. The effects of soil compaction on wheat seedling root growth are specific to soil texture and soil moisture status. Rhizosphere 2024, 29, 100838. [Google Scholar] [CrossRef]
  33. Zhang, D.; Wang, H.G.; Ma, B.W.; Li, R.; Li, Y. Effects of post-sowing soil compaction and pre-winter irrigation on soil conditions and growth and development of winter wheat. J. Triticeae Crops 2014, 34, 787–794. [Google Scholar]
  34. Zhang, J.; Dell, B.; Ma, W.; Vergauwen, R.; Zhang, X.; Oteri, T.; Foreman, A.; Laird, D.; Van den Ende, W. Contributions of Root WSC during Grain Filling in Wheat under Drought. Front. Plant Sci. 2016, 7, 904. [Google Scholar] [CrossRef] [PubMed]
  35. Zheng, X.; Yu, Z.; Shi, Y.; Liang, P. Differences in Water Consumption of Wheat Varieties Are Affected by Root Morphology Characteristics and Post-anthesis Root Senescence. Front. Plant Sci. 2022, 12, 814658. [Google Scholar] [CrossRef] [PubMed]
  36. Zhou, G.; Zhou, X.; Nie, Y.; Bai, S.H.; Zhou, L.; Shao, J.; Cheng, W.; Wang, J.; Hu, F.; Fu, Y. Drought-induced changes in root biomass largely result from altered root morphological traits: Evidence from a synthesis of global field trials. Plant Cell Environ. 2018, 41, 2589–2599. [Google Scholar] [CrossRef]
  37. Guo, X.; Zhang, Z.; Li, J.; Zhang, S.; Sun, W.; Xiao, X.; Sun, Z.; Xue, X.; Wang, Z.; Zhang, Y. Phenotypic and transcriptome profiling of spikes reveals the regulation of light regimens on spike growth and fertile floret number in wheat. Plant Cell Environ. 2024, 47, 1575–1591. [Google Scholar] [CrossRef]
  38. Liu, D.; Tian, B.; Zhang, M.; Jiang, L.; Li, C.; Qin, X.; Ma, J. Meta-analysis of the effects of different tillage methods on wheat yields under various conditions in China. Soil Till. Res. 2025, 248, 106449. [Google Scholar] [CrossRef]
  39. Li, N.; Li, J.; Tung, S.A.; Shi, X.; Hao, X.; Shi, F.; Wahid, M.A.; Ali, B.; Rashid, R.; Wang, J.; et al. Optimal irrigation amount can increase cotton lint yield by improving canopy structure and microenvironment under non-film deep drip irrigation. J. Clean. Prod. 2022, 360, 132156. [Google Scholar] [CrossRef]
  40. Gao, Y.; Zhang, M.; Yao, C.; Liu, Y.; Wang, Z.; Zhang, Y. Increasing seeding density under limited irrigation improves crop yield and water productivity of winter wheat by constructing a reasonable population architecture. Agric. Water Manag. 2021, 253, 106951. [Google Scholar] [CrossRef]
  41. Jahan Leghari, S.; Hu, K.; Wei, Y.; Wang, T.; Laghari, Y. Modelling the effects of cropping systems and irrigation methods on water consumption, N fates and crop yields in the North China Plain. Comput. Electron. Agric. 2024, 218, 108677. [Google Scholar] [CrossRef]
  42. Li, H.; Mei, X.; Wang, J.; Huang, F.; Hao, W.; Li, B. Drip fertigation significantly increased crop yield, water productivity and nitrogen use efficiency with respect to traditional irrigation and fertilization practices: A meta-analysis in China. Agric. Water Manag. 2021, 244, 106534. [Google Scholar] [CrossRef]
  43. Lu, Y.; Yan, Z.; Li, L.; Gao, C.; Shao, L. Selecting traits to improve the yield and water use efficiency of winter wheat under limited water supply. Agric. Water Manag. 2020, 242, 106410. [Google Scholar] [CrossRef]
  44. National Bureau of Statistics of China. Annual Data Query. National Bureau of Statistics Database. 2024. Available online: https://data.stats.gov.cn/easyquery.htm?cn=C01&zb=A0D0E&sj=2024 (accessed on 1 April 2024).
Figure 1. Weather conditions during the winter wheat growth stage from 2022 to 2024.
Agronomy 15 01053 g001
Figure 2. Effects of treatments on root parameters across 0–20 and 20–40 cm soil layers during the 2022–2023 and 2023–2024 growing seasons. (a) RLD, 2022–2023; (b) RLD, 2023–2024; (c) RSD, 2022–2023; (d) RSD, 2023–2024; (e) RMD, 2022–2023; (f) RMD, 2023–2024; (g) RA, 2022–2023; (h) RA, 2023–2024; (i) ABA, 2022–2023; (j) ABA, 2023–2024; (k) NRA, 2022–2023; (l) NRA, 2023–2024. Note: Bar charts for different letters in the same treatment indicate significant differences at p < 0.05. The error bar represents the standard error of the mean. RLD: root length density, RSD: root surface area density, RMD: root mass density, RA: root activity, NRA: nitrate reductase activity, ABA: root abscisic acid, WS: overwintering stage, RGS: regreening stage, JS: jointing stage, FS: flowering stage, MKS: milking stage, and MTS: maturing stage.
Agronomy 15 01053 g002
Figure 3. (a) Effects of different treatments on biomass of wheat from regreening stage to maturity stage; (b) Effects of different treatments on leaf area index (LAI); (c) Effects of different treatments on flag leaf net photosynthetic rate (Pn); (d) Effects of different treatments on flag leaf chlorophyll content. Note: Bar charts for different letters in the same treatment indicate significant differences at p < 0.05. The error bar represents the standard error of the mean. WS: overwintering stage, RGS: regreening stage, JS: jointing stage, FS: flowering stage, MKS: milking stage, and MTS: maturity stage.
Agronomy 15 01053 g003
Figure 4. Principal component analysis (PCA) was used to determine the relationship between the root system characteristics and the agronomic and physiological characterization of aboveground plants from the regreening stage to maturing stage of winter wheat under different treatments in 2022–2024. Note: WS: overwintering stage, RGS: regreening stage, JS: jointing stage, FS: flowering stage, MKS: milking stage, and MTS: maturity stage.
Agronomy 15 01053 g004
Figure 5. (a)The linear regression relationship between the leaf area index (LAI) and the root mass density (RMD); (b) The linear regression relationship between the leaf area index (LAI) and root surface area density (RSD); (c) The linear regression relationship between the leaf area index (LAI) and root length density (RLD).
Agronomy 15 01053 g005
Table 1. Cultivation strategies for integrated soil–crop management.
Management MethodCKHHL
Tillage methodDual-pass rotary tillage at 15 cm depthDeep loosening tillage at 27 cm depth
Pre-sowing soil moisture creationNoPre-sowing soil moisture regulation achieved 75% soil water content in the 0–20 cm plow layer and 90% field capacity in the 20–100 cm soil profile
Irrigation methodBorder irrigationDrip irrigation
Fertilization methodSplit fertilizationDrip fertigation with staged N application
Irrigation period and amount (mm)Total180120
WS600
RGS030
JS6030
FS6030
MKS030
Nitrogen fertilizer application period and rate (kg ha−1)Total300240
BS120120
JS18060
FS036
MKS024
Note: Pre-sowing soil moisture regulation: Prior to sowing, the volumetric soil water content (SWC) was measured at 20 cm intervals using a Trime Pico 64 Portable Soil Moisture Meter (TDR, IMKO, Germany) to determine the initial soil moisture profile (Table S1). Based on the measured SWC values, the water deficit for each soil layer was calculated using a deficit compensation formula [17], which enabled the precise estimation of the irrigation requirements for each corresponding soil depth to achieve the target moisture thresholds—75% SWC in the 0–20 cm plow layer and 90% of the field capacity in the 20–100 cm subsoil. This method ensured optimal pre-sowing soil moisture conditions, thereby promoting uniform germination and early seedling establishment. Drip irrigation systems were configured according to the methodology outlined in previous research [18]. The calculation method for the irrigation depth in HHL agronomic management was adapted from [19].
Table 2. Differences in water consumption at different growth stages of wheat fields under different treatments.
YearTreatmentSO–WSWS–JSJS–FSFS–MTS
EiPTΔSEiPTΔSEiPTΔSEiPTΔS
2022–2023CK45.6 a20.6 b66.2 b54.2 a30.4 a84.6 a28.4 a72.4 a100.8 a22.6 a163.7 a186.4 a
HHL41.4 a29.7 a71.1 a33.8 b33.0 a66.8 b24.3 a74.4 a98.8 a18.0 b132.7 b150.7 b
2023–2024CK45.3 a21.1 b66.4 a51.4 a29.7 b81.0 a28.6 a75.1 a103.7 a24.2 a164.9 a189.1 a
HHL41.2 a28.9 a70.1 a32.5 b33.2 a65.7 b24.5 a76.2 a100.7 a18.1 b134.9 b153.0 b
Ei shows inter-row soil evaporation rate; PT shows plant transpiration; ΔS shows field total water consumption. Values within a column followed by different letters imply significant differences (p = 0.05). SO: sowing, WS: overwintering stage, JS: jointing stage, FS: flowering stage, and MTS: maturity stage.
Table 3. Differences in water consumption sources in wheat fields under different treatments.
YearTreatmentTotal Water
Consumption (mm)
Sources and Ratios of Water Consumption
PrecipitationIrrigationSoil Water Storage
Amount
(mm)
Percentage
(%)
Amount
(mm)
Percentage
(%)
Amount
(mm)
Percentage
(%)
2022–2023CK438.0 a173.939.7180.041.184.1 b19.2 b
HHL387.3 b173.944.9120.031.099.5 a25.7 a
2023–2024CK440.2 a160.836.5180.040.999.4 b22.6 b
HHL389.5 b160.841.3120.030.8108.7 a27.9 a
Values within a column followed by different letters imply significant differences (p = 0.05).
Table 4. Flowering and fruiting characteristics of individual wheat plants under different cultivation modes.
YearTreatmentNumber of Spikelets per SpikeNumber of Sterile SpikeletsNumber of Fertile SpikeletsSpikelet Fertility Rate (%)Number of Differentiated FloretsNumber of Fertile FloretsFloret Degeneration Rate (%)Number of Grains per Spike
2022–2023CK20.1 b3.1 a17.0 b84.6 ab143.0 c41.5 b29.0 a35.1 b
HHL21.4 a2.2 b19.2 a89.7 a167.0 a49.2 a29.5 a37.5 a
2023–2024CK19.5 b3.3 a16.2 b83.1 ab125.0 c39.4 b31.5 a34.4 b
HHL21.1 a2.2 b18.9 a89.6 a161.0 a45.2 a28.1 a36.3 a
Values within a column followed by different letters imply significant differences (p = 0.05).
Table 5. Yield structure and water and fertilizer utilization in wheat fields under different cultivation modes.
YearTreatmentSpike Number
(×104 hm−2)
Grain Number per Spike1000-Grain Weight (g)Grain Yield (kg hm−2)Water Consumption (mm)Water Use Efficiency
(kg hm−2 mm−1)
PFPN
(kg kg−1)
2022–2023CK782.7 a35.1 b34.3 b9423.2 b438.0 a21.5 b31.4 b
HHL766.5 a37.5 a36.2 a10,405.2 a387.3 b26.9 a43.4 a
2023–2024CK779.1 a34.4 b33.1 b8871.1 b440.2 a20.2 b29.6 b
HHL762.1 b36.3 a35.7 a9876.1 a389.5 b25.4 a41.2 a
Values within a column followed by different letters imply significant differences (p = 0.05).
Table 6. Economic benefit evaluation of wheat fields under different cultivation modes.
YearTreatmentInput ProjectTotal Investment
(CNY)
Gross Output
(CNY ha−1)
Input–Output Ratio
Fertilizer
(CNY)
Cultivated Land
(CNY)
Pesticides
(CNY)
Sowing and Harvesting
(CNY)
WateringLabour
Number
(m3)
Amount
(CNY)
NumberAmount
(CNY)
2022–2023CK4600.860050120018009002020009350.815,831.0 a1.69 b
HHL4240.8100050120012006001818008890.817,480.7 a1.97 a
2023–2024CK4600.860050120018009002020009350.818,274.5 a1.95 b
HHL4240.8100050120012006001818008890.820,344.8 a2.29 a
Values within a column followed by different letters imply significant differences (p = 0.05).
Disclaimer/Publisher’s Note: The statements, opinions and data contained in all publications are solely those of the individual author(s) and contributor(s) and not of MDPI and/or the editor(s). MDPI and/or the editor(s) disclaim responsibility for any injury to people or property resulting from any ideas, methods, instructions or products referred to in the content.

