Abstract
This study quantifies where agrivoltaics can be feasibly implemented in German viticulture and presents a transparent GIS pre-screening framework for vineyards. Using plot-level cadastral data from Rhineland-Palatinate (54,078 ha planted area; covering 65% of Germany’s vineyard area), we integrate grid distance to the nearest connection point, slope, and planting year to identify technically and agronomically suitable sites. Under a 1000 m grid distance threshold, 44% of the planted area falls within potential connection range (15.6 GWp at 0.65 MWp per hectare). Across deployment scenarios, the feasible area spans 1.5–26.1% (0.52–9.17 GWp), with a balanced setting yielding 7.6% (2.68 GWp). We also conducted a one-at-a-time sensitivity analysis; the qualitative ranking of constraints is robust to a ±15% capacity-per-hectare band. The framework identifies plot-level feasibility under stated constraints and indicates where near-term implementation is most likely.
1. Introduction
Transforming the energy system to achieve climate neutrality is a key policy goal across the European Union [1]. To reach net-zero greenhouse gas emissions by 2050, the EU plans to significantly increase the share of renewable electricity [2]. This requires an expansion of renewable energy sources, especially wind and solar power. However, this may result in land-use conflicts—particularly when agricultural land is used for energy production—raising concerns about impacts on food security, natural habitats, and sustainable land management [3]. Although public support for renewable energy is generally high, local acceptance frequently diminishes when projects impact regions or culturally valued landscapes. Consequently, future solar expansion should balance technical feasibility with social and environmental considerations [4]. In light of these challenges, innovative land-use concepts that integrate energy production with existing land functions have emerged as a potential solution to address land-use conflicts [5]. Meanwhile, public acceptance is a key determinant of agrivoltaic deployment. Recent empirical evidence from Germany shows that agrivoltaics enjoys higher public acceptance than ground-mounted photovoltaics (PV) when agricultural production is maintained and landscape integration is addressed [5]. Perspectives from German nature conservation associations also indicate differentiated views on PV in agricultural landscapes and underscore the potential of dual-use systems to mitigate land-use conflicts compared with conventional ground-mounted PV [4]. Such perspectives underline the broader challenge of integrating renewable energy into agricultural landscapes in ways that maintain cultivation while addressing environmental and societal concerns. Agrivoltaic systems encompass a diverse range of technical designs, from elevated structures above crops to vertical bifacial installations integrated along crop rows. These systems vary in their degree of shading, energy yield, and structural complexity, creating trade-offs between crop productivity, installation costs, and energy generation efficiency [6]. By elevating or spatially arranging PV modules, agrivoltaic systems maintain agricultural activity while offering potential co-benefits such as reduced evapotranspiration and protection from hail or sunburn [7]. Agrivoltaics is thus increasingly viewed not only as a tool for farm diversification, but also as a means to enhance land-use efficiency and climate resilience [8]. Germany provides a promising context for assessing agrivoltaics in viticulture. With approximately 101,000 ha of vineyards, representing about 3% of the European vineyard surface, the country combines significant viticultural landscapes with ambitious renewable energy targets [9]. Recent policy initiatives, including the Federal PV Strategy, explicitly encourage the deployment of dual-use systems, proposing regulatory and financial incentives for demonstration projects [10]. These factors make Germany a suitable test case for exploring the feasibility of agrivoltaics in viticulture.
Within this context, viticulture has emerged as a particularly promising application for agrivoltaics. The impacts of climate change on viticulture and possible adaptation strategies have been the subject of extensive discussion in recent scientific literature [11]. Climate change is expected to affect grape composition and wine quality, with growing risks of drought, sunburn, and low acidity levels of the must [12,13]. Agrivoltaics could offer a promising solution to buffer climatic extremes and serve additionally as a protective installation against hail [14,15,16]. However, current scientific evidence on viticultural performance under elevated agrivoltaic systems remains scarce [17], and despite some promising benefits, the implementation of agrivoltaics in viticulture remains limited in scale [18]. One key challenge is identifying use cases and sites that meet cultivation and profitability requirements [19]. Additionally, factors such as the slope gradient and varietal sensitivity to shading are critical for assessing the suitability of agrivoltaics in vineyards. Moreover, technical constraints—such as proximity to electricity infrastructure or topographic limitations—must be considered to assess feasibility [19]. Several previous studies have focused on assessing the spatial potential of agrivoltaics on a national or regional level [20,21,22]. Current literature has also incorporated infrastructural factors such as grid connection availability at a national scale, indicating a regulatory potential of between 5600 and 7900 GWp in Germany [23]. In general, spatial suitability analyses for renewable energy deployment rely on different approaches, depending on the purpose of the investigation. Deterministic GIS-overlay methods are widely used for transparent and replicable pre-screening, while multi-criteria decision-making analyses (MCDA) add weighting schemes to prioritize sites; a recent study introduced an MCDA framework for agrivoltaics [23]. Such frameworks offer valuable prioritization insights but depend on normative assumptions and expert judgment.
Existing national assessments of agrivoltaics largely quantify theoretical potentials across crops and scales, but offer limited guidance on how dual-use systems would be integrated into specific production systems. German viticulture is a valuable case study for integrating solar electricity into productive landscapes, promoting climate-neutral and resilient agricultural systems: it faces increasing heat, drought, and weather extremes while relying on mechanized operations and stable vineyard structures. In this setting, agrivoltaics is considered an adaptation option to influence the microclimate without interrupting cultivation. However, what is missing is a plot-level, crop-specific pre-screening that makes interconnection feasibility explicit and combines it with agronomic constraints.
To address this gap, we present the first vineyard-specific, plot-level geospatial pre-screening for agrivoltaics in Germany. The framework applies a deterministic overlay that integrates agronomic and infrastructural constraints into a transparent, reproducible analysis. The intent is not to optimize economics or model crop response, but to establish a decision-oriented baseline that narrows large areas to implementable options, thereby supporting climate-resilient deployment strategies in viticulture. Accordingly, the study pursues two objectives: first, to quantify the share of planted vineyard area in Rhineland-Palatinate that remains suitable for agrivoltaics once agronomic and infrastructural constraints are applied; and second, to examine how policy-relevant thresholds translate into distinct suitability scenarios and sensitivity ranges. In doing so, by translating generic potentials into plot-resolved, infrastructure-aware options, the study helps to progress from the concept stage and initial pilot sites to broader implementation in German viticulture.
2. Materials and Methods
2.1. The Study Area
The study area covers all vineyard plots within the federal state of Rhineland-Palatinate, located in western Germany between approximately 49.0° and 51° N latitude and 6.0° to 8.5° E longitude. With approximately 65,000 hectares (ha) of vineyards, Rhineland-Palatinate accounts for over 65% of Germany’s total winegrowing area and includes the wine regions Rheinhessen, Palatinate, Moselle, Nahe, Ahr, and Middle Rhine (ordered by descending area size) [24]. Vineyards account for approximately 9% of the utilized agricultural area in Rhineland-Palatinate, providing a meaningful test case for national agrivoltaic strategies [25]. Vineyards in Rhineland-Palatinate are heterogeneous in terms of training systems, planting densities, and row orientations, all of which may influence the integration of agrivoltaics. The predominant training system in German viticulture is the vertical shoot positioning trellis using a wire frame, which facilitates mechanization and represents the current standard in vineyard management. Agrivoltaic designs typically focus on this system, as it provides a practical framework for integrating elevated PV structures. However, spatially explicit datasets for these parameters are not available at the regional scale, and their inclusion would therefore require strong assumptions with limited reproducibility. For this reason, our analysis focuses on constraints that can be derived from harmonized data sources, such as slope, planting year, and grid proximity.
Viticulture in Rhineland-Palatinate is characterized by a wide range of site conditions, including steep slopes along river valleys, such as the Moselle and Rhine, as well as flatter regions such as the Pfalz region. The spatial distribution of vineyard areas in Rhineland-Palatinate is shown in Figure 1. Vineyards shape the region’s landscape, and slopes can exceed 30% in traditional terraced winegrowing regions. This topographic diversity is a key factor in the spatial assessment of agrivoltaic systems, as slope inclination influences both the technical feasibility of PV installations and their potential effects on vine growth and management practices. The choice of trellis system, grape variety, and planting density varies substantially across the region, reflecting both historical practices and site-specific requirements. While these parameters are not directly modeled in the spatial analysis, they underline the heterogeneity of vineyard systems in Rhineland-Palatinate and may inform future site-specific evaluations of agrivoltaic integration.
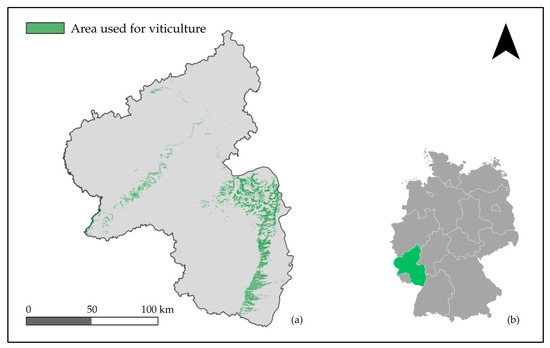
Figure 1.
(a) Visualization of the vineyards (marked in green) within the borders of Rhineland-Palatinate; (b) location of Rhineland-Palatinate within Germany, highlighted in color for spatial orientation.
Average annual global horizontal irradiation (GHI) in Rhineland-Palatinate ranges from approximately 1070 to 1200 kWh/m2, placing the region among the higher irradiance zones in Germany [26]. Rhineland-Palatinate itself is characterized by a strongly differentiated regional climate. Rheinhessen, the German Wine Route region (Deutsche Weinstraße), and the Moselle Valley are among the warmest winegrowing areas in Germany, located in the southwestern part of the country near the Rhine River. In contrast, the nearby low mountain ranges of the Hunsrück, Eifel, and Westerwald experience a much harsher climate with lower temperatures and higher precipitation [27]. Rheinhessen is also known as one of the driest regions in Germany, making it particularly suitable for viticulture, but potentially also more vulnerable to the impacts of climate change, such as prolonged droughts and heat stress. Rhineland-Palatinate was chosen as the study region because it contains the majority of Germany’s vineyard area and encompasses a broad spectrum of cultivation settings, from steep-slope viticulture to mechanized flatland sites. This diversity makes the region a meaningful case study for exploring agrivoltaic suitability in viticulture.
2.2. The Methodological Framework
The assessment of agrivoltaic potential in German viticulture is based on a geospatial evaluation framework that integrates plot-level vineyard data with publicly accessible electricity infrastructure data. The methodological focus lies on identifying grid-accessible areas that are suitable for the deployment of agrivoltaic systems. Spatial modeling and data preprocessing were carried out using QGIS (version 3.34.12) in combination with Python (version 3.12.7) [28]. All processing steps and algorithm identifiers are listed in Table A1. All datasets were aligned using the ETRS_1989_UTM_Zone_32N as a uniform projected coordinate system.
The primary input dataset consists of official viticultural cadastral data provided by the Agricultural Chamber of Rhineland-Palatinate [29]. The dataset comprises spatially explicit vineyard polygons, representing the actual land use for wine production in Rhineland-Palatinate. These plots serve as the geospatial foundation for all subsequent analyses.
In the first stage of the framework, shown in Figure 2, these vineyard plots were intersected with a community-curated electricity grid map of Germany [30]. This national infrastructure dataset includes over 1.29 million georeferenced points, representing various components of the electricity distribution and transmission network. This dataset was filtered and classified to identify relevant grid connection features, such as substations, distribution cabinets, and grid connection points close to wind turbines. These points served as potential grid access locations for agrivoltaic deployment and were retained for further analysis. We then calculated the minimum Euclidean distances in meters to the nearest grid connection point and divided the plots into distance bands.
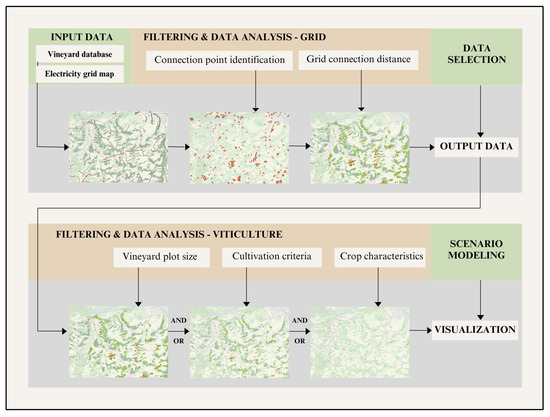
Figure 2.
Overview of the geospatial assessment framework for evaluating agrivoltaic suitability in viticulture. The multi-stage approach integrates cadastral vineyard data with publicly available electricity grid infrastructure. Subsequent filtering steps incorporate agronomic, technical, and spatial constraints, including slope, plot size, planting year, and grape variety.
The dataset integrates official cadastral and viticultural records with topographic and infrastructural information. The result is a customizable analysis dependent on the underlying research hypotheses. The criteria shown in Table 1 are particularly relevant for determining the practical and viticultural suitability of agrivoltaics in vineyards. To ensure methodological transparency, key constraints—such as slope gradient and planting year—were operationalized as discrete filters in the spatial framework (see Table 1 for parameter definitions and Tables 2–6 for their application in the results). These include the following:

Table 1.
Overview of selected input parameters used to evaluate the suitability of vineyard plots for agrivoltaics.
- Planted area: The analysis uses the cadastral vineyard area to assess agrivoltaic potential. This reflects current regulatory frameworks, which require that agricultural productivity (a minimum required yield per hectare) must be maintained for land to be recognized as ‘agrivoltaic’. Installing PV modules over the whole property area would compromise the agricultural function of the site and violate the intended crop-integrated character of agrivoltaic systems. ‘Planted area’ denotes the actively cultivated vineyard area within a cadastral plot.
- Slope: Vineyards in Germany are commonly classified according to their slope gradient [31]. German law distinguishes between hillside locations and flat sites. Steep-slope vineyards are defined as those with a slope of more than 30%. This classification is widely used in viticultural practice, as slope has direct implications for vineyard management, mechanization, microclimate, and, in this context, the technical feasibility of elevated agrivoltaic systems. Due to technical considerations, particularly the increasing construction complexity on steeper terrain, we differentiated vineyard plots by slope gradient into three classes: 0–5% (low), 5–15% (moderate), and >15% (high). Slopes above 15% typically entail significant additional construction effort and may require adapted mounting structures or specialized installation techniques [20].
- Plot size: Plot size influences both grid integration requirements and economic viability, as larger systems may benefit from economies of scale but place greater demands on infrastructure. Following the approach proposed by Rösch et al. (2025), systems are differentiated by a threshold of 2.5 hectares, as German building law allows simplified approval procedures for agrivoltaic installations below this size [20,21].
- Restricted area: As part of the spatial filtering process, areas designated under the Natura 2000 network were excluded from the analysis. Although viticulture exists within some Natura 2000 sites, the installation of agrivoltaic systems in these protected areas is highly unlikely due to regulatory restrictions and potential conflicts with conservation objectives [22]. Construction may be legally permitted in individual cases under building law. However, new agrivoltaic installations in these areas are excluded from public funding under the German Renewable Energy Sources Act (EEG), § 37 (3), further limiting their practical feasibility [32].
- Vine age: This parameter enables the identification of either young vineyards that may require adapted agrivoltaic designs, or older vineyards approaching the end of their productive lifecycle, which may be more compatible with structural retrofitting. To account for the age of the vineyard plots, the planting year was used to calculate the vine age as of the 2025 growing season. Based on viticultural lifecycle stages and practical decision-making horizons, vine age was grouped into five discrete classes: 0–5 years, 6–10 years, 11–15 years, 16–20 years, and more than 20 years. This categorization serves as a proxy and addresses an assessment of potential age-related constraints or opportunities for agrivoltaics implementation.
- Grape variety: Based on ongoing field trials, selected grape varieties can be filtered. For this study, the most common grape varieties in Germany are categorized into white and red grape varieties. Given the significant diversity of grape varieties cultivated in Germany, the 12 most commonly planted varieties were selected. In our framework, grape variety is treated as a descriptive variable that can be filtered to reflect the distribution of grape varieties. However, this does not imply any inference about varietal shade tolerance, which is beyond the scope of the present analysis.
Through the integration of spatial grid proximity and vineyard-level characteristics, the model supports targeted identification of sites with high agrivoltaic potential. The framework is modular and can be refined or regionally adapted. To represent uncertainty in agronomic and infrastructural factors, we defined a set of spatial scenarios that combine slope, planting year, grape variety, and grid-distance filters to reflect restrictive, balanced, and inclusive planning assumptions. In addition, we conducted a one-at-a-time sensitivity analysis (OAT) on key parameters (slope, planting year, grid distance) to assess the robustness of results to individual assumptions. The scenario settings and one-at-a-time sensitivity are used to analyze threshold effects and trade-offs, eliminating the need for normative weights. On this basis, a differentiated picture of agrivoltaic potential in viticulture emerges. The following section presents the results of the study and reports scenario outcomes and sensitivity results, highlighting areas that remain technically and agronomically feasible under varying grid-access thresholds.
3. Results
The spatial assessment of agrivoltaic suitability in German viticulture highlights the strong influence of site-specific agricultural characteristics and proximity to grid infrastructure. Based on cadastral vineyard data for Rhineland-Palatinate, approximately 65,000 ha are classified as vineyard area. However, after excluding non-cultivated areas, the actively cultivated vineyard area is reduced to 54,078 ha, which serves as the basis for further analysis. This area will be referred to as the ‘planted area’ hereafter. To avoid overestimating potentials that resemble pseudo-agrivoltaic or ground-mounted PV, the analysis is restricted to the planted vineyard area. Assessing the total designated area would require a structural comparison with actual planting patterns, which is beyond the scope of this study.
3.1. Integration of Grid Infrastructure Data
One of the main limiting factors for the implementation of agrivoltaic systems is the availability of nearby grid connection points. Figure 3 illustrates the spatial distribution of vineyard plots in relation to potential grid infrastructure. To assess the influence of grid proximity on spatial suitability, a stepwise filtering was applied using maximum distance thresholds of ≤1500 m, ≤1000 m, ≤750 m, ≤500 m, ≤250 m, and ≤100 m from the nearest grid infrastructure [23]. The analysis for the total planted area shows that within a 250 m radius of a grid connection point, we computed 2155 ha of vineyard area that are technically favorable; at 500 m distance, the potential area increases to 7578 ha, and at 1000 m, the area further expands to 24,031 ha, although the cost of grid integration increases considerably.
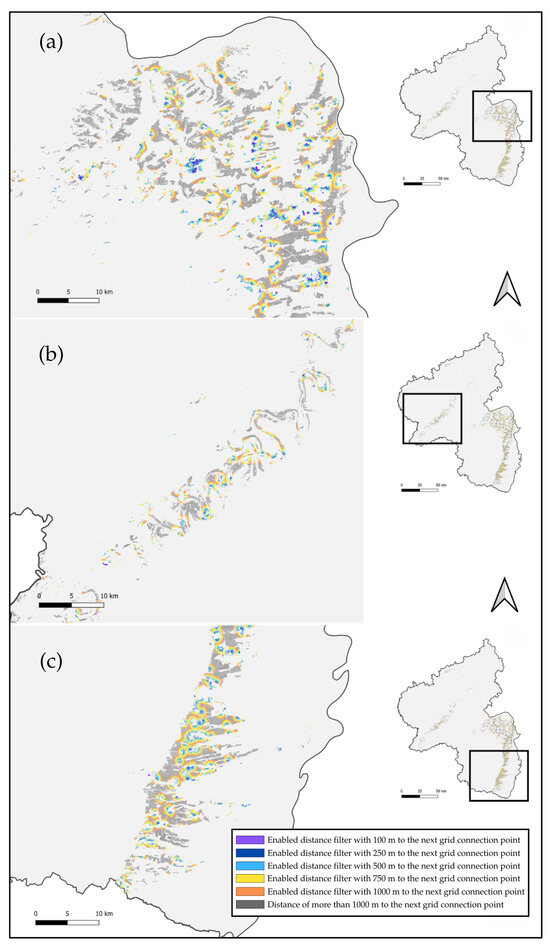
Figure 3.
Examined winegrowing regions in Rhineland-Palatinate with computed distances to the nearest potential grid connection point. The winegrowing regions of Rhineland-Palatinate framed by the federal state borders; enlarged view of (a) Rheinhessen and Nahe, (b) Moselle region and (c) Palatinate, located along the western edge of the Upper Rhine.
These findings emphasize the importance of existing infrastructure for potential analysis of agrivoltaics, a factor that is often overlooked in broader potential assessments. Rather than aiming to categorize the overall area potential by connection distance, the use of distance thresholds serves to highlight those plots with the most favorable infrastructural conditions—thereby supporting the targeted identification of highly suitable locations. To estimate the installable capacity, literature-based reference values were used and cross-validated with empirical data from the agrivoltaics research facility in Geisenheim. The actual energy yield per hectare depends on various factors, including the type of PV module, the system design, and site-specific characteristics such as annual solar irradiation. Importantly, the system design itself is influenced by the cultivated crop. Given the crop-specific system design and empirical values, an average installable capacity of 0.65 MWp/ha is assumed for the present calculation [23].
The stepwise application of distance-to-grid thresholds reveals a reduction in suitable vineyard area for agrivoltaic deployment, as shown in Table 2. While the total planted area amounts to approximately 54,000 ha, only 44% remains within 1000 m of a potential grid connection point, corresponding to an installable capacity of about 15.6 GWp. Our findings should be read against broader land-use assessments: Although 44% is numerically close to the lower bound reported in a previous study (46–75% of technical potential remaining after soft restrictions), the metrics are not directly comparable. Recent work quantifies the regulatory downscaling of national, cross-crop technical potential, whereas our 44% measures the grid-proximate share of planted vineyard area before any agronomic screening [23]. Studies that omit explicit grid proximity consequently report larger potentials because the interconnection constraint is not binding in their geospatial setup [20]. In the following sections, we introduce crop-specific filters (slope, vine age, grape variety) that translate this infrastructure screening into viticulture-specific feasibility. Their quantitative effects are reported in Section 3.2.
The computed potential decreases with stricter thresholds, leaving only about 1% of the area within 100 m of the grid, and reducing the installable capacity to just 0.26 GWp. The results highlight grid proximity as a major limiting factor for spatial feasibility, particularly at shorter connection distances.
Table 2.
Vineyard area and agrivoltaic potential at varying grid-distance thresholds.
Table 2.
Vineyard area and agrivoltaic potential at varying grid-distance thresholds.
| Distance to Grid Connection Point | Planted Area | Share of Total Planted Area (%) | Installable Capacity (GWp) |
|---|---|---|---|
| All | 54,078.0 | 100% | 37.85 |
| ≤1500 m grid distance | 37,964.7 | 70% | 24.68 |
| ≤1000 m grid distance | 24,031.5 | 44% | 15.62 |
| ≤750 m grid distance | 15,416.7 | 29% | 10.02 |
| ≤500 m grid distance | 7578.4 | 14% | 4.93 |
| ≤250 m grid distance | 2155.3 | 4% | 1.40 |
| ≤100 m grid distance | 405.1 | 1% | 0.26 |
3.2. Filtering by Agronomic Criteria
Next, slope categories were introduced to examine the calculated area potential in more detail. As previously noted, slope presents technical challenges for both the construction of the agrivoltaic structure and the mechanization of viticulture. Table 3 provides a breakdown of the remaining vineyard area by slope classes. The majority of the area is located on gentle slopes (0–10%), which are generally more compatible with mechanized viticulture and the installation of elevated agrivoltaic systems. Steeper slopes contribute only a minor share to the total potential.
Table 3.
Stepwise reduction of suitable vineyard area and corresponding installable agrivoltaic capacity (GWp) based on distance-to-grid filters. Plots lacking slope information are classified as NA (not available).
The next analytical stage applied plot size as a filter criterion, as shown in Table 4. In order to assess planning and regulatory implications, vineyard plots were categorized by size, using a threshold of 2.5 hectares. This distinction is relevant as German building law permits simplified approval procedures for activities below this threshold. The distribution of plot sizes reveals that the vast majority of vineyard area is composed of plots smaller than 2.5 ha, while only a minor share exceeds this limit.
Table 4.
Distribution of vineyard plots by plot size and slope class. Plot sizes are categorized as smaller than 2.5 ha and equal to or larger than 2.5 ha. Slope classes include 0–5%, 5–10%, 10–15%, 15–20%, more than 20%, and plots without slope data (NA). The totals in each column represent the sum of all slope classes per category.
The grape varieties were selected from the dataset according to the size of their cultivation area in order to identify the top 12 grape varieties in Germany. In Table 5, a distinction was made between white and red varieties. The most commonly cultivated white grape varieties are White Riesling, Ruländer, Grüner Silvaner, Müller-Thurgau, White Burgundy, Chardonnay, Kerner, Bacchus, and Scheurebe. The red varieties are dominated by Dornfelder, Portugieser, and Blauer Spätburgunder. This categorization forms the basis for further evaluations, particularly with regard to suitability for agrivoltaics.
Table 5.
Distribution of vineyard area by grape variety category.
Table 6 shows the distribution of vineyard area by planting year category. Nearly half of the total planted area (48%) consists of vineyards older than 20 years, while only 14% was planted within the past five years. The remaining area is relatively evenly distributed among the intermediate age categories. This age structure provides important context for assessing the technical and temporal suitability of vineyards for agrivoltaic deployment. Linking the installation of an agrivoltaic system to the replanting of a vineyard is supported by several practical considerations, particularly in terms of structural integration.
Table 6.
Distribution of vineyard area by planting year category. Plots lacking vine age information are classified as NA (not available).
When agronomic factors—such as planting year and slope—and infrastructural constraints like grid proximity are combined, the cumulative effect leads to a substantial reduction in the theoretical agrivoltaic potential. In the analysis applying a 1000 m distance threshold to the nearest grid connection point, only 44% of the total vineyard area remains technically and infrastructurally feasible for dual land use. To further explore the spatial suitability of vineyards for agrivoltaic deployment, four scenarios were developed, each based on a combination of relevant biophysical and infrastructural criteria (see Table 7). These include slope, planting year, grape variety, and distance to the nearest grid connection point. In all scenarios, vineyards located in Natura 2000 protected areas were excluded. In Rhineland-Palatinate, excluding Natura 2000 sites led to a reduction in technically suitable vineyard area by 1127.5 ha (−7.4%) under the extended scenario with a 1000 m grid-distance threshold. The scenarios range from restrictive to inclusive, reflecting different strategic perspectives, from high-efficiency implementation to integrative land use.
Table 7.
Vineyard area and installable agrivoltaic capacity under different suitability scenarios.
The ‘High Priority’ scenario employs the most stringent filter set, selecting vineyard plots with slopes of 0–10%, a planting age exceeding 15 years, and a grid connection within 250 m. Grape variety is not restricted, since replanting with a suitable shade-tolerant grape variety is highly likely. The ‘Balanced Feasibility’ scenario expands the slope tolerance to 15%, reduces the minimum planting age to over 10 years, and increases the allowable grid distance to 500 m. This combination reflects a more practical compromise between technical feasibility and land availability. The ‘Extended Potential’ scenario is the most inclusive, allowing slopes up to 20%, including all vineyards older than 10 years, and extending the maximum grid distance to 1000 m. While this setting increases area potential, it includes locations with lower technical or economic viability.
In contrast, the ‘In-Field Integration Scenario’ targets vineyard plots where agrivoltaics could be introduced without requiring the removal and replanting of the vineyard. Therefore, only plots with young vines (<10 years) are selected, under the assumption that a recent planting allows structural adaptation to elevated PV systems. The scenario further restricts the analysis to gentle slopes (0–10%), white grape varieties with a relevant share in the German vine variety profile, and a maximum distance of 500 m to the grid. Only white grape varieties are included, based on the hypothesis that, under generally moderate climatic conditions, shading effects from agrivoltaic structures are more likely to cause undesired ripening delays in red varieties than in white ones. This scenario illustrates the potential for harmonizing existing vineyards with energy infrastructure.
The results indicate strong sensitivity of agrivoltaic potential to scenario criteria. While the ‘Extended Potential’ scenario represents a substantial area (28%), the restrictive scenarios (‘High Priority’ and ‘In-Field Integration’) demonstrate that very few plots (<2%) simultaneously fulfill multiple suitability conditions. To separately assess the influence of individual assumptions behind these scenario differences, we conducted a one-at-a-time (OAT) sensitivity analysis relative to a neutral baseline (≤15% slope; ≤500 m grid; no age/variety filters), which is chosen to balance technical constructability and typical grid accessibility while avoiding unvalidated agronomic assumptions (see Table 8).
Table 8.
Sensitivity analysis of vineyard suitability under different scenarios and one-at-a-time (OAT) parameter variations. The table reports vineyard area (ha), the photovoltaic capacity potential at 0.65 MWp ha−1, as well as a sensitivity range of this parameter of 15%.
The grid-distance threshold is the dominant lever: expanding from ≤500 m to ≤1000 m increases the feasible planted area from 10.79% to 34.03% (capacity increasing from 3.79 to 11.96 GWp), whereas tightening to ≤250 m reduces it to 3.28% (1.15 GWp). Vine age exerts a marked but smaller effect: ≥10 years lowers feasibility to 7.63% (2.68 GWp) and ≥15 years to 6.27% (2.20 GWp). Capacity bands (±15%) do not change these rankings (e.g., 0.98–1.33 GWp at ≤250 m in comparison to 10.17–13.76 GWp at ≤1000 m), indicating robustness to plausible variation in the capacity-per-hectare assumption. Taken together, these results imply that grid access is the primary regional constraint (favoring corridors near existing connection points), vine renewal cycles could represent a material factor shaping the near-term retrofit potential of vineyards, and varietal filtering substantially narrows the feasible area when applied conservatively. Accordingly, these results support a viticulture-specific siting approach, in which grid proximity, slope, and vine age timing are explicitly operationalized into plot-level feasibility assessments.
4. Discussion
4.1. Discussion of Results in Relation to Existing Research
To further contextualize these findings and illustrate the implications of varying assumptions, four distinct suitability scenarios were developed. These scenarios differ in their constraints regarding slope, grid proximity, vine age, and grape variety, thus providing strategic perspectives for targeted implementation of agrivoltaics in vineyards. The results fulfill the study’s objectives by quantifying the share of feasible vineyard plots under crop- and infrastructure-specific constraints and by showing how alternative parameter thresholds reshape suitability ranges into relevant insights for viticulture. The scenarios presented demonstrate how sensitive the agrivoltaic potential of vineyards is to varying technical, agronomic, and infrastructural constraints. The findings also indicate that national-scale agrivoltaic models tend to overestimate potentials. Crop-specific, tailored assessments are required that account for structural and temporal constraints rather than relying on generalized land assumptions. The restrictive High Priority scenario identifies only about 1.6% of vineyard area as suitable, representing optimal pilot sites with gentle slopes, close grid proximity, and older vines ready for renewal. In contrast, the broadest Extended Potential scenario includes around 26% of vineyard area, but incorporates challenging conditions like steeper slopes and higher grid-connection costs, potentially reducing practical viability. The Balanced Feasibility scenario (7.6%) provides a strategic compromise with moderate site constraints. Lastly, the specialized In-Field Integration scenario (1.5%) highlights opportunities in recently planted vineyards with gentle slopes and specific grape varieties, enabling agrivoltaic integration without vineyard replanting.
The findings of this study show that the spatial distribution of technically feasible plots is highly uneven (see Figure 3). Suitable plots tend to cluster in flatter regions with existing infrastructure—often near already developed energy locations such as wind power sites. This spatial pattern suggests that planning procedures for agrivoltaics in viticulture should adopt targeted, location-specific strategies, making use of existing grid corridors and suitable topographic conditions. By applying spatial filters step by step—slope, plot size, and proximity to grid infrastructure—it becomes clear that only a small subset of vineyard plots meets all relevant suitability criteria simultaneously. The theoretical area potential is substantially reduced by the intersection of agricultural criteria and infrastructural constraints.
Grid access, in particular, emerges as a critical limiting factor [33]. Despite the overall viticultural area in Rhineland-Palatinate, the results show that only a small fraction of plots lie within 100 to 500 m of potential grid connection points. Given the cost and challenges associated with grid connection—ranging in Germany from EUR 80 to EUR 260 per linear meter—this constraint can have an important impact on the overall economic feasibility of the systems [34]. The process of connecting renewable energy projects to the grid is becoming a critical limiting factor in the expansion of renewable energy [35,36]. Strub et al. (2024) argue that grid connection costs should be considered in economic evaluations of agrivoltaic systems, as these costs significantly impact the feasibility of specific business models [19]. Even if a low value were applied to the cost per meter, a site around 1000 m away from a feed-in point could be economically unviable without further grid expansion. This makes areas near transformer stations and wind turbines attractive for grid connection [37]. However, further investigation is required to validate these potential feed-in points technically.
Slope is a decisive factor in vineyard suitability for agrivoltaics. While steep slopes—often associated with high-quality, south-facing vineyard sites—may benefit from agrivoltaics as a climate adaptation strategy, they also pose significant limitations in terms of mechanizability and technical feasibility [20,23,38,39]. The implementation of agrivoltaics on such terrain is particularly challenging, as the spatial configuration of existing trellis systems often conflicts with the structural requirements of elevated PV installations. These incompatibilities can restrict the positioning of support columns and the alignment of PV rows, which in turn further limits the potential for mechanized operations under the solar infrastructure. In addition to topographic constraints, the age of the vineyard also plays a key role in determining the feasibility of agrivoltaics. High-mounted systems are typically installed in conjunction with new vineyard establishments, allowing for coordinated planning between trellis and PV infrastructure. In such cases, the investment time horizon for the PV system (typically 20–25 years) can align well with the productive lifespan of the vineyard, offering favorable conditions for long-term integration. In contrast, retrofitting existing vineyards—especially on sloped terrain—is often economically and structurally unfeasible. Young vineyards (<5 years), although biologically suitable, are economically impractical to replant solely for agrivoltaics. Very old vineyards (>20 years) may be near replacement, but often do not justify the long-term infrastructure investment. Mid-aged vineyards (6–15 years) typically lack both structural flexibility and an immediate replanting prospect, making them less favorable for agrivoltaic deployment.
Slope and vine age thus represent critical spatial and temporal constraints in agrivoltaics planning and should be considered jointly in suitability assessments. This confirms the central hypothesis of this study: that multiple site-specific factors must be integrated to realistically evaluate agrivoltaic potential in viticulture. While recent national-scale studies have begun to incorporate parameters such as legal restrictions and proximity to grid infrastructure [20,23], the present approach highlights the added value of a crop-specific perspective. Such crop-specific analyses—particularly in viticulture—enable the integration of cultivation-related variables such as slope variability, mechanization constraints, or varietal suitability. These parameters are essential for assessing not only technical feasibility, but also the potential role of agrivoltaics as a climate adaptation strategy. The present study illustrates how such factors can be operationalized in a spatial framework, thereby complementing broader national models with crop-specific relevance.
4.2. Critical Reflection on Methodological Robustness
While the study demonstrates a refined plot-level approach for identifying suitable areas for agrivoltaics in viticulture, several limitations affect the robustness and generalizability of the results. A key constraint lies in the quality and completeness of input data, particularly with respect to grid infrastructure and terrain modeling. The proximity analysis to potential grid connection points was based on an open, community-curated infrastructure dataset [30]. Although this dataset includes a wide range of infrastructure types—including substations, transformer stations, and generation plants—it does not provide official confirmation of connectivity or capacity. As grid data information is usually held by distribution system operators and is not publicly accessible, the derived proximity values should be considered approximations that may not always reflect actual technical feasibility. This introduces a level of uncertainty regarding the actual feasibility and cost of grid connection. The use of such proxy data, however, reflects a growing practice in spatial energy planning and enables early-stage analysis in the absence of verified alternatives [23,40]. To improve data reliability, future analyses—especially at the regional or municipal level—should involve grid operators directly to validate connection points and assess grid capacity. This would allow for more precise techno-economic modeling and increase the practical relevance of site suitability assessments.
In terms of topographic analysis, the study used a high-resolution digital elevation model for the state of Rhineland-Palatinate [29]. Potentially, a finer spatial resolution of this dataset may explain the distinct slope variability observed across vineyard plots. In contrast, many national-scale assessments rely on different raster data, which tend to smooth local terrain features and potentially underestimate actual slope conditions in hillside vineyards. Consequently, the higher sensitivity in slope classification observed here reflects both the specific topography of the region and the resolution of the underlying data. This highlights the importance of data resolution in spatial agrivoltaics modeling, particularly when evaluating complex, heterogeneous landscapes such as winegrowing areas. While our regional screening excludes Natura 2000 areas, we did not apply generic buffer zones because exclusion criteria are habitat- and site-specific and determined by the authorities on a case-by-case basis. Consequently, the estimates of suitability produced are conservative for protected areas, but may overstate feasibility in nearby transition zones. In cases where jurisdiction-specific guidance is available, the integration of parametric buffers into future iterations of the framework may be considered.
Beyond terrain and infrastructure, the influence of shading on viticulture needs to be better understood [41]. Nevertheless, our approach was able to consider plot-specific grape variety information. However, the suitability of a grape variety for agrivoltaics is multifactorial and should initially be discussed more broadly as part of a separate methodological approach with transparent scoring. While parameters such as slope and plot size serve as indicators for mechanization and accessibility, the physiological and enological effects of altered microclimates under PV structures remain poorly understood. These quality-related aspects are particularly relevant in viticulture, where market value is strongly tied to a set of different customer preferences [42]. Their exclusion from the spatial model reflects a general limitation of current agrivoltaics assessments and points to the need for further interdisciplinary integration between geospatial analysis and crop physiology. Finally, the model does not simulate energy yield, shading geometry, or investment returns. As such, it should be viewed as a spatial pre-screening approach—identifying technically and infrastructurally suitable sites—but not as a substitute for detailed project-level design or economic viability analysis. The strength of the approach lies in its ability to narrow down large agricultural areas to focused subspaces for more in-depth assessment.
4.3. Practical Implications
The results of this study provide valuable insights for relevant stakeholders seeking to assess the feasibility of agrivoltaic systems in viticulture. By identifying technically and infrastructurally suitable areas at the plot level, the spatial analysis supports a more targeted site selection process, which is especially important given the tight spatial, legal, and operational constraints in Rhineland-Palatinate. The strong influence of grid accessibility on suitability outcomes underscores the need to integrate connection cost considerations into early planning stages. Considering the current grid connection costs, which depend on terrain, project size, and technical conditions, proximity to existing infrastructure may play a decisive economic role. Consequently, the observed clustering of suitable plots in flatter areas with established grid access opens up the possibility of regional corridor planning for agrivoltaics in viticulture. Rather than attempting uniform implementation across entire wine regions, planning efforts may benefit from focusing on pre-qualified sub-areas with high spatial coherence and cost-efficiency potential. In line with broader aims to combine low-carbon energy supply with robust agricultural production, a prioritized expansion of further pilot sites within these corridors can accelerate learning under real operating conditions. Such pilots should apply consistent siting criteria and transparent evaluation to generate evidence on operational performance and vineyard management, thereby supporting scalable decision-making that advances both mitigation and adaptation goals.
From the perspective of vineyard owners, the results can inform long-term strategic decisions—such as aligning the installation of PV structures with vineyard planting cycles, which often occur after 20–35 years in fertile soils [43]. As previous research suggests (e.g., Strub et al., 2024), co-timed replanting and agrivoltaic construction may reduce disruption and allow for optimal row alignment under the system [19]. Particularly in permanent cropping systems, where planting structures remain in place for decades, coordinated planning becomes essential. On the other hand, the associated replanting increases initial investment costs [44]. This, in turn, makes the ‘planted year’ factor relevant in practice, as winegrowers may plan agrivoltaic deployment when renewal is foreseeable and cost bundling is feasible. In addition, the results highlight the relevance of participatory approaches in site assessment: by utilizing citizen-curated infrastructure data, this work reflects current trends in participatory spatial planning and research [45]. While such datasets require ongoing validation, early collaboration with grid operators and local stakeholders can verify connection options and address concerns related to landscape integration and public acceptance. Such approaches, which draw on local resources and expertise, have also been called for by researchers for a considerable period [23]. In this way, corridor-focused pilots and renewal-aligned projects can translate spatial pre-screening into implementable projects that support climate-neutral energy generation while enhancing the resilience of viticultural systems.
4.4. Future Research Needs
While the present study advances the spatial assessment of agrivoltaic potential in viticulture by applying a crop-specific GIS approach, several areas for further research emerge. First, there is a need for long-term empirical data on the physiological and qualitative effects of elevated PV structures on grapevines and different grape varieties. Relevant performance indicators for such trials could include soil moisture, monitoring of downy and powdery mildew incidence, yield, grape acidity, and sugar content, as well as operational aspects such as labor requirements and the degree of mechanization under agrivoltaic conditions. In the coming years, further results from existing agrivoltaics research installations are expected. Due to the perennial nature of viticulture, however, reliable data on grape quality will only become meaningful after several years. Moreover, study designs differ significantly in some cases, which calls for cautious interpretation and requires critical review when publishing results. As market value in viticulture is contingent on both subjective and objective quality traits, future research will provide more precise answers [46,47]. These will be based on multi-year field trials with robust study designs and comprehensive monitoring of both yield and quality factors. Second, grid infrastructure datasets remain a limiting factor in many spatial assessments. While open, community-curated sources represent a valuable starting point, they lack validation and often omit critical attributes such as injection capacity or upgrade requirements. To improve planning accuracy and avoid costly redesigns during project development, future studies should aim to cooperate directly with distribution system operators to obtain verified, location-specific data and assess technical hosting capacity as an additional spatial constraint. Third, the investigation of economic parameters remains underdeveloped. Beyond simplified proxies such as grid connection distance, a more comprehensive understanding of economic conditions is required—particularly with regard to regional variation in capital expenditures (CAPEX) and operational expenditures (OPEX) for different system types. These include, for instance, the higher CAPEX of elevated systems in viticulture compared to ground-mounted PV, as well as increased OPEX due to more complex maintenance and crop-specific system management. Further relevant factors include permitting requirements, substation capacities, and regional differences in land lease prices. Identifying such economic hotspots and constraints is crucial to assessing the real-world feasibility of agrivoltaic deployment and to enabling robust comparisons across land uses. This highlights the need for follow-up economic studies that complement spatial analyses. Finally, scaling the presented approach beyond a single federal state would allow for a comparative analysis across all winegrowing regions in Germany and beyond. A major opportunity, however, lies in transferring the approach to other countries with relevant viticultural areas. This would require the availability of standardized, high-resolution cadastral and agronomic data across jurisdictions. Collaborative frameworks for data harmonization and methodological transferability would significantly advance the evidence base for agrivoltaics in viticulture integration at national and international levels.
5. Conclusions
This study demonstrates that the suitability of agrivoltaic systems for use in viticulture depends on the combined impact of technical, infrastructural, and agronomic factors. Although vineyards are widespread in the Rhineland-Palatinate region, only a subset of plots meets key criteria such as moderate slope and adequate grid accessibility. Suitable sites tend to be found in flatter subregions with existing energy infrastructure, highlighting the need for location-specific, spatially differentiated planning. Grid accessibility is the most influential limiting factor for feasibility, while steep-slope vineyards are difficult to integrate structurally due to constraints relating to mechanization and anchoring. These findings support the core premise that realistic assessments must incorporate multiple site-specific constraints. The framework provides a practical screening tool at the plot level that can be used to complement broader national assessments by introducing crop-specific criteria relevant to viticulture. Using open, community-curated infrastructure data enables scalable, early-stage screening in settings with limited data, while making underlying assumptions transparent. Overall, combining geospatial analysis with viticultural knowledge can inform more targeted, context-sensitive strategies for integrating agrivoltaics into winegrowing landscapes. In conclusion, the study fulfils its two objectives by quantifying the share of vineyard area that remains feasible under crop-specific and infrastructural constraints and by demonstrating how alternative parameter thresholds reshape suitability outcomes by clarifying where and under which conditions agrivoltaics can realistically be integrated into German viticulture.
Author Contributions
Conceptualization, methodology, data curation, formal analysis, visualization, writing—original draft preparation, M.C.; writing—review and editing, supervision, project administration, funding acquisition, M.W. All authors have read and agreed to the published version of the manuscript.
Funding
This project was supported by funds from the Federal Ministry of Agriculture, Food and Regional Identity (BMLEH) based on a decision of the Parliament of the Federal Republic of Germany via the Federal Office for Agriculture and Food (BLE) under the research and innovation program ‘Climate Protection in Agriculture’ (Funding number: 2823FUI03).
Data Availability Statement
The datasets presented in this article are not readily available because their usage requires additional permission from a third-party entity (Landwirtschaftskammer Rheinland-Pfalz). Requests to access the datasets should be directed to the corresponding author, who can facilitate the permission process with the responsible authority.
Acknowledgments
The authors thanks all the state agencies and institutions that have supported this work with the processed geodata.
Conflicts of Interest
The authors declare no conflicts of interest. The funders had no role in the design of the study; in the collection, analyses, or interpretation of data; in the writing of the manuscript; or in the decision to publish the results.
Abbreviations
The following abbreviations are used in this manuscript:
| approx. | approximately |
| BLE | Federal Office for Agriculture and Food |
| BMLEH | Federal Ministry of Agriculture, Food, and Regional Identity |
| GHI | global horizontal irradiation |
| GWp | gigawatt peak |
| Ha | hectare |
| m | meter |
| MCDA | multi-criteria decision-making analysis |
| MWp | megawatt peak |
| OAT | one-at-a-time |
| PV | photovoltaics |
Appendix A
The visualizations provide an overview of the frequency distribution of slope, planting year, and grid distance across the vineyard dataset. These plots complement the main results by illustrating how the majority of vineyard area is concentrated on gentle slopes and in moderate grid proximity classes. They also serve as a transparent basis for the scenario design and subsequent sensitivity analysis, ensuring that the applied thresholds reflect the empirical structure of the dataset.
Appendix A.1
Most vineyards are located on gentle slopes: 50% of the planted area lies below a 10% slope, and 75% below 15%.

Figure A1.
Frequency distribution of vineyard plots across slope classes (in %). Data are based on vineyard plots in Rhineland-Palatinate.
Figure A1.
Frequency distribution of vineyard plots across slope classes (in %). Data are based on vineyard plots in Rhineland-Palatinate.

Appendix A.2
The underlying database shows that almost half of the vineyard area is over 20 years old, indicating the strong presence of long-established vineyards. The 0–20-year group, on the other hand, is distributed relatively evenly, comprising around 12–14% of the total area, which suggests continuous but moderate renewal of the vineyard stock. Vineyards aged 0–5 years account for a considerable 13.5% of the total area, indicating recent planting initiatives.

Figure A2.
Frequency distribution of vineyard plots by vine age classes. Vine age reflects planting year data provided by the vineyard cadaster.
Figure A2.
Frequency distribution of vineyard plots by vine age classes. Vine age reflects planting year data provided by the vineyard cadaster.

Appendix A.3
Figure A3 shows the frequency distribution of vineyard plots that are considered technically suitable in the scenarios. The classification is based on the distance from the plot centroid to the nearest grid infrastructure (≤250 m, 251–500 m, 501–1000 m). More stringent assumptions reduce the proportion of suitable land (see Table 7 for detailed figures).

Figure A3.
Frequency distribution of vineyard plots across different suitability scenarios compared with the excluded area.
Figure A3.
Frequency distribution of vineyard plots across different suitability scenarios compared with the excluded area.

Appendix B
The preprocessing standardized all geospatial inputs, ensured topological validity, and produced a consolidated, metric basis for proximity analysis. First, datasets were validated and restricted to the study area. Next, power-grid point sources were unified into a single set of potential grid-access locations and reprojected to a common metric CRS. Finally, vineyard plots were classified by distance to these access points and flagged where they intersected Natura 2000, enabling reproducible, decision-ready analyses.
- Coordination of the reference system. All distance-based operations were carried out in a metric CRS (EPSG:25832, UTM 32N). Layers used for proximity calculations were projected to EPSG:25832 before the main analysis.
- Geometry validation (QA). The Rhineland-Palatinate (RLP) boundary (WFS vermkv:landesgrenze_rlp) and Natura 2000 polygons were checked for geometry validity using qgis:checkvalidity to avoid topology issues in downstream overlays.
- Study-area clipping of protected areas. Natura 2000 polygons were clipped to the RLP boundary (native:clip/native:intersection) to restrict protected-area geometries to the study area and to improve the efficiency of analytical runs.
- Consolidation of potential grid-access points. Power-grid point layers from powergrid_2024-11-25.gpkg (substation, switch, minor_distribution, distribution, connection, and generator_renewable filtered to source = ‘wind’) were unified through a multi-step native:union sequence to produce a single consolidated multipoint dataset.
- Reprojection of the consolidated grid dataset. The consolidated grid-access points were reprojected to EPSG:25832 (native:reprojectlayer) to ensure that all subsequent distance thresholds were interpreted in meters.
- Plot proximity classification. Aggregated vineyard plots were classified by distance to the consolidated grid-access points using native:selectwithindistance. Reported distance bands were 100 m, 500 m, and 1000 m (additional thresholds were explored for exploratory reasons only).
- Protected-area flagging/exclusion. Plots intersecting Natura 2000 (RLP-clipped) were identified with native:selectbylocation (predicates including intersects/within/touches) and were flagged or excluded for the main analysis and sensitivity checks.
Table A1.
Documentation of the reproducible main steps (geometry validation, grid access points, reprojection, distance-based plot classification, Natura 2000 exclusion).
Table A1.
Documentation of the reproducible main steps (geometry validation, grid access points, reprojection, distance-based plot classification, Natura 2000 exclusion).
| Step | What Was Done | Input Data | Key Parameter | Output | Purpose |
|---|---|---|---|---|---|
| 1 | Project setup and coordinate system | — | Target CRS for all distance operations: ETRS_1989_UTM_Zone_32N | Common metric coordinate basis | Ensures all buffers/proximity calculations are in meters (consistent, comparable distances). |
| 2 | Geometry validity check | Rhineland-Palatinate boundary (WFS vermkv:landesgrenze_rlp), Natura 2000 polygons (Natura2000_end2023.gpkg) | qgis:checkvalidity (default settings) | Valid (cleaned) geometries | Reduces topology errors and prevents failures in overlay/clip operations. |
| 3 | Clip Natura 2000 to study area | Natura 2000 polygons + RLP boundary | native:clip/native:intersection | Natura 2000 polygons restricted to RLP | Guarantees protected-area layers match the study extent; avoids cross-border artefacts. |
| 4 | Consolidate potential grid-access points | powergrid_2024-11-25.gpkg point layers: substation, switch, minor_distribution, distribution, connection, generator_renewable (filtered to source = ‘wind’) | Sequence of native:union operations | Consolidated multipoint dataset of potential grid-access locations | Unifies all relevant grid POIs into a single, robust candidate set for proximity analysis. |
| 5 | Reproject consolidated points to metric CRS | Consolidated grid-access points (from Step 4) | native:reprojectlayer: ETRS_1989_UTM_Zone_32N | Grid-access points in uniform projected system | Required so distance thresholds are interpreted in meters. |
| 6 | Classify vineyard plots by proximity to grid-access points | Vineyard plots (aggregated cadastral layer) + consolidated grid-access points | native:selectwithindistance; thresholds used in reporting: 100 m, 500 m, 1000 m | Selection per distance band | Produces the proximity classes cited in the main text (e.g., the 1 km figure). |
| 7 | Flag/exclude plots with protected-area overlap | Vineyard plots + Natura 2000 (RLP-clipped) | native:selectbylocation; predicates incl. intersects/within/touches | Plots flagged or excluded if intersecting Natura 2000 | Reflects ecological/regulatory constraints in the site selection and sensitivity analysis. |
References
- European Union. Regulation (EU) 2021/1119 of the European Parliament and of the Council of 30 June 2021 Establishing the Framework for Achieving Climate Neutrality and Amending Regulations (EC) No 401/2009 and (EU) 2018/1999 (‘European Climate Law’), OJ L 243, 9 July 2021; European Parliament: Strasbourg, France, 2021; pp. 1–17. [Google Scholar]
- European Union. Regulation (EU) 2018/1999 of the European Parliament and of the Council of 11 December 2018 on the Governance of the Energy Union and Climate Action. Off. J. Eur. Union 2018, L 328, 1–77. Available online: https://eur-lex.europa.eu/legal-content/EN/TXT/PDF/?uri=OJ:L:2018:328:FULL (accessed on 9 September 2025).
- Kiesecker, J.M.; Evans, J.S.; Oakleaf, J.R.; Dropuljić, K.Z.; Vejnović, I.; Rosslowe, C.; Cremona, E.; Bhattacharjee, A.L.; Nagaraju, S.K.; Ortiz, A.; et al. Land use and Europe’s renewable energy transition: Identifying low-conflict areas for wind and solar development. Front. Environ. Sci. 2024, 12, 1355508. [Google Scholar] [CrossRef]
- Hilker, J.M.; Busse, M.; Müller, K.; Zscheischler, J. Photovoltaics in agricultural landscapes: “Industrial land use” or a “real compromise” between renewable energy and biodiversity? Perspectives of German nature conservation associations. Energy Sustain. Soc. 2024, 14, 6. [Google Scholar] [CrossRef]
- Zeddies, H.H.; Parlasca, M.; Qaim, M. Agrivoltaics Increases Public Acceptance of Solar Energy Production on Agricultural Land. Land Use Policy 2025, 156, 107604. [Google Scholar] [CrossRef]
- Dinesh, H.; Pearce, J.M. The potential of agrivoltaic systems. Renew. Sustain. Energy Rev. 2016, 54, 299–308. [Google Scholar] [CrossRef]
- Dupraz, C.; Marrou, H.; Talbot, G.; Dufour, L.; Nogier, A.; Férard, Y. Combining solar photovoltaic panels and food crops for optimising land use: Towards new agrivoltaic schemes. Renew. Energy 2011, 36, 2725–2732. [Google Scholar] [CrossRef]
- Amaducci, S.; Yin, X.; Colauzzi, M. Agrivoltaic systems to optimise land use for electric energy production. Appl. Energy 2018, 220, 545–561. [Google Scholar] [CrossRef]
- Statistisches Bundesamt (Destatis). Land Use in Germany; Statistisches Bundesamt: Wiesbaden, Germany, 2023.
- Bundesministerium für Wirtschaft und Klimaschutz (BMWK). Photovoltaik-Strategie: Handlungsfelder und Maßnahmen für Einen Beschleunigten Ausbau der Photovoltaik; BMWK: Berlin, Germany, 2023. Available online: https://www.bundeswirtschaftsministerium.de/Redaktion/DE/Publikationen/Energie/photovoltaik-stategie-2023.pdf (accessed on 29 August 2025).
- Wagner, M.; Stanbury, P.; Dietrich, T.; Döring, J.; Ewert, J.; Foerster, C.; Freund, M.; Friedel, M.; Kammann, C.; Koch, M.; et al. Developing a Sustainability Vision for the Global Wine Industry. Sustainability 2023, 15, 10487. [Google Scholar] [CrossRef]
- Santos, J.A.; Fraga, H.; Malheiro, A.C.; Moutinho-Pereira, J.; Dinis, L.-T.; Correia, C.; Moriondo, M.; Leolini, L.; Dibari, C.; Costafreda-Aumedes, S.; et al. A Review of the Potential Climate Change Impacts and Adaptation Options for European Viticulture. Appl. Sci. 2020, 10, 3092. [Google Scholar] [CrossRef]
- van Leeuwen, C.; Destrac-Irvine, A.; Dubernet, M.; Duchêne, E.; Gowdy, M.; Marguerit, E.; Pieri, P.; Parker, A.; de Rességuier, L.; Ollat, N. An Update on the Impact of Climate Change in Viticulture and Potential Adaptations. Agronomy 2019, 9, 514. [Google Scholar] [CrossRef]
- Willockx, B.; Lavaert, C.; Cappelle, J. Geospatial Assessment of Elevated Agrivoltaics on Arable Land in Europe to Highlight the Implications on Design, Land Use and Economic Level. Energy Rep. 2022, 8, 8736–8751. [Google Scholar] [CrossRef]
- Trommsdorff, M.; Hopf, M.; Hörnle, O.; Berwind, M.; Schindele, S.; Wydra, K. Can synergies in agriculture through an integration of solar energy reduce the cost of agrivoltaics? An economic analysis in apple farming. Appl. Energy 2023, 350, 121619. [Google Scholar] [CrossRef]
- Du, F.; Deng, W.; Yang, M.; Wang, H.; Mao, R.; Shao, J.; Fan, J.; Chen, Y.; Fu, Y.; Li, C.; et al. Protecting grapevines from rainfall in rainy conditions reduces disease severity and enhances profitability. Crop Prot. 2015, 67, 261–268. [Google Scholar] [CrossRef]
- Magarelli, A.; Mazzeo, A.; Ferrara, G. Fruit Crop Species with Agrivoltaic Systems: A Critical Review. Agronomy 2024, 14, 722. [Google Scholar] [CrossRef]
- Agrivoltaics Map—Facilities Trackey by Fraunhofer ISE. Available online: https://agrivoltaicsmap.github.io/Facilities/ (accessed on 17 July 2025).
- Strub, L.; Wittke, M.; Trommsdorff, M.; Stoll, M.; Kammann, C.; Loose, S. Assessing the economic performance of agrivoltaic systems in vineyards—Framework development, simulated scenarios and directions for future research. Front. Hortic. 2024, 3, 1473072. [Google Scholar] [CrossRef]
- Rösch, C.; Fakharizadehshirazi, E. The spatial socio-technical potential of agrivoltaics in Germany. Renew. Sustain. Energy Rev. 2024, 202, 114706. [Google Scholar] [CrossRef]
- Cammerino, A.R.B.; Ingaramo, M.; Piacquadio, L.; Monteleone, M. How Much Longer Can We Tolerate Further Loss of Farmland Without Proper Planning? The Agrivoltaic Case in the Apulia Region (Italy). Agronomy 2025, 15, 1177. [Google Scholar] [CrossRef]
- European Environment Agency (EEA). Natura 2000 Areas—End 2023. 2024. Available online: https://www.eea.europa.eu/en/datahub/datahubitem-view/6fc8ad2d-195d-40f4-bdec-576e7d1268e4 (accessed on 31 July 2025).
- Hauger, S.; Lieb, V.; Glaser, R. Spatial Potential Analysis and Site Selection for Agrivoltaics in Germany. Renew. Sustain. Energy Rev. 2025, 213, 115469. [Google Scholar] [CrossRef]
- Statistisches Bundesamt (Destatis). Wine Production in Germany—Key Figures and Regional Data. Available online: https://www.destatis.de/EN/Themes/Economic-Sectors-Enterprises/Agriculture-Forestry-Fisheries/Wine/Tables/liste-wine.html (accessed on 17 July 2025).
- Statistical Office of Rhineland-Palatinate. Land Use of Agricultural Holdings, Bodennutzung Landwirtschaftlicher Betriebe 2024; Statistical Office of Rhineland-Palatinate: Bad Ems, Germany, 2024; p. 11. Available online: https://www.statistischebibliothek.de/mir/servlets/MCRFileNodeServlet/RPHeft_derivate_00008544/C1023_202400_1j_L.pdf (accessed on 17 July 2025).
- World Bank Group; Energy Sector Management Assistance Program (ESMAP). Global Solar Atlas—Online Tool. Entry for the Rheinhessen region. Available online: https://globalsolaratlas.info/map?c=49.246293,7.3526,8&s=49.824695,8.129196&m=site (accessed on 17 July 2025).
- Deutscher Wetterdienst (DWD). Klimastatusbericht 2024 (Climate Status Report 2024). Available online: https://www.dwd.de/DE/leistungen/klimastatusbericht/publikationen/ksb_2024.pdf (accessed on 17 July 2025).
- QGIS Development Team. QGIS Geographic Information System, Version 3.12.7. Open Source Geospatial Foundation Project. Available online: https://qgis.org (accessed on 17 July 2025).
- Landwirtschaftskammer Rheinland-Pfalz. Viticultural Cadastral Data—Digital Vector Dataset for Vineyard Plots in Rhineland-Palatinate; Landwirtschaftskammer Rheinland-Pfalz: Mainz, Germany, 2024. [Google Scholar]
- OpenStreetMap contributors. OpenStreetMap. Available online: https://www.openstreetmap.org (accessed on 17 July 2025).
- Bundesministerium der Justiz. Weinverordnung (WeinV)–§ 34b: Gebiete mit geschützter Ursprungsbezeichnung. Gesetze im Internet. 2024. Available online: https://www.gesetze-im-internet.de/weinv_1995/__34b.html (accessed on 17 July 2025).
- Öko-Institut. Potenzialflächen für Agri-Photovoltaik; Öko-Institut e.V.: Freiburg, Germany, 2024; Available online: https://www.oeko.de/fileadmin/oekodoc/Potenzialflaechen_fuer_Agri-Photovoltaik.pdf (accessed on 17 July 2025).
- Battaglini, A.; Komendantova, N.; Brtnik, P.; Patt, A. Perception of Barriers for Expansion of Electricity Grids in the European Union. Energy Policy 2012, 47, 254–259. [Google Scholar] [CrossRef]
- Strub, L.; Wittke, M.; Trommsdorff, M.; Stoll, M.; Kammann, C.; Loose, S. Schattendasein. Dtsch. Weinbau 2025, 9, 24–29. [Google Scholar]
- Steinbach, A. Barriers and Solutions for Expansion of Electricity Grids—The German Experience. Energy Policy 2013, 63, 224–229. [Google Scholar] [CrossRef]
- Gorman, W.; Kemp, J.M.; Rand, J.; Seel, J.; Wiser, R.; Manderlink, N.; Kahrl, F.; Porter, K.; Cotton, W. Grid connection barriers to renewable energy deployment in the United States. Joule 2025, 9, 101791. [Google Scholar] [CrossRef]
- Couto, A.; Estanqueiro, A. Wind Power Plants Hybridised with Solar Power: A Generation Forecast Perspective. J. Clean. Prod. 2023, 423, 138793. [Google Scholar] [CrossRef]
- The cost disadvantage of steep slope viticulture and strategies for its mitigation. OENO One 2021, 55, 224–229. [CrossRef]
- Fattoruso, G.; Toscano, D.; Venturo, A.; Scognamiglio, A.; Fabricino, M.; Di Francia, G. A Spatial Multicriteria Analysis for a Regional Assessment of Eligible Areas for Sustainable Agrivoltaic Systems in Italy. Sustainability 2024, 16, 911. [Google Scholar] [CrossRef]
- Hauger, S.; Bieber, L.-M.; Schürmer, T.; Lieb, V.; Trötsch, H.; Torres Boggio, A.A.; Hopf, M.; Rößner, J.-V.; Böhm, D.; Grolik, S.; et al. AgriChance. Agri-PV als Chance für Landwirtschaft und Energiewende in Hamburg—Entscheidungshilfevorhaben zur Darlegung des Potenzials, der Ökonomischen Betrachtung und Energetischen Integration. Abschlussbericht; Fraunhofer ISE: Freiburg, Germany, 2024; p. 173. [Google Scholar] [CrossRef]
- Uzun Bayraktar, T. New Approaches in Viticulture: Different Rates of Net Shadow Applications to Yield, Must, Color and Wine Quality. Horticulturae 2025, 11, 21. [Google Scholar] [CrossRef]
- Kiefer, C.; Szolnoki, G. Exploring Market Potential and Consumer Preferences for Fungus-Resistant Grape Varieties: A Discrete Choice Analysis in Germany. Future Foods 2024, 10, 100449. [Google Scholar] [CrossRef]
- KTBL (Kuratorium für Technik und Bauwesen in der Landwirtschaft e.V.). Weinbau und Kellerwirtschaft: KTBL-Datensammlung, 16th ed.; KTBL: Darmstadt, Germany, 2017; ISBN 978-3-945088-42-5. [Google Scholar]
- Marone, E.; Bertocci, M.; Boncinelli, F.; Marinelli, N. The Cost of Making Wine: A Tuscan Case Study Based on a Full Cost Approach. Wine Econ. Policy 2017, 6, 88–97. [Google Scholar] [CrossRef]
- Rathnayake, C.; Joshi, S.; Cerratto-Pargman, T. Mapping the Current Landscape of Citizen-Driven Environmental Monitoring: A Systematic Literature Review. Sustain. Sci. Pract. Policy 2020, 16, 326–334. [Google Scholar] [CrossRef]
- Werner, C.P.; Birkhaeuer, J.; Locher, C.; Gerger, H.; Heimgartner, N.; Colagiuri, B.; Gaab, J. Price Information Influences the Subjective Experience of Wine: A Framed Field Experiment. Food Qual. Prefer. 2021, 92, 104223. [Google Scholar] [CrossRef]
- Poni, S.; Gatti, M.; Palliotti, A.; Dai, Z.; Duchêne, E.; Truong, T.-T.; Ferrara, G.; Matarrese, A.M.S.; Gallotta, A.; Bellincontro, A.; et al. Grapevine Quality: A Multiple Choice Issue. Sci. Hortic. 2018, 234, 445–462. [Google Scholar] [CrossRef]


Disclaimer/Publisher’s Note: The statements, opinions and data contained in all publications are solely those of the individual author(s) and contributor(s) and not of MDPI and/or the editor(s). MDPI and/or the editor(s) disclaim responsibility for any injury to people or property resulting from any ideas, methods, instructions or products referred to in the content. |
© 2025 by the authors. Licensee MDPI, Basel, Switzerland. This article is an open access article distributed under the terms and conditions of the Creative Commons Attribution (CC BY) license (https://creativecommons.org/licenses/by/4.0/).