1. Introduction
Approximately 64 million dry tons of forest harvest residues are produced annually in the US, and an additional 87 million dry tons of wood remain as milling residues [
1]. These residues are a potential feedstock for the production of biochar. Biochar is a charcoal-like product of thermal degradation of biomass in limited presence or absence of oxygen (pyrolysis) that could be used as a soil amendment to improve soil health and crop productivity [
2]. However, biochar is not a uniform product. A characteristic of the feedstock type and pyrolysis conditions determines its structure, nutrient content, pH, and other properties [
3,
4,
5]. Biochar has between 40% to 90% carbon (C) and, depending on the pyrolysis temperature, it could be either acidic or alkaline. Low-temperature pyrolysis (<400 °C) usually produces acidic biochar while high-temperature pyrolysis (>600 °C) produces alkaline biochar.
In the inland Pacific Northwest (iPNW) of the USA, there is growing interest in biochar to remedy deteriorating soil conditions particularly in regions where winter wheat-summer fallow (WW-SF) has been practiced for the last 80 to 100 years. Soils under the WW-SF system have lost more than 60% of soil organic matter (SOM) in the top 0–30 cm depth profile. In this system, only one crop is grown in two years, and the resultant crop residues are inadequate to maintain or increase SOC. Growing cover crops or annual cropping could restore SOC, which is rather challenging for low precipitation zones of iPNW where WW-SF is practiced. In addition, the soils in iPNW acidified over time due to the continual use of ammoniacal N fertilizers with some soils now showing pH values as low as 4.6 to 4.8 in the top 30-cm depth [
6,
7].
The presence of biochemically recalcitrant and predominantly aromatic carbon in biochar is often attributed to its long-term C storage potential [
8]. Therefore, applying biochar can quickly increase th total C pool in iPNW soils. In addition, biochar amendments supply phosphorus (P), potassium (K), sulfur (S), and other trace minerals to the soil. Adding lime (CaCO
3) to the soil is the most recommended method to reduce soil acidity. However, the application of agricultural lime results in carbon dioxide (CO
2) emissions that contribute to global warming. For example, in 2001, about 20–30 Tg of lime was applied to soils in the US, resulting in net CO
2 emissions of 4.4–6.6 Tg [
9]. Alkaline biochar with high liming value can be a substitute for lime in reducing soil acidity observed in iPNW soils without releasing excess CO
2. Liming reduces soil acidity and alleviates aluminum (Al) and iron (Fe) toxicity [
10]. Amending acidic and low SOM soils of iPNW with alkaline biochar can increase total C, reduce soil acidity, improve soil health, and contribute to climate change mitigation [
11].
Studies of biochar impacts on soil health and crop productivity have shown varied responses across soil types and management systems. Biochar application rates from 0.5 to 135 t ha
−1 have produced plant growth responses ranging from −29% to 324% [
12]. Plant and soil responses of biochar application also varied with agricultural systems, crop type, climatic conditions [
13,
14], and fertilization status [
15]. Lone et al. [
16] showed that biochar could affect soil N cycling and several transformation mechanisms, such as reduced inorganic N leaching by increasing nutrient retention due to cation and anion exchange reactions and immobilization of inorganic N due to labile C fractions of biochar. Biochar could also prevent nitrification and denitrification losses by increasing adsorption of NH
4+ and NO
3−. Especially, in fertilized systems with biochar amendments, there is a greater reduction in N loss and consequently, higher fertilizer use efficiency [
16]. Yet, biochar and fertilizer interactions on plant production and soil health are inconclusive. Some authors have reported that treatments receiving both biochar and fertilizer increased fertilizer use efficiency by enhancing plant growth and soil N mineralization than in treatments receiving either [
17,
18,
19]. However, a recent meta-analysis using 371 independent studies indicated no additive or synergistic relation between biochar and fertilizer [
20]. The study also reported differences in the efficiency of fertilizer with varying rates of biochar, and reduced efficiency, especially at higher doses [
15]. Besides, information on application rates for different crops and soils is lacking [
2]. Clearly, site-specific research on the effects of biochar on soil properties and crop production are needed. Studies conducted under diverse soil nutrient management practices will assist producers to find optimal biochar rates for their soils to improve agricultural sustainability [
16,
21].
A greenhouse experiment was conducted with the objective of investigating the effect of different rates of wood biochar on soil properties and winter wheat growth in an iPNW soil. We evaluated (1) soil chemical and biochemical properties, and (2) winter wheat shoot and root growth using different biochar application rates in the presence and absence of chemical fertilizers.
2. Materials and Methods
2.1. Experimental Setup
A Walla Walla silt loam soil (coarse-silty, mixed, superactive, mesic Typic Haploxerolls) [
22] with 18% Clay, 70% silt, and 12% fine sand was collected from the top 20 cm depth of a WW-SF field at the Columbia Basin Agriculture Center (CBARC) near Pendleton, Oregon (45°42′ N, 118°36′ W, Elev. 438 m) for the study. A factorial randomized block design experiment with four replications consisting of four biochar rates (0, 11.2, 22.4, 44.8 Mg ha
−1) with and without fertilizer was established in the greenhouse at CBARC. Fertilizer treatments were equivalent to 90 kg N ha
−1, 45kg P ha
−1 and 20 kg S ha
−1, the rate typically used for winter wheat production in the region. Air-dried soil, fertilizers and biochar were evenly mixed in a custom-build portable rotary cement mixer for 5 min and packed into 4 L capacity plastic pots (14 cm i.d. by 14 cm tall). Soil moisture was measured using Stevens Hydra probe (Stevens Water Monitoring Systems Inc., Portland, OR, USA) and soil water content was adjusted by adding deionized water in pots when the moisture was below 70% of the field capacity.
The biochar used in this study was a co-product of energy production in Philomath, OR (Biological Carbon, LLC, Philomath, Oregon, USA). The pyrolysis temperature was about 900 °C, and Douglas fir (
Pseudotsuga menziesii) was the main feedstock for the biochar production. Biochar chemical characteristics were determined using the standard method for wood charcoal analysis [
23] at Control Laboratories Inc. (Watsonville, CA, USA). Soil samples collected for the experiment were also analyzed for basic soil properties in the AgSource Laboratory (Umatilla, OR, USA). Analyses of biochar and soil properties are reported in
Table 1.
Wheat seeds were pre-germinated in Petri-dishes on moistened paper towels in growth champers set at 4 °C for 48 h, and six pre-germinated seeds were sown in each pot. Seedlings were thinned to four per pot two weeks after sowing. The pots were placed in shallow trays and watered with deionized water to maintain field capacity throughout the 10 weeks of the experiment.
2.2. Plant and Soil Analysis
The whole wheat shoot biomass was harvested by cutting shoots at the soil surface using stainless steel scissors and weight to determine fresh weight and dried at 70 °C for 72 h to estimate dry matter content. Roots in the bulk soil were separated by passing soil through a 2 mm sieve. Roots passing through 2 mm sieves were separated by wet sieving 500 g sub-sample through 250 μm sieves for 20 min [
24] and dried for 24 h at 70 °C to estimate dry mass.
Soil from each pot was homogenized, passed through a 2 mm sieve to separate the root and shoot residue and a 500 g sub-sample was collected and stored at 4 °C until analysis. Soil inorganic N [sum of NO3− and NH₄+] was determined by extracting 10 g soil sub-samples in 50 mL 1 M potassium chloride solution and analyzed in an Astoria Analyzer with micro-segmented flow analysis system (Astoria-Pacific Inc., Clackamas, OR, USA). Soil pH and electrical conductivity (EC) were determined in 1:2 soil to deionized water ratio (w/v) using a pH/Conductivity meter (Thermo Scientific™ Orion™ Star A215 pH and Conductivity Benchtop Meter). The rest of the soil sub-samples were sent to a commercial lab (AgSource Laboratories, Umatilla, OR) for the analysis of other soil properties. Soil total C and N concentrations were determined by combustion analysis (Flash EA 1112 series, Thermo Finnigan, San Jose, CA, USA) of soil that had been oven-dried (60 °C, 72 h) and finely ground for 2 min in Shatter 1 Box 8530 ball mill (Spex Sample Prep., Metuchen, NJ, USA). Soil pH was less than 6.5 in all soil samples; hence total C from these samples were considered as SOC.
2.3. Statistical Analysis
Statistical significance (α = 0.05) for mean comparisons of variables was determined using a mixed model analysis of variance (Proc. Mixed) with two-way analysis term for factorial experiments (SAS ver. 9.4, SAS Institute, Cary, NC, USA). Plant growth parameters and soil properties were response variables, fertilizer and biochar treatments were explanatory variables, and replication was considered as a random effect on the model. The relationships between soil properties were evaluated by the Pearson Correlation (Proc CORR) procedure (SAS, ver. 9.4).
3. Results
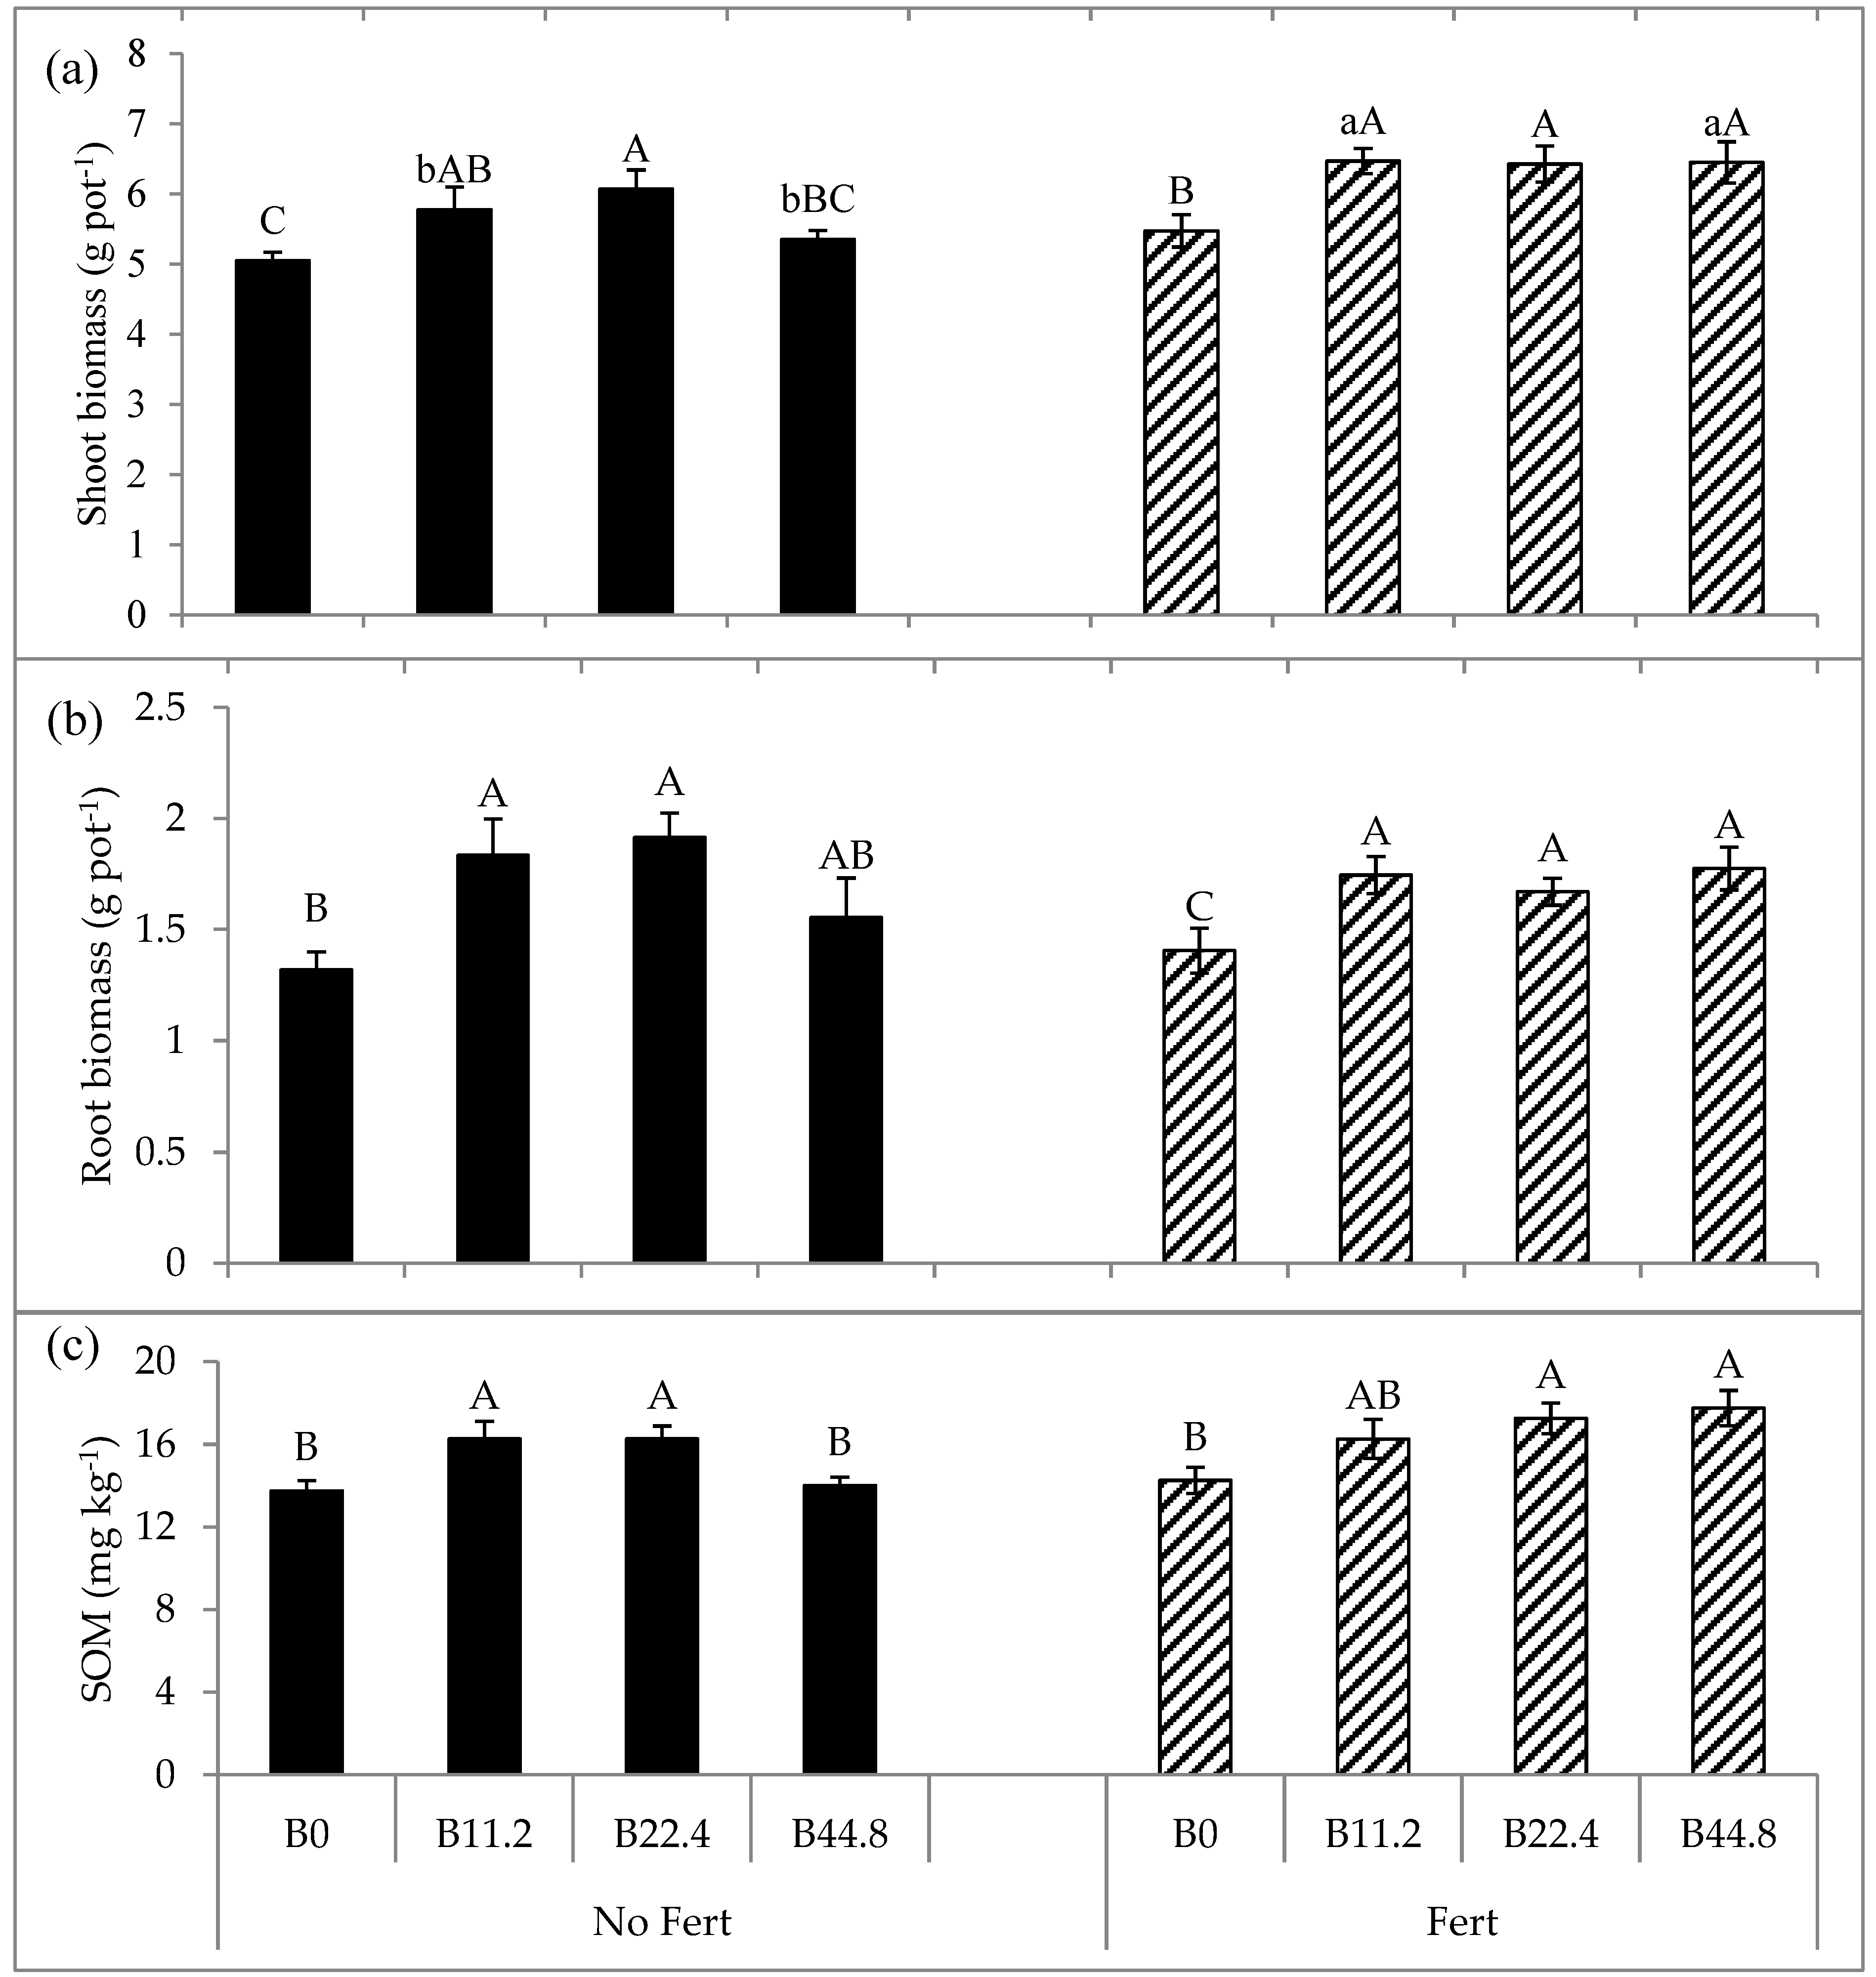
Biochar and fertilizer application had significant effects on shoot biomass, and only biochar had a significant effect on root biomass (
Table 2). Biochar increased wheat shoot biomass by 15% to 20% (control: 5.1 g
−1 pot) when applied at the rate of 11.2 and 22.4 Mg ha
−1 without fertilizer addition; and by 17% to 18% (control: 5.5 g
−1 pot) with fertilizer application (
Figure 1a). The highest biochar application rate (44.8 Mg ha
−1) increased shoot biomass of wheat by 18% (6.45 g
−1 pot) compared to the control in fertilized treatments. However, without fertilizer addition, only two to three plants survived in two out of four replications resulting in reduced shoot and root biomass in treatments with the highest biochar rate. Root biomass increased by 39 and 45% compared to the control (1.3 g
−1 pot) without fertilizer addition, and by 19% and 24% with fertilizer application at the rate of 11.2 and 22.4 Mg ha
−1 biochar application (
Figure 1b).
There were significant biochar and fertilizer interactions on many soil properties (
Table 2). Th soil pH, P, K, and S concentration, increased with biochar rates (
Figure 2). Without fertilizer addition, the soil pH increased by 1.1 units in the 44.8 Mg ha
−1 biochar treatment compared to the control (5.3). Soil pH increased by 1.2 units (control: 5.1) at the same biochar rate when the fertilizer was added. There was a strong positive correlation among soil pH and P, K, and S concentrations regardless of fertilizer application (
Table 3). Soil P was 18% to 50% greater with 11.2 to 44.8 Mg ha
−1 biochar rates, respectively, than controls (33 mg P kg
−1 soil) without fertilizer addition while it was 14% to 36% greater, respectively, with biochar than control (34 mg P kg
−1 soil) in fertilized treatments (
Figure 2). Sulfur was 93% to 380% greater in biochar treatments than control (18.8 mg S kg
−1 soil) without fertilizer and 66 to 297% more than control (29 mg S kg
−1) with fertilizer application. Soil K was 16 to 55% greater in biochar treatments than control (888 mg K kg
−1 soil) without fertilizer and 12% to 40% greater than control (951 mg K kg
−1 soil) with fertilizer addition. The soil pH and nutrients were negatively correlated with soil NO
3-N and NH
4-N in treatments receiving fertilizer application, whereas, without fertilizer, soil pH and nutrients were positively correlated with soil NO
3-N and NH
4-N concentrations (
Table 3).
The NO
3-N and NH
4-N contents decreased with increasing biochar rates in fertilized treatments (
Figure 2). Without fertilizer addition, both NO
3-N and NH
4-N did not respond to increasing biochar rates except at the highest biochar rates. There was no significant biochar and fertilizer interaction on SOM content, but increasing biochar rates significantly increased SOM compared to the control (
Table 2 and
Figure 1c). The biochar application increased SOM content by 13% to 20%, and the highest increase was observed at 22.4 Mg ha
−1 biochar rate. With fertilizer application, SOM was positively correlated with nutrients (P, K, and S) and negatively correlated with NO
3-N and NH
4-N whereas without fertilizer application there was no correlation of SOM with the nutrients (
Table 3).
4. Discussion
The alkaline forest biochar increased soil pH and SOM in all treatments compared to soil with no biochar, suggesting a potential for improving soil health with biochar application. Regardless of fertility, soil P, K, and S increased with increasing biochar rates indicating that either biochar contributed the nutrients or the increase in pH increased nutrient availability in the soil. Biochar is a source of several nutrients; its complex reaction with soil releases nutrients, making them available for plant uptake over time [
20,
25]. Availability of N, P, K, and S also increase with pH [
12,
26]. In this study, biochar increased soil pH by more than a unit from about 5 to 6 and there was a strong positive correlation among soil pH and P, K and S. The soil pH increase, however, was greater in treatments receiving fertilizer application than in the corresponding treatments with no fertilizer addition indicating that fertilizer application could enhance the biochar effect to reduce soil acidity. The increase in pH and the nutrients probably enhanced shoot and root growth.
Unlike other nutrients, application of biochar decreased soil NO
3-N and NH
4-N concentration. The reduction in NO
3-N and NH
4-N coincided with the increased wheat shoot and root biomass, suggesting that the reduction of these nutrients was due to increased plant uptake. The opposite was true when the soil was not fertilized. Soil NO
3-N and NH
4-N remained high at the highest biochar rates indicating the inability of plants to take up these nutrients. Subsequently, wheat shoot and root biomass were reduced under the highest biochar rate (44.8 Mg ha
−1) when the soil was not fertilized. Biochar used in this study had very high C:N ratio (500:1) that could have tied up some of N, thereby limiting its availability to plants. The reduced availability of inorganic N without fertilizer addition suggests the strong affinity of biochar for NH
4-N and NO
3-N [
27,
28]. Biochar N is mainly found in the heterocyclic compound, which is suggested to be resistant to microbial degradation hence not easily available for plant use [
29,
30]. Moreover, biochar also increases nutrient retention due to cation and anion exchange reactions and immobilizes inorganic N due to high C:N ratio (500:1) [
16]. Therefore, in the treatment that received a high dose of biochar without fertilization, nutrient supply, especially soil available N was likely not enough to support plant survival.
The SOM was positively correlated with soil P, K, and S concentrations, and negatively correlated with NO
3-N and NH
4-N in fertilized soil; however there was no correlation in unfertilized treatments. These findings highlight the positive role of fertilization on the effectiveness of biochar in nutrient availability and plant uptake. Although SOM generally increased with an increase in biochar rates, it was lower in unfertilized than in fertilized treatments at the highest biochar rate. Death of plants at the highest biochar rates in treatments without fertilizer resulted in reduced shoot and root biomass which ultimately resulted in the low SOM accumulation. Barontia et al. [
31] observed reduced durum wheat productivity biochar rates above 10 Mg ha
−1. Wheat death at a higher biochar rate implies that biochar application rates greater than 22.4 Mg ha
−1 may not be beneficial for wheat biomass production in a Walla Walla silt loam soil. Overrall, the alkaline biochar was effective in ameliorating soil acidity and increasing SOM, nutrient availability and uptake by plants, and plant shoot and root biomass. Further on-farm studies will enhance our understanding of the agronomic and environmental benefits of biochar on soil health and plant productivity.
5. Conclusions
Biochar amendment improved the soil chemical environment of the Walla Walla silt loam and wheat growth and has the potential to enhance agricultural sustainability in iPNW. Applying biochar at rates up to 22.4 Mg ha−1, with and without fertilizer addition, increased wheat shoot and root biomass. However, at the highest rate of (44.8 Mg ha−1), wheat biomass was reduced, especially when no fertilizer was added. Biochar positively influenced on soil properties, which ultimately affected plant production. Increasing biochar application rates significantly increased SOM, soil pH, availability of P, K, and S content; all factors critical for improving soil health. The increase in SOM was not solely due to C additions from the biochar but also from root biomass as indicated by the lowering of SOM at the highest biochar application rate without fertilization where plants died. It appears that the optimum biochar application rate for the Walla Walla silt loam is 22.4 Mg ha−1. The reduction in soil NO3-N with increase in biochar application rates was attributed to plant uptake under the fertilized treatment. Our study suggested that the addition of biochar could enhance soil health and wheat production. The biochar application can reduce soil acidity and improve wheat yield. However, because of the high C:N ratio, we recommend the addition of adequate fertilizer when amending the soil with biochar, particularly in low-fertility soil and at high biochar rates of application. Our greenhouse study generated positive preliminary results on soil and wheat responses to biochar application. However, field experiments are needed to measure and quantify long-term agronomic and environmental benefits of biochar on agricultural soils in the iPNW.


