Article

Site and Management Effects on Grain Yield and Yield Variability of Rainfed Lowland Rice in the Kilombero Floodplain of Tanzania

by
Julius Kwesiga
1,*,
Kristina Grotelüschen
1,
Daniel Neuhoff
1,
Kalimuthu Senthilkumar
2,
Thomas F. Döring
1 and
Mathias Becker
1
1
Institute of Crop Science and Resource Conservation (INRES), University of Bonn, 53115 Bonn, Germany
2
Africa Rice Center (AfricaRice), P.O. Box 1690, Antananarivo, Madagascar
*
Author to whom correspondence should be addressed.
Agronomy 2019, 9(10), 632; https://doi.org/10.3390/agronomy9100632
Submission received: 19 July 2019 / Revised: 8 October 2019 / Accepted: 11 October 2019 / Published: 12 October 2019

Abstract

:
In East Africa, smallholder farmers produce rainfed lowland rice mainly in floodplains. Low nitrogen contents of the predominant Fluvisols and highly variable hydrological conditions result in low yields and large yield variations, and hence, result in high production risks for farmers. We investigated crop management strategies aimed at increasing yield and reducing yield variability. The field trials were carried out in the Kilombero floodplain near Ifakara in Tanzania, in three hydrological zones (potentially drought-prone fringe, favorable middle and submergence-prone center positions) over three years. The study compared farmers’ management practices (no field levelling and bunding, no fertilizer input), with the effect of bunding and levelling alone, or in combination with mineral N use at 0 (bunding), 60 (recommended rate) and 120 kg + 60 kg PK ha−1 (attainable yield). Rice mean grain yields (averaged over the four treatments) were higher in the fringe (6.5 t ha−1) and the middle (5.7 t ha−1) than in the center positions (4.6 t ha−1). Farmers’ practice resulted in lowest yield (3.0 t ha−1) and highest yield variability, with an adjusted coefficient of variation (aCV) of up to 91% between fields, years and positions. Simple bunding of the plots and field levelling increased yields by 40% above farmers’ practice, particularly in the fringe and middle positions, while reducing yield variation (aCV of 36–61%). Mineral N application resulted in the highest yields (7.0 t ha−1) and further reduced yield variation (aCV of 14–27%). However, only in bunded fields of the floodplain fringe rice could benefit from N application beyond 60 kg ha−1, while mineral N use efficiency was lower in middle and center positions. Improved crop management options are most beneficial in floodplain fringe positions, where they can increase yields and reduce production risks. Due to low yield, high production risks and poor responsiveness to management interventions, the center may be taken out of rice production and could be considered for future use as protection zones.

1. Introduction

Rice production in East Africa has significantly increased over the past decades, particularly in Ethiopia, Kenya, Madagascar, Malawi, Rwanda, Somalia, South Sudan and Tanzania [1]. Income increases in urban areas favor the consumption of rice compared to other staple foods [2], and this is expected to increase further [3]. In Tanzania, urbanization and the rise of a middle-income class are likely to shift the main staple from maize to rice [4]. Rice production, however, is not keeping pace with such demand developments [5,6]. Despite its high rice self-sufficiency of 83% [7], rice imports are still required to meet the gap between demand and domestic production [4,7]. Thus, rice imports of 240,000 tonnes (< half of the countries’ rice exports) covered 12% of Tanzania’s rice consumption in 2016 [1]. At the same time, it is estimated that only < 4% of the land area suitable for rice production is currently cultivated [8], providing abundant opportunities for the expansion of rice areas.
In Tanzania, lowland rice is produced mainly in floodplain environments. A feature of floodplains in general and of Kilombero (one of the largest rice producing areas of Tanzania) in particular is their diverse hydrological conditions. Areas located in proximity to the central river are flooded by the spill-over water from the river (ex-situ rainfall in the upper watershed), while in-situ rainfall and subsurface interflow water from adjacent slopes determine the hydrology in the fringe positions of the floodplain [9]. The middle positions are variably affected by both hydrological processes [10]. The soils are relatively low in C and N contents and usually fine-textured close to the river [11], resulting in a pattern of hydrological and edaphic situations across the floodplain that can roughly be differentiated as submergence-prone center, favorable middle and potentially drought-prone fringe positions that also differ in their suitability for rice cultivation.
Rice grain yields in Kilombero are relatively low (typically < 2 t ha−1) and highly variable, with the hydro-edaphic differences highlighted, and with poor crop, soil and water management practices by farmers being the main culprits [12,13]. A low soil N content combined with low application rates of mineral fertilizers or organic amendments result in wide-spread N deficiency in rice. Additionally, low and variable productivity may be exacerbated by the use of landraces or traditional genotypes with a low yield potential (1.0–2.0 t ha−1) and reduced responsiveness to applied inorganic fertilizers [13].
There is substantial knowledge on the effects of seasonal soil N dynamics on lowland rice [14,15,16], on the effects and use efficiency of applied mineral N along valley toposequence [5,17], and on interactions between N use efficiency and S application in a floodplain environment in West Africa [18]. However, little is known about the effects of soil and N management practices on rice performance attributes and yield stability in hydrologically-variable floodplain environments of East Africa. The present study investigated the agronomic effects of flooding regimes in different positions and the role of land and N fertilizer management on yield and yield variability of the Kilombero floodplain. We hypothesize that rice productivity and its variability are affected by the interaction between management practices and the dominant soil attributes and hydrological positions in the floodplain. Our objectives were to: (i) assess the effect of the hydro-edaphic conditions (position in the floodplain) on rice yields, (ii) evaluate the effects of field bunding and levelling and of N-fertilizer application on rice yields and their variability and (iii) assess interactions of management practices and hydrological positions on N use and use efficiency.

2. Materials and Methods

2.1. Geographical Location

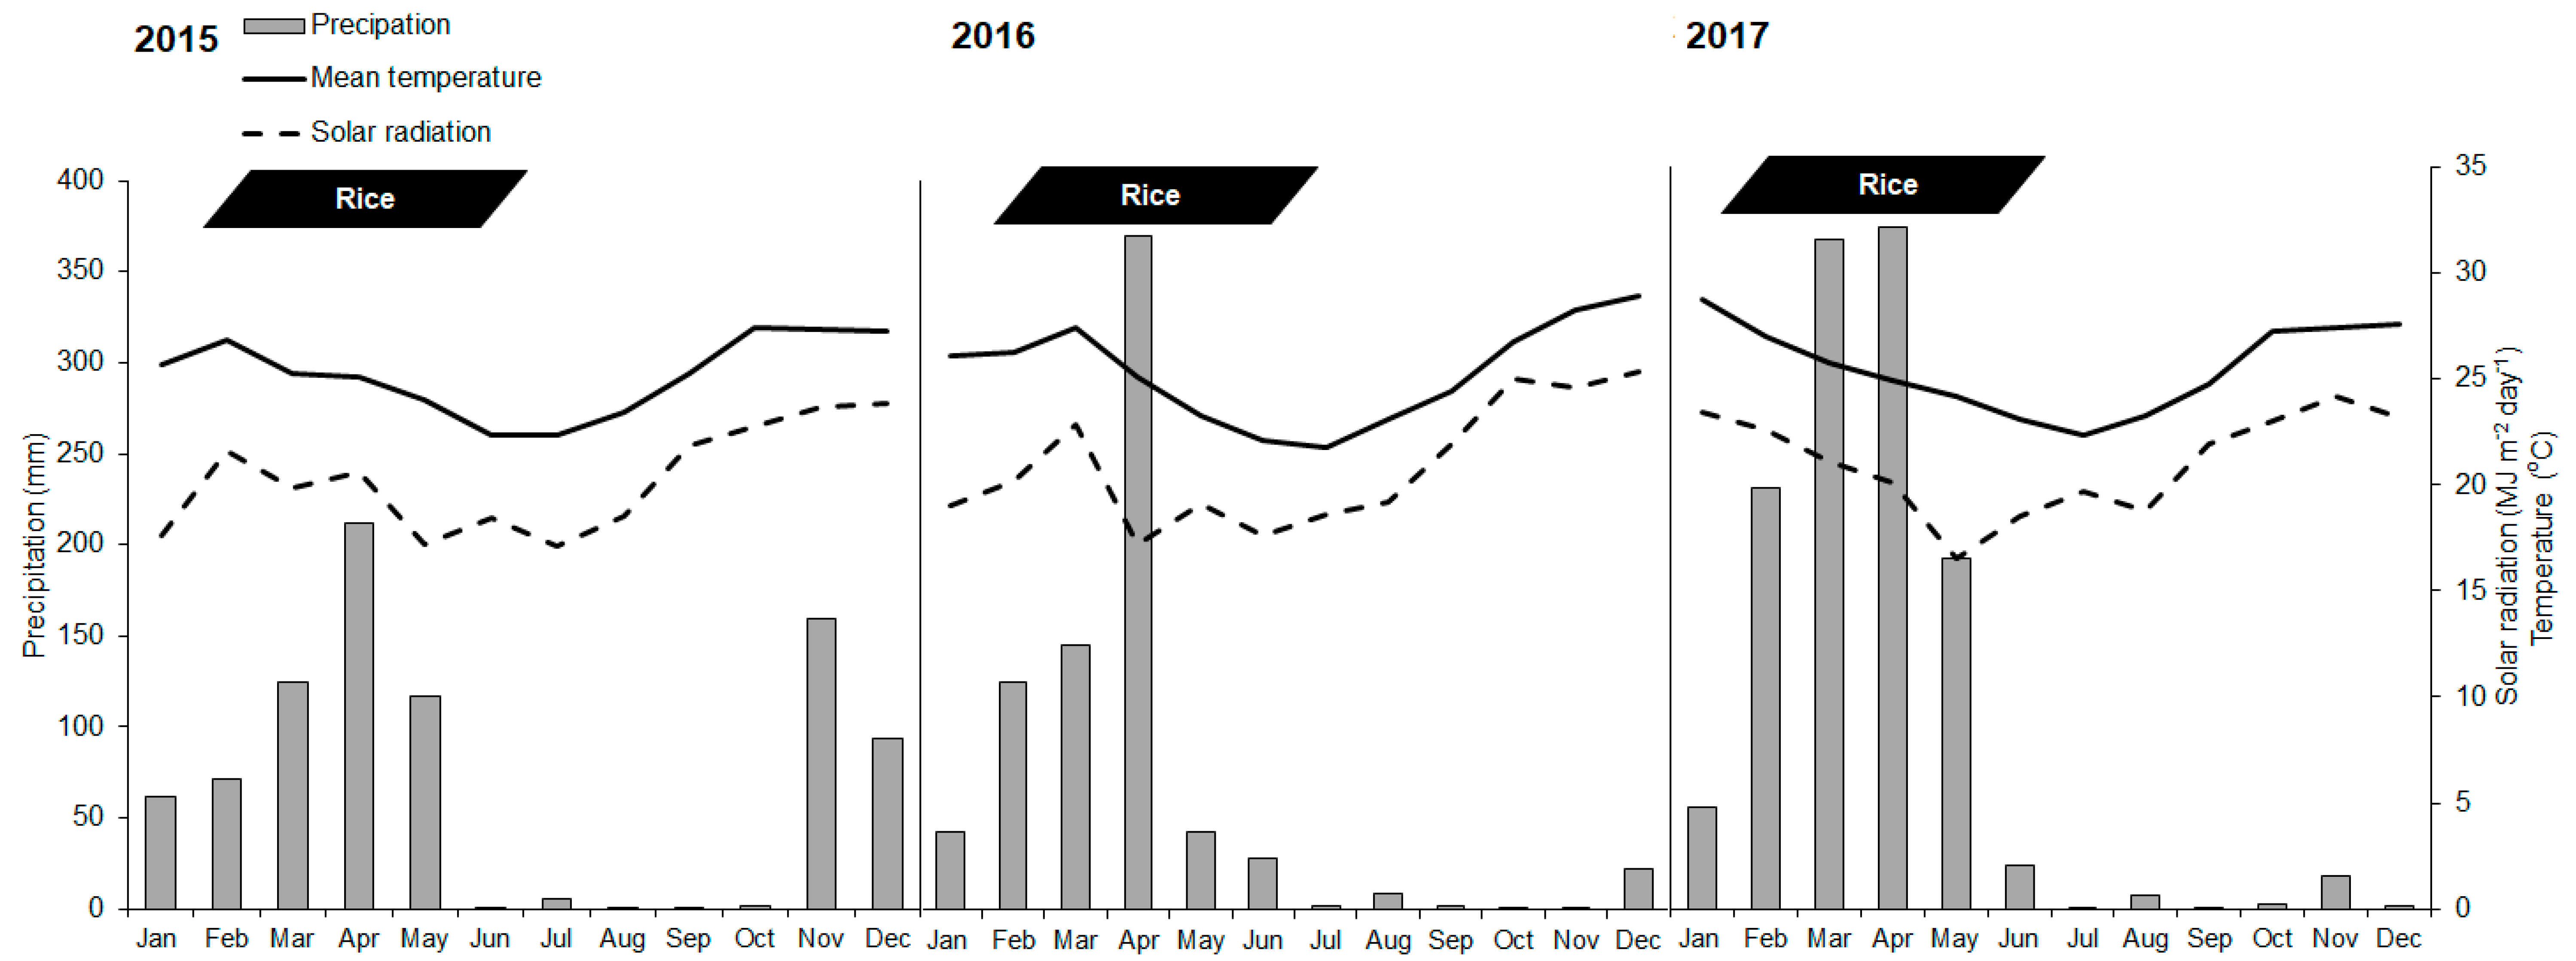
Experiments were carried out in the Kilombero floodplain, which is located between 7.65°–10.02° S latitude and 34.56°−37.79° E longitudes (Figure 1) on farmers’ fields. The Kilombero floodplain receives about 1200 to 1400 mm of annual rainfall in a bi-modal distribution pattern [19]. Some 80−90% of the annual rainfall occurs between December and April, while the period from June through September is relatively dry with typical monthly precipitation < 10 mm. Climate data were obtained from a weather station installed at the Ifakara Health Institute (IHI) research station, about 5 km West of Ifakara town (Figure 2).

2.2. Hydrological and Edaphic Characteristics

The areas representing the three hydrological positions had a slope of < 0.01% and were selected based on inundation depth and duration relative to the river during the rainy season [10]. The fields were located along a gradient between the areas adjacent to Kilombero River to the outer fringes of the floodplain (Figure 1). The distances between positions ranged from 2.2 km to 3.2 km, with the most low-lying position located at 1 km distance from the river (Table 1). The rarely submerged and occasionally drought-prone field plots referred to as being located in the “fringe” position are located close to the village of Katindiuka at 255 m above sea level (a.s.l) and at an elevation of 10 m above the mean water line of the river before the onset of the rainy season. The in-situ rainfall, as well as water contribution by subsurface interflow from adjacent upland slopes, influence the hydrological regime at plot level, with plot water levels ranging from 0.5 to 31 cm for about 17 days. The area close to the village of Kiyongwire is prone to extended periods of not less than 22 days of moderate soil submergence (3−74 cm above the soil surface). Located at an elevation of 249 m a.s.l. or 4 m above the mean water line. Soil water regimes in this “middle” position are influenced by in-situ rainfall as well as some spill-over from Kilombero River. The area close to the village of Kivukoni is located at an elevation of 247 m a.s.l. or 2 m above the water line and close to Kilombero River. Severe and extended soil submergence (>28 days with up to >100 cm above the soil surface) is contributed mainly by the spill-over of the river in this “center” position.
All soils were formed from fluvial sediments and are classified as Fluvisol according to the World Reference Base (FAO, 2014). Soil attributes differed between positions with coarse-textured soil and relatively low C and N contents characterizing the middle position, while fine-textured clay soils with higher C and N contents occurred in the center position (Table 1). Data are based on composite samples (five points sampled diagonally per plot and position) from the topsoil (0−20 cm depth) that were taken before the onset of the experiment in November 2014. Soil samples were air-dried and ground to be passed through a 2 mm sieve and analyzed for soil physical and chemical properties.

2.3. Treatment Application

The experiments were set up in field plot areas that had previously been cropped for >5 years with lowland rice and were located in the three hydrological positions. Before the establishment of the experiments, the fields were tilled using a tractor-driven disk plow and manually harrowed. Sixteen individual plots of 5 × 6 m, separated by bunds of 0.5 m width and 0.5 m height, were marked in each of the three hydrological positions. The experiment was conducted at the same sites and field plots in 2015, 2016 and 2017. The treatments were applied and arranged in a randomized complete block design (RCBD) including four treatments × four replications × three positions = 48 plots repeated over three years. Blocks were separated by a 1 m depth and 1 m wide trench. For the center position, only 32 plots could be considered due to complete crop failure resulting from prolonged submergence in 2015.
The four treatments included: (1) farmers’ practice, i.e., no field bunding or levelling, no fertilizer application and one single hand-weeding at 20 days after transplanting, representing the traditional management with no external input use, (2) bunding, i.e., field bunding, manual puddling (>20 cm), levelling and weeding at 20, 40 and 60 dat, (3) 60 kg Urea-N (Urea, 46% N), i.e., treatment 2 + 60 kg Urea-N ha−1 with 75% applied basally and 25% at the panicle initiation stage and (4) 120 kg Urea-N + 60 kg PK, i.e., treatment 2 + 120kg N ha−1 split-applied, 60 kg of P (Single Super Phosphate) and K (KCl) applied basally (Table 2). This treatment aimed at reaching the attainable yield level. To ensure ceteris paribus conditions, treatment (1) served as a control for treatment (2), which served as a control for treatments (3) and (4). All fertilizers were broadcast manually, and those applied basally were incorporated during puddling in the topsoil layer (0−20 cm). Choice of treatments was based on recommendations from AfricaRice [13].
Certified seeds of the locally-recommended high-yielding semi-dwarf 120-day lowland indica rice (Oryza sativa L.) variety SARO 5 (TXD 306) were obtained from the Kilombero Agricultural Training and Research Institute (KATRIN) now called Tanzania Agriculture Research Institute (TARI), Ifakara Center. Twenty-five-day-old seedlings were transplanted at 20 × 20 cm spacings into the water-saturated soil with two seedlings per hill, resulting in 25 hills m−2. Transplanting dates between positions varied by a maximum of three days, and between years by up to 3 weeks depending on the onset of the rains.

2.4. Measurements

Rice was harvested from 2 × 3 m areas in the center of each plot, and grain yield is reported adjusted to 14% grain moisture [20]. Total biomass, harvest index and yield parameters (tiller and panicle numbers per m2, grains per panicle and 1000-grain weight) were assessed based on 12 hills per plot at physiological maturity. Only grains with a specific gravity ≥1.06 g cm−3 were considered filled grains and expressed as a percentage share of all spikelets per panicle [21]. To determine biomass accumulation and crop N uptake, biomass samples were oven-dried at 60 °C to constant weight and ground in preparation for analysis by a C/N analyzer (EURO-EA, Eurovector, Pavia, Italy).
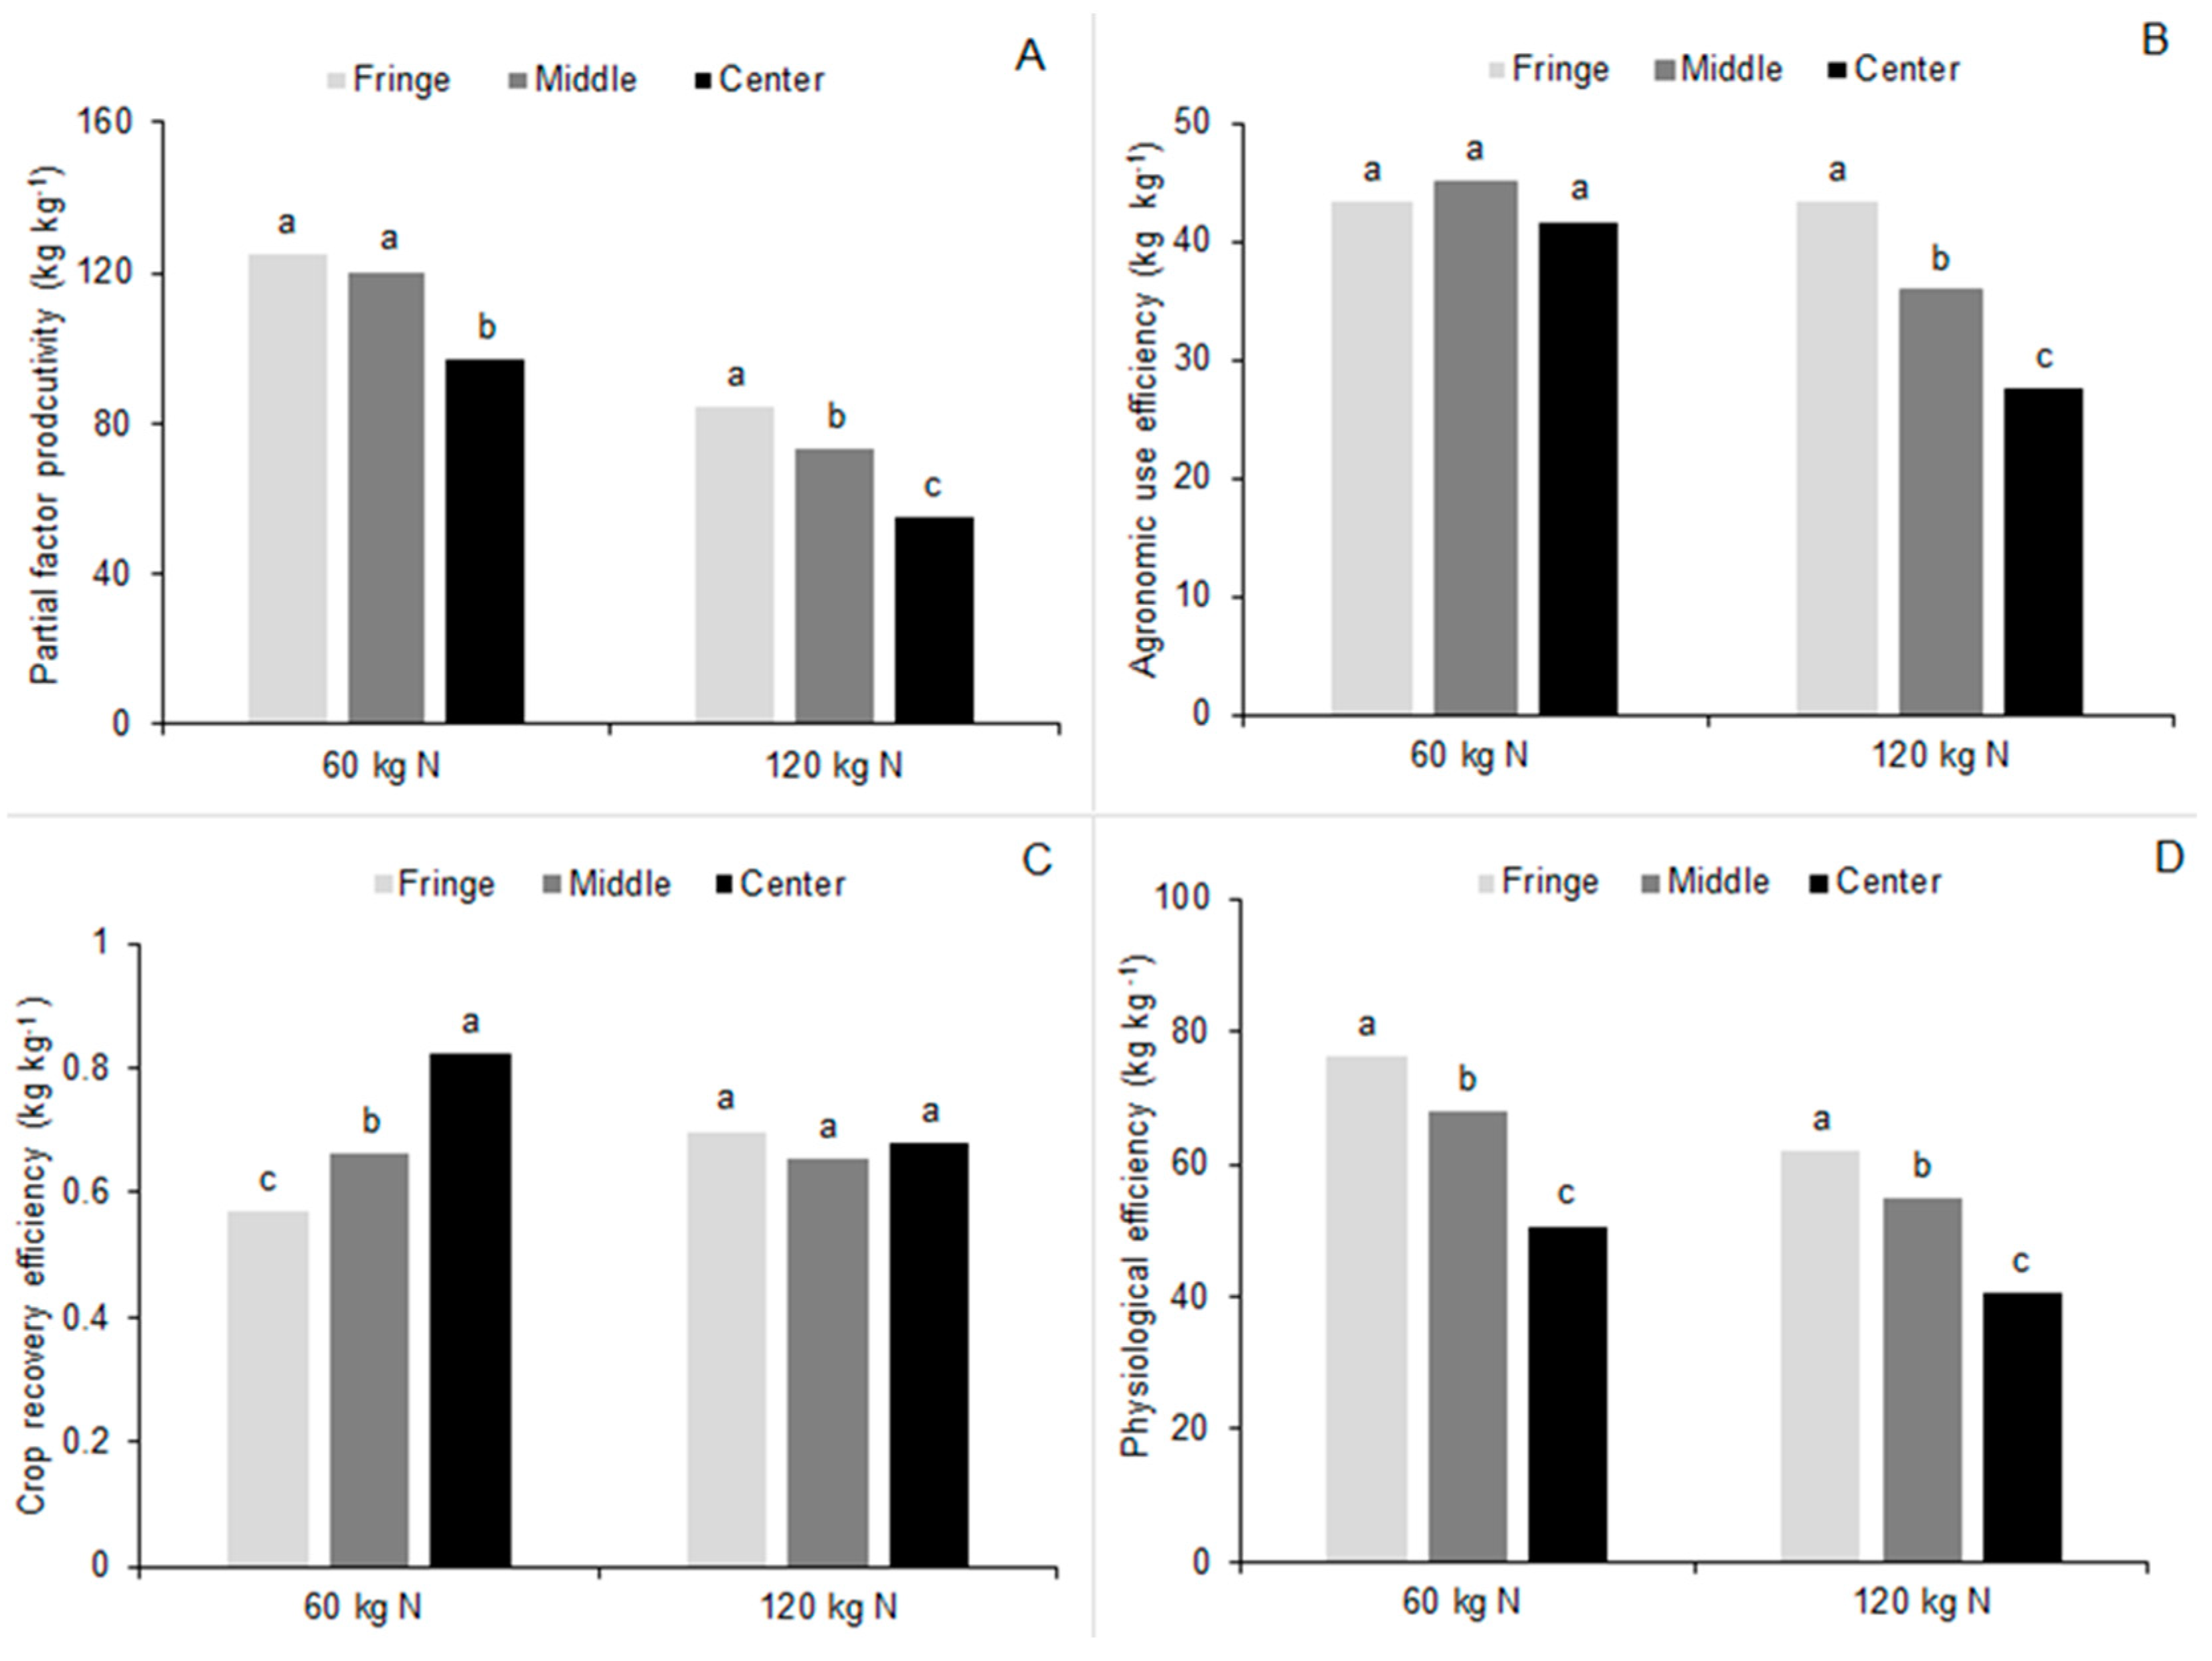
The nitrogen use efficiencies (NUE) were calculated in terms of (1) partial factor productivity (PEPN) (kg grain yield kg−1 N applied), (2) agronomic N use efficiency (AEN) (kg grain increase kg−1 N applied), (3) crop recovery efficiency (REN) (kg N increase kg−1 N applied) and (4) physiological efficiency (PEN) efficiency (kg grain increase kg−1 N uptake) as follows.
PEPN = (YN/FN),   AEN = (YN − Y0)/FN,   PEN = (YN − Y0)/(UN − U0),   REN = (UN − U0)/FN,
whereby YN is crop yield with applied mineral N (kg ha−1), FN refers to the amount of mineral fertilizer N (kg N), Y0 is the crop yield in the non-amended control treatment (kg ha−1), UN refers to the total plant N uptake in aboveground biomass with applied mineral N and U0 to the plant N uptake in the non-amended control treatment (kg ha−1) [22].

2.5. Statistical Analyses

Before being analyzed by ANOVA, data were tested for normality using the Shapiro-Wilk test and homogeneity of variance using the modified Levene’s test [23]. Descriptive statistics, including means and variances, were calculated for the main effects of management practices, over the years and for the three hydrological positions. A linear mixed model fit by Restricted Maximum Likelihood (ReML) and Satterthwaite’s method was used for the t-tests using R software 3.5.0 version. To select the most parsimonious model, we evaluated models by Akaike’s Information Criterion [24]. Where applicable, mean comparisons were performed using post-hoc tests (Tukey’s HSD, α = 0.05).
The yield variability for different combinations of hydrological position and treatment was measured using various approaches. First, we calculated the coefficient of variation (CV = σ µ−1 100%, where σ is the standard deviation and µ the mean). Each CV contained data points from all years and all replicates, thereby combining spatial and temporal variation into a joint variable called ‘environment’. This was done because farmers are restricted in the choice of the location where rice can be grown. Therefore, properties of the soil where rice is grown are partly a ‘given’ for farmers, similar to differences in climatic conditions between years. Replicates and positions are thus seen as representing the spatial component of the environment. Second, with the same data structure, a scale-adjusted coefficient of variation (aCV, also expressed as % of the mean) was calculated as a further measure of yield variability. The adjustment was made to account for potential scale effects that can result in underestimation of variability at high mean values; in particular, the aCV takes into account scaling effects that occur when the yield means are very different between cropping systems [25]. In such cases, i.e., when some cropping systems have overall low yields and others comparatively high yields, the large yield ranges between systems mean that the unadjusted CV is biased as it tends to be generally lower at high mean yields. This bias is rectified by the aCV.
A further complementary approach aimed at determining to which extent the factors “replicate” or “year” contributed to yield variability. Using the lme4 library in R, we employed a linear mixed model with year and replicate as random factors and hydrological position and treatment as a fixed factor to compare the relative contribution of replicate and year to the total variance.
Finally, the CV was calculated across all years for each replicate, to check whether yield variability was solely due to year effects. The average of CVs for the year, treatment and position combination were subsequently calculated across all replicates. The resulting values of C V ¯ were linearly correlated with the aCV via Pearson’s correlation coefficient.

3. Results

3.1. Environmental Characteristics

Analysis of initial soil samples revealed differences in the physico-chemical attributes between fringe, middle and center positions (Table 1). In general, lighter textured soils (sandy silt loam) and heavier textured soils (clay loam) characterized the middle and center positions, respectively. There were significant differences in soil pH (H2O) between the hydrological positions with the lowest (pH = 4.9) at the center and highest (pH = 6.0) in the fringe. Total C and N tended to be low but were higher in the center than in the fringe and middle positions. Available P content (Mehlich-3) was lower in center and middle than in fringe soils, but was always within the sufficiency range for lowland rice. Exchangeable soil K was high to very high, irrespective of the position (Table 1).
A bi-modal distribution pattern separated into the short rains (November−January) and the long rains (March-May) characterized the rainfall pattern at the study site (Figure 2). Cumulative rainfall during the crop growth periods of rice were 453, 582 and 941 mm for 2015, 2016 and 2017, respectively. However, the rainfall periods were longer in 2015 and 2017, while rains ceased early in 2016. Extended periods of dry spells and low precipitation during the vegetative growth phase of rice were observed in 2016 and 2017. Moreover, in 2016, the onset of the rains was delayed by several weeks, affecting rice crops particularly in the in-situ rainfall-fed fringe and middle positions.
The flooding depth and flood duration increased from the fringe to the center positions. In the center position, severe soil submergence of up to 90 cm was observed during the late vegetative and the early reproductive growth stages in 2015 and 2016, and throughout the rice-growing period in 2017. No differences were observed in terms of the temperature ranges with maxima of 34−36 °C and minima of 16−17 °C in the three years of experimentation.

3.2. Grain Yield and Its Variability

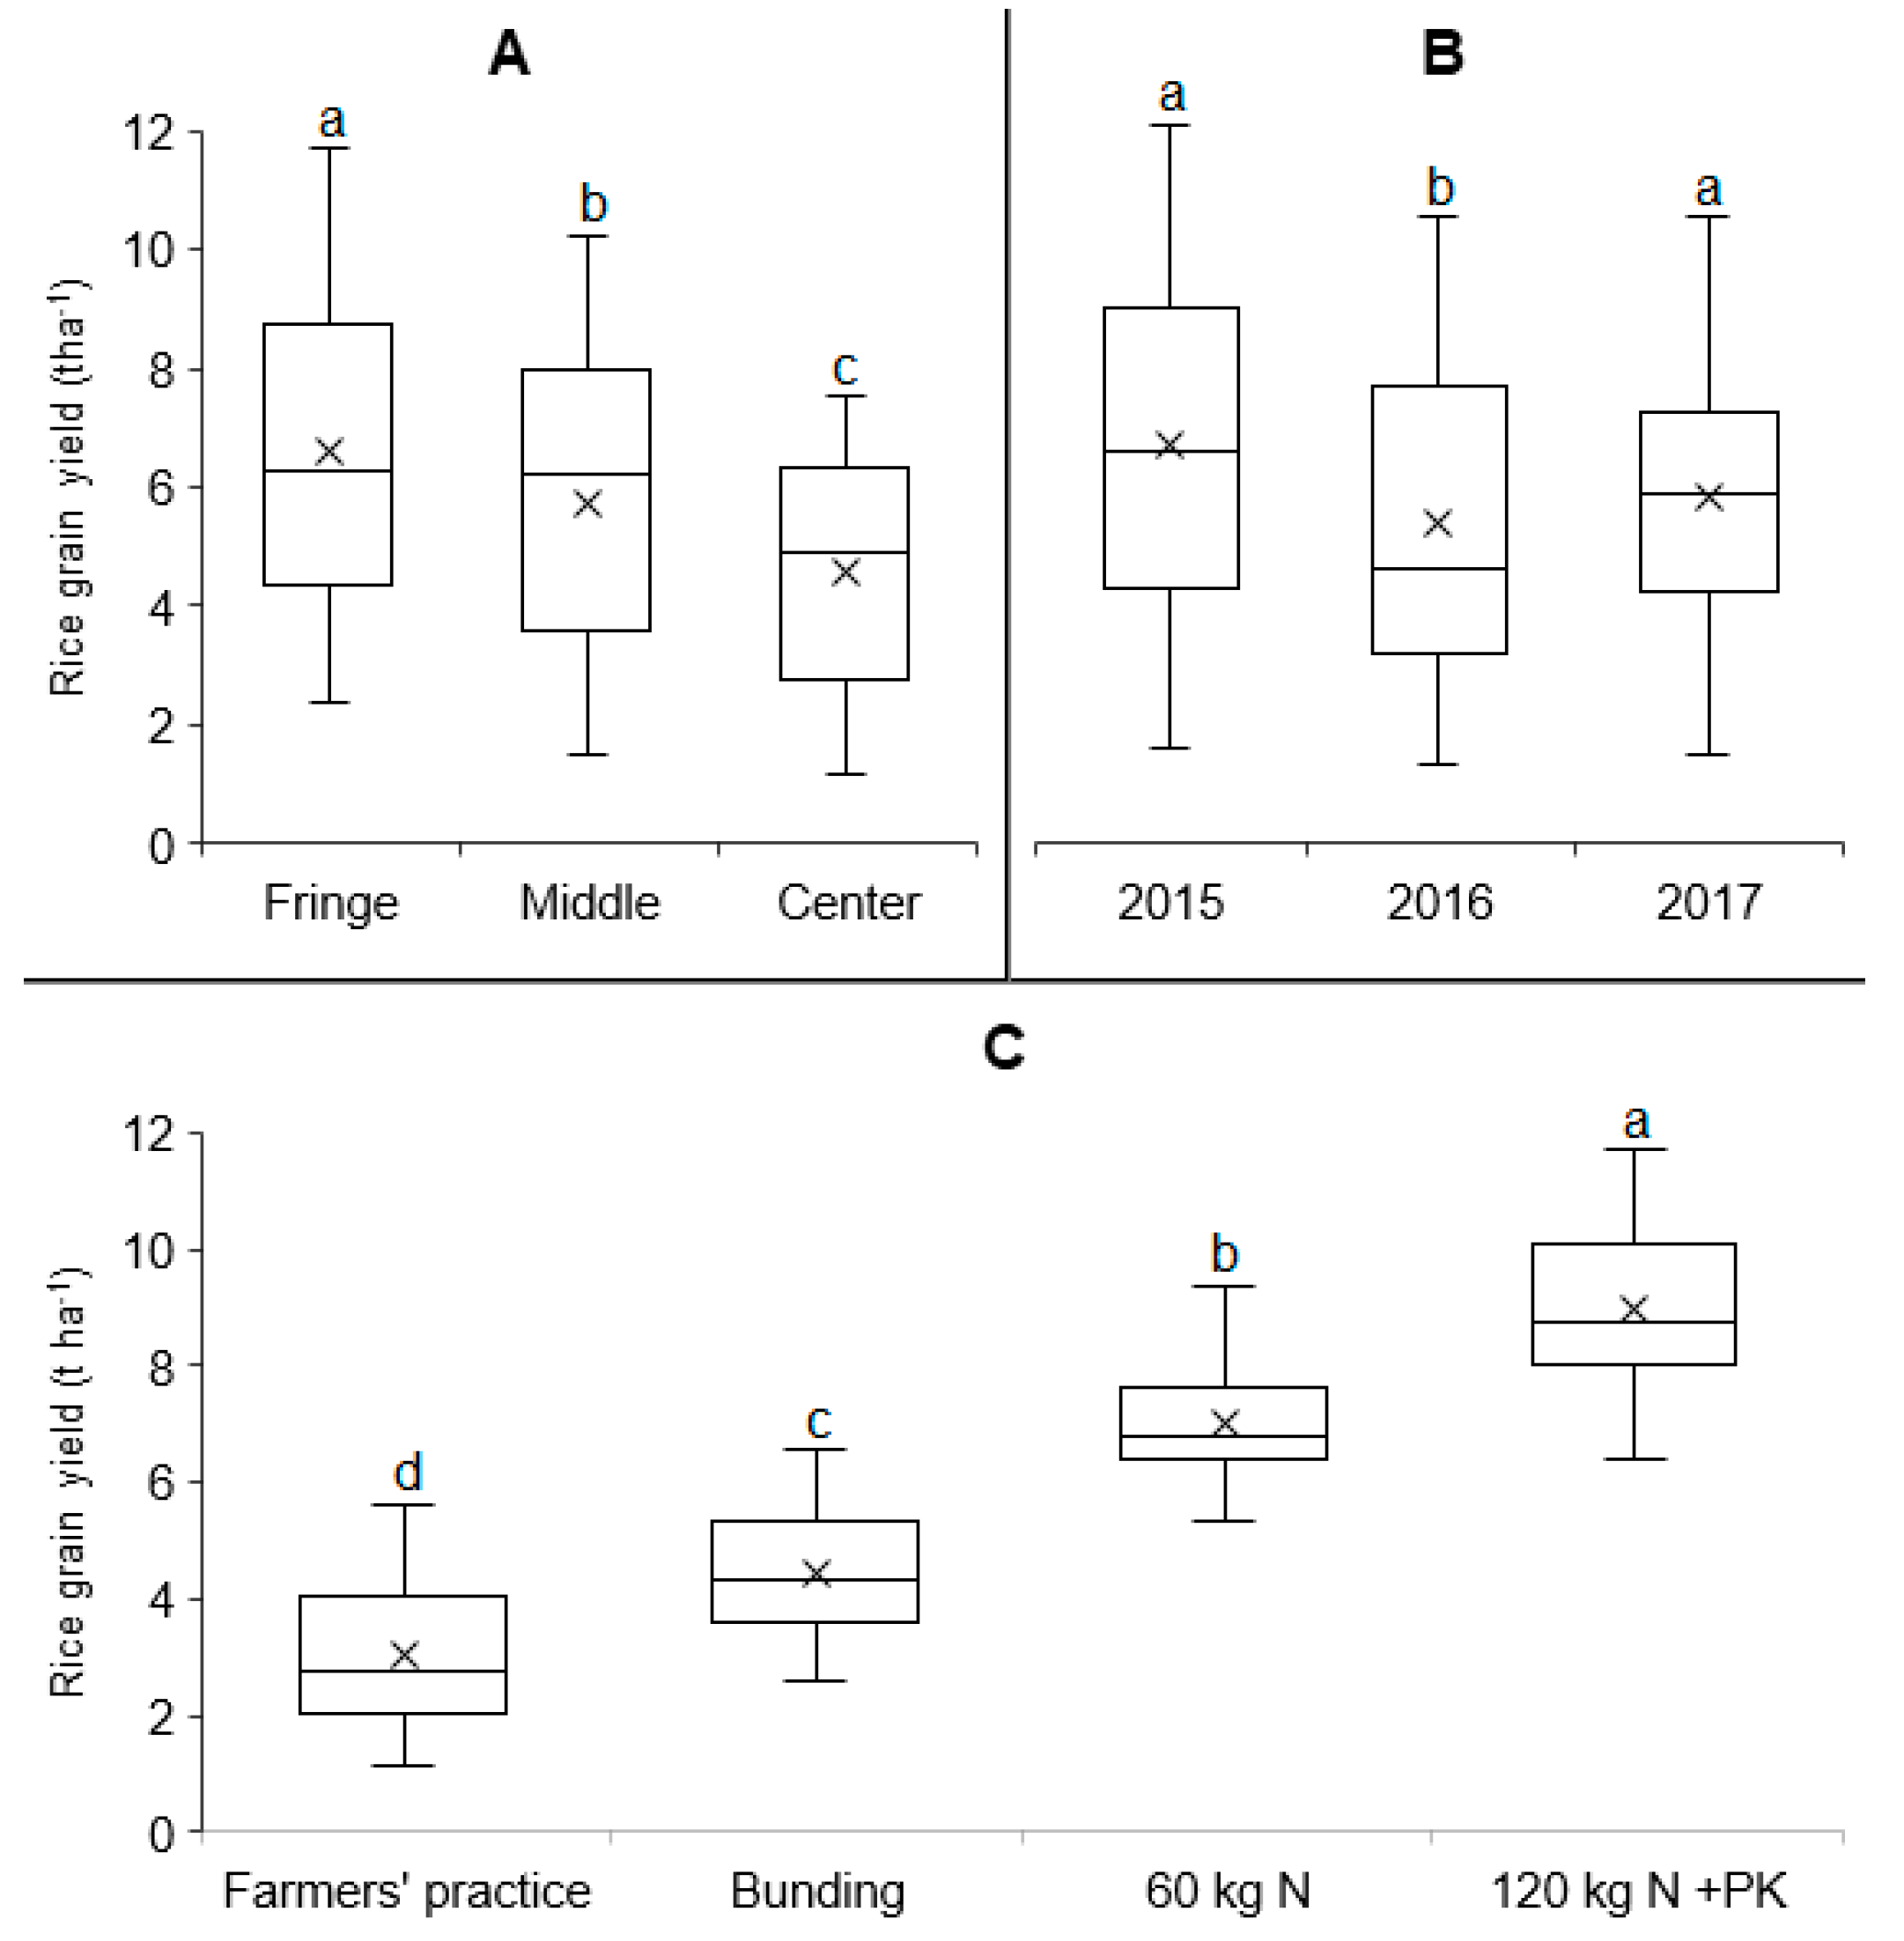
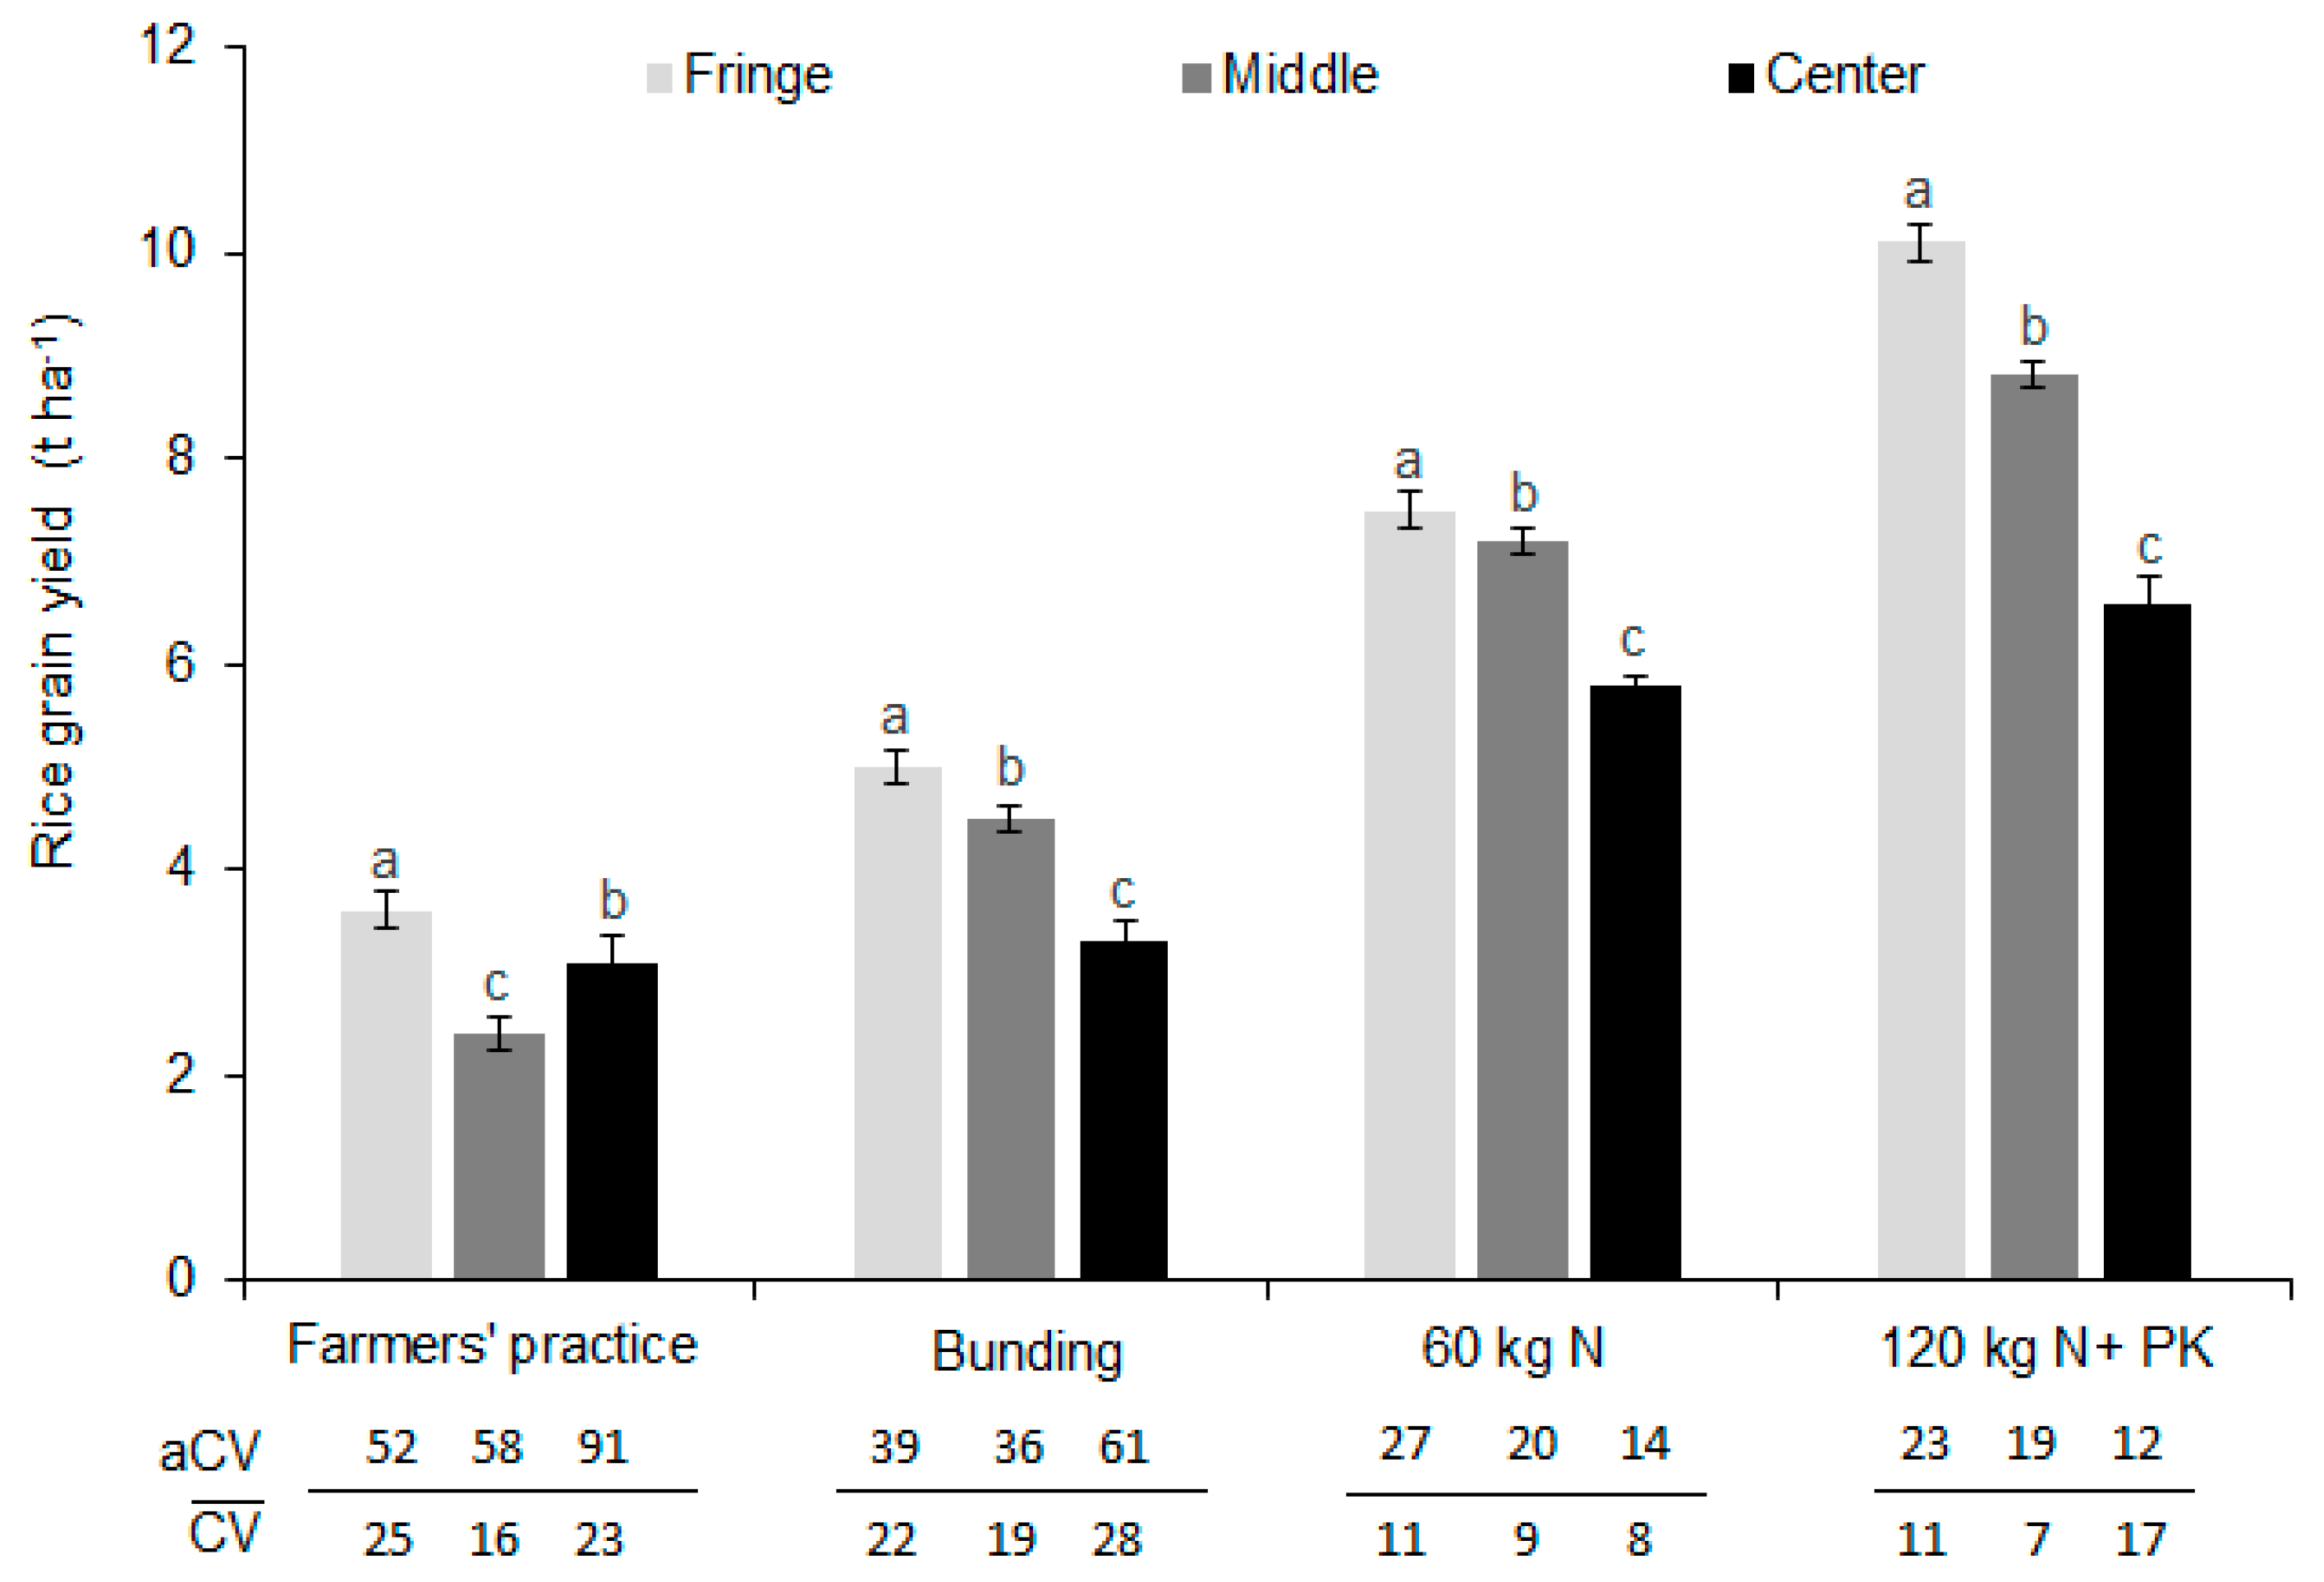
Overall, rice grain yield differed significantly across hydrological positions, years and management practices, ranging from 1.2 to 11.7 t ha−1 (Figure 3). The fringe position generally had the highest mean yield of 6.5 t ha−1 while lowest yields were recorded in the center position with 4.6 t ha−1 (Figure 3a). In 2015 we recorded the highest mean yield of 6.5 t ha−1, followed by 2017 with 5.9 t ha−1 and 2016 with 5.1 t ha−1 (Figure 3b). Regardless of year and position, farmers’ practice resulted in the lowest mean yield of 3.0 t ha−1 with a high yield variation (Figure 3c). Simple soil management by the construction of field bunds and land levelling increased the mean yield to 4.4 t ha−1. With intensive management (bunding, levelling and the application of 60 or 120 kg N+PK ha−1), grain yield varied from 7.0 t ha−1 to 8.8 t ha−1. Figure 3c shows the variability of rice grain yields by treatment, applying mean values across hydrological positions and years. The yield variability of concern to a farmer, however, is the one within a given position where his/her field plot is located. Thus, yield responses and variabilities are further differentiated by hydrological positions (Figure 4).
Significant interactions of rice grain yields (Table 3) between hydrological positions and treatments can further substantiate the repeated trends. All treatments, apart from farmers practice, recorded a general increase in rice grain yield from the center to the fringe position. The lowest yields were observed in the middle position with farmers’ practices.
According to the mixed model, replicates and years contributed 4.9% and 18.7% to the total variance, respectively. Values of the aCV–, which measured variability across years and replicates and within a hydrological position, were generally higher (median 38%) and showed a larger range (14−91%) than the C V ¯ (median 16, range 7−28%), which accounts for variability across years only. However, the positive linear correlation between aCV and C V ¯ across positions and treatments with an r2 of 0.78, suggests little effect of the method of calculation on the order of the observed yield variability. In the absence of N application, yield variability was highest in the center with aCV of 91%   ( C V ¯ = 23%), under farmers’ practice followed by 61% with bunding and levelling only ( C V ¯ = 28%). The application of fertilizers increased yields and reduced yield variability (aCV) to 27%, 20% and 14% for fringe, middle and center positions, respectively (11%, 9% and 8% for C V ¯ ). The year × position interaction was significant for all yield components, while the position × management practices interactions were only significant for grain yield. Mostly, mean grain yields were highest in the fringe and lowest in center positions.

3.3. Management effects

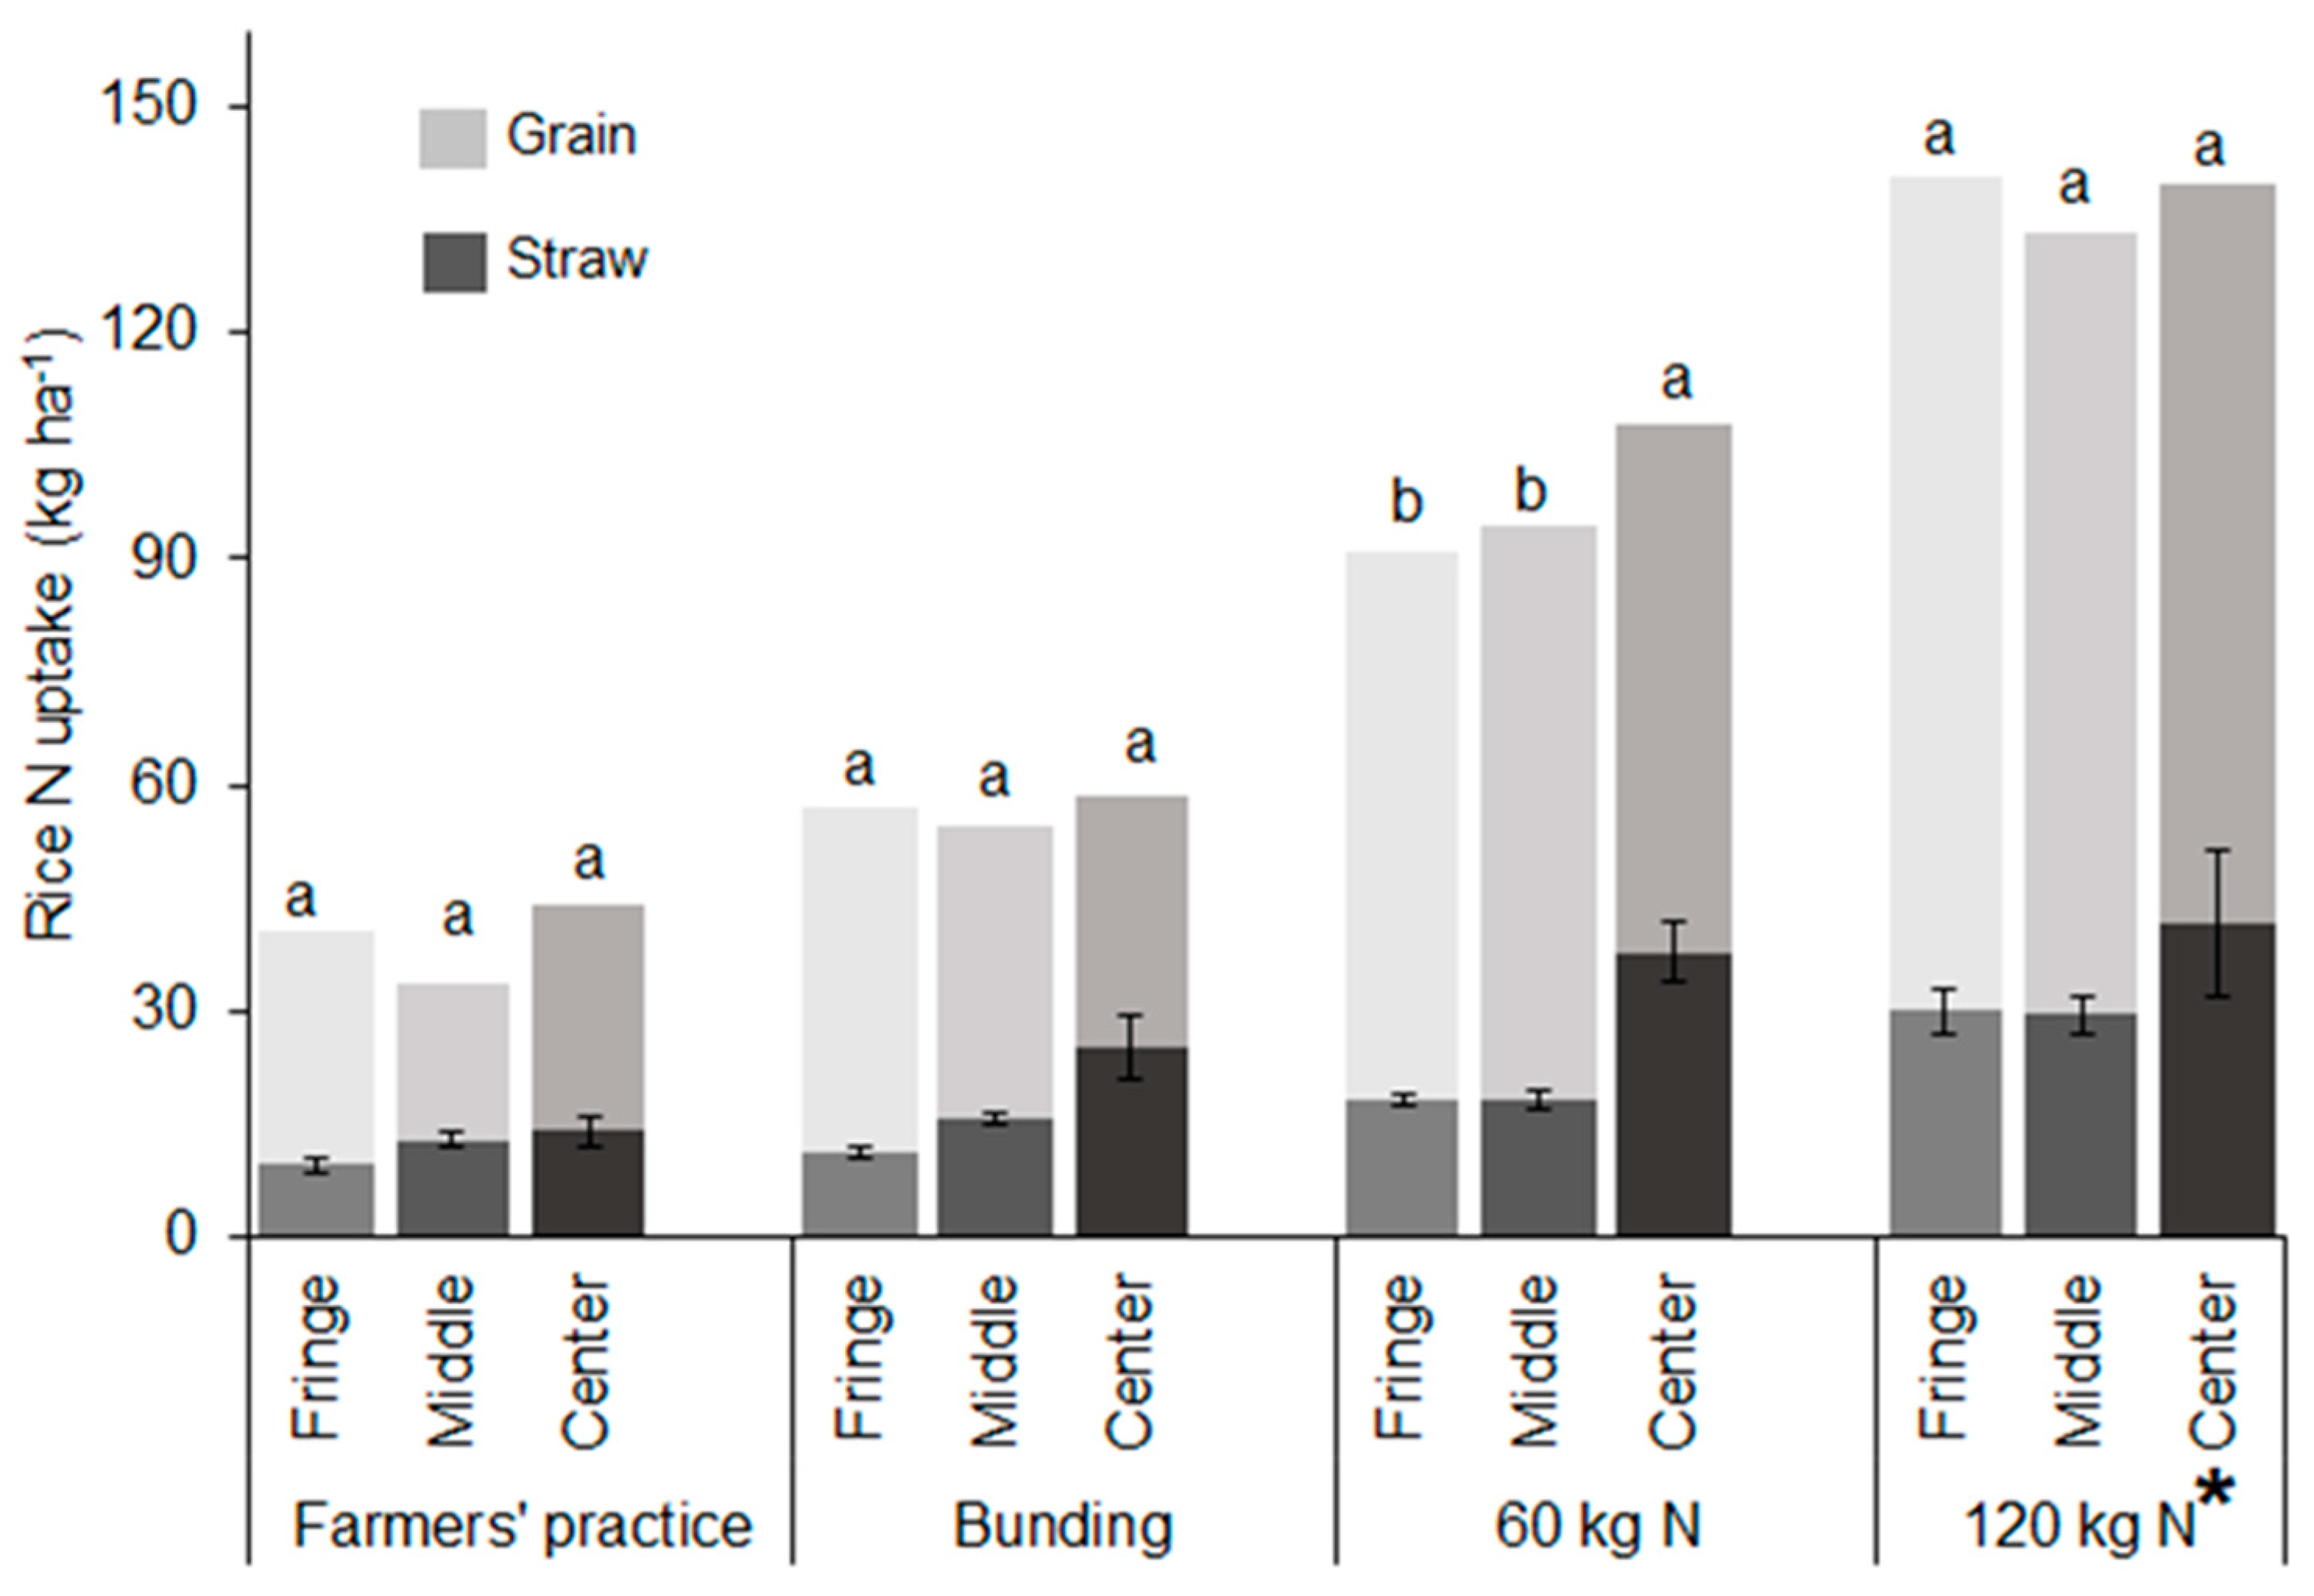
Irrespective of the year or the hydrological position, the combination of mineral fertilizer (60 kg N) and bunding increased rice grain yield by 125% above farmers’ practice and 60% over sole field bunding. Total N uptake (straw plus grain) at harvest ranged from 40 to 140 kg ha−1 (Figure 5). Field bunding increased the total N uptake of rice by >15 kg ha−1 over farmers’ practice. Mineral N addition further stimulated total N uptake by 98 kg N ha−1 and 135 kg N ha−1 with the application of 60 kg and 120 kg mineral N+ 60 PK ha−1, respectively. The hydrological positions resulted in significant differences in the partitioning of the total N uptake. The fringe position had the highest grain N uptake while the center exhibited the highest straw N uptake with recovery efficiencies ranging from 55 to 82% of the applied mineral N (Figure 6). In the center position, the recovery efficiency of applied N was highest with 60 kg N ha−1. Increasing the mineral N application from 60 to 120 kg N reduced the partial factor productivity by 33, 39 and 43% in the fringe, middle and center positions, respectively.
The effect of position on the agronomic use efficiency of applied mineral N was significant only at an application rate of 120 kg N and ranged between 28 and 39 kg grain kg−1 N applied at the center and fringe positions, respectively (Figure 6). The effect of position on crop recovery efficiency was significant at 60 kg N with 80% at the center and 57% at the fringe positions. On the other hand, the highest and lowest physiological efficiencies were observed in the fringe and center positions, respectively. Independent of management practice and years, the crop N uptake and utilization was generally higher in the fringe than in the center positions. While the center position showed a relatively high recovery efficiency of 70−80% of the applied N, its poor translocation into the grain leads to a low physiological N use efficiency of 40−44 kg kg−1 N absorbed.

4. Discussion

4.1. Environmental Characteristics

Our field trials highlight large differences in the response of the grain yield and yield variability of lowland rice to management practices ate different hydro-edaphic conditions. The soil’s chemical and physical attributes and hydrological properties partially explain the observed differences between positions. The C and N content was generally low, specifically in the fringe and middle positions, as reportedly being typical for the Kilombero floodplain [11,13]. The observed high temperature and low humidity shortly after the rains entail a high vapor pressure deficit, leading to soil drying [26]. The resulting variations in soil aeration status stimulate the activity of decomposing soil microorganisms leading to subsequent losses of soil organic matter [27]. Similarly, the cyclic occurrence of short submergence periods in the fringe and middle positions [10] may explain the low observed C and N contents [28]. In the center position, extended anaerobic periods resulting from prolonged soil submergence explain the relatively higher C and N content [29]. Thus, different frequencies and durations of drying and wetting periods may have differentially affected position-specific soil C and N mineralisation [30]. In addition, C and N losses may have further been exacerbated by the traditional use of fire in land clearing [14].
The P and K contents were always above the critical values of 8 mg P kg−1 and 60 mg K kg−1, according to Mehlich-3 soil extraction [31], and tended to be much higher than those reported from floodplains in West Africa [32]. In the absence of P application in Kilombero, this high P content is probably related to the deposited alluvial materials in the center [33] as well as lateral flow contributions from adjacent mountain slopes to the fringe [9].
The seasonal in-situ burning of rice straw can recycle most of the plant-absorbed K and together with the annual deposition of K-rich sediments by Kilombero River [34], probably explain the high soil K contents at all positions. The low C and N contents combined with the high to very high P and K contents may well entail the high-observed crops responsiveness to added N and the high rice grain yields.

4.2. Grain yield and Yield Variation

The findings of our study revealed large rice grain yield differences ranging from <1 up to >10 t ha−1 in the researcher-managed trials in Kilombero floodplain. These yields were generally higher than those reported from farmer-managed on-farm trials with a maximum yield of 7.2 t ha−1 [13]. The higher yield in the researcher-managed compared to farmer-managed trials has been attributed in other studies to better crop management including weed control, timely planting and the split application of mineral N fertilizers [35]. The yields obtained with the application of 120 kg N (plus supplementary P and K), were assumed to represent the attainable yield level. Grain yields were in fact within the range of both the potential yield based on agro-climate zonation ) and the water-limited yield potentials reported in the Global Yield Gap Atlas (GYGA) project (www.yieldgap.org) for southern Tanzania [36].
The observed large yield range and variability represents not only the high production risks and uncertainties in the outcome of farmers’ investments in improved management practices but also indicates an enormous potential for smallholder farmers to achieve substantial yield gains by adopting site-specifically adapted agronomic management practices [37]. In our study, year-to-year yield variability was reduced by fertilizer application as also reported from previous research on long-term fertilizer trials in Asia [38]. The high mean yields in 2015 and 2017 were associated with near-permanent moderate soil flooding (5−20 cm). Although total rainfall during the 2015 season was lower compared to 2016 and 2017 (Figure 2), water supply in the critical stage of panicle initiation in May was relatively high (116 mm). Conversely, the observed low yields in 2016 (El Niño year) were associated with an uneven distribution of rainfall with only 43 mm in May, resulting in temporary soil drying below field capacity.
The high observed rice grain yields at the fringe position were probably related to a combination of high P availability, favorable soil texture, a relatively high soil N supplying capacity, and the permanent and constant availability of water, also from the shallow groundwater table throughout the crop growth period [10]. Low yields at the center position were linked to severe soil and crop submergence during the early reproductive and the grain filling stages of rice. Crop submergence affected specifically the percentage of filled grains, increasing the share of unfilled grains and concomitantly reducing the harvest index (Table 3).
The effect of soil and N management on rice grain yield and yield stability strongly differed between hydrological positions. Thus, lowest rice grain yields were observed under farmers’ practice (non-bunded and non-leveled fields) in 2016, when alternating conditions of temporary soil drying and severe soil submergence occurred. The simple building of field bunds and soil levelling increased water retention and harmonized the floodwater level within plots [14]. These effects were most pronounced in the fringe and middle positions implying that improved soil management, even without mineral N application, can substantially increase rice grain yield. However, this was not the case at the center. While slightly reducing the yield variability, the water level during submergence largely exceeded the height of the field bunds and hence bunding did not enhance mean yields. Additionally, the application of mineral N fertilizers showed little yield effect in the center position. In contrast, our field trials also suggest that soil fertility and yield can be increased by green and farmyard manure application. In summary, the response to soil and fertilizer management increased from a little-responsive center towards highly-responsive fringe positions, to where the implementation and future extension of such management practices should be targeted.

4.3. Nitrogen Use Efficiency

Differential yield response to applied mineral N entailed significant differences to its use efficiency in different hydrological positions. Combined with field bunding and levelling, the use efficiency of mineral N increased as reported from several studies in Asia [22]. Particularly water management (water retention and supplementary irrigation) and the maintenance of favorable hydrological conditions (permanent shallow soil flooding) is reportedly critical for effective use of applied N by rice [39]. However, only in bunded fields of the fringe rice could benefit from N application rates beyond 60 kg ha−1 in the present study. The high partial factor productivity of up to 125 kg grain kg−1 N is comparable to that reported elsewhere [40]. Thus, favorable environmental conditions and improved soil management increased the partial factor productivity of N in our study. High recovery and physiological efficiencies on the one and low agronomic N use efficiency at the center position, on the other hand, imply that less of the absorbed N was translocated into the reproductive organs and was instead retained in the straw.
The agronomic N use efficiencies of 28 up to 41 kg grain yield increase per kg of applied mineral N were considerably higher than efficiencies reported from different irrigated and rainfed sites in Asia [41] and West Africa [35]. Our findings are, however, in agreement with a recent report from China [42]. Achieving high AEN has been associated with conditions of (1) low inherent soil N supplying capacity [43], (2) minimal losses of applied mineral N [44,45] and (3) efficient N partitioning into grains [46]. In our study, the low inherent soil N content in the fringe and middle positions have been attributed to frequent cycles of alternate soil drying and wetting under hot climatic conditions as well as possible soil C losses related to the practice of burning for land clearing. The observed high response to added mineral N may additionally have been the result of the so-called priming effect [47], whereby the addition of mineral N was able to overcome the N barrier for soil N mineralization by microbial communities in the floodplain soils with their wide CN-ratios of 16−18.
A minimization of N losses in the researcher-managed trials was possibly achieved by multiple splitting and the timely application of urea, thus achieving a high degree of synchrony between N supply and N demand [43,48]. Finally, highly N efficient genotypes such as SARO 5 [15,49] can reportedly efficiently partition the acquired N into the grain, particularly under conditions of high solar radiation [50], thus also improving the physiological efficiency PEN [51]. The factors mentioned above were thus likely responsible for the high observed N use efficiencies.
Our results show that improved land and fertilizer management options are most beneficial in the fringe positions where they contribute to enhance N use efficiencies, increase grain yield and reduce production risks as highlighted by the low yield variability between plots and years. Tall traditional cultivars are popularly grown in submergence-prone valley bottoms [52], and modern genotypes containing the SUB1 gene [53] can withstand submergence conditions for up to 12 days [54]. However, the severe and prolonged submergence conditions with >3 m for >26 days in the floodplain center [10] are likely to exceed by far the adaptive capacity of the rice genotypes mentioned above. As a consequence, and due to comparatively low yields, high production risks and reduced responsiveness to improved management interventions, submergence-prone floodplain centers appear largely unsuited for boosting future rice production.

5. Conclusions

For the hydrologically highly variable floodplain environment as represented by the Kilombero floodplain in Ifakara, we can conclude that rice intensification strategies need to be hydrological position-specific. Thus, considerable benefits derived from improved management can be expected from floodplain fringe and middle positions where the suggested land and fertilizer options are associated with production and productivity gains as well as reduced production risks. On the other hand, due to their poor input responsiveness to improved management, submergence-prone floodplain centers, e.g., in the Kilombero floodplain, could be taken out of production and may be considered for future use as protection zones for biodiversity conservation and the provision of a wide range of water-related ecosystem services.

Author Contributions

Conceptualization, D.N., S.K., and M.B.; methodology, J.K., D.N., K.S. and M.B.; validation, D.N. and M.B.; formal analysis, J.K., T.F.D.; investigation, J.K., S.K. and D.N.; resources, S.K., D.N, and M.B.; data curation, J.K. and K.G.; writing—original draft preparation, J.K.; writing—review and editing J.K., K.G., D.N., S.K., T.F.D. and M.B.; visualization, D.N., T.F.D. and M.B.; supervision, D.N., S.K. and M.B.; project administration, D.N. and M.B.; funding acquisition, M.B.

Funding

This research was funded by the German Federal Ministry for Education and Research (BMBF) grant number FKZ 031A250 A-H, with additional funding provided by the German Federal Ministry of Economic Cooperation and Development.

Acknowledgments

The authors are grateful to Björn Glasner for his assistance with soil analysis and to Stefanie Steinbach for providing the overview map, and to the field assistants for field work and data collection.

Conflicts of Interest

The authors declare no conflict of interest.

References

  1. FAOSTAT. Food and Agriculture Organization of the United Nations (FAO). FAOSTAT Database; FAO: Rome, Italy, 2018. [Google Scholar]
  2. Saito, K.; Dieng, I.; Toure, A.A.; Somado, E.A.; Wopereis, M.C.S. Rice yield growth analysis for 24 African countries over 1960–2012. Glob. Food Sec. 2015, 5, 62–69. [Google Scholar] [CrossRef]
  3. UN. World Urbanization Prospects, the 2014 Revision. Highlights; United Nations: New York, NY, USA, 2014. [Google Scholar]
  4. Lazaro, E.; Sam, A.G.; Thompson, S.R. Rice demand in Tanzania: An empirical analysis. Agric. Econ. 2016, 48, 187–196. [Google Scholar] [CrossRef]
  5. Touré, A.; Becker, M.; Johnson, D.E.; Koné, B.; Kossou, D.K.; Kiepe, P. Response of lowland rice to agronomic management under different hydrological regimes in an inland valley of Ivory Coast. Field Crops Res. 2009, 114, 304–310. [Google Scholar] [CrossRef]
  6. FAO. The Rice Value Chain in Tanzania: A Report from the Southern Highlands Food Systems Programme; FAO: Rome, Italy, 2015. [Google Scholar]
  7. Van Oort, P.A.J.; Saito, K.; Tanaka, A.; Amovin-Assagba, E.; van Bussel, L.G.J.; van Wart, J.; de Groot, H.; van Ittersum, M.K.; Cassman, K.G.; Wopereis, M.C.S. Assessment of rice self-sufficiency in 2025 in eight African countries. Glob. Food Sec. 2015, 5, 39–49. [Google Scholar] [CrossRef] [Green Version]
  8. Seck, P.A.; Tollens, E.; Wopereis, M.C.S.; Diagne, A.; Bamba, I. Rising trends and variability of rice prices: Threats and opportunities for sub-Saharan Africa. Food Policy 2010, 35, 403–411. [Google Scholar] [CrossRef]
  9. Näschen, K.; Diekkrüger, B.; Leemhuis, C.; Steinbach, S.; Seregina, L.; Thonfeld, F.; van der Linden, R. Hydrological modeling in data-scarce catchments: The Kilombero floodplain in Tanzania. Water 2018, 10, 599. [Google Scholar] [CrossRef]
  10. Gabiri, G.; Burghof, S.; Diekkrüger, B.; Leemhuis, C.; Steinbach, S.; Näschen, K. Modeling spatial soil water dynamics in a tropical floodplain, East Africa. Water 2018, 10, 191. [Google Scholar] [CrossRef]
  11. Daniel, S.; Gabiri, G.; Kirimi, F.; Glasner, B.; Näschen, K.; Leemhuis, C.; Steinbach, S.; Mtei, K. Spatial distribution of soil hydrological properties in the Kilombero floodplain, Tanzania. Hydrology 2017, 4, 57. [Google Scholar] [CrossRef]
  12. Mombo, F.; Speelman, S.; Hella, J.; van Huylenbroeck, G. How characteristics of wetlands resource users and associated institutions influence the sustainable management of wetlands in Tanzania. Land Use Policy 2013, 35, 8–15. [Google Scholar] [CrossRef]
  13. Senthilkumar, K.; Tesha, B.J.; Mghase, J.; Rodenburg, J. Increasing paddy yields and improving farm management: Results from participatory experiments with good agricultural practices (GAP) in Tanzania. Paddy Water Environ. 2018, 16, 749–766. [Google Scholar] [CrossRef]
  14. Becker, M.; Johnson, D.E. Improved water control and crop management effects on lowland rice productivity in West Africa. Nutr. Cycl. Agroecosyst. 2001, 59, 119–127. [Google Scholar] [CrossRef]
  15. Fageria, N.K.; dos Santos, A.B.; de Oliveira, J.P. Nitrogen use efficiency in lowland rice genotypes under field conditions. Commun. Soil Sci. Plant. Anal. 2013, 44, 2497–2506. [Google Scholar] [CrossRef]
  16. Asante, M.; Becker, M.; Angulo, C.; Fosu, M.; Dogbe, W. Seasonal nitrogen dynamics in lowland rice cropping systems in inland valleys of northern Ghana. J. Plant. Nutr. Soil Sci. 2017, 180, 87–95. [Google Scholar] [CrossRef]
  17. Fageria, N.K.; Moreira, A.; Moraes, L.A.C.; Moraes, M.F. Nitrogen uptake and use efficiency in upland rice under two nitrogen sources. Commun. Soil Sci. Plant. Anal. 2014, 45, 461–469. [Google Scholar] [CrossRef]
  18. Tsujimoto, Y.; Inusah, B.; Katsura, K.; Fuseini, A.; Dogbe, W.; Zakaria, A.I.; Fujihara, Y.; Oda, M.; Sakagami, J.-I. The effect of sulfur fertilization on rice yields and nitrogen use efficiency in a floodplain ecosystem of northern Ghana. Field Crops Res. 2017, 211, 155–164. [Google Scholar] [CrossRef]
  19. Koutsouris, A.J.; Chen, D.; Lyon, S.W. Comparing global precipitation data sets in eastern Africa: A case study of Kilombero Valley, Tanzania. Int. J. Climatol. 2016, 36, 2000–2014. [Google Scholar] [CrossRef]
  20. IRRI. Standard Evaluation System (SES) for Rice, 5th ed.; IRRI: Manilla, Philippines, 2013; p. 12. [Google Scholar]
  21. Zakaria, S.; Matsuda, T.; Tajima, S.; Nitta, Y. Effect of high temperature at ripening stage on the reserve accumulation in seed in some rice cultivars. Plant. Prod. Sci. 2002, 5, 160–168. [Google Scholar] [CrossRef]
  22. Dobermann, A.; Witt, C.; Dawe, D.; Abdulrachman, S.; Gines, H.C.; Nagarajan, R.; Satawathananont, S.; Son, T.T.; Tan, P.S.; Wang, G.H.; et al. Corrigendum to “Site-specific nutrient management for intensive rice cropping system in Asia”. Field Crops Res. 2008, 108, 115. [Google Scholar] [CrossRef]
  23. Brown, M.B.; Forsythe, A.B. Robust tests for the equality of variances. J. Am. Stat. Assoc. 1974, 69, 364–367. [Google Scholar] [CrossRef]
  24. Burnham, K.P.; Anderson, D.R. Model. Selection and Multimodel Inference. A Practical Information-Theoretic Approach, 2nd ed.; Springer: New York, NY, USA, 2002; ISBN 0387953647. [Google Scholar]
  25. Döring, T.F.; Reckling, M. Detecting global trends of cereal yield stability by adjusting the coefficient of variation. Eur. J. Agron. 2018, 99, 30–36. [Google Scholar] [CrossRef]
  26. Borken, W.; Matzner, E. Reappraisal of drying and wetting effects on C and N mineralization and fluxes in soils. Glob. Chang. Biol. 2009, 15, 808–824. [Google Scholar] [CrossRef]
  27. Bullock, P. Climate change impacts. In Encyclopedia of Soils in the Environment; Hillel, D., Hatfield, J.L., Eds.; Academic: Amsterdam, The Netherlands; London, UK, 2005; pp. 254–262. ISBN 9780123485304. [Google Scholar]
  28. Emmett, B.A.; Beier, C.; Estiarte, M.; Tietema, A.; Kristensen, H.L.; Williams, D.; Penuelas, J.; Schmidt, I.; Sowerby, A. The response of soil processes to climate change: Results from manipulation studies of shrublands across an environmental gradient. Ecosystems 2004, 7, 625–637. [Google Scholar] [CrossRef]
  29. Omengo, F.O.; Geeraert, N.; Bouillon, S.; Govers, G. Deposition and fate of organic carbon in floodplains along a tropical semiarid lowland river (Tana River, Kenya). J. Geophys. Res. Biogeosci. 2016, 121, 1131–1143. [Google Scholar] [CrossRef] [Green Version]
  30. Jarvis, P.; Rey, A.; Petsikos, C.; Wingate, L.; Rayment, M.; Pereira, J.; Banza, J.; David, J.; Miglietta, F.; Borghetti, M. Drying and wetting of Mediterranean soils stimulates decomposition and carbon dioxide emission: The “Birch effect”. Tree Physiol. 2007, 27, 929–940. [Google Scholar] [CrossRef] [PubMed]
  31. Sawyer, J.E.; Mallarino, A.P. Differentiating and Understanding the Mehlich 3, Bray, and Olsen Soil Phosphorus Tests. In Proceedings of the 19th Annual Crop Management Short Course, St. Paul, MN, USA, 22 November 1999; Available online: https://lib.dr.iastate.edu/agron_conf/12 (accessed on 12 October 2019).
  32. Buri, M.M.; Ishida, F.; Kubota, D.; Masunaga, T.; Wakatsuki, T. Soils of flood plains of West Africa: General fertility status. Soil Sci. Plant Nutr. 1999, 45, 37–50. [Google Scholar] [CrossRef]
  33. Ogbodo, E.N. Assessment of some soil fertility characteristics of Abakaliki urban floodplains of South-East Nigeria, for sustainable crop production. World J. Agric. Sci. 2011, 7, 489. [Google Scholar]
  34. Alavaisha, E.; Manzoni, S.; Lindborg, R. Different agricultural practices affect soil carbon, nitrogen and phosphorous in Kilombero-Tanzania. J. Environ. Manage. 2019, 234, 159–166. [Google Scholar] [CrossRef]
  35. Niang, A.; Becker, M.; Ewert, F.; Dieng, I.; Gaiser, T.; Tanaka, A.; Senthilkumar, K.; Rodenburg, J.; Johnson, J.-M.; Akakpo, C.; et al. Variability and determinants of yields in rice production systems of West Africa. Field Crops Res. 2017, 207, 1–12. [Google Scholar] [CrossRef]
  36. Van Ittersum, M.K.; Cassman, K.G.; Grassini, P.; Wolf, J.; Tittonell, P.; Hochman, Z. Yield gap analysis with local to global relevance—A review. Field Crops Res. 2013, 143, 4–17. [Google Scholar] [CrossRef]
  37. Niang, A.; Becker, M.; Ewert, F.; Tanaka, A.; Dieng, I.; Saito, K. Yield variation of rainfed rice as affected by field water availability and N fertilizer use in central Benin. Nutr. Cycl. Agroecosyst. 2018, 110, 293–305. [Google Scholar] [CrossRef]
  38. Li, M.; Linzhang, Y.; Mingxing, S.; Lizhong, X.; Yundong, L.; Guohua, L.; Shixue, Y. Study on crop yield stability in a typical region of rice-wheat rotation based on long-term fertilization experiment. Trans. Chin. Soc. Agric. Eng. 2011. [Google Scholar] [CrossRef]
  39. Singh, V.K. Fertilizer management in rice. In Rice Production Worldwide; Chauhan, B.S., Jabran, K., Mahajan, G., Eds.; Springer: Cham, Switzerland, 2017; pp. 217–253. ISBN 978-3-319-47514-1. [Google Scholar]
  40. Dobermann, A.R. “Nitrogen Use Efficiency—State of the Art”. In Agronomy & Horticulture—Faculty Publications; University of Nebraska–Lincoln: Lincoln, NE, USA, 2005; Paper 316. [Google Scholar]
  41. Cassman, K.G.; Peng, S.; Olk, D.C.; Ladha, J.K.; Reichardt, W.; Dobermann, A.; Singh, U. Opportunities for increased nitrogen-use efficiency from improved resource management in irrigated rice systems. Field Crops Res. 1998, 56, 7–39. [Google Scholar] [CrossRef]
  42. Huang, L.; Yang, D.; Li, X.; Peng, S.; Wang, F. Coordination of high grain yield and high nitrogen use efficiency through large sink size and high post-heading source capacity in rice. Field Crops Res. 2019, 233, 49–58. [Google Scholar] [CrossRef]
  43. Cassman, K.G.; Dobermann, A.; Walters, D.T. Agroecosystems, nitrogen-use efficiency, and nitrogen management. Ambio 2002, 31, 132–141. [Google Scholar] [CrossRef] [PubMed]
  44. Singh, D.K.; Kumar, P.; Bhardwaj, A.K. Evaluation of agronomic management practices on farmers’ fields under rice-wheat cropping system in Northern India. Int. J. Agron. 2014, 2014, 1–5. [Google Scholar] [CrossRef]
  45. Omonode, R.A.; Halvorson, A.D.; Gagnon, B.; Vyn, T.J. Achieving lower nitrogen balance and higher nitrogen recovery efficiency reduces nitrous oxide emissions in North America’s maize cropping systems. Front. Plant. Sci. 2017, 8, 1080. [Google Scholar] [CrossRef]
  46. Mae, T.; Inaba, A.; Kaneta, Y.; Masaki, S.; Sasaki, M.; Aizawa, M.; Okawa, S.; Hasegawa, S.; Makino, A. A large-grain rice cultivar, Akita 63, exhibits high yields with high physiological N-use efficiency. Field Crops Res. 2006, 97, 227–237. [Google Scholar] [CrossRef]
  47. Jenkenson, D.S.; Fox, R.H.; Rayner, J.H. Interactions between fertilizer nitrogen and soil nitrogen-the so-called ‘priming’ effect. J. Soil Sci. 1985, 36, 425–444. [Google Scholar] [CrossRef]
  48. Becker, M.; Ladha, J.K. Synchronizing residue N mineralization with rice N demand in flooded conditions. In Driven by Nature: Plant Litter Quality and Decomposition; CAB International: Wallingford, UK, 1997. [Google Scholar]
  49. Singh, U.; Ladha, J.K.; Castillo, E.G.; Punzalan, G.; Tirol-Padre, A.; Duqueza, M. Genotypic variation in nitrogen use efficiency in medium-and long-duration rice. Field Crops Res. 1998, 58, 35–53. [Google Scholar] [CrossRef]
  50. Fletcher, A.L.; Johnstone, P.R.; Chakwizira, E.; Brown, H.E. Radiation capture and radiation use efficiency in response to N supply for crop species with contrasting canopies. Field Crops Res. 2013, 150, 126–134. [Google Scholar] [CrossRef]
  51. Fageria, N.K.; Baligar, V.C. Methodology for evaluation of lowland rice genotypes for nitrogen use efficiency. J. Plant. Nutr. 2003, 26, 1315–1333. [Google Scholar] [CrossRef]
  52. Meertens, H. The cultivation of rainfed, lowland rice in Sukumaland, Tanzania. Agric. Ecosyst. Environ. 1999, 76, 31–45. [Google Scholar] [CrossRef]
  53. Xu, K.; Xu, X.; Fukao, T.; Canlas, P.; Maghirang-Rodriguez, R.; Heuer, S.; Ismail, A.M.; Bailey-Serres, J.; Ronald, P.C.; Mackill, D.J. Sub1A is an ethylene-response-factor-like gene that confers submergence tolerance to rice. Nature 2006, 442, 705–708. [Google Scholar] [CrossRef] [PubMed]
  54. Singh, S.; Mackill, D.J.; Ismail, A.M. Responses of SUB1 rice introgression lines to submergence in the field: Yield and grain quality. Field Crops Res. 2009, 113, 12–23. [Google Scholar] [CrossRef]
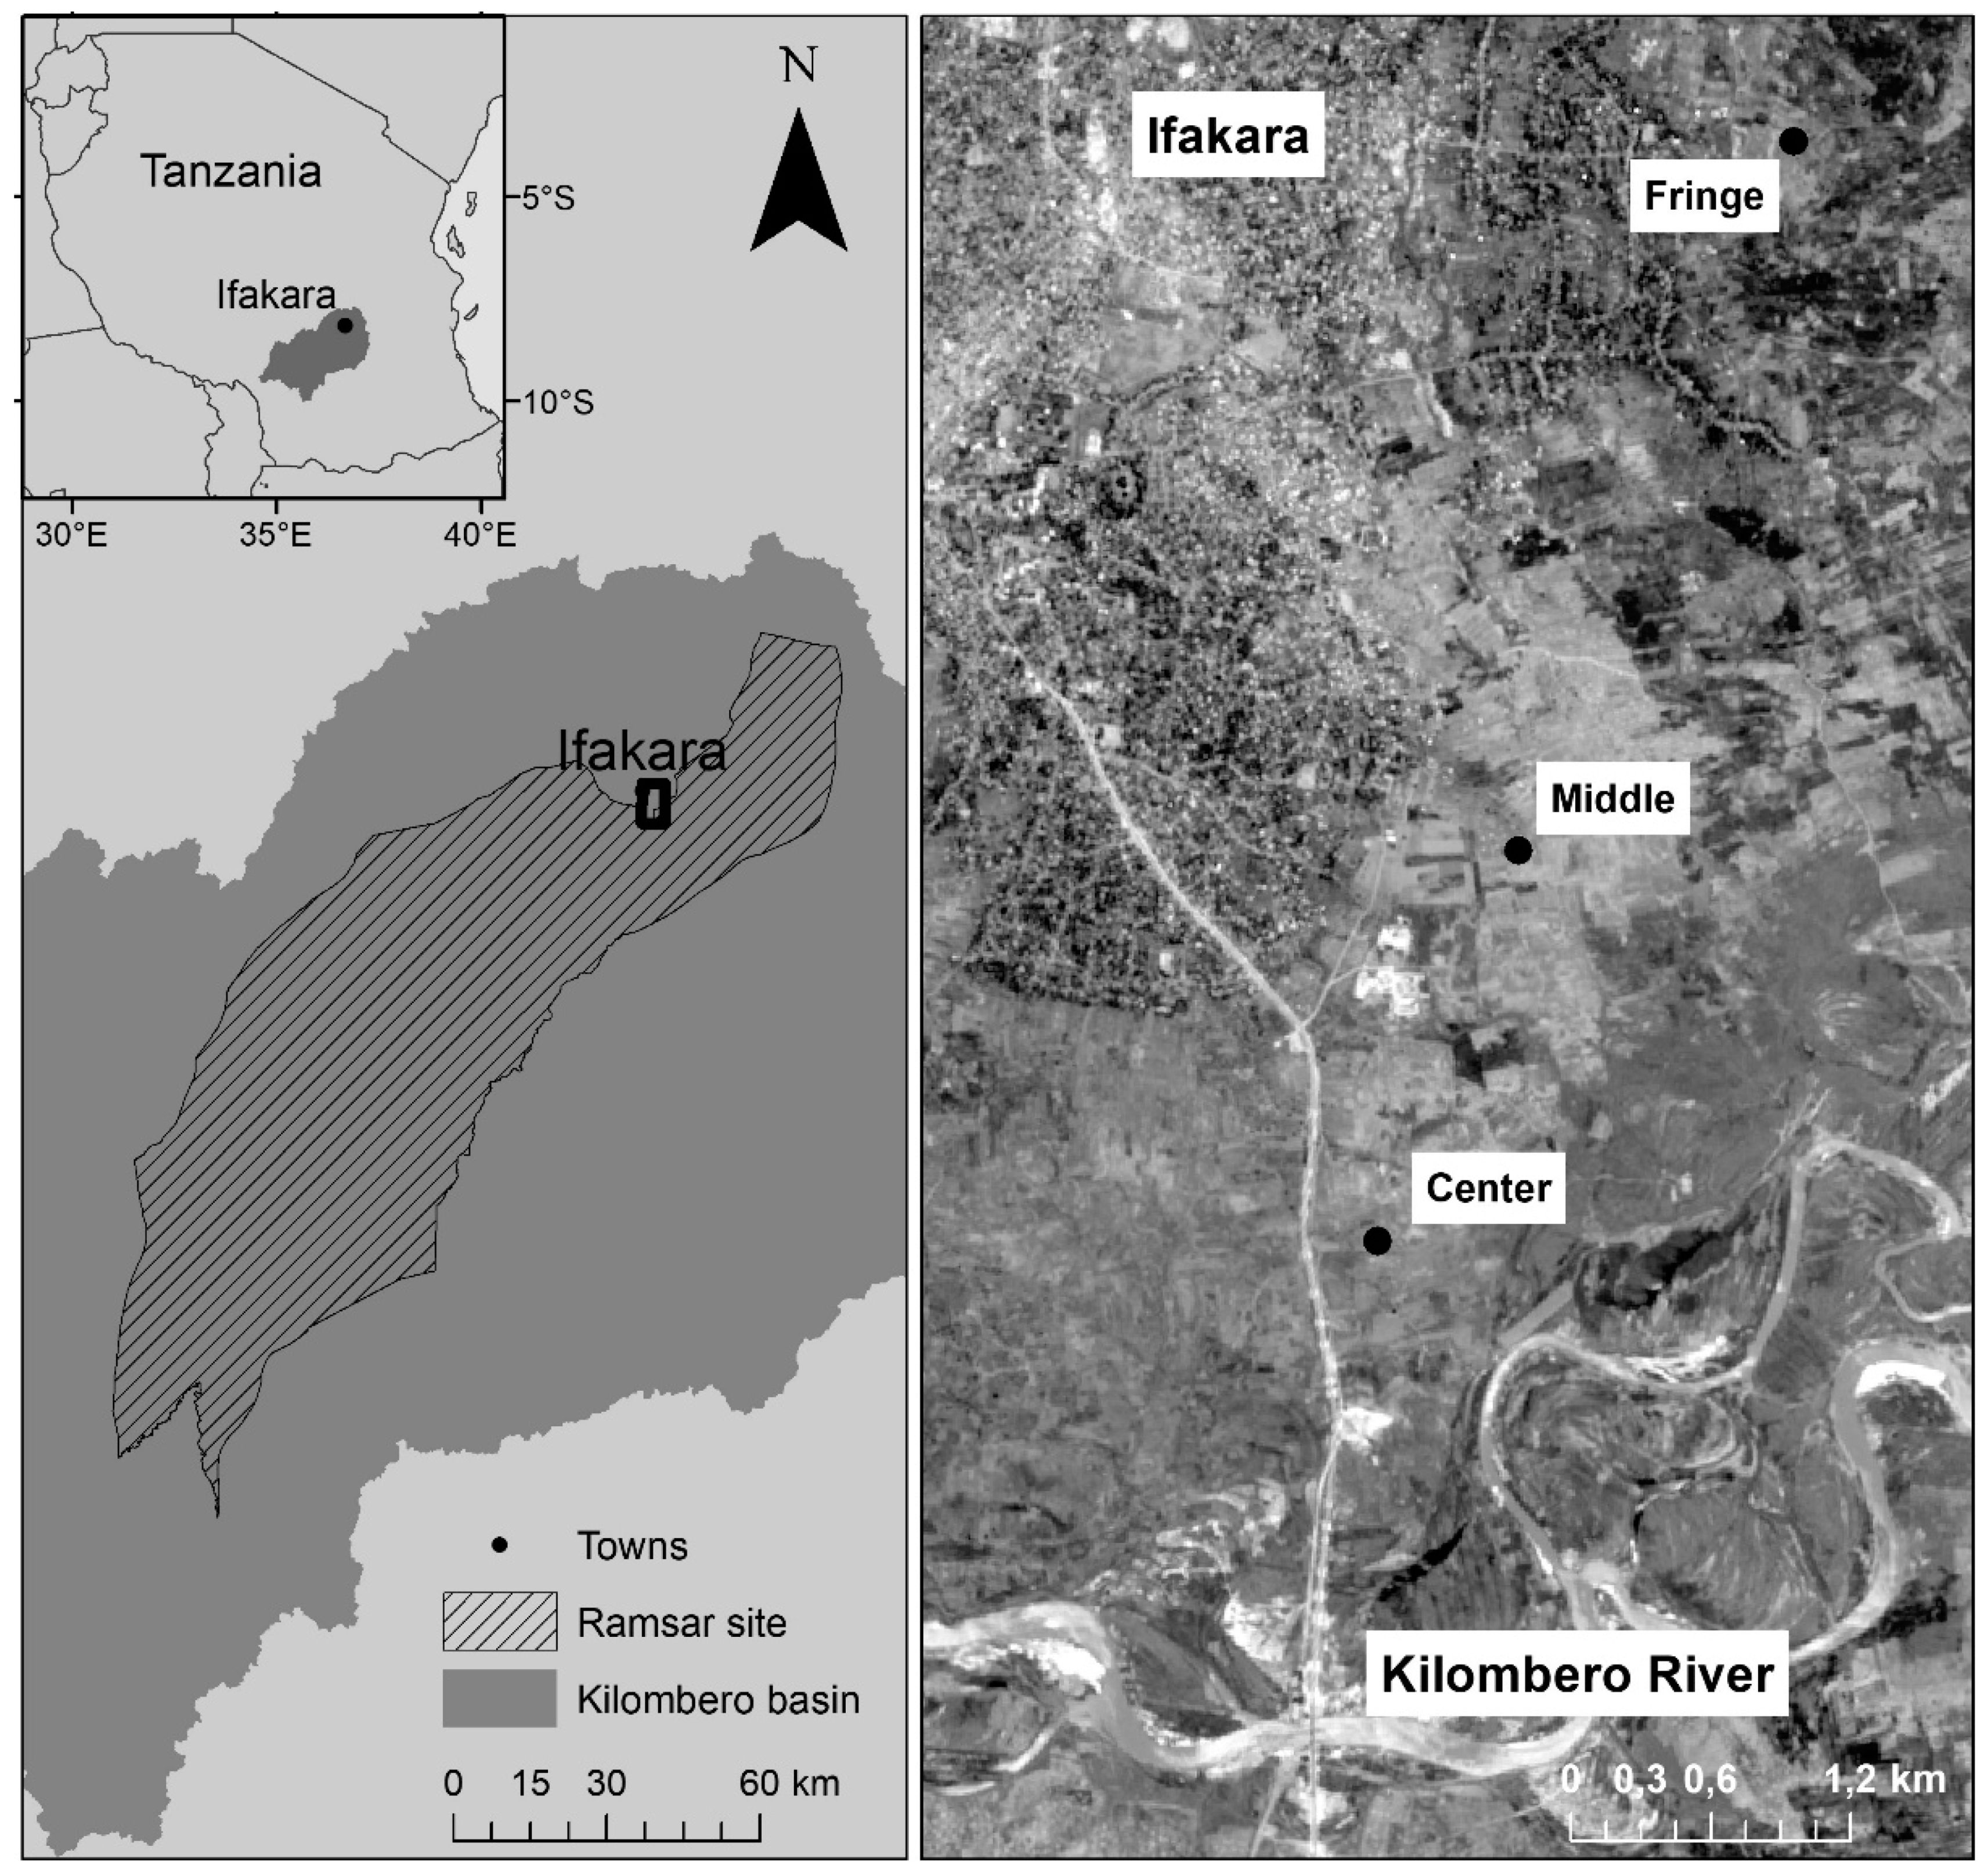
Figure 1. Location of the experimental sites in the Kilombero floodplain. The fringe position is furthest from Kilombero River, while the center position is closely located near the river.
Agronomy 09 00632 g001
Figure 2. Meteorological data for Ifakara (261 m a.s.l) for 2015, 2016 and 2017, showing monthly total rainfall (solid bars), average daily mean temperature (solid line) and average daily total solar radiation (dotted line). Rice was transplanted from late February to early March and harvested between early and late June with rainfall of 453 mm, 582 mm and 941 mm during the growing period from March to May (of 2015, 2016 and 2017, respectively).
Agronomy 09 00632 g002
Figure 3. Source of grain yield variation of lowland rice due to (A) hydrological position, (B) year and (C) land and mineral N management with farmers practice as a control, X = arithmetic mean, = median. Different letters indicate significant differences by Tukey test at p ≤ 0.05.
Agronomy 09 00632 g003
Figure 4. Effect of management practices on the grain yield (t ha−1 86% dm) of lowland rice, differentiated by hydrological positions and their associated percentage adjusted coefficients of variation across years and replicates (aCV presented below the graph), and mean unadjusted coefficients of variations across years ( C V ¯ ) in Kilombero floodplain, Tanzania, 2015–2017. Different letters indicate significant differences by Tukey test at p ≤ 0.05 between positions.
Agronomy 09 00632 g004
Figure 5. Nitrogen uptake by rice grain and straw across years (2015–2017) as affected by management practices. Different letters indicate significant differences by Tukey test at p ≤ 0.05 between positions. * “Attainable yield” treatments comprised of supplementary application of P and K.
Agronomy 09 00632 g005
Figure 6. Use efficiencies of applied mineral fertilizer N averaged over years and differentiated by hydrological position: (A) partial factor productivity (kg grain yield kg−1 N applied), (B) agronomic N use efficiency (kg grain increase kg−1 N applied), (C) crop recovery efficiency (kg N increase kg−1 N applied) and (D) physiological N use efficiency (kg grain increase kg−1 N uptake). Different letters indicate significant differences by Tukey test at p ≤ 0.05 between positions.
Agronomy 09 00632 g006
Table 1. Selected characteristics of the different experimental sites and top soils (0–20 cm) in the Kilombero floodplain.
CharacteristicFringeMiddleCenter
Distance from river (km)6.44.21.0
Cumulative evaporation (mm) 843713786
Evapotranspiration (mm) 1044896969
Ground water discharge (mm) 220196109
Change in soil water storage (mm) 120233263
Maximum flooding depth (m)0.30.71.4
Flooding duration (days)172240
Soil texturesilt loamsilt loamsilt clay loam
Clay (%)14.020.235.7
Silt (%)58.260.152.1
Sand (%)27.819.712.2
pH (H2O)6.05.84.9
Total C (g kg−1)16.515.022.5
Total N (mg kg−1)1.00.91.7
Available P (mg kg−1)47.516.09.7
Available K (mg kg−1)71.470.679.2
Bulk density (g m−3) 1.411.311.26
Initial soil sampling conducted at the beginning of the experiment in 2014; available P and K extraction were done according to Mehlich-3 extraction. data from [10].
Table 2. Treatment applied in three hydrological positions of Kilombero floodplain in 2015, 2016 and 2017.
No.Treatment Quantification Details
1Farmers practice Yield gap baselineNo bunding, levelling, no mineral N, single weeding
2Bunding Yield gap due to bundingBunding, levelling, No mineral N, clean weeding
360 kg N Yield gap due to N Bunding, levelling, 60 kg urea- N ha−1, clean weeding
4120 kg N+ 60 kg PK Achievable yield in single crop systemBunding, levelling, 120 kg N + 60 kg P+ 60 kg K + supplementary irrigation
Table 3. Analysis of variance (F values) of the effect of year, position and treatment on rice grain yield, panicles, harvest index, % filled grain, 1000 grain weight and dry biomass production.
Source of VariationDfGrain
(t ha−1)
Panicles (m−2)Harvest IndexFilled Grain (%)1000 Grain Weight (g)Biomass
(t ha−1)
Year218.48 ***6.08 **10.87 ***92.62 ***30.04 ***7.86 **
Position 244.55 ***55.48 ***23.64 **1.59 ns2.83 ns4.14 *
Rep (year X Position)243.21 ***2.87 ***1.57 ns1.17 ns2.47 **2.41 **
Year X position30.84 ns9.16 ***6.93 ***8.38 ***5.81 **2.14 ns
Treatment3291.78 ***71.34 ***9.73 ***4.19 **23.94 ***107.33 ***
Year X treatment60.89 ns1.29 ns1.82 ns2.7 *6.35 ***1.02 ns
Position X treat68.06 ***0.91 ns2.20 ns0.25 ns0.44 ns5.24 ***
Year X position X treatment90.39 ns1.45 ns3.15 **0.24 ns3.341 **1.71 ns
*** significant at p ≤ 0.001, ** significant at p ≤ 0.01, * significant at p ≤ 0.05, ns: not significant.