Article

Preliminary Genetic Map of a New Recombinant Inbred Line Population for Narrow-leafed Lupin (Lupinus angustifolius L.)

Department of Genetics, Plant Breeding and Seed Production, Wroclaw Uniwersyty of Environmental and Life Science, plac Grunwaldzki 24A, 53-363 Wroclaw, Poland
*
Author to whom correspondence should be addressed.
These authors contributed equally to this work.
Agronomy 2019, 9(10), 653; https://doi.org/10.3390/agronomy9100653
Submission received: 26 August 2019 / Revised: 14 October 2019 / Accepted: 15 October 2019 / Published: 18 October 2019
(This article belongs to the Section Crop Breeding and Genetics)

Abstract

:
Genetic maps are an essential tool for investigating molecular markers’ linkage with traits of agronomic importance. Breeders put a lot of emphasis on this type of markers, which are used in breeding programs implementation and speed up the process of a new variety development. In this paper, we construct a new, high-density linkage genetic map for Polish material on narrow-leafed lupin. The mapping population originated from crossing the Polish variety ‘Emir’ and the Belarusian breeding line ‘LAE-1’. A new map was constructed based on DArTseq markers—a new type of marker generated with the next-generation sequencing (NGS) technique. The map was built with 4602 markers, which are divided into 20 linkage groups, corresponding with the number of gametic chromosomes in narrow-leafed lupin. On the new map there are 1174 unique loci. The total length of all linkage group is 3042 cM. This map was compared to the reference genome of narrow-leafed lupin and the CDS sequence for model legume species: emphMedicago truncatula, emphLotus japonicus and Glycine max. Analysis revealed the presence of the DArTseq marker common for all investigated species. We were able to map 38 new, unplaced scaffolds on the new genetic map of narrow-leafed lupin. The high-density genetic map we received can be used for quantitative trait locus (QTL) mapping, genome-wide association study analysis and assembly of the reference genome for the whole genome sequencing (WGS) method

1. Introduction

In the process of providing food for the world, high-protein cultivated crops of legume plants (Fabaceae family) play a significant role, and their importance will be even more significant in the future [1]. Today, the leader in the production of vegetable protein is transgenic soybean (Glycine max L.). In Poland, soybean is a marginal crop due to its lengthy vegetation period, pH requirement close to neutral, and requirement of warm soils maintained in high culture. In Poland majority of soils are light acid ones. Similar to other European countries also in Poland, there is no public acceptance for usage of Genetically Modified Organism (GMO). Moreover, the architecture of plants is unfavourable trait due to low position of first set of pods on the main shoot. In recent years, a Polish project that uses biotechnological tools to improve legumes, including lupins, in order to improve plat protein was launched. The main goal of this idea is finding a crop that can partially substitute soybean protein (www.bialkoroslinne.iung.pl).
The largest area of lupin cultivation and production were located in Australia—387,400 ha and 21,694 tons of seeds (FAOSTAT 2016) in Mediterranean zone. In Central Europe climatic and soil conditions are also favourable for lupin cultivation, especially for the narrow-leafed lupin (Lupinus angustifolius L.) [1]. According to FAO STAT, lupin crop area represents 32% of the world production, and reached 19887 ha in 2014, 40% of which was located in Poland. The popularity of narrow-leafed lupin in Poland is due to its the tolerance for light acid soils (about 70% of the arable lands in Poland are acid and light) and field tolerance to anthracnose—the most destructive fungal disease of lupin. Due to symbiosis with Bradyrhizobium [2] lupin has the ability to fix nitrogen. Narrow-leafed lupin, like other species of this genus, has the ability to convert organic phosphorus into one available for plants, and it is an attractive rotation plant for cereals. Recent studies have shown the possibility of using lupins in medicine and human diet too [3,4].
Narrow-leafed lupin belongs to the Lupinus genus, which is classified in the Papilionoideae subfamily of the Leguminosae (syn. Fabaceae), occupying the genistoid clade. The sister clade Papilionoideae contains the majority of economically important legumes: soybean (Glycine max L.), common bean (Phaseolus vulgaris L.), Lotus japonicus L., barrel clover (Medicago truncatula Gearnt.), pea (Pisum sativum L.), broad bean (Vicia faba L.), lentil (Lens culinaris Medicus), and chickpea (Cicer arietinum). The amount of genomic information for many legume species has been growing fast; many genetic maps and genome sequences have been developed, especially for model plants of this family such as Medicago truncatula, Lotus japonicus and Glycine max [5,6,7,8,9,10]. Recently, narrow-leafed lupin has been included in this group [11].
So far, two genetic maps have been created for the narrow-leafed lupin, with modifications based on two different recombinant inbred line (RIL) populations. The first population has been derived from crossing domesticated line 83A: 476 (a sister line of cv. Wonga) and genotype from natural population (W) originating from Morocco (P27255) – DxW. This population, DxW, was used to create the first skeleton map of L. angustifolius [12]. The MFLP technique allowed to generate 1083 polymorphic DNA markers. There were 522 unique loci, 454 of which (87%) could be assigned to 21 linkage groups covering 1543 cM., All domesticated genes were integrated into the genetic map, including the anthracnose resistance gene (Lanr1). DxW population was useful in creating a series of maps based on different molecular markers—AFLP, SSR, STS, DArT, BAC and SNP [13,14,15]. Nelson et al. (2006) documented the first gene-based linkage map of Lupinus angustifolius (narrow-leafed lupin) and it was compared to the partially sequenced genome of Medicago truncatula. The map contained 382 loci that were in 20 major linkage groups, two triplets, three pairs and eleven unlinked loci, and they all had 1846 cM. The map was generated from the following molecular markers: 163 RFLP, 135 gene-based PCR markers, 75 AFLP and 4 AFLP-derived from SCAR markers in the mapping population DxW. The next published map [14] comprised of 1090 markers in 20 linkage groups. Comparing the new map with the previous one shows nearly 200 new markers. The updated reference genetic map of L. angustifolius reported by Kroc et al. [15] comprised of 1207 loci, including 352 new, high_quality DArT and PCR-based STS markers. These new markers improved genome coverage with the number of unique framework loci increasing to 795 compared with 637 in the previous reference map.
The second mapping population has been obtained by crossing the ‘Tanjil’ (highly resistant to the anthracnose, the phomopsis stem blight, grey leaf spot disease, CMV virus transmission, aphid colonization) and ‘Unicrop’ (not resistance) varieties. Based on that, a single genetic map has been created for this population [16] using the NGS-based RAD-sequencing technology. The 8246 markers (including SNP 7563) were grouped in 20 linkage groups. The total length of the linkage map was 1629.9 cM.
The latest, ultra-high density consensus genetic map joins previously described maps containing 34,574 markers and consisting of 3508 loci covering 2399 cM in 20 linkage groups. Additionally, markers closely linked to nine genes of agronomic traits were identified. Based on this map, a reference genome for narrow-leafed lupin was improved to cover 560.5 Mb genome sequence [17].
In parallel with the construction of genetic maps, a sequencing project for this species was initiated. In 2013, the first draft genome sequence for narrow-leafed lupin was published [16]. The upgraded version of the draft genome with the scaffold joined into pseudo-chromosomes was announced in 2016 and in 2018 [11,17].
The dynamic development of DNA sequencing techniques, in particular the next-generation sequencing (NGS) group, enabled development of new technology for genotyping by sequencing (GBS). One of the techniques is DArTseq, which is gaining popularity among plant and animal genomic studies (http://www.diversityarrays.com/dart-application-dartseq). Similar as in the case of hybridization-based DArT, DArTseq is based on the “reduction of the genome complex” by using an appropriate combination of restriction enzymes. In contrast to the classical DArT techniques, in DArTseq DNA fragments after reduction are not hybridized, but are sequenced on the NGS platforms. In this specific study the Illumina Hiseq2500 instrument was used [18,19] (http://www.diversityarrays.com/). The use of sequencing instead of hybridization noticeably increases the number of generated markers, on average it is an increase by one order of magnitude, at a price comparable with “classical” DArT. Genotyping by DArTseq technique generates two types of markers. The first type is “silicoDArT”—the equivalent of DArT markers obtained using hybridization techniques. The second type are SNP markers. The DArTseq technique has been available at DArT PL since 2012. Despite such a short presence on the market, it has already been used for genotyping of several species [11,18,19,20,21,22]
In our study, which started in early 2000, we focused on generating a new, recombinant inbred line population for narrow-leafed lupin. Our goal was to develop a population, which would show a wide variety of phenological, morphological and agronomical traits. Such a population will be a useful tool for investigating quantitative trait locus (QTL) regions and (whole genome sequencing) WGS analysis. For this purpose, we chose two genotypes with differences in plant height, number of branches, 1000 seeds mass, ripening and pod shattering. For easier observation of inbred lines’ segregation, we selected parental forms that differ in easy-to-follow changes in morphological traits such as the colour of flowers and seeds, as well as the type of growth [23].
The aim of the study was to construct a genetic linkage map for the new recombinant inbred line population as a tool for future QTL and WGS analysis.

2. Materials and Methods

2.1. Material

The material for the study was a population consisting of 92 RIL type lines and their parental forms. Inbred RILs derived from a single plant seed from the F1 generation obtained by crossing the Polish variety ‘Emir’ and LAE-1 line. Crossing the two varieties: ‘Emir’ and LAE-1 was performed in 2002, in the Experimental Station Swojec, that belongs to the Wroclaw University of Environmental and Life Sciences. Subsequent generations were obtained in successive growing seasons up to generation F8, and propagated in field conditions (Experimental Station–Swojec).

2.2. Phenotyping Type of Growth

In the greenhouse experiment for each line 3 seeds were sown in one pot. The type of growth was evaluated manually during flowering. After harvesting the seeds their colour was determined visually for each line.

2.3. DNA Extraction

DNA was isolated from young leaves using a modified Doyle and Doyle method [24] with CTAB (hexadecyl-amino-trimethyl bromide). The leaves were collected from three-week plants growing in the phytotron (photoperiod 16/8, temperature 18 °C).
The leaves were homogenized in liquid nitrogen, or directly in the lysis buffer. In case of homogenization with the buffer, TissueLyser (Qiagen) and metal beads were used. The homogenized material was incubated for one hour (or 10 min for homogenization directly in the buffer) in 500 μL of extraction buffer at 60 °C with constant shaking (1050 rpm). Then 2 μL of RNase A (2 mg·μL−1, Blirt Co.,Gdansk, Poland). was added and it was incubated for another 30 min at 37 °C. In the next step 500 μL of chloroform mixture: isoamyl (24:1) was added, and incubated at room temperature for 10 min with constant stirring (1400 rpm). After incubation, the samples were centrifuged at room temperature (13.2 krpm). DNA was precipitated by adding 400 μL of isopropanol and incubation at −20 °C for 30 min, and then the tube was centrifuged at 4 °C for 30 min. The pellet was resuspended in 40 μL of water MQ (PCR) or TE (DArTseq genotyping). The quality and quantity of the isolated DNA were checked by electrophoresis. Isolated DNA was separated on 0.8% agarose gel. DNA was visualized under UV light and documented photographically.

2.4. SSR and ISSR Genotyping

Inter Simple Sequence Repeat (ISSR) PCR analyses were performed using selected primers from UBC # 9 (University of British Columbia). In the first stage of the study 100 primers were used, 69 of them (Table S1) generated polymorphic products among parental forms and they were selected for genotyping mapping population. PCR and separation of amplification products were performed according to Clements et al. [25].
In the first stage of the study, 32 pairs of SSR (Table S2) primers were tested to determine which of them exhibit polymorphism between parental forms and could be used to genotype the `ExL’ mapping population. The PCR mixture contained 2xPCR TaqNova mix (Blirt Co, Poland), 0.28 mM of each primer and 45 ng of genomic DNA. The thermal profile was performed as follows: initial denaturation at 95 °C for 5 min, 35 cycles of initial denaturation at 95 °C for 30 s, primer attachment at the optimal temperature for the primer (Table S2), amplification at 72 °C for 30 s and final amplification at 72 °C for 7 min. Amplification products were separated using the QIAxcel capillary electrophoresis system (Qiagen, Düsseldorf, Germany). ScreningGel 2400 (Qiagen, Germany), alignment 15 bp - 3 kbp (Qiagen, Düsseldorf, Germany) and a 100 bp–2.5 kbp size marker (Qiagen, Düsseldorf, Germany) were used. Samples were separated using the AM420 module (10 s injection time, 7 min separation time). The size of products was analysed using QIAxcel ScreenGel (Qiagen, Düsseldorf, Germany) software. Primers generating polymorphic amplification products were used to study the polymorphism in the mapping population. Genotyping of the ‘ExL’ population was done in the same way as the parental forms.

2.5. DArTseq Genotyping

Genotyping using DArTseq techniques has been performed by the DArT PL company. DArTseq is a technique that combines reduction of the complex genome by endonuclease cleavage with next-generation sequencing [26]. Similar to the classic DArT analysis of complex genomic reduction, the method is developed for each individual organism through the selection of appropriate restriction enzymes and digestion conditions. For lupin four different methods were tested and PstI–MseI was selected. DNA samples were subjected to digestion and then ligated with the appropriate adapter and PstI MseI [27]. Adapters were designed so that they could be used in next-generation sequencing using an Illumina Hiseq2500. The ligation products were amplified by PCR with the following profile: denaturation at 94 °C for 1 min, 30 cycles of denaturation for 20 s at 94 °C, annealing at 58 °C for 30 s, amplification at 72 °C for 45 s, final amplification at 72 °C for 7 min. After that, the PCR products of each genotype were merged into one collection to enable them to carry the c-Bot bridge PCR device Illumina Hiseq2500. Sequencing (read signal) was performed in 77 cycles. The results of sequencing were developed using the DArT PL software. Prepared markers were encoded as the “A/B/-”.

2.6. Genetic Map Construction

The genetic map was built using two R [28] packages: r/qtl [29] and r/ASMap [30]. For map construction, a set of 4779 molecular markers containing DArTseq, ISSR, LaSSR and one morphological marker was used. The marker genotype data was inspected for missing data, segregation distortion, duplicated markers and clonal individuals using the appropriate functions and settings in ASMap and R/qtl. In the first step, only markers with segregation ratio 1:1 (p > 0.1) were used to construct the draft of the map. To divide markers into linkage r/ASMap groups, mst.map function for advance RILs population with parameters p-value = 2.5 × 10⁻⁶, dist.fun = kosambi was implemented [31]. This yielded 40 linkage clusters. In the next step the marker sequences were aligned to the narrow-leafed lupin pseudo_chromosomes (v 1.0) [11] (http://www.lupinexpress.org/node/16) using BLAST algorithm with parameters: minimum sequence identity set to 98.5% (68/69), minimum subject length 69, Evalue <= 2.00 × 10⁻²⁷ (the same procedure was used for upgraded version of genome [17]). This allowed to connect some clusters from one pseudo-chromosome into one linkage group and reduce number of obtained linkage groups/clusters to 34. In the third step unpolished markers from the first step and markers with disturbed segregation ratio (p < 0.1) were added to draft map using appropriate function of ASMap and R/qtl. In the last step linkage groups were assigned to the pseudo-chromosomes in the correct orientations.
The naming system was as follows: for main linkage group prefix “EL_LG” was followed by the number of corresponding pseudo-chromosomes. If more than one main linkage group corresponded with pseudo-chromosomes, there were marked with additional letters (A, B etc.). The same rule was applied to clusters, where prefix “EL_LG” was replaced with “EL_Cl”.
The genetic map was drawn using MapChart software ver. 2.3 [32]. The results of comparison of the obtained genetic map with the reference genome of narrow-leafed lupin were visualized using CIRCOS [33].

2.7. Homology Search within Lupin and Legume Gene Sequences

The BLASTN search with “blastn-short” algorithm optimized for short sequence was performed for the narrow-leafed lupin CDS sequence [11] database downloaded from http://www.lupinexpress.org. The results were filtered with threshold E-value of 1 × 10⁻²⁴.
The CDS sequences for the legume model organism Medicago truncatula, soybean (Glycine max) and Lotus japonicus were downloaded from the plantGDB internet database (http://www.plantgdb.org/GmGDB/, http://www.plantgdb.org/MtGDB/, http://www.plantgdb.org/LjGDB/). A BLASTN homology between DArTseq markers and the legume model organism gene was searched with the “blastn-short” algorithm and E-value threshold of 1 × 10⁻¹³ (Medicago truncatula, Glycine max) or 1 × 10⁻¹⁵ (Lotus japonicus).

3. Results

3.1. ISSR and SSR Genotyping

For genotyping of the mapping population 69 ISSR primers were used, 29 of which generated repeatable amplification products that had a 1:1 distribution (p ≥ 0.001) in the population studied (test χ 2 , Table S3). The remaining 40 primers in the population generated products which indicated significant deviation from the 1:1 ratio (p< 0.001). The 29 primers gave from one to four amplification products with a 1:1 distribution (Table 1). Forty-nine percent of the analysed lines showed ‘Emir’ genotype, and 51% of the lines had genotype type LAE-1 (Table 1). Obtained values were close to expected 50% which is a good illustration of a correct distribution of markers in the population, and the lack of epigenetic phenomena. As a result of the genotyping of 92 RIL lines using 69 ISSR primers, 57 markers were obtained and used to construct the genetic map of the narrow-leafed lupin (Table 1 and Table S3).
In the study a set of 32 SSR primers was used. All of them generated amplification products on the genomic DNA template of parental forms. Polymorphic products between parental forms generated 10 SSR primers: SSR11, LaSSR002, LaSSR003, LaSSR005, LaSSR008, LaSSR011, LaSSR015, LaSSR019, LaSSR022, LaSSR024 (Table 2).
All those primers that generate polymorphic markers were used for genotyping 92 lines of the ‘ExL’ population (Table 1). The markers generated by the SSR primers had the 1:1 distribution in the mapping population (p ≥ 0.001). The SSR primer generated products were differed in parental forms. Product variations between parental forms were within 4 bp and 32 bp (Table 2). The obtained 20 polymorphic SSR markers were used to construct a genetic map of the narrow-leafed lupin.

3.2. DArTseq Genotyping

Genotyping 92 RIL lines of the `ExL’ population and their parental forms allowed us to obtain 5745 repeatable and sequence-defined DArTseq markers (Tables S4 and S5). These markers showed two types of polymorphism: presence or absence of a product (presence/absence variants, PAV) and a single nucleotide polymorphism (SNP). The number of markers with PAV polymorphism was 3737, while the number of SNP markers was 2008. Reproducibility of the DArTseq genotyping results was close to 100% and averaged 99.53% for all markers, 99.72% for PAV markers and 99.34% for SNP markers. SNP markers were characterized by lower reproducibility of the obtained results. The genotyping results for each of the 5745 markers were obtained for an average of 90% of the analysed lines. The lack of genotyping results was not randomly split between the lines. Three (EL/02/1/67, EL/02/2/12 and EL/02/2/7) of the ninety-two tested lines had positive genotyping results below 40% of markers (Figure 1). Those lines were eliminated from further analysis.

3.3. Genetic Map Construction

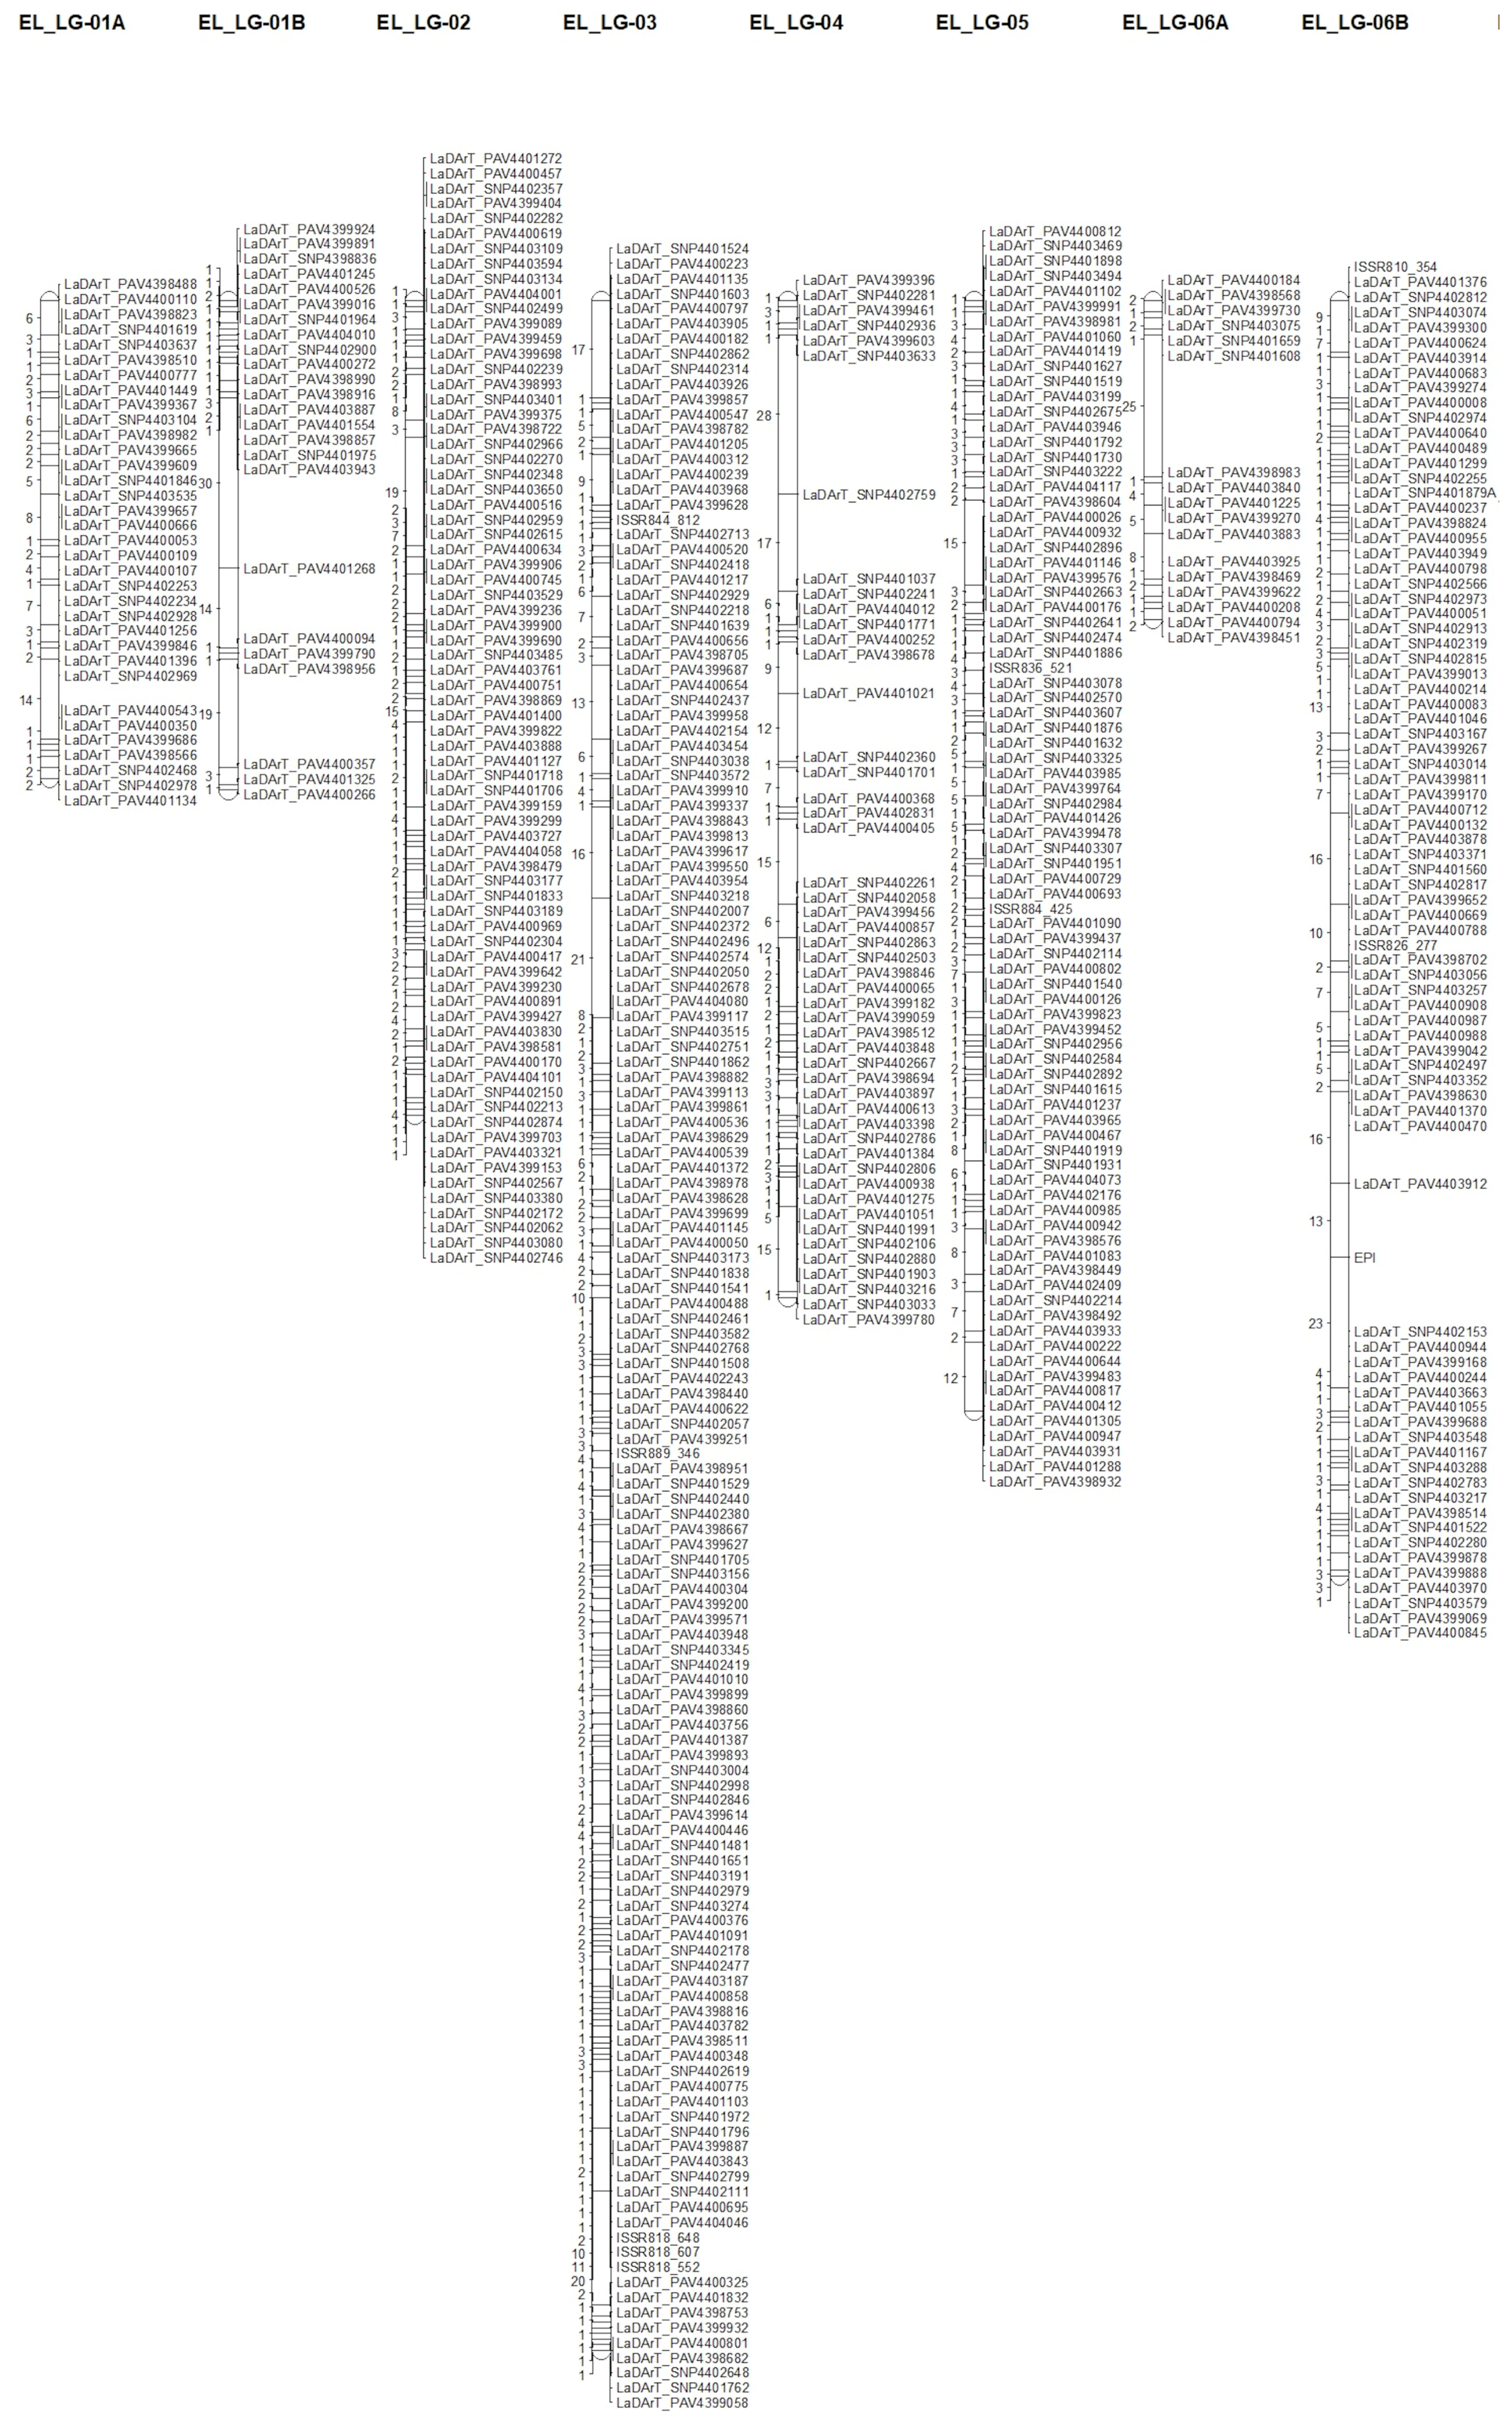
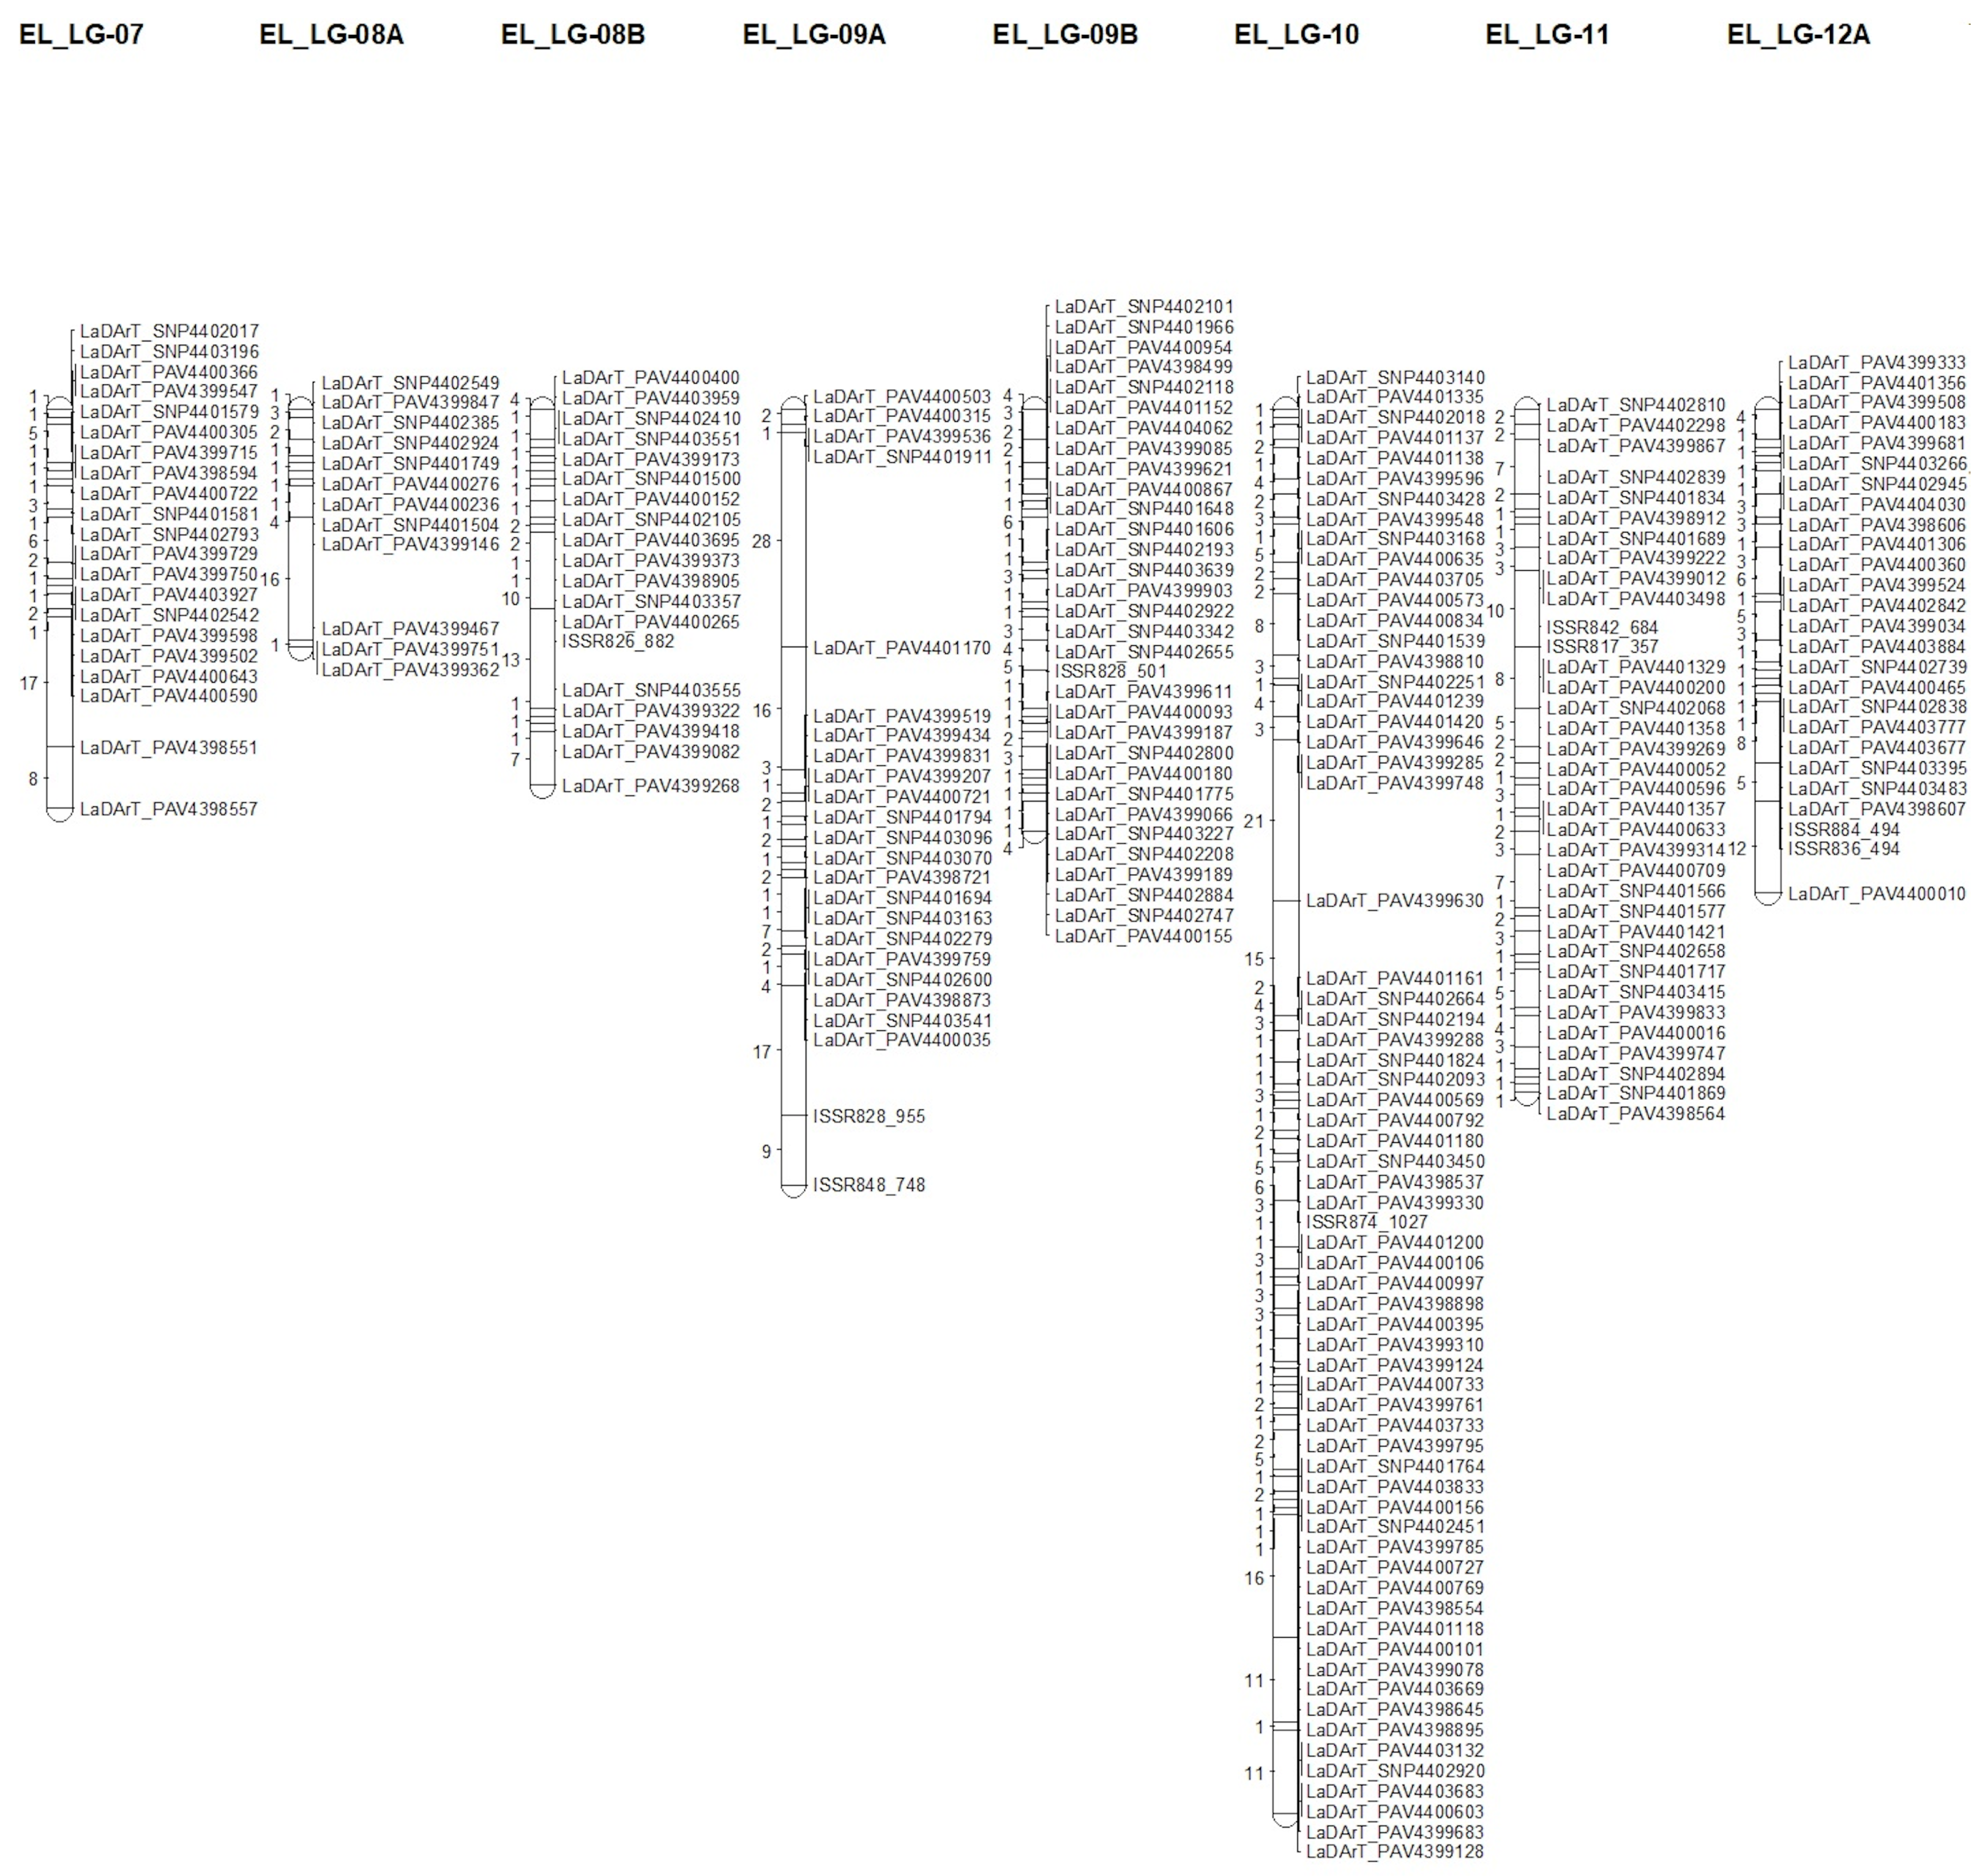
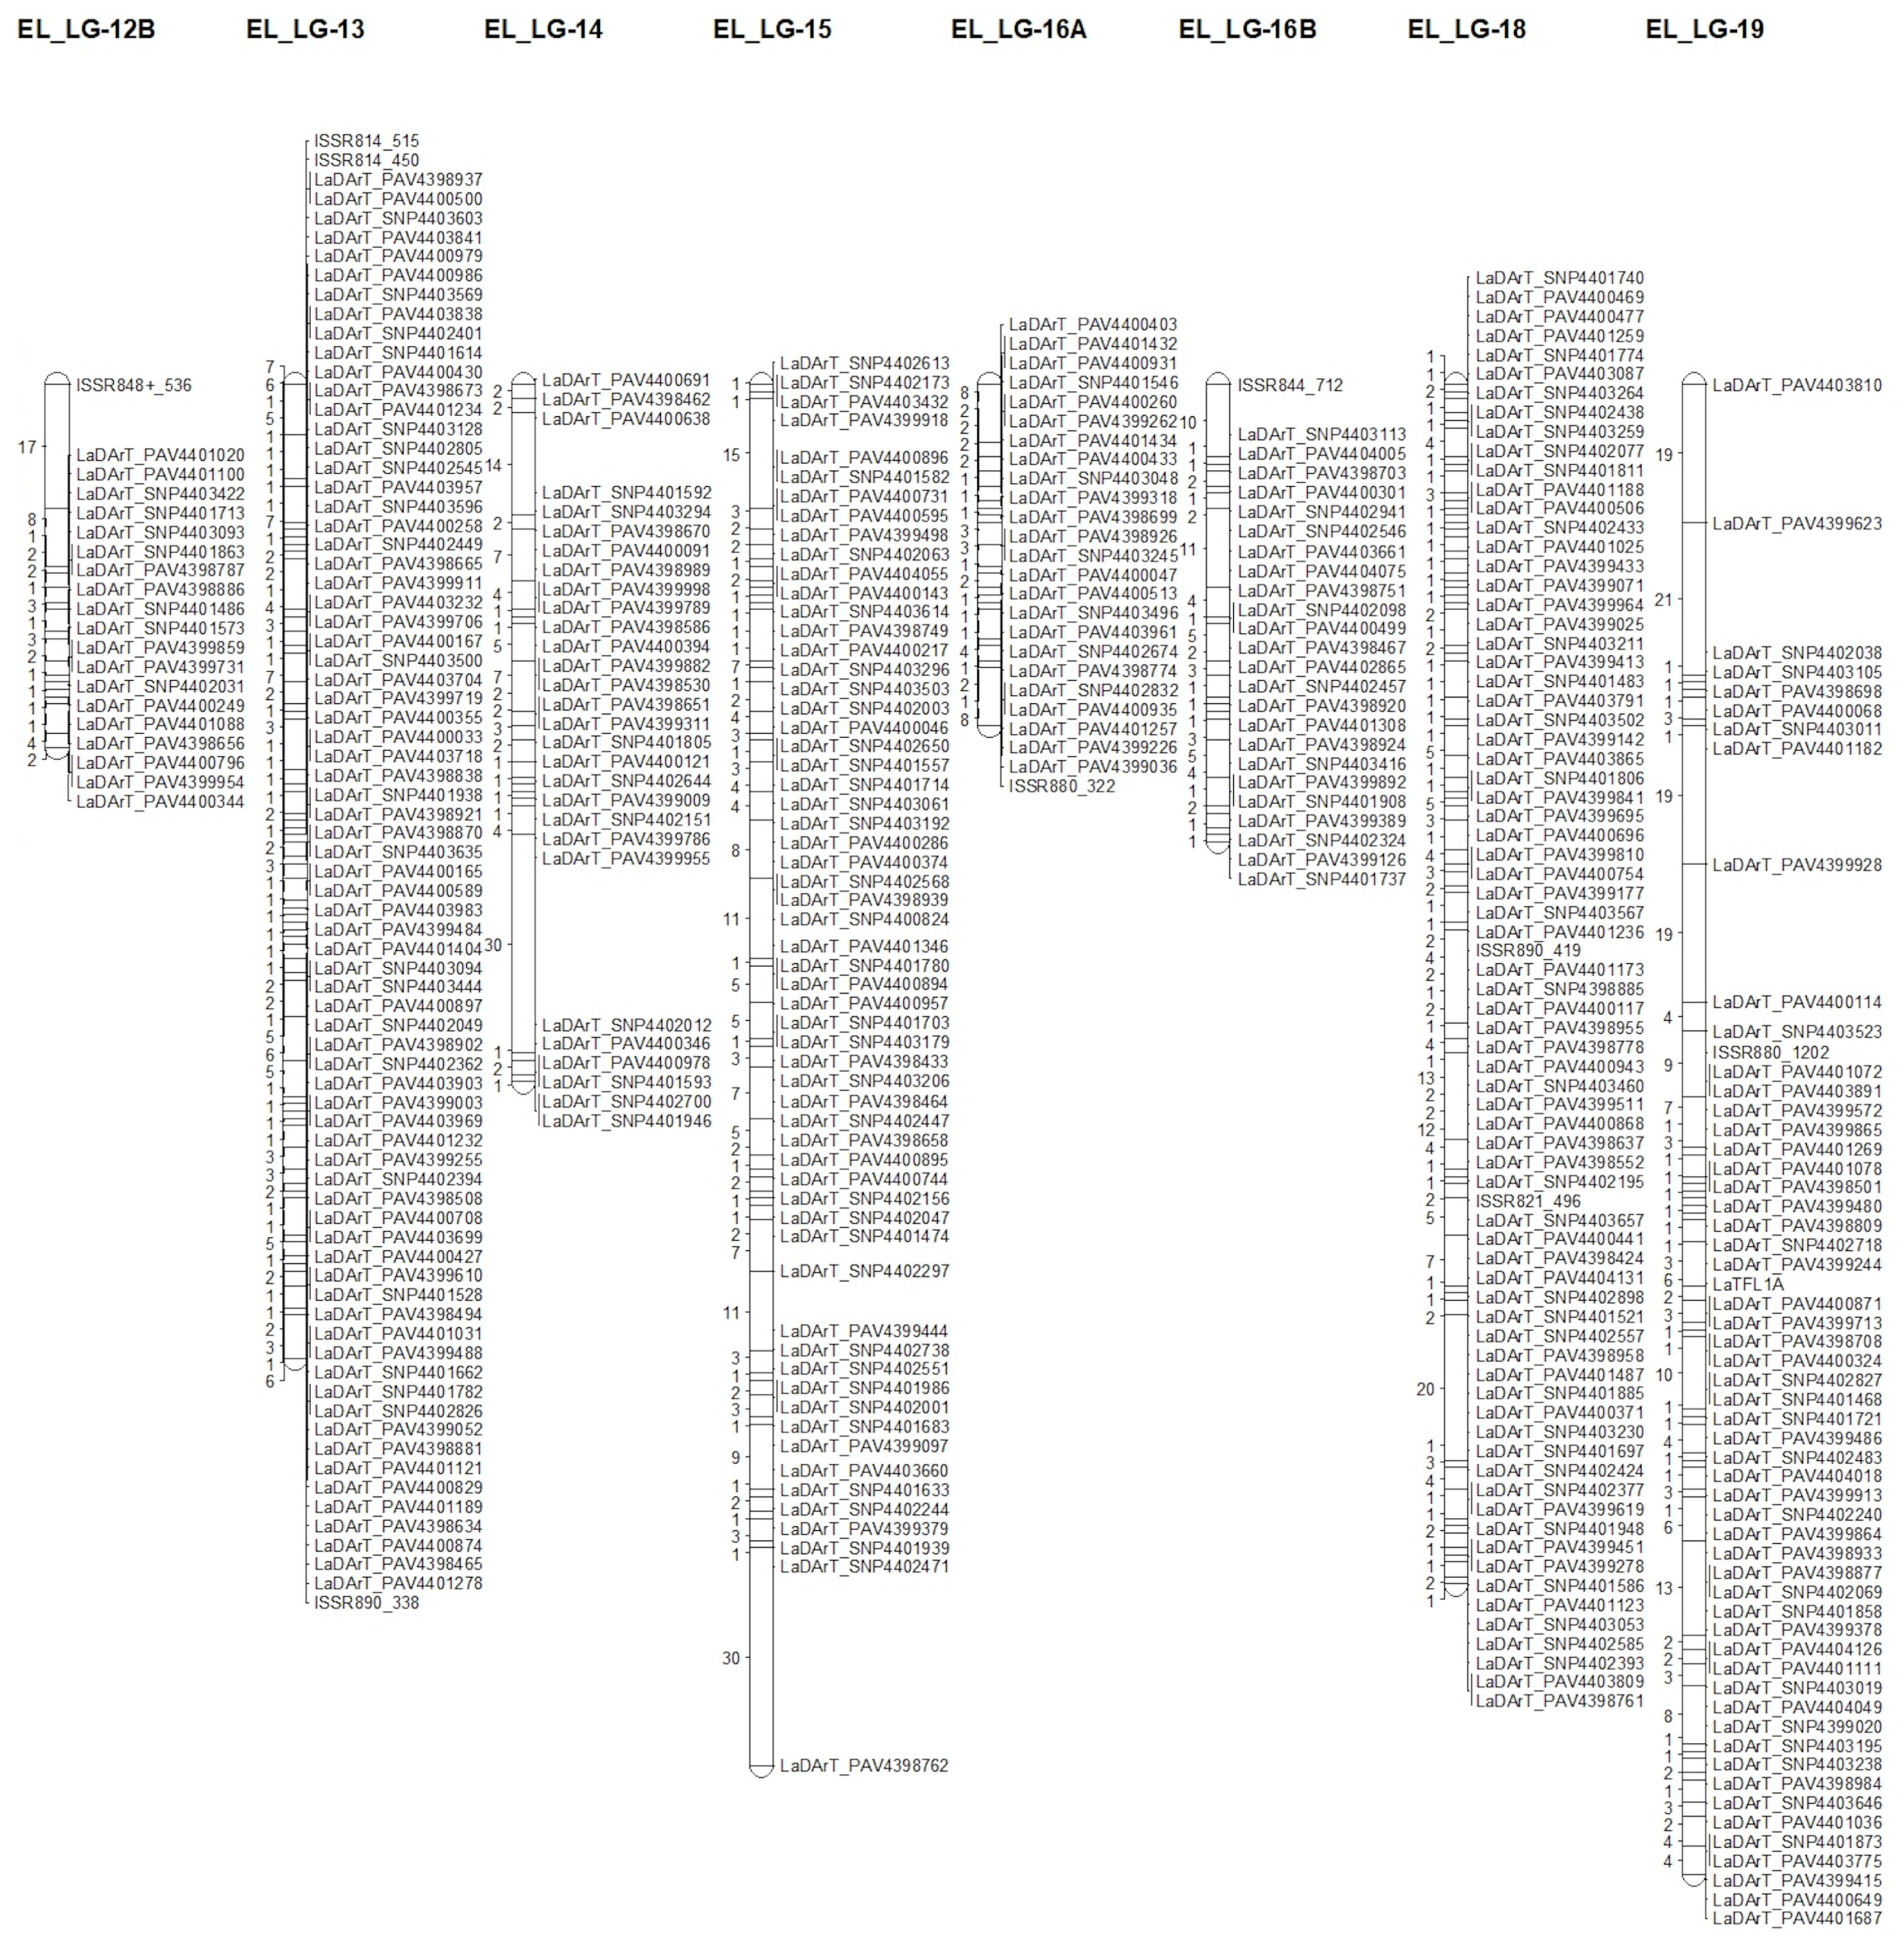
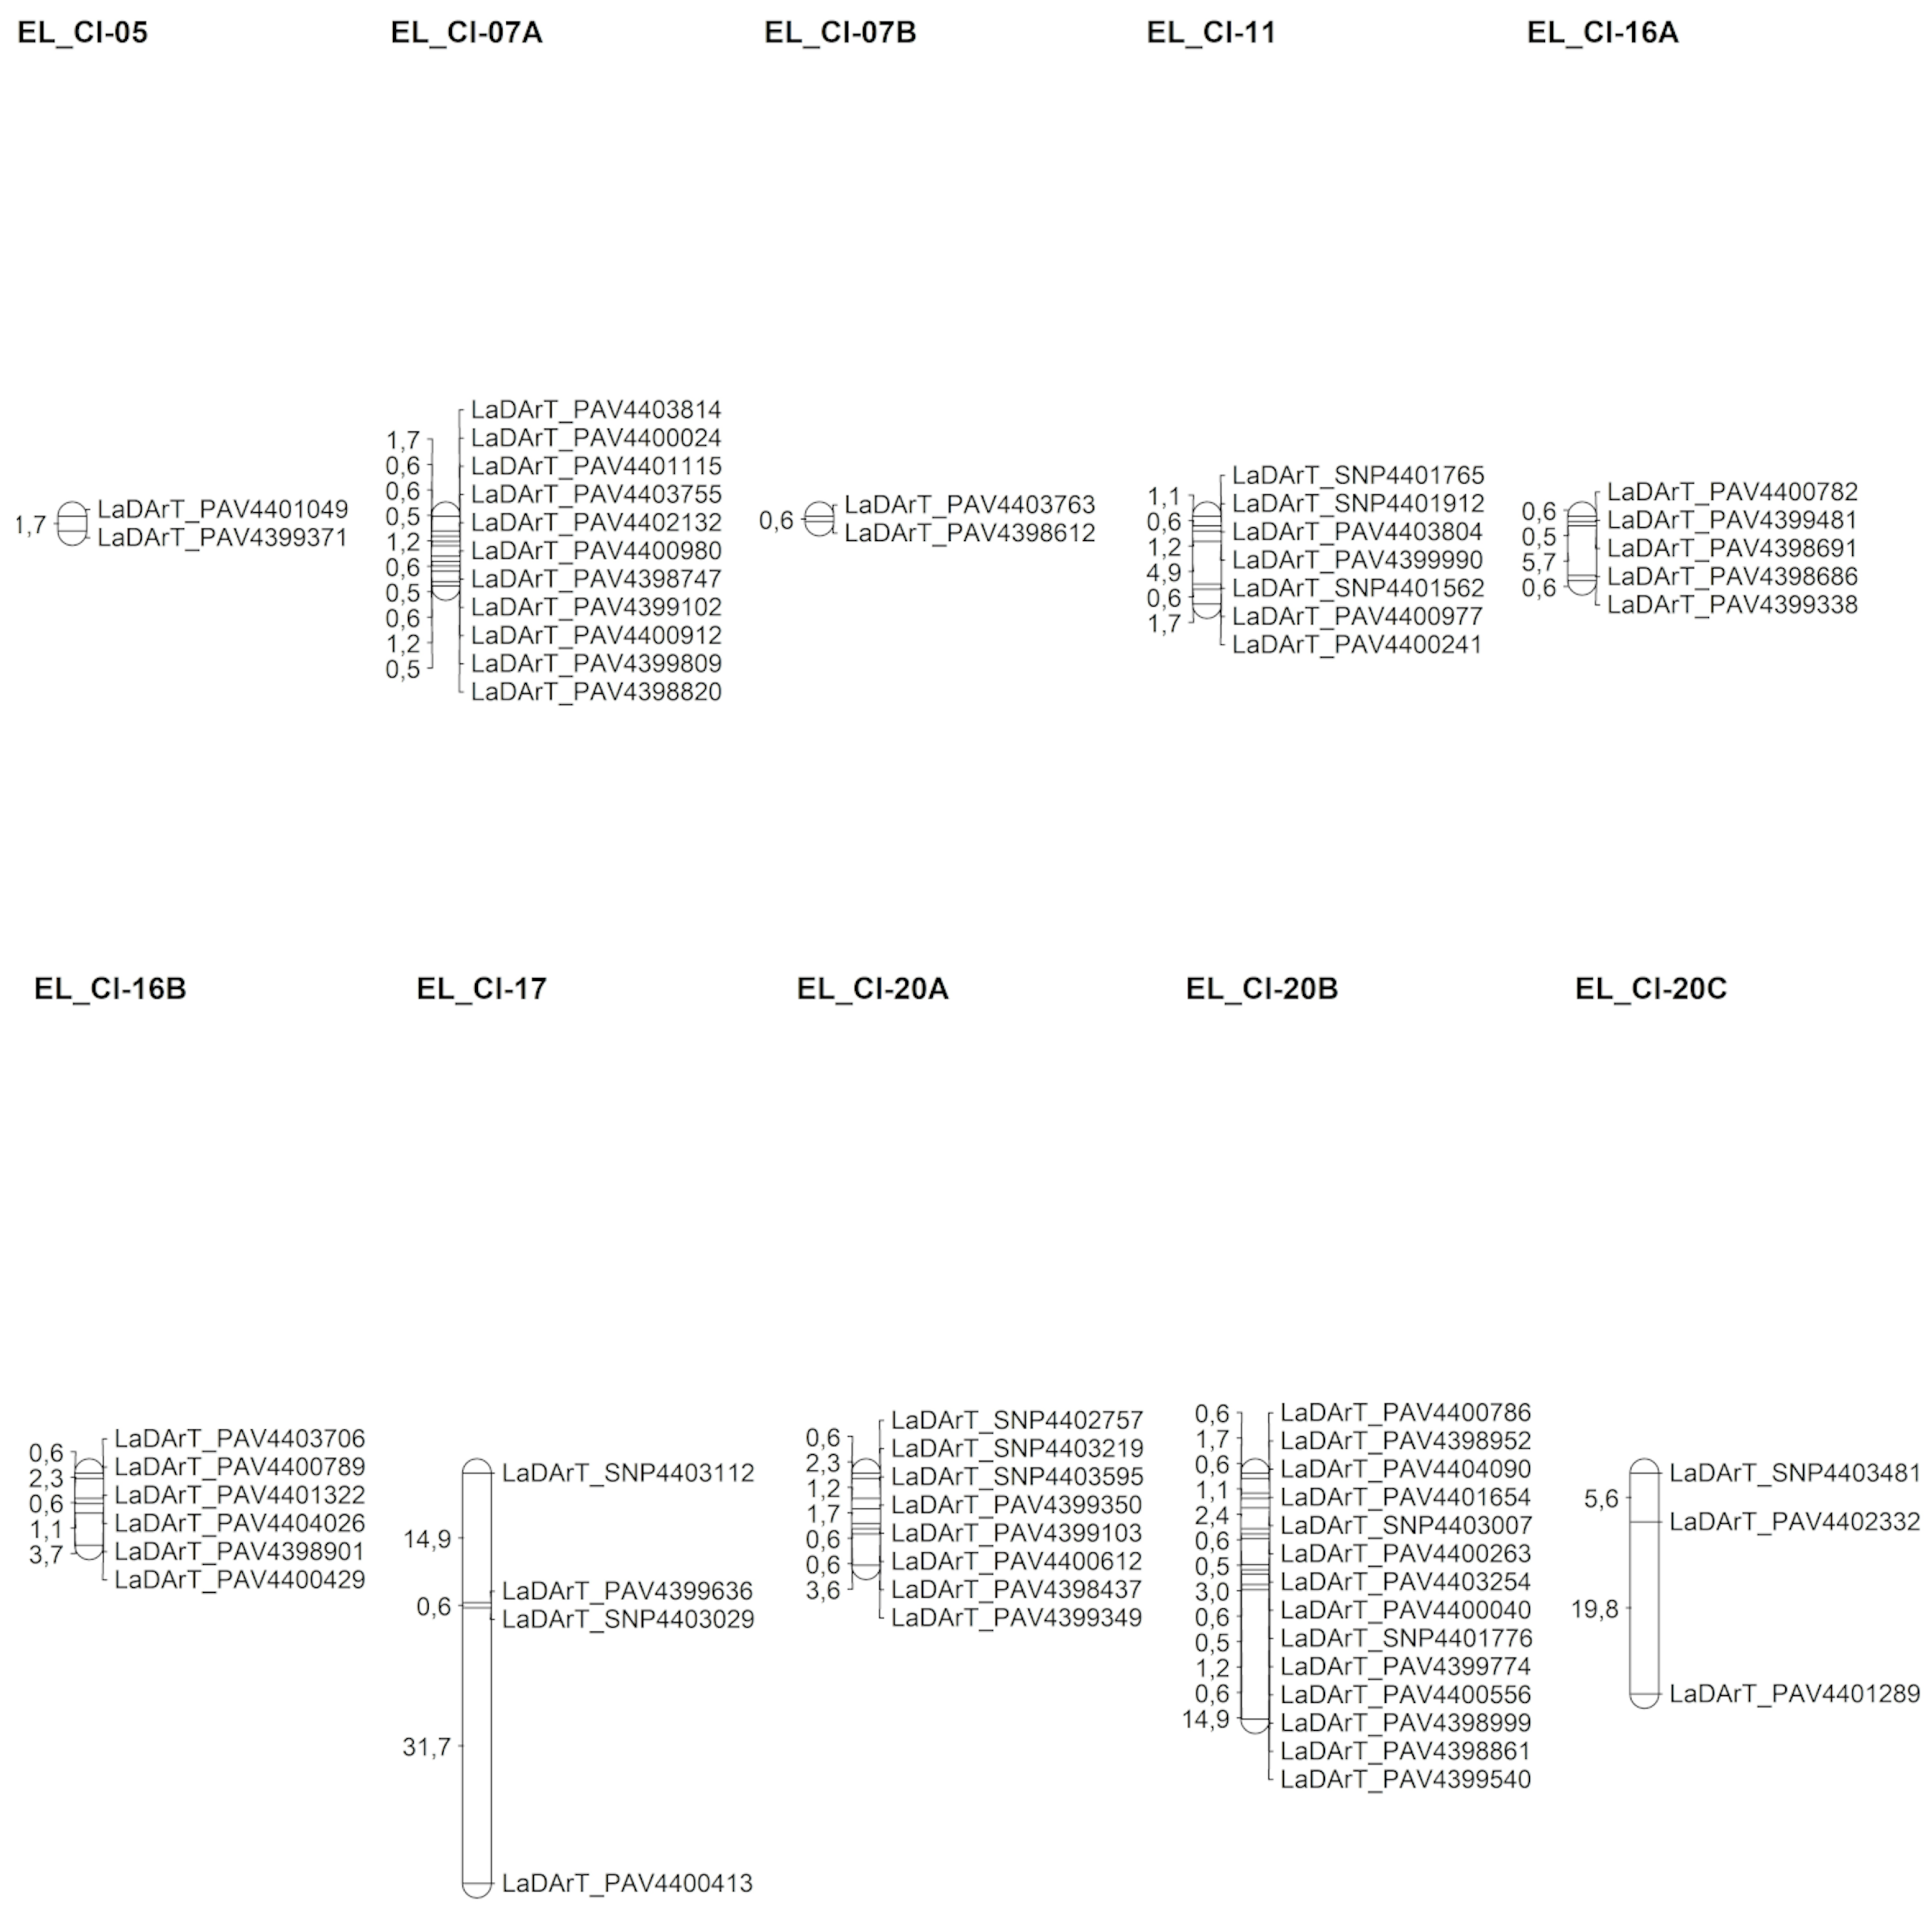
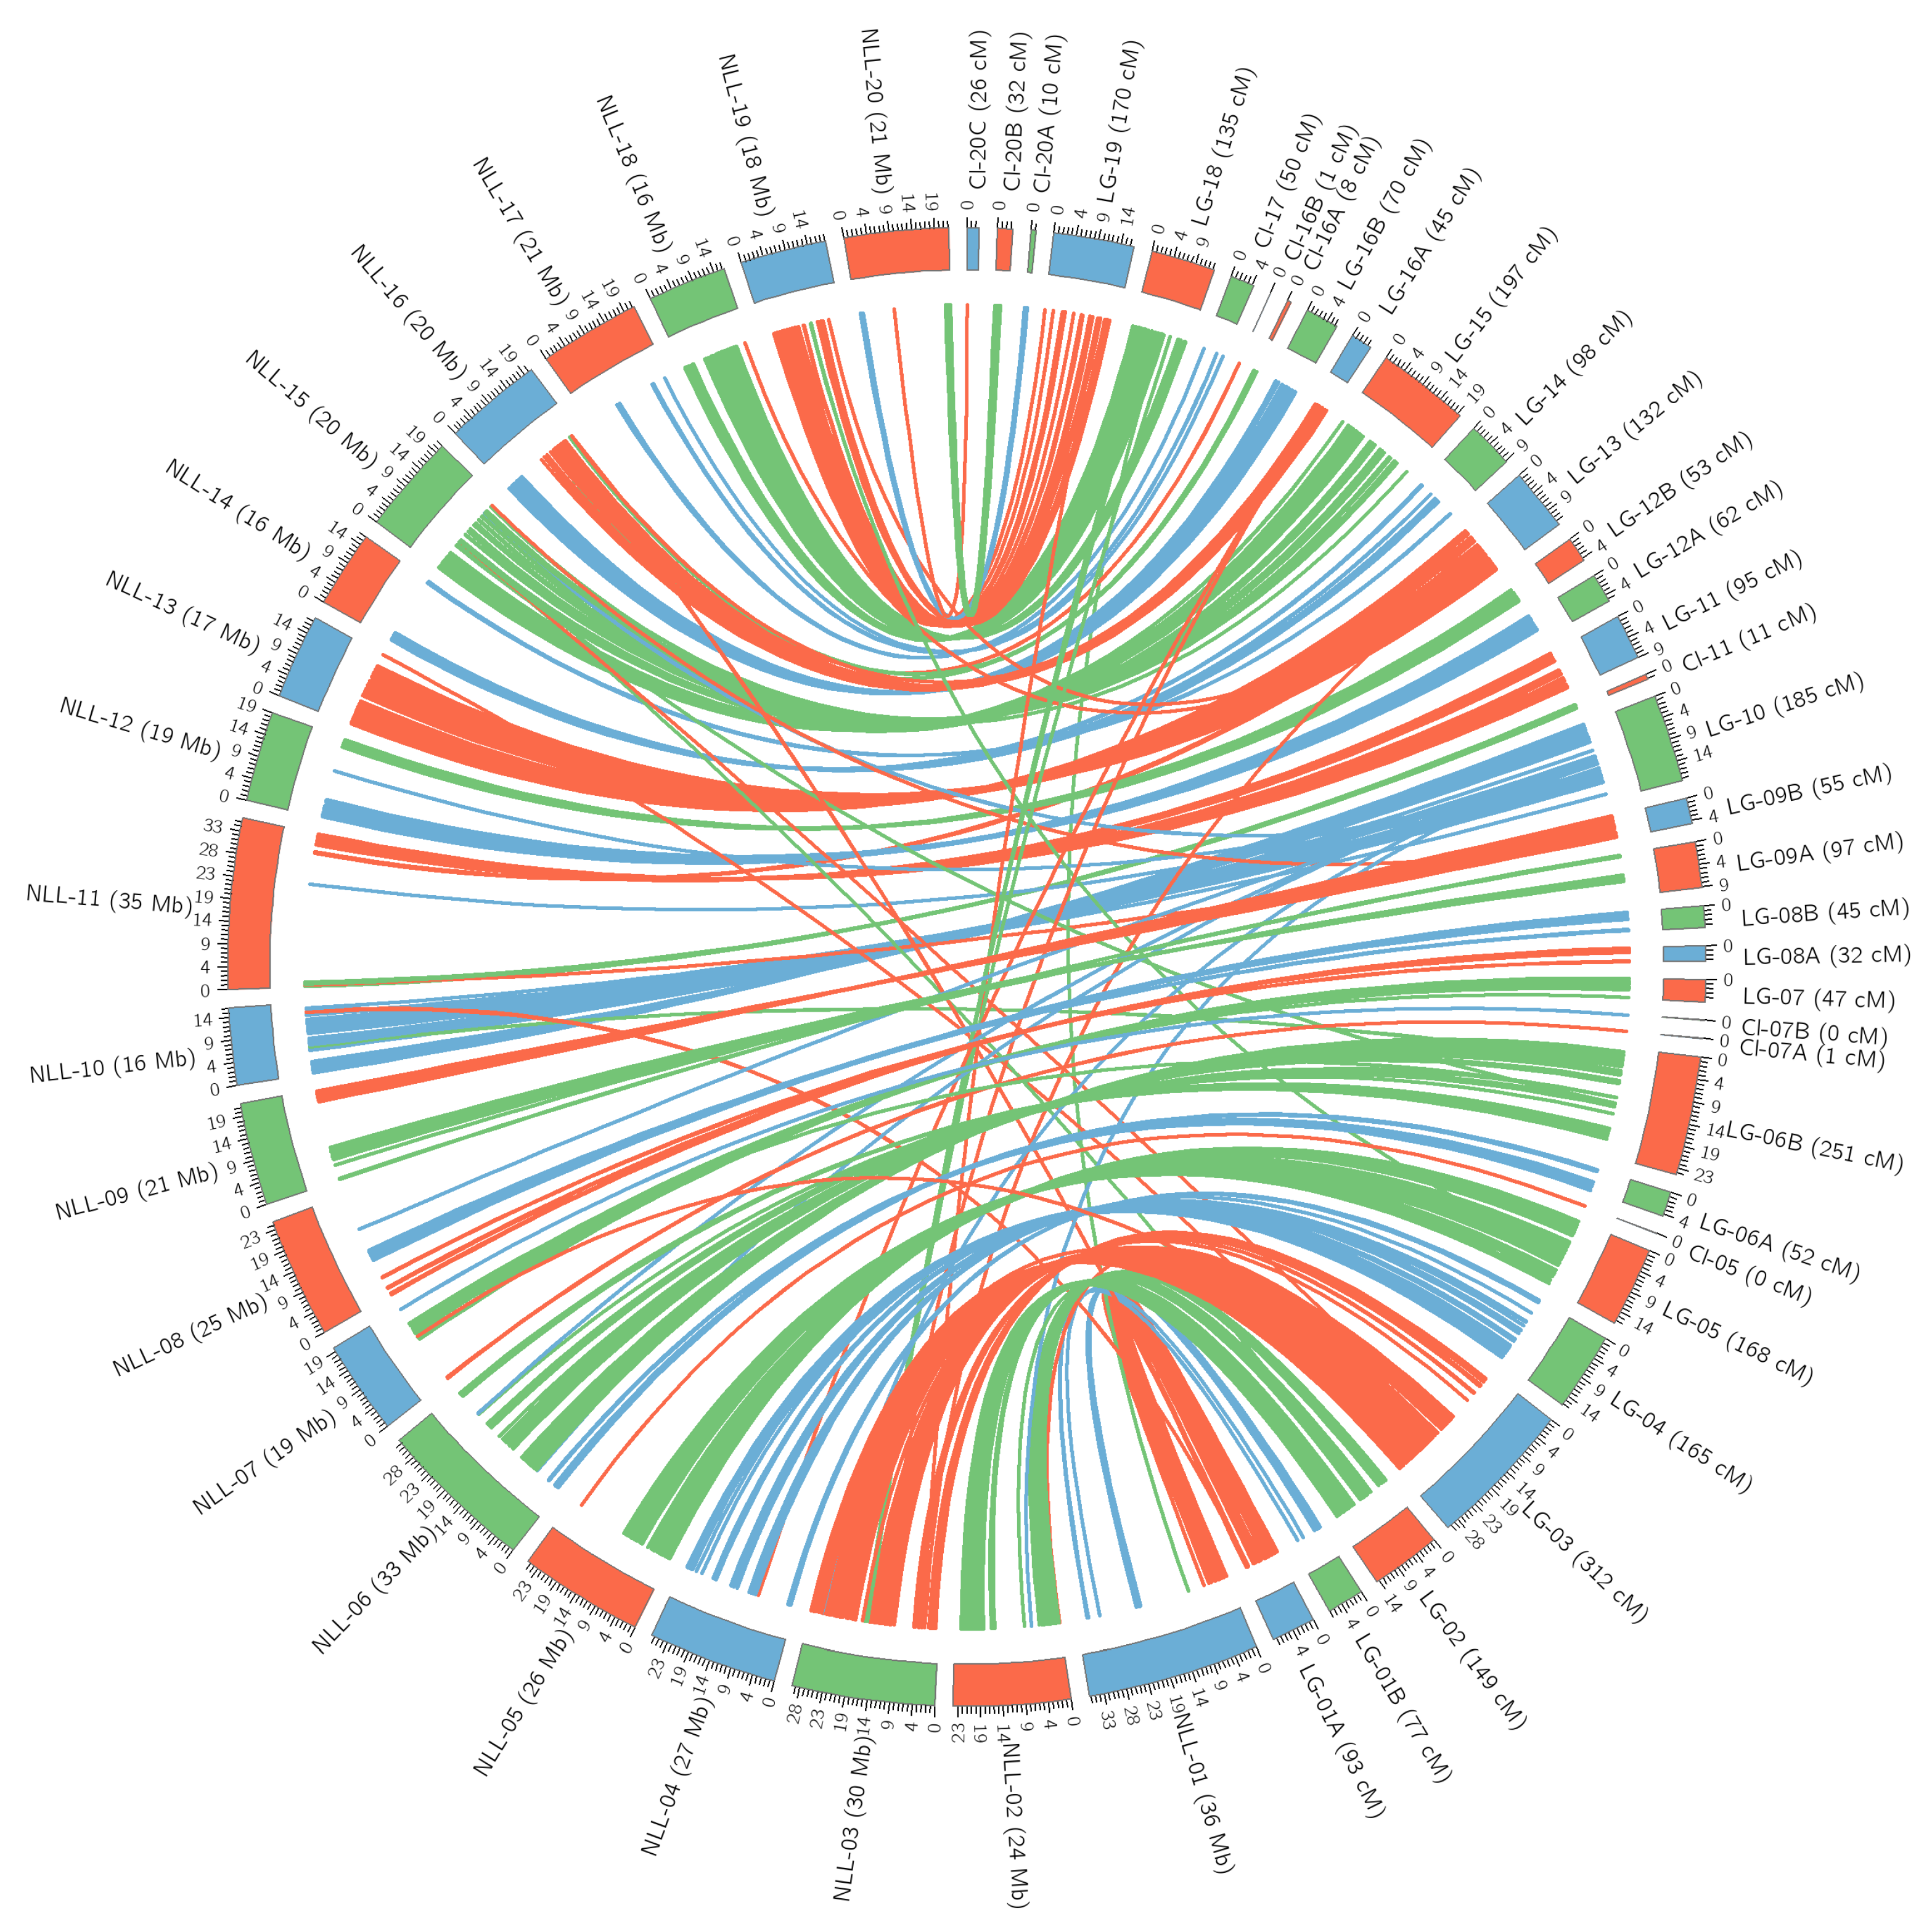
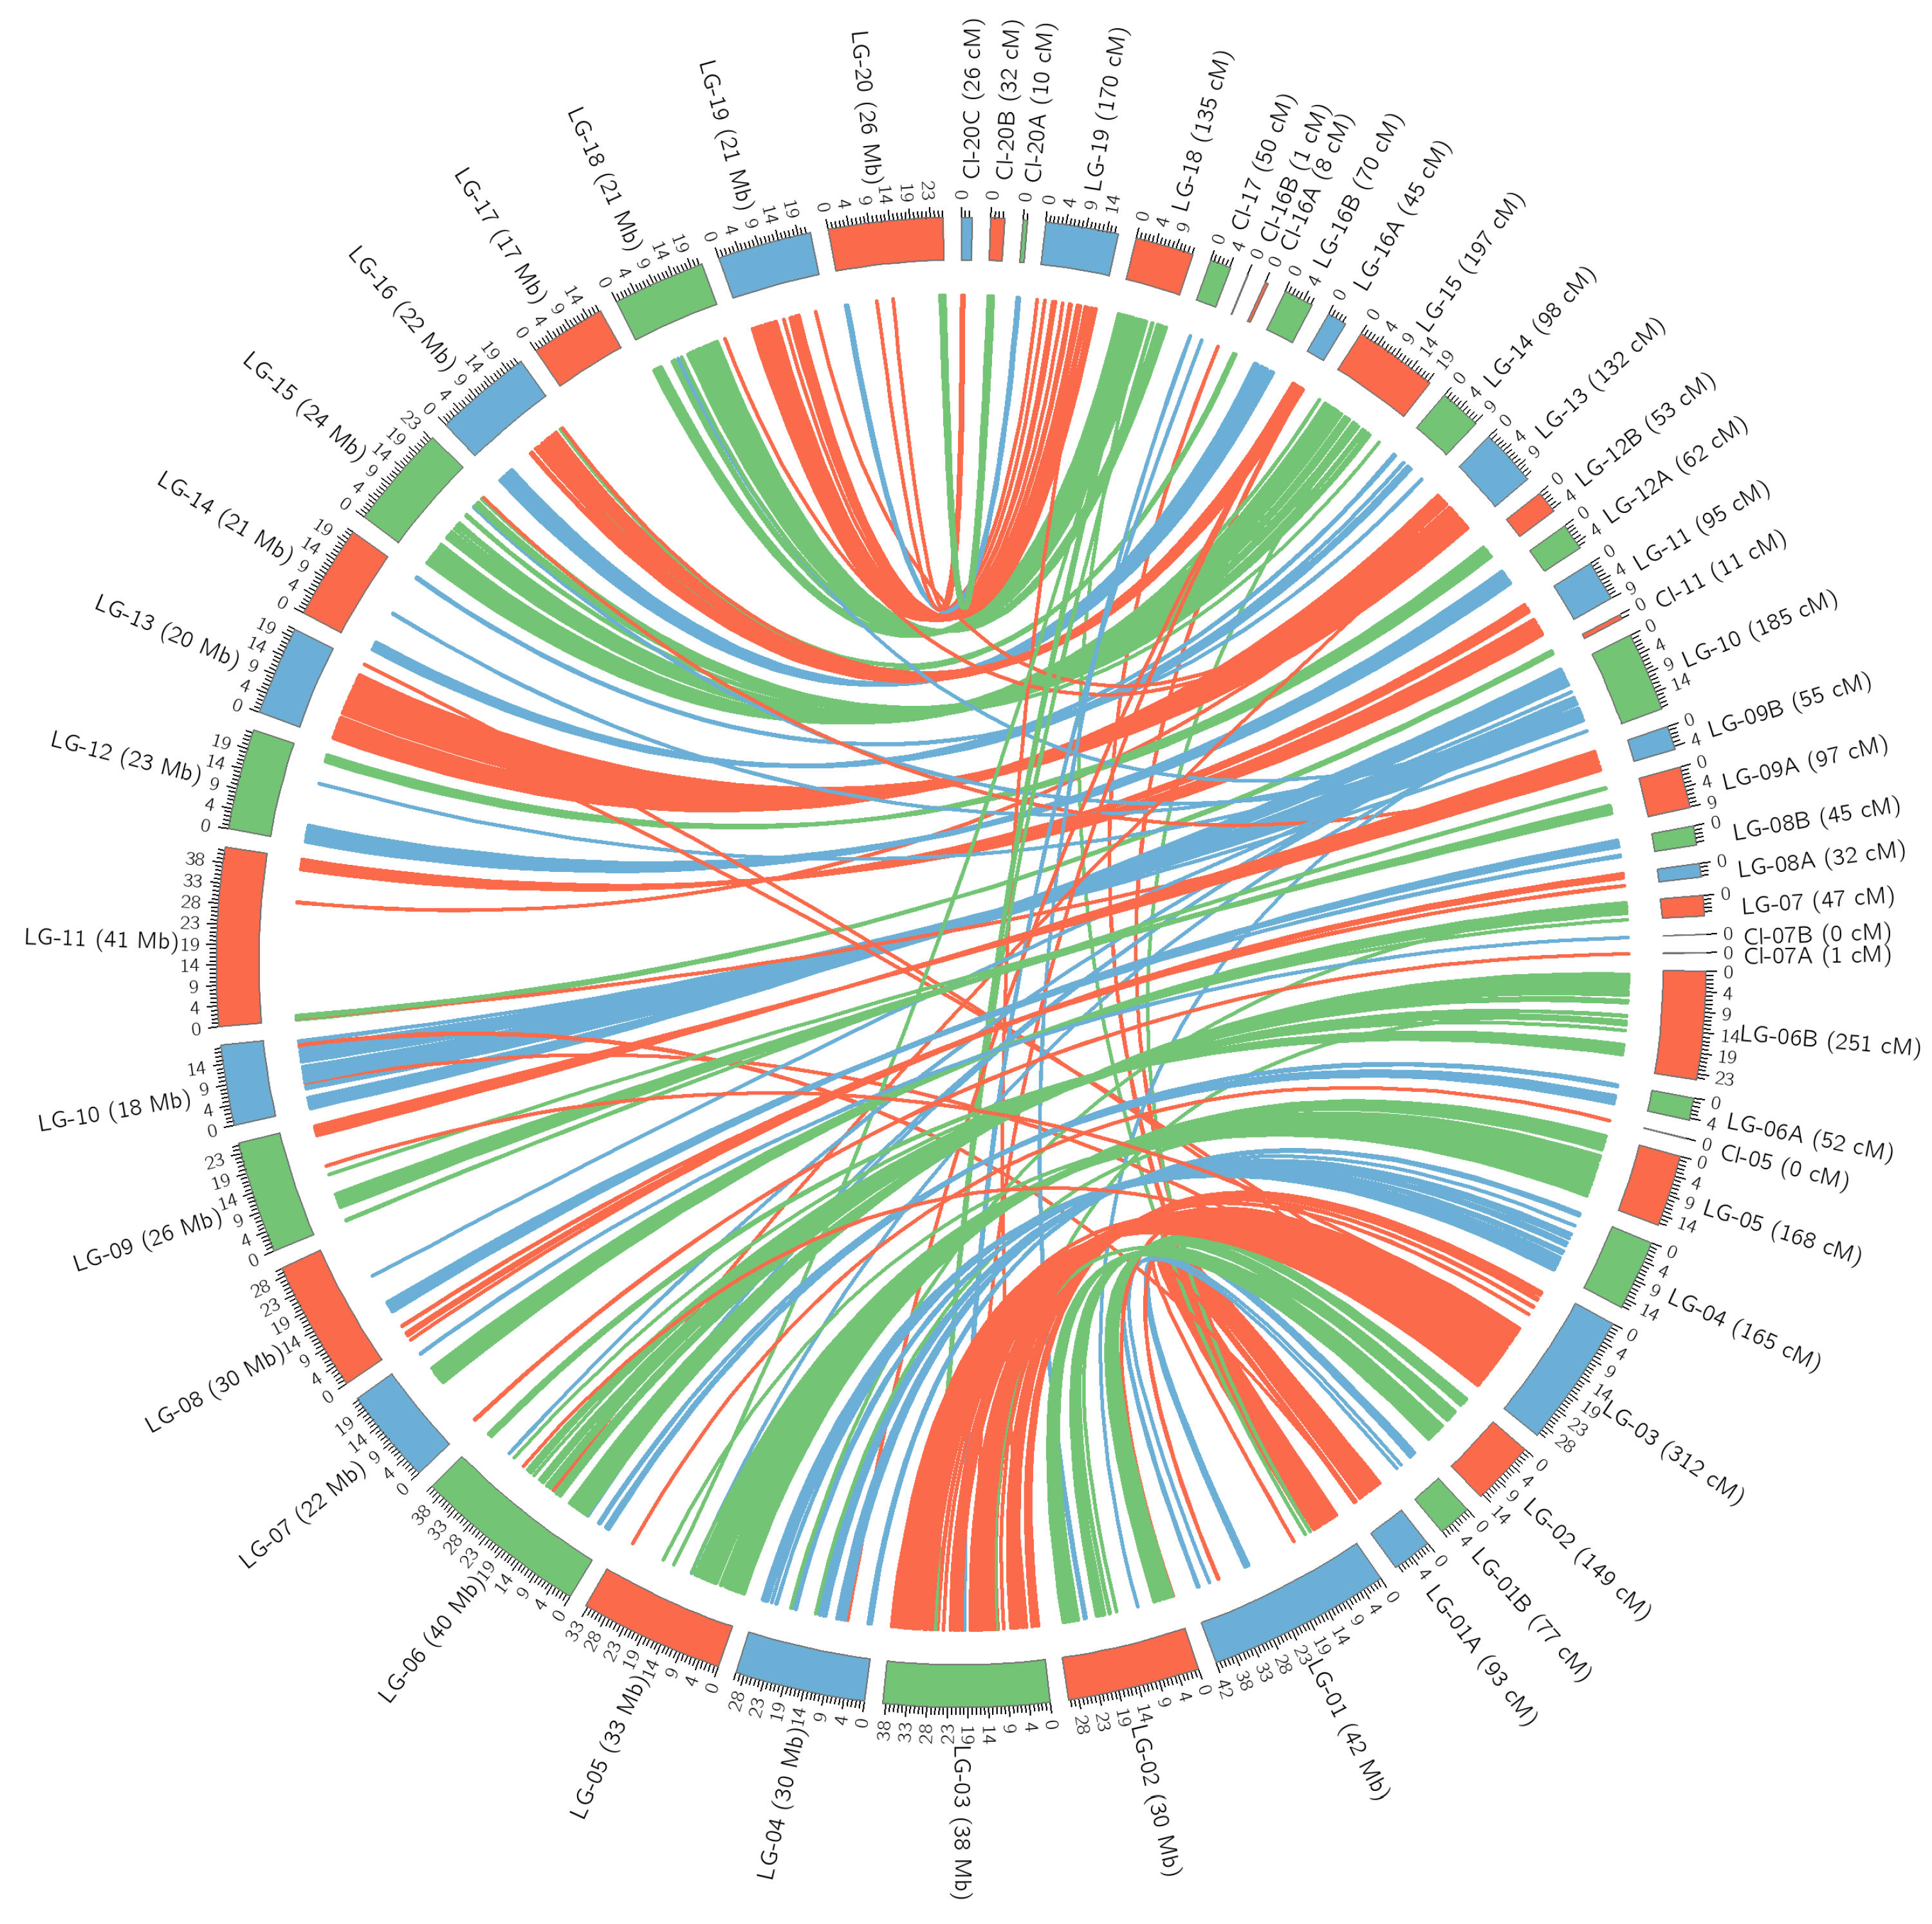
Results obtained during genotyping allowed us to construct a new draft of genetic map for narrow-leafed lupin. The map has 3042 cM and contains 4602 molecular markers and one morphological marker, with 1174 unique loci divided into 24 main linkage groups, and 10 clusters corresponding with 20 pseudo-chromosomes of narrow-leafed lupin (Figure 2, Figure 3, Figure 4 and Figure 5, Tables S6 and S7a,b). For the pseudo-chromosomes LG17 and LG20 only clusters were received (Cl_17, Cl_20A, Cl_20B, Cl_20C). Others pseudo-chromosomes related to one or two main linkage group. Additionally, one or two clusters were detected on pseudo-chromosomes LG05, LG07, LG11 and LG16 (Table 3). The 4602 markers placed on map were composed of 1720 DArT_SNP, 2852 DArT_PAV, 27 ISSR, 1 SNP and 2 morphological traits—type of growth and seed colour (Table S6). During the map construction process three lines with more than 60% of missing genotyping data were omitted. Highly distorted DArTseq markers were not used for map construction. Moreover, more than 30 ISSR, 20 SSR and 129 DArTseq markers are not linked to main linkage group or clusters.
DArTseq markers represent 99.4% of used markers. The longest group was EL_LG_03 with the length of 359.74 cM. It also contains the highest number of markers (505) and unique loci (145). The second longest group was EL_LG_06B _ 223.78 cM with 314 markers and 81 unique loci. The shortest group was EL_LG_8A (31,3 cM), with 12 unique loci and 57 markers (Table 3). The lowest percentage of unique loci was detected in EL_LG_06A linkage group—16.83% and the highest in EL_LG_12A—31.68%.
The average gap between two loci ranged between 1.76 cM for EL_LG_13 and 4.38 cM for group EL_LG_09A (Table 3). However, long gaps were observed on all linkage groups, and the longest was 29.82 cM on EL_LG_01B, EL_LG_14, and EL_LG_15.
The position of most markers in each group corresponds with the genomic sequence of pseudo-chromosome constructed for narrow-leafed lupin reference genome (Figure 4 and Figure 5, Figures S1 and S2. Only for clusters EL_Cl_05, Cl_16B EL_Cl_20C and group EL_LG_09B, EL_LG_16A weak correlation or lack of correlation between position of markers in constructed map and reference genome was observed (Table 4). The trait of type of growth was localised in EL_LG_06B group at position 168 cM, which corresponds with the position around 29,500,000–29,600,000 nt. pseudo-chromosome LG06. In this region several genes were detected. The most interesting of them is LOC09350801, which was reported by Książkiewicz et al. (2016) as LaTFL1a homologues of Arabidopsis thaliana—TERMINAL FLOWERING LOCUS 1 (TFL1). The trait of seed colour was mapped in cluster 20C. This localisation is consistent with results presented by Zhou et al. (2018) who placed this trait in chromosome 20.

3.4. Analysis of Unplaced Scaffolds from Reference Genome

The BLASTN search allowed 178 DArTseq markers to be linked with 136 unplaced markers obtained for narrow-leafed lupin [11], Table S8a. Out of those 136 unplaced scaffolds, 98 where then placed successfully on improved reference genome by Zhou et al. For 91 of those scaffold chromosomes localisation predicted by ExL map were the same as on the Zhou et al reference genome (Table S8c). The ExL map allowed to indicate localisation of 38 scaffold chromosomes which position is still unknown. The total length of those newly placed scaffold was 1,740,694 bp, which corresponds with 0.3% of the current length of pseudo-chromosomes for narrow leafed lupin [17]. In the total sequence 2265 DArTseq markers were detected in the narrow-leafed lupin ‘Tanjil’ genome.

3.5. Homology between DArTseq Markers and Model Legume Genes

The 1407 DArTseq markers show similarity to the 1162 CDS sequences available for narrow-leafed lupin [14,33]. 1154 of those markers were successfully placed on ExL map (Table S9a,b). Those CDS sequences correspond with various gene families and occupy all constructed linkage groups. The linkage group with highest number of identified CDS sequence (130) was longest group for ExL map—EL_LG_03.
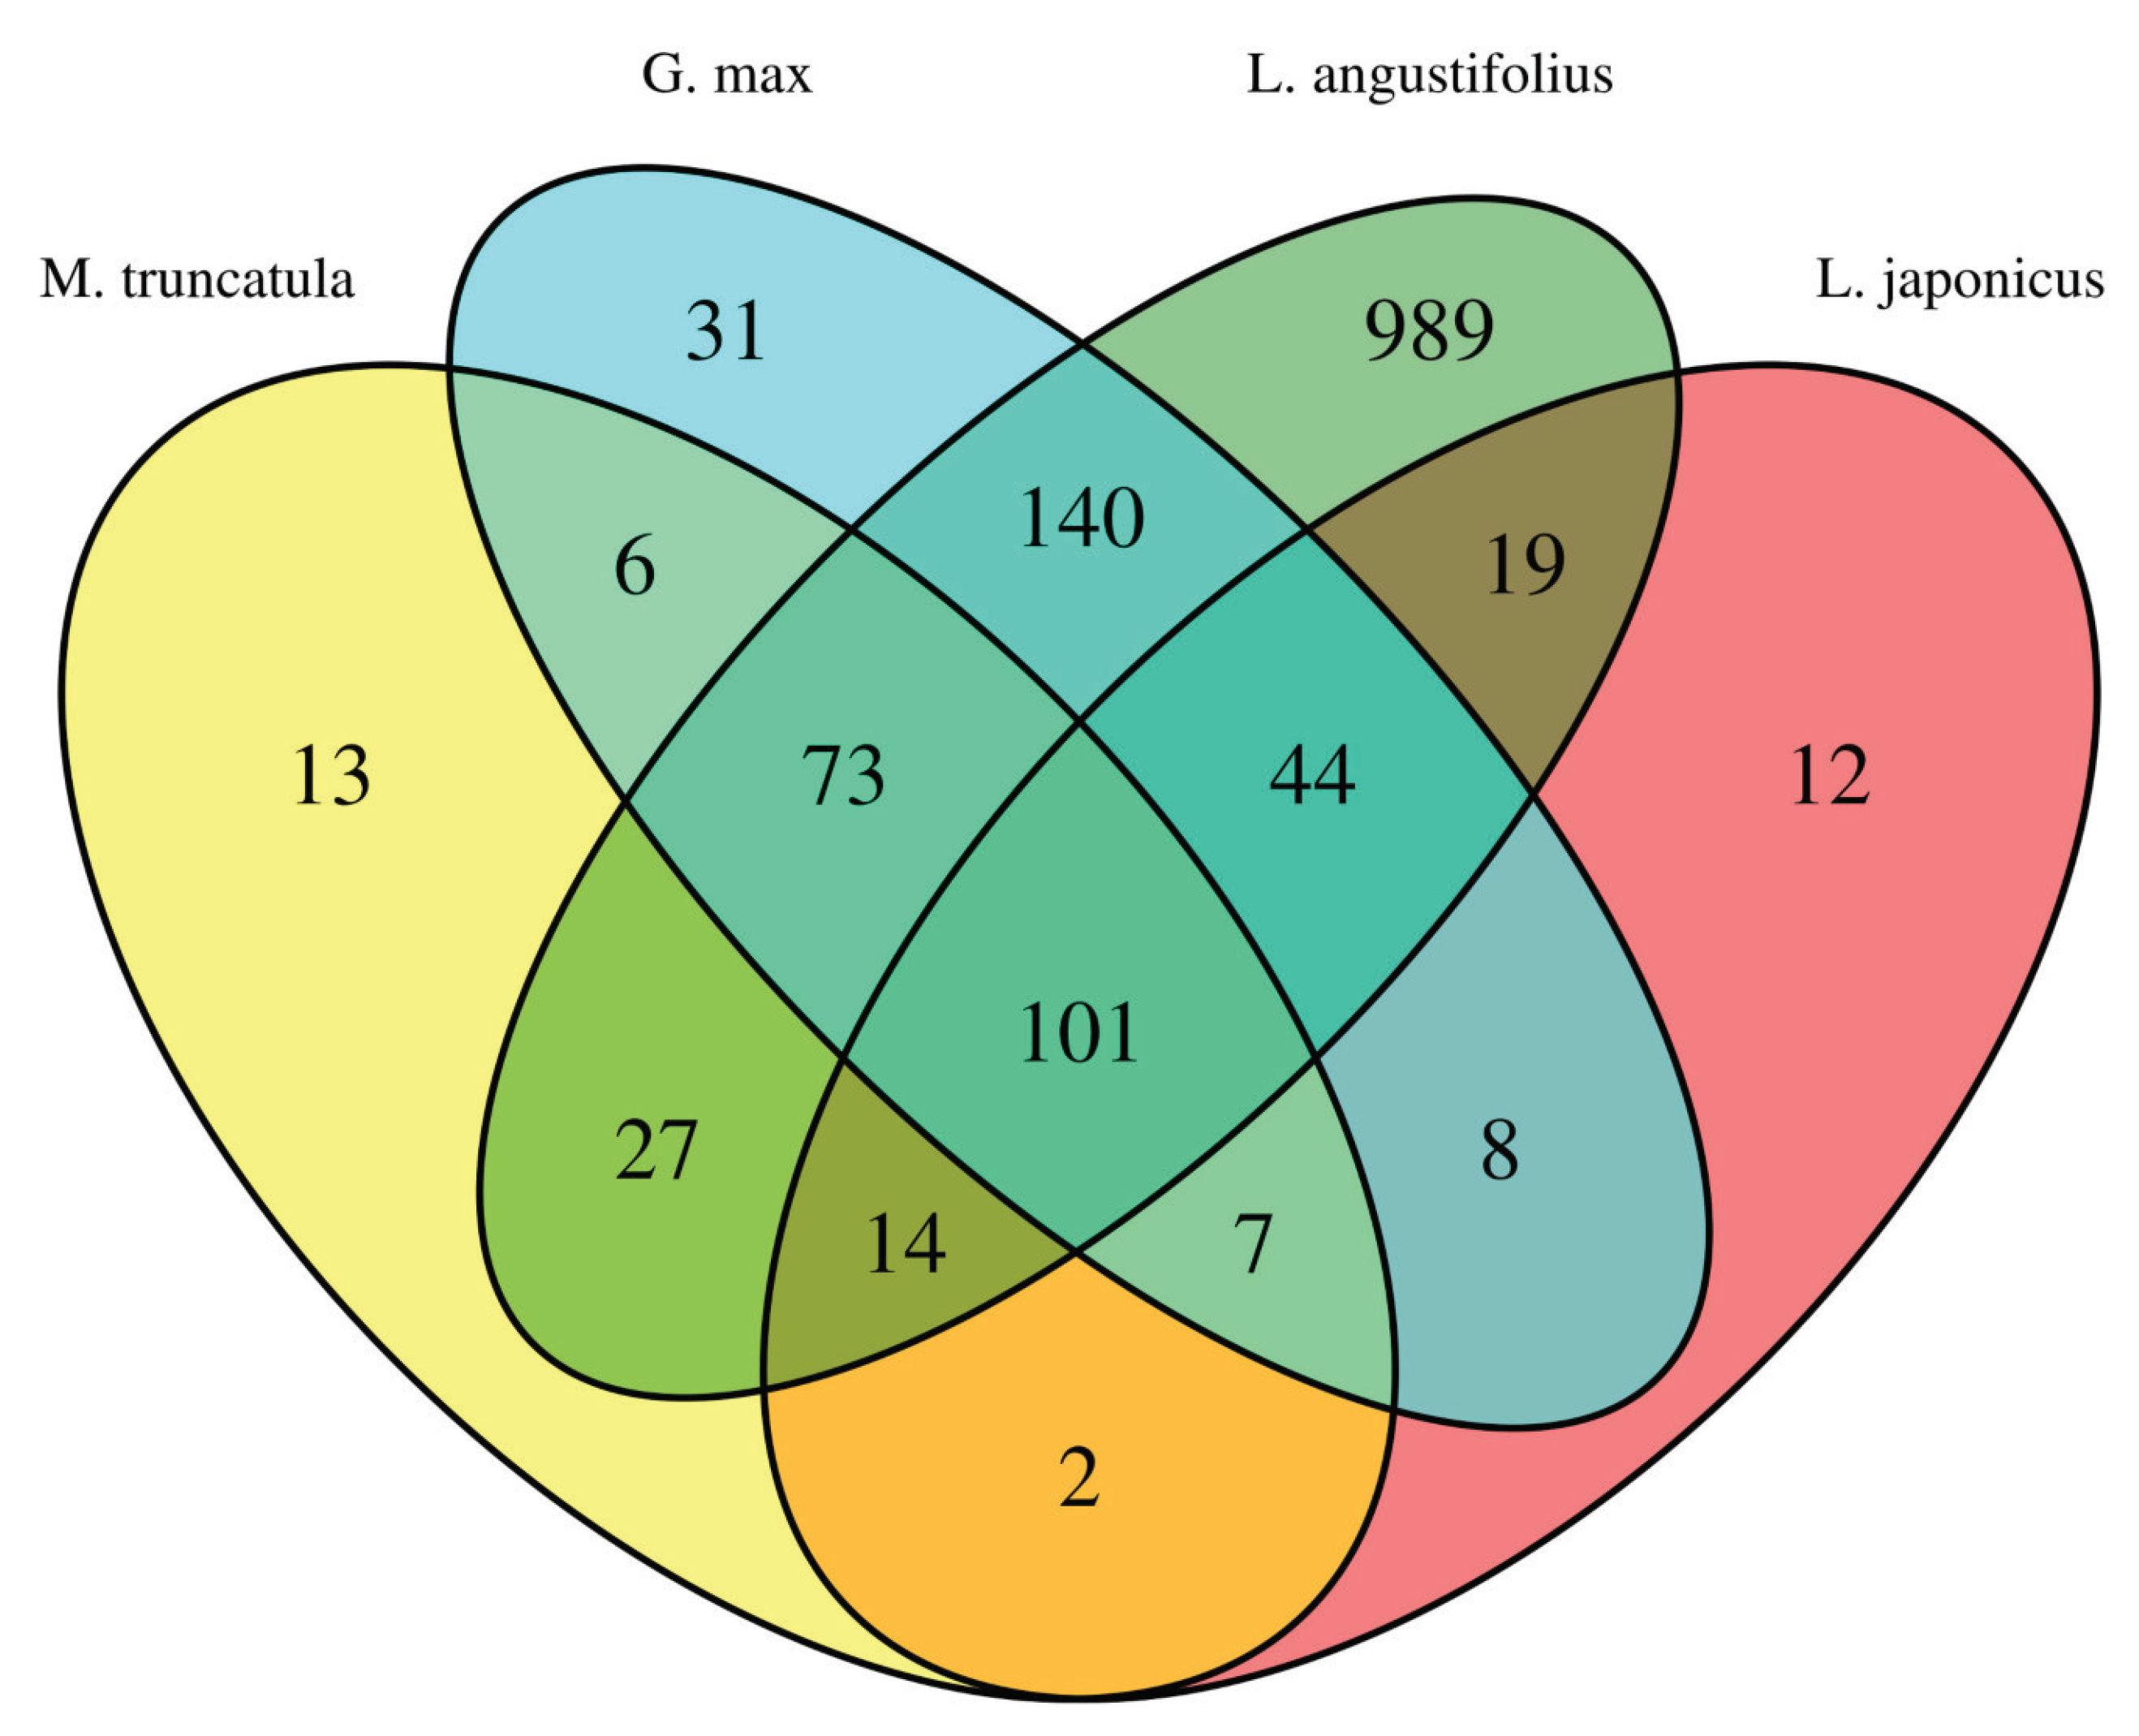
The BLASTN analysis shows the similarity between the sequences of DArTseq markers and genes of the model legume. The number of DArTseq markers similar to Glycine max genes equals 410 and it is the highest among all compared species. There were 243 genes sequences of Medicago truncatula similar to DArTseq markers, and 207 genes sequences of Lotus japonicus. Of those genes, 101 blasted markers were common among the four compared species (Figure 6, Tables S9b–S12).

4. Discussion

ISSR markers represent non_coding areas of the genome [34]. In the case of L. angustifolius such type of molecular system was important mostly in studies on the evaluation of genetic diversity in the collection [25]. However, that type of markers was also successfully used for map construction for other species [35,36,37]. In recent years we could observe a tendency to replace marker systems such as AFLP, ISSR and RAPD developed in the early 1990s with techniques using NGS for map construction [38]. However, our study shows that those marker systems, especially ISSR, still can be applied for map construction. The additional 27 ISSR markers added during the construction process were helpful while filling gaps between DArTseq markers. In seven linkage groups (EL_LG_03, EL_LG_06B, EL_LG_08B, EL_LG_11, EL_LG_12A, EL_LG_18, EL_LG_19) ISSR markers were placed into gaps (22–43 cM) between DArTseq markers (Table S6). They can be particularly useful for better coverage of DNA regions with low SNP density.
Genotyping by sequencing using DArTseq technology from DArT LTD was proved to be a successful method for generating high numbers of polymorphic and sequence-defined markers for narrow-leafed lupin. We were able to map 4572 DArTseq markers (2852 PAV and 1720 SNP). However, the number of DArTseq markers obtained for the DxW population [11] was two times more comparable to our results. Probably it resulted from the greater diversity between parental forms which were used for DxW population creation. Number of DArTseq markers obtained after genotyping other species with domestic parents for mapping population construction show similar numbers of PAV and SNP markers [27]. Our results suggest that out of those two types of DArTseq markers, SNP markers should be considered more reliable. This conclusion is supported by successfully mapped higher percentage of SNP markers (86%) compared to PAV (76%). By successfully mapped, we mean passing the quality control of segregation ratio test and linkage mapping. This difference can be explained by the nature of those type of markers. SNP markers are codominant and PAV are dominant [39].
DArTseq markers are very useful in map construction process and candidate gene identification, and were applied for sugarcane and wheat [40,41]. Enrichment of genetic maps with markers representing unique sequences in the genome that are additionally expressed is very useful, because it enables identifying and isolating important genes, and detecting quantitative loci and selective breeding material using marker-assisted selection (MAS) [42,43].
The number of genetic resources within Legume species have not been equally development. The level of knowledge is strongly related with economy importance and thus suitable applied molecular markers systems and deriving and available mapping populations. The breeding selection success depending on usefulness molecular markers linked with agronomic traits. The genetic background of favourable characters is determined by numerous genes and for this reason QTL regions need to be investigated using modern systems which lead to limited cost and time during realised new cultivars. For the species such as chickpea (Cicer arietinum L.), lotus (Lotus japonicus L.), barrel medic (Medicago truncatula Gaertn.), faba bean (Vicia faba L.), field pea (Pisum sativum L.), red clover (Trifolium pretense L.), peanut (Arachis hypogaea L.), common bean (Phaseolus vulgaris L.) and white clover (Trifolium repens L.) and especially soybean (Glicyne max L.) the number of investigated mapping populations and identified QTL markers are significant and still upgraded. As the results of propriety choice of parental forms were generated numerous QTLs linkage with phenological, morphological, quality characters as well as resistance to biotic and abiotic stresses [44,45,46,47]. Much less advanced researches on identifying QTL and creating genetic maps are reported in genus Lupinus. Recently, the first map has been generated for yellow lupine [22], previously for white lupine [48] and two for narrow-leafed lupine [11,17]. In recent years we have observed significant interest in recognizing of the genomes of these species. Undertaking research on the sequencing of the narrow-leafed lupine genome is the best proof of this. Better understanding of the genomic background contribute to the progress of breeding work. The commencement of work by our team on obtaining a new mapping population by choosing the appropriate parental forms allowed for a preliminary recognition of a genetic background different from the Australian (so far best described) narrow-leafed genus.
We developed a high-density genetic map for a new inbred line population of narrow-leafed lupin. This newly created RILs population possess differ genetic background than the ones we have been exploring so far. Moreover, this population originated from domesticated genotypes which will allow development of markers for significant agronomic features. The number of mapping populations available for Lupinus angustifolius is limited to two and only one was created using cultivated parental genotype. For further genetic and breeding work that is carried out for this species, it is vital to generate new mapping populations that will have contrasting qualitative and quantitative traits. An important aspect of the research will be the possibility of expanding the work on associative and consensus mapping [17]. Furthermore, comparing the marker sequence with the genomic sequence of narrow-leafed lupin [11] allowed each obtained group or cluster to be linked with lupin pseudo-chromosomes. Our map, compared to other maps published for this species is the longest. The newest version [17] of consensus map developed for the DxW and TxU population has a length of 2399 cM, whereas our map is 3042 cM long, which is almost 1.3 times more than the consensus map. Our conclusions on localisation of unplaced scaffolds (on Hane et al. genome assembly) are convergent with genome position reported by Zhou et al. What’s more our map allows to place 38 new scaffolds that are still unplaced. This discovery could lead to improvement of genome assembly in the future. This improvement should also allow our knowledge about the narrow-leafed lupin genome to be broadened. Additional trait type of growth was localised on our map. Its localisation was close to LaDArT_PAV4403912 and LaDArT_SNP4402105 markers. Moreover, BLASN search of this region of genome allows identification of gene LOC09350801 homologues of Arabidopsis thaliana TFL1. This indicates that despite huge gaps and lack of representation, some parts of genomes on our map still can be useful tools in GWA and MAS.
As mentioned above, DArTseq markers have a tendency to occupy gene-rich regions [42]. Our comparative analysis between DArTseq marker sequences and narrow-leafed CDS sequences has shown that around 25% of obtained markers are related to coding DNA.

5. Conclusions

The developed high-density linkage map of a new recombinant inbred line population for narrow-leafed lupin provides useful tools for molecular breeding, especially for QTL, MAS, and WGS analysis.
We proved that ISSR markers can be used for covering gaps between DArTseq markers. Our map is built mostly of DArTseq markers, generated using NGS genotyping by sequencing technologies. DArTseq markers are sequence-defined which allows us to compare our map with reference genome data available for narrow-leafed lupin. We were able to link all obtained groups with pseudo-chromosomes.
Over 90% of the localized scaffolds had the same position as indicated in Zhou’s reports [17]. Furthermore, we have placed 38 new, additional scaffolds that were not assembled in the available reference genome version. These findings can be used for improving narrow-leafed pseudo-chromosomes sequence.
Our map, compared to other maps available for this species, shows a big gap mainly in the centromere region. For this reason, it is still necessary to use other marker systems to fill these gaps. Our newly developed population of inbred lines has a different genetic background compared to two other existing RIL populations for this species, which opens up new opportunities for genetic research and breeding purposes.
The set of SNP markers developed in our study can be use full for future GWAS investigation in narrow-leafed lupin. The advantages compare to the Australian SNP data-pool is that they covering different genetic background.

Supplementary Materials

The following are available online at https://www.mdpi.com/2073-4395/9/10/653/s1, Table S1: Sequence of ISSR primers with amplification temperature used in study, Table S2: Sequence of SSR primers with amplification temperature used in study, Table S3: χ 2 test distribution for ISSR markers obtained in genotyping ExL population, Table S4: Sequences of DArTseq PAV markers, Table S5: Sequences of DArTseq SNP markers, Table S6: Genetic linkage map for ExL population, Table S7: Comparison of ExL genetic map to narrow-leafed pseudo-chromosomes genome sequence (http://www.lupinexpress.org/) using BLASTN search, Table S8a: Comparison of ExL genetic map to narrow-leafed unplaced scaffold sequence (http://www.lupinexpress.org/) using BLASTN search, Table S8b: Genetic map localisation of unplaced scaffold, Table S8c Compare pseudochromosome/linkage group localisation of scaffold [17] using BLASTN search, Table S9a: Comparison of ExL genetic map to narrow_leafed CDS sequence (http://www.lupinexpress.org/) using BLASTN search, Table S9b: BLASTN search results for DArTseq markers against narrow_leafed CDS sequence (http://www.lupinexpress.org/), Table S10: BLASTN search results for DArTseq markers against Glycine max CDS sequence (http://www.plantgdb.org/GmGDB/), Table S11: BLASTN search results for DArTseq markers against Lotus japonicus CDS sequence (http://www.plantgdb.org/LjGDB/), Table S12: BLASTN search results for DArTseq markers against Medicago truncatula CDS sequence (http://www.plantgdb.org/LjGDB/MtGDB/), Figure S1: Correlation between DArTseq marker position in genetic linkgae maps EL_LG and reference genome NLL [11], Na—correlation could not be calculated, Figure S2: Correlation between DArTseq marker position in genetic linkgae maps EL_LG and reference genome NLL [17], Na—correlation could not be calculated.

Author Contributions

Conceptualization, B.K., R.G. and E.S.-S.; methodology, B.K. and R.G.; formal analysis, B.K. and D.Z.; investigation, B.K.; resources, R.G.; writing—original draft preparation, B.K. and R.G.; writing—review and editing, B.K. and R.G.; visualization, B.K.; supervision, R.G. and E.S.-S; project administration, E.S.-S.

Funding

This research received no external funding.

Conflicts of Interest

The authors declare no conflict of interest.

References

  1. Lucas, M.M.; Stoddard, F.L.; Annicchiarico, P.; Frias, J.; Martinez-Villaluenga, C.; Sussmann, D.; Duranti, M.; Seger, A.; Zander, P.M.; Pueyo, J.J. The future of lupin as a protein crop in Europe. Front. Plant Sci. 2015, 6, 705. [Google Scholar] [CrossRef]
  2. Legocki, A.; Bothe, H.; Pühler, A. Biological Fixation of Nitrogen for Ecology and Sustainable Agriculture; Springer Science & Business Media: Berlin, Germany, 2013; Volume 39. [Google Scholar]
  3. Lee, Y.P.; Mori, T.A.; Sipsas, S.; Barden, A.; Puddey, I.B.; Burke, V.; Hall, R.S.; Hodgson, J.M. Lupin-enriched bread increases satiety and reduces energy intake acutely. Am. J. Clin. Nutr. 2006, 84, 975–980. [Google Scholar] [CrossRef] [PubMed] [Green Version]
  4. Hall, R.S.; Thomas, S.J.; Johnson, S.K. Australian sweet lupin flour addition reduces the glycaemic index of a white bread breakfast without affecting palatability in healthy human volunteers. Asia Pac. J. Clin. Nutr. 2005, 14, 91. [Google Scholar] [PubMed]
  5. Hayashi, M.; Miyahara, A.; Sato, S.; Kato, T.; Yoshikawa, M.; Taketa, M.; Hayashi, M.; Pedrosa, A.; Onda, R.; Imaizumi-Anraku, H.; et al. Construction of a genetic linkage map of the model legume Lotus japonicus using an intraspecific F2 population. DNA Res. 2001, 8, 301–310. [Google Scholar] [CrossRef] [PubMed]
  6. Sato, S.; Nakamura, Y.; Kaneko, T.; Asamizu, E.; Kato, T.; Nakao, M.; Sasamoto, S.; Watanabe, A.; Ono, A.; Kawashima, K.; et al. Genome structure of the legume, Lotus japonicus. DNA Res. 2008, 15, 227–239. [Google Scholar] [CrossRef]
  7. Choi, H.K.; Kim, D.; Uhm, T.; Limpens, E.; Lim, H.; Mun, J.H.; Kalo, P.; Penmetsa, R.V.; Seres, A.; Kulikova, O.; et al. A sequence-based genetic map of Medicago truncatula and comparison of marker colinearity with M. sativa. Genetics 2004, 166, 1463–1502. [Google Scholar] [CrossRef]
  8. Branca, A.; Paape, T.D.; Zhou, P.; Briskine, R.; Farmer, A.D.; Mudge, J.; Bharti, A.K.; Woodward, J.E.; May, G.D.; Gentzbittel, L.; et al. Whole-genome nucleotide diversity, recombination, and linkage disequilibrium in the model legume Medicago truncatula. Proc. Natl. Acad. Sci. USA 2011, 108, E864–E870. [Google Scholar] [CrossRef]
  9. Lark, K.; Weisemann, J.; Matthews, B.; Palmer, R.; Chase, K.; Macalma, T. A genetic map of soybean (Glycine max L.) using an intraspecific cross of two cultivars:‘Minosy’and ‘Noir 1’. Theor. Appl. Genet. 1993, 86, 901–906. [Google Scholar] [CrossRef]
  10. Schmutz, J.; Cannon, S.B.; Schlueter, J.; Ma, J.; Mitros, T.; Nelson, W.; Hyten, D.L.; Song, Q.; Thelen, J.J.; Cheng, J.; et al. Genome sequence of the palaeopolyploid soybean. Nature 2010, 463, 178. [Google Scholar] [CrossRef]
  11. Hane, J.K.; Ming, Y.; Kamphuis, L.G.; Nelson, M.N.; Garg, G.; Atkins, C.A.; Bayer, P.E.; Bravo, A.; Bringans, S.; Cannon, S.; et al. A comprehensive draft genome sequence for lupin (Lupinus angustifolius), an emerging health food: Insights into plant–microbe interactions and legume evolution. Plant Biotechnol. J. 2017, 15, 318–330. [Google Scholar] [CrossRef]
  12. Boersma, J.G.; Pallotta, M.; Li, C.; Buirchell, B.J.; Sivasithamparam, K.; Yang, H. Construction of a genetic linkage map using MFLP and identification of molecular markers linked to domestication genes in narrow-leafed lupin (Lupinus angustifolius L.). Cell. Mol. Biol. Lett. 2005, 10, 331–344. [Google Scholar] [PubMed]
  13. Nelson, M.N.; Phan, H.T.; Ellwood, S.R.; Moolhuijzen, P.M.; Hane, J.; Williams, A.; Clare, E.; Fosu-Nyarko, J.; Scobie, M.; Cakir, M.; et al. The first gene-based map of Lupinus angustifolius L.-location of domestication genes and conserved synteny with Medicago truncatula. Theor. Appl. Genet. 2006, 113, 225–238. [Google Scholar] [CrossRef] [PubMed]
  14. Nelson, M.N.; Moolhuijzen, P.M.; Boersma, J.G.; Chudy, M.; Lesniewska, K.; Bellgard, M.; Oliver, R.P.; Święcicki, W.; Wolko, B.; Cowling, W.A.; et al. Aligning a new reference genetic map of Lupinus angustifolius with the genome sequence of the model legume, Lotus japonicus. DNA Res. 2010, 17, 73–83. [Google Scholar] [CrossRef] [PubMed]
  15. Kroc, M.; Koczyk, G.; Święcicki, W.; Kilian, A.; Nelson, M.N. New evidence of ancestral polyploidy in the Genistoid legume Lupinus angustifolius L.(narrow-leafed lupin). Theor. Appl. Genet. 2014, 127, 1237–1249. [Google Scholar] [CrossRef] [PubMed]
  16. Yang, H.; Tao, Y.; Zheng, Z.; Zhang, Q.; Zhou, G.; Sweetingham, M.W.; Howieson, J.G.; Li, C. Draft genome sequence, and a sequence-defined genetic linkage map of the legume crop species Lupinus angustifolius L. PLoS ONE 2013, 8, e64799. [Google Scholar] [CrossRef] [PubMed]
  17. Zhou, G.; Jian, J.; Wang, P.; Li, C.; Tao, Y.; Li, X.; Renshaw, D.; Clements, J.; Sweetingham, M.; Yang, H. Construction of an ultra-high density consensus genetic map, and enhancement of the physical map from genome sequencing in Lupinus angustifolius. Theor. Appl. Genet. 2018, 131, 209–223. [Google Scholar] [CrossRef]
  18. Von Mark, V.C.; Kilian, A.; Dierig, D.A. Development of DArT marker platforms and genetic diversity assessment of the US collection of the new oilseed crop lesquerella and related species. PLoS ONE 2013, 8, e64062. [Google Scholar]
  19. Zou, J.; Raman, H.; Guo, S.; Hu, D.; Wei, Z.; Luo, Z.; Long, Y.; Shi, W.; Fu, Z.; Du, D.; et al. Constructing a dense genetic linkage map and mapping QTL for the traits of flower development in Brassica carinata. Theor. Appl. Genet. 2014, 127, 1593–1605. [Google Scholar] [CrossRef]
  20. Sánchez-Sevilla, J.F.; Horvath, A.; Botella, M.A.; Gaston, A.; Folta, K.; Kilian, A.; Denoyes, B.; Amaya, I. Diversity Arrays Technology (DArT) marker platforms for diversity analysis and linkage mapping in a complex crop, the octoploid cultivated strawberry (Fragaria × ananassa). PLoS ONE 2015, 10, e0144960. [Google Scholar] [CrossRef]
  21. Ren, R.; Ray, R.; Li, P.; Xu, J.; Zhang, M.; Liu, G.; Yao, X.; Kilian, A.; Yang, X. Construction of a high-density DArTseq SNP-based genetic map and identification of genomic regions with segregation distortion in a genetic population derived from a cross between feral and cultivated-type watermelon. Mol. Genet. Genom. 2015, 290, 1457–1470. [Google Scholar] [CrossRef]
  22. Iqbal, M.M.; Huynh, M.; Udall, J.A.; Kilian, A.; Adhikari, K.N.; Berger, J.D.; Erskine, W.; Nelson, M.N. The first genetic map for yellow lupin enables genetic dissection of adaptation traits in an orphan grain legume crop. BMC Genet. 2019, 20, 1–13. [Google Scholar] [CrossRef] [PubMed] [Green Version]
  23. Galek, R. Studies on the Variability of Some Morphological and Functional Characters of Lupinus with Particular Consideration Intra and Interspecific Hybrids. Monografie (Poland) 2010, 1–122. [Google Scholar]
  24. Doyle, J. DNA protocols for plants Molecular techniques in taxonomy. NATO ASI Ser. 1991, 57, 283–293. [Google Scholar]
  25. Clements, J.; Galek, R.; Kozak, B.; Michalczyk, D.J.; Piotrowicz-Cieślak, A.I.; Sawicka-Sienkiewicz, E.; Stawiński, S.; Zalewski, D. Diversity of selected Lupinus angustifolius L. genotypes at the phenotypic and DNA level with respect to microscopic seed coat structure and thickness. PLoS ONE 2014, 9, e102874. [Google Scholar] [CrossRef]
  26. Kilian, A.; Wenzl, P.; Huttner, E.; Carling, J.; Xia, L.; Blois, H.; Caig, V.; Heller-Uszynska, K.; Jaccoud, D.; Hopper, C.; et al. Diversity arrays technology: A generic genome profiling technology on open platforms. In Data Production and Analysis in Population Genomics; Springer: Berlin/Heidelberg, Germany, 2012; pp. 67–89. [Google Scholar]
  27. Cichy, K.A.; Fernandez, A.; Kilian, A.; Kelly, J.D.; Galeano, C.H.; Shaw, S.; Brick, M.; Hodkinson, D.; Troxtell, E. QTL analysis of canning quality and color retention in black beans (Phaseolus vulgaris L.). Mol. Breed. 2014, 33, 139–154. [Google Scholar] [CrossRef]
  28. R Core Team. R: A Language and Environment for Statistical Computing; R Foundation for Statistical Computing: Vienna, Austria, 2016; Available online: http://www.R-project.org (accessed on 16 October 2019).
  29. Arends, D.; Prins, P.; Jansen, R.C.; Broman, K.W. R/qtl: High-throughput multiple QTL mapping. Bioinformatics 2010, 26, 2990–2992. [Google Scholar] [CrossRef]
  30. Taylor, J.; Butler, D. Package ASMap: Efficient Genetic Linkage Map Construction andDiagnosis. J. Stat. Softw. 2017, 79, 1–29. [Google Scholar] [CrossRef]
  31. Kosambi, D.D. The estimation of map distances from recombination values. In DD Kosambi; Springer: Berlin/Heidelberg, Germany, 2016; pp. 125–130. [Google Scholar]
  32. Voorrips, R. MapChart: Software for the graphical presentation of linkage maps and QTLs. J. Hered. 2002, 93, 77–78. [Google Scholar] [CrossRef]
  33. Krzywinski, M.; Schein, J.; Birol, I.; Connors, J.; Gascoyne, R.; Horsman, D.; Jones, S.J.; Marra, M.A. Circos: An information aesthetic for comparative genomics. Genome Res. 2009, 19, 1639–1645. [Google Scholar] [CrossRef] [Green Version]
  34. Qian, W.; Ge, S.; Hong, D.Y. Genetic variation within and among populations of a wild rice Oryza granulata from China detected by RAPD and ISSR markers. Theor. Appl. Genet. 2001, 102, 440–449. [Google Scholar] [CrossRef]
  35. Venkat, S.K.; Bommisetty, P.; Patil, M.S.; Reddy, L.; Chennareddy, A. The genetic linkage maps of Anthurium species based on RAPD, ISSR and SRAP markers. Sci. Hortic. 2014, 178, 132–137. [Google Scholar] [CrossRef]
  36. Chen, Y.; Zhang, L.; Qi, J.; Chen, H.; Tao, A.; Xu, J.; Lin, L.; Fan, P. Genetic linkage map construction for white jute (Corchorus capsularis L.) using SRAP, ISSR and RAPD markers. Plant Breed. 2014, 133, 777–781. [Google Scholar] [CrossRef]
  37. Sahu, A.R.; Mishra, R.R.; Rath, S.C.; Panigrahi, J. Construction of interspecific genetic linkage map of pigeonpea using SCoT, RAPD, ISSR markers and simple inherited trait loci. Nuclear 2015, 58, 23–31. [Google Scholar] [CrossRef]
  38. Yang, H.; Li, C.; Lam, H.M.; Clements, J.; Yan, G.; Zhao, S. Sequencing consolidates molecular markers with plant breeding practice. Theor. Appl. Genet. 2015, 128, 779–795. [Google Scholar] [CrossRef] [PubMed]
  39. Sieber, A.N.; Longin, C.F.H.; Würschum, T. Molecular characterization of winter durum wheat (Triticum durum) based on a genotyping-by-sequencing approach. Plant Genet. Resour. 2017, 15, 36–44. [Google Scholar] [CrossRef]
  40. Aitken, K.S.; McNeil, M.D.; Berkman, P.J.; Hermann, S.; Kilian, A.; Bundock, P.C.; Li, J. Comparative mapping in the Poaceae family reveals translocations in the complex polyploid genome of sugarcane. BMC Plant Biol. 2014, 14, 190. [Google Scholar] [CrossRef]
  41. Baloch, F.S.; Alsaleh, A.; Shahid, M.Q.; Çiftçi, V.; de Miera, L.E.S.; Aasim, M.; Nadeem, M.A.; Aktaş, H.; Özkan, H.; Hatipoğlu, R. A whole genome DArTseq and SNP analysis for genetic diversity assessment in durum wheat from central fertile crescent. PLoS ONE 2017, 12, e0167821. [Google Scholar] [CrossRef]
  42. Gawroński, P.; Pawełkowicz, M.; Tofil, K.; Uszyński, G.; Sharifova, S.; Ahluwalia, S.; Tyrka, M.; Wędzony, M.; Kilian, A.; Bolibok-Brągoszewska, H. DArT markers effectively target gene space in the rye genome. Front. Plant Sci. 2016, 7, 1600. [Google Scholar] [CrossRef]
  43. Ho, W.K.; Chai, H.H.; Kendabie, P.; Ahmad, N.S.; Jani, J.; Massawe, F.; Kilian, A.; Mayes, S. Integrating genetic maps in bambara groundnut [Vigna subterranea (L) Verdc.] and their syntenic relationships among closely related legumes. BMC Genom. 2017, 18, 192. [Google Scholar] [CrossRef]
  44. Millan, T.; Winter, P.; JŘngling, R.; Gil, J.; Rubio, J.; Cho, S.; Cobos, M.; Iruela, M.; Rajesh, P.; Tekeoglu, M.; et al. A consensus genetic map of chickpea (Cicer arietinum L.) based on 10 mapping populations. Euphytica 2010, 175, 175–189. [Google Scholar] [CrossRef]
  45. Yadav, P.; Saxena, K.; Hingane, A.; Kumar, C.S.; Kandalkar, V.; Varshney, R.K.; Saxena, R.K. An “Axiom Cajanus SNP Array” based high density genetic map and QTL mapping for high-selfing flower and seed quality traits in pigeonpea. BMC Genom. 2019, 20, 235. [Google Scholar] [CrossRef] [PubMed]
  46. Patil, G.; Mian, R.; Vuong, T.; Pantalone, V.; Song, Q.; Chen, P.; Shannon, G.J.; Carter, T.C.; Nguyen, H.T. Molecular mapping and genomics of soybean seed protein: A review and perspective for the future. Theor. Appl. Genet. 2017, 130, 1975–1991. [Google Scholar] [CrossRef] [PubMed]
  47. Dorrance, A.E. Management of Phytophthora sojae of soybean: A review and future perspectives. Can. J. Plant Pathol. 2018, 40, 210–219. [Google Scholar] [CrossRef]
  48. Książkiewicz, M.; Nazzicari, N.; Yang, H.; Nelson, M.N.; Renshaw, D.; Rychel, S.; Ferrari, B.; Carelli, M.; Tomaszewska, M.; Stawiński, S.; et al. A high-density consensus linkage map of white lupin highlights synteny with narrow-leafed lupin and provides markers tagging key agronomic traits. Sci. Rep. 2017, 7, 15335. [Google Scholar] [CrossRef]
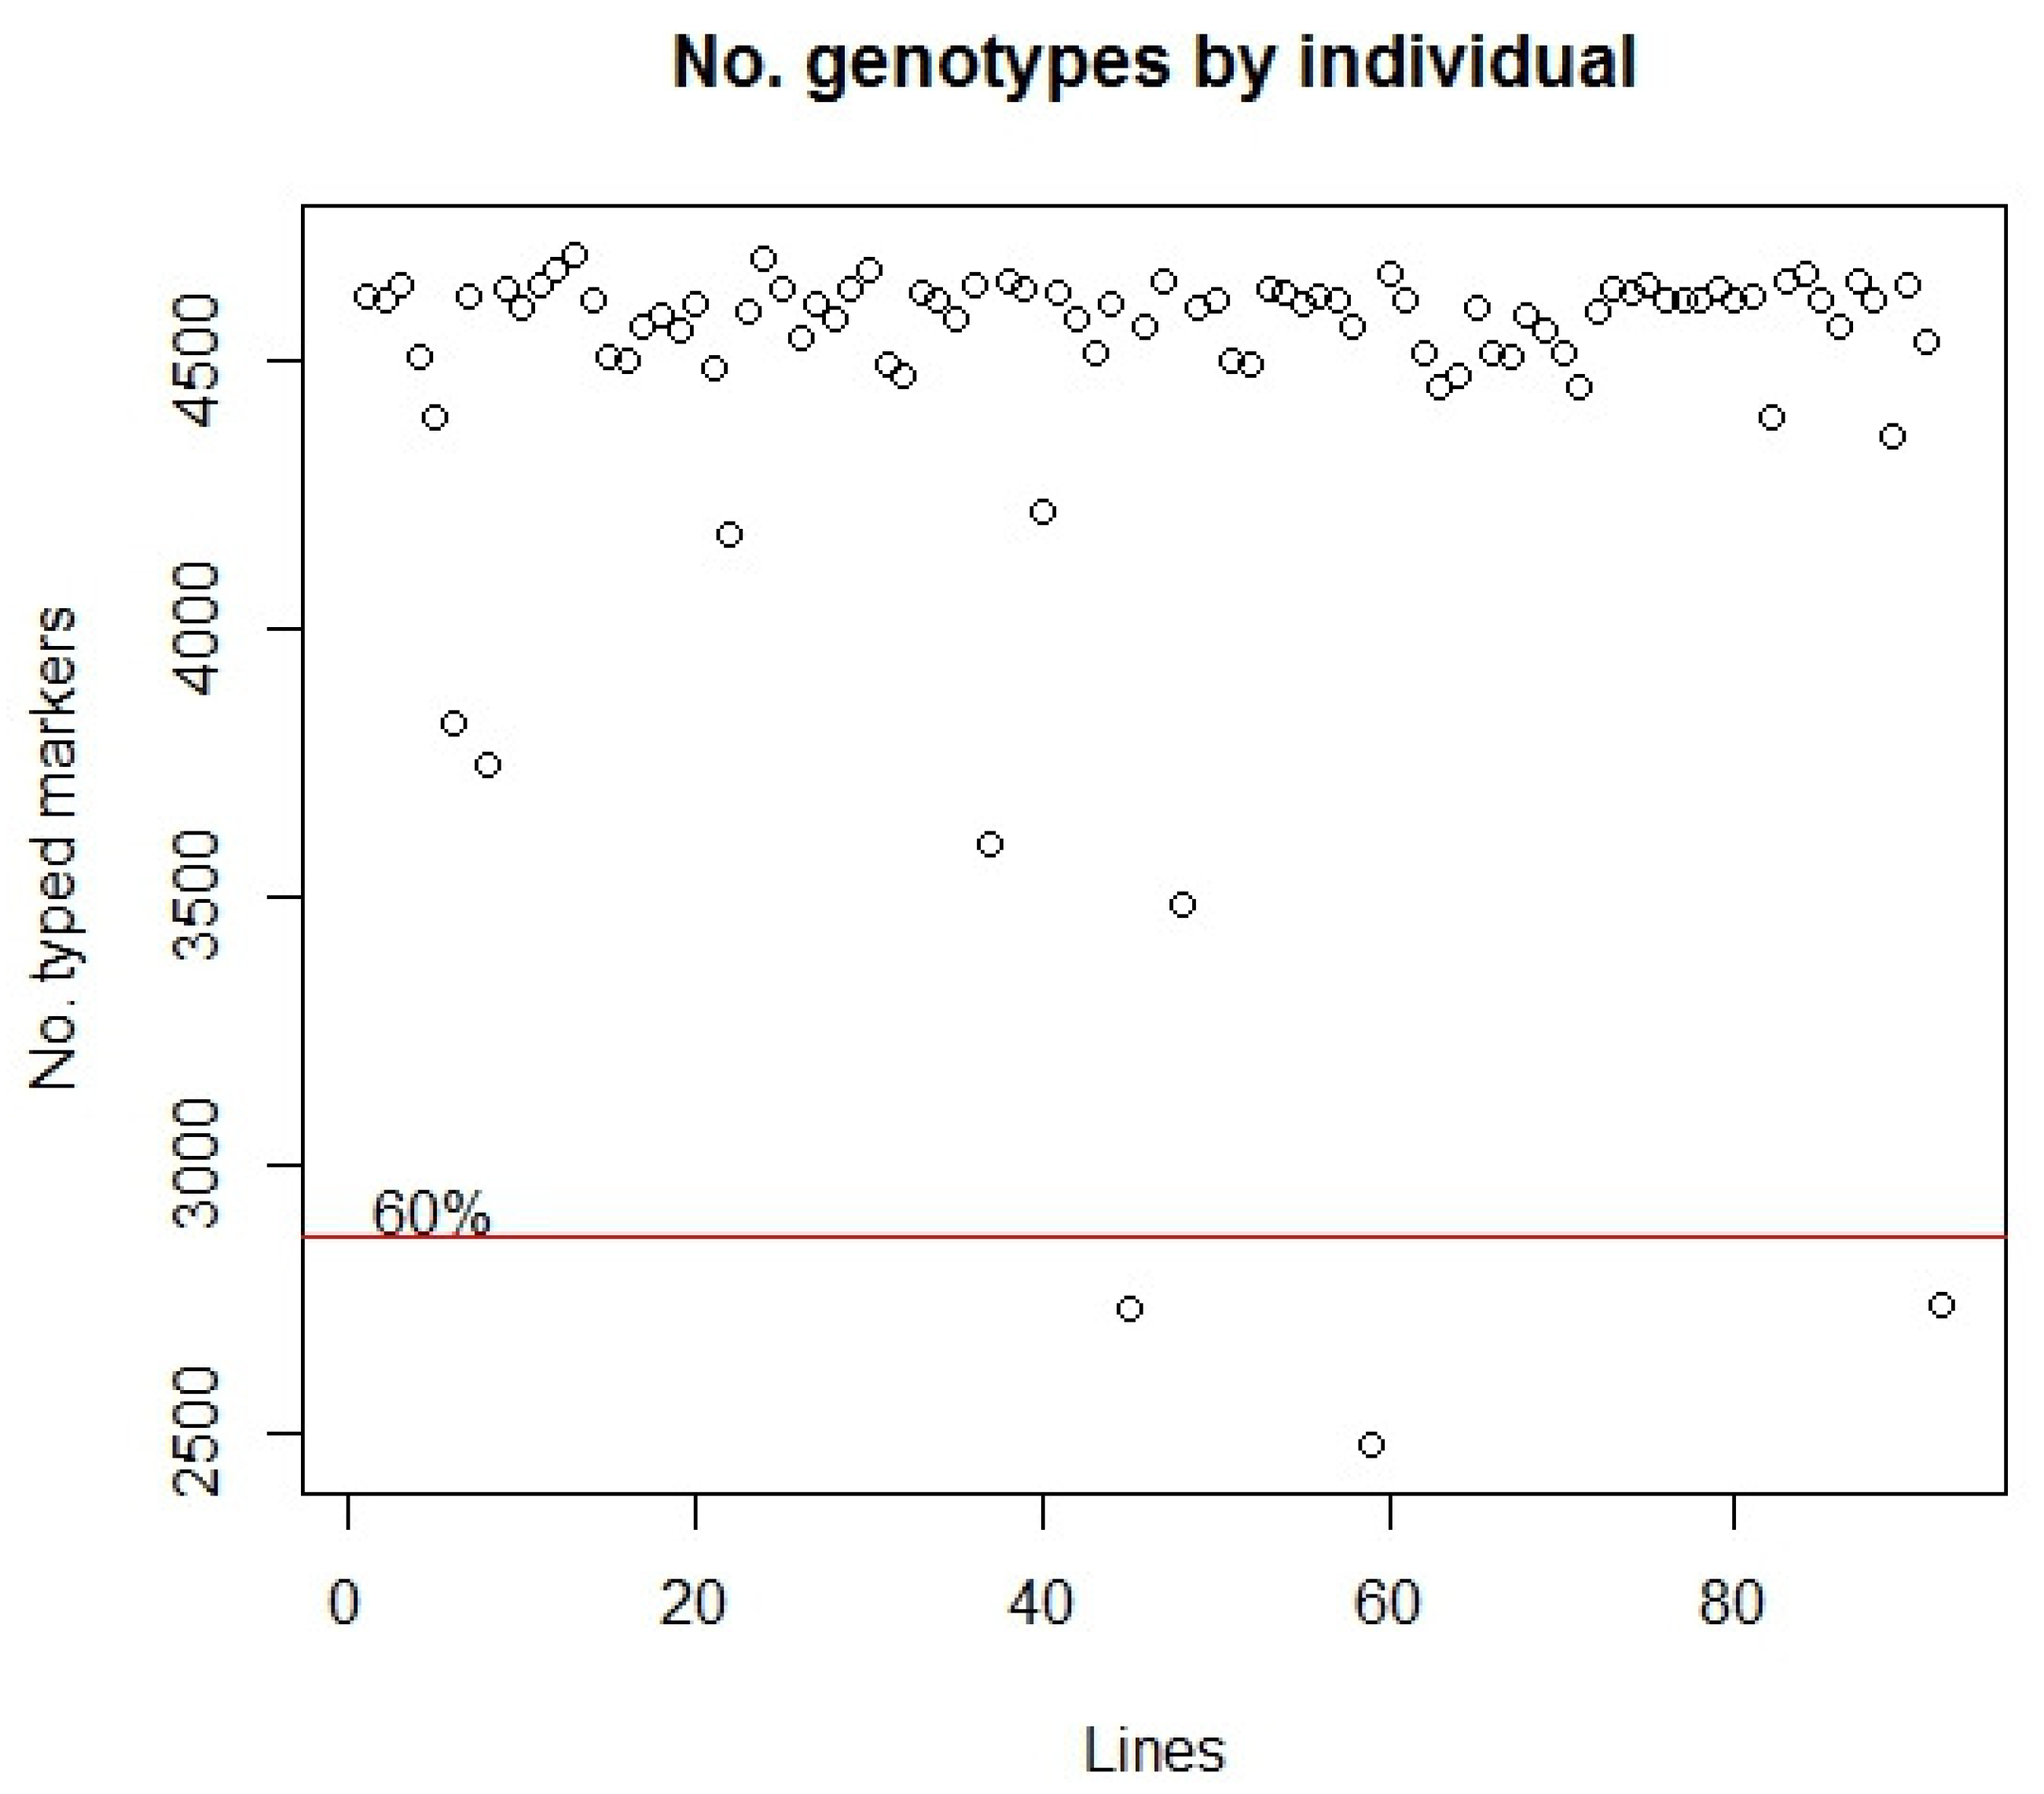
Figure 1. Number of DArTseq markers obtained for each of 92 lines from ExL population.
Agronomy 09 00653 g001
Figure 2. Genetic linkage maps for EL population—Linkage Groups (LG).
Agronomy 09 00653 g002aAgronomy 09 00653 g002bAgronomy 09 00653 g002c
Figure 3. Genetic linkage maps for EL population—Cluster (Cl).
Agronomy 09 00653 g003
Figure 4. Circos plot, comparing obtained genetic linkage maps to Lupinus angustifolius reference genome [11].
Agronomy 09 00653 g004
Figure 5. Circos plot, comparing obtained genetic linkage maps to Lupinus angustifolius reference genome [17].
Agronomy 09 00653 g005
Figure 6. Numbers of DArTseq markers located in common CDS sequences between Lupinus angustifolius and three other model legume species (Glycine max, Lotus japonicus and Medicago truncatula).
Agronomy 09 00653 g006
Table 1. Results of genotyping RIL mapping population EL with ISSR markers.
Primer NumberNumber of Amplification ProductsNumber of Polymorphic ProductsNumber of Polymorphic Products with Segregation 1:1Size of Amplification Product (bp)
807553243, 463, 477
808822493, 1060
810511354
811621667
8135311780
81410102450, 515
815772178, 1540
817742357, 1100
818555552, 607, 648, 684, 703
821332496, 638
823543164, 550, 1361
826653277, 471, 882
828642501, 955
836763425, 494, 521
840842216, 818
842993684, 834, 858
844542712, 812
848532536, 748
849311393
859641585
874332659, 1030
880443322, 961, 1200
8841052425, 494
8861311469
888841433
889711346
890942338, 419
8923311370
9008812230
Table 2. Results of genotyping RIL mapping population EL with SSR markers.
MarkerNumber of Lines in ‘Emir’ TypeNumber of Lines in ‘LAE-1’ TypeNumber of Lines without Genotyping Resultsp-Value for χ 2 Test
SSR_11_260524000.211
SSR_11_280524000.211
LaSSR_003_289454700.835
LaSSR_003_293454700.835
LaSSR_015_235355700.022
LaSSR_008_254335630.015
LaSSR_008_264355430.044
LaSSR_011_306365060.131
LaSSR_011_312365060.131
LaSSR_002_179424550.748
LaSSR_002_211375050.163
LaSSR_005_291424190.913
LaSSR_005_295424190.913
LaSSR_019_212494030.34
LaSSR_019_216494030.34
LaSSR_022_254375320.092
LaSSR_022_259395120.206
LaSSR_024_209385220.14
LaSSR_024_213385220.14
Table 3. Summary of ExL genetic linkage maps constructed based on 4601 markers in Lupinus angustifolius.
Linkage GroupNumber of Unique LociNumber of Markers% Polymorphic MarkersLength (cM)Average of Distances (cM)Maximum Distance (cM)
EL_LG_01A3412427.42%84.132.5513.92
EL_LG_01B248129.63%85.553.7229.82
EL_LG_027430524.26%142.941.9619.38
EL_LG_0314550528.71%359.742.5220.63
EL_LG_044918027.22%174.583.6428.03
EL_LG_058427330.77%194.682.3514.92
EL_LG_06A1710116.83%55.673.4824.8
EL_LG_06B8131425.8%223.782.823.33
EL_LG_07217627.63%52.342.6217.05
EL_LG_08A125721.05%31.32.8515.96
EL_LG_08B1910019%48.962.7212.96
EL_LG_09A248827.27%100.664.3828.03
EL_LG_09B3215021.33%55.051.786.36
EL_LG_106624427.05%183.462.8220.63
EL_LG_113511929.41%88.842.619.44
EL_LG_12A266937.68%63.162.5312.03
EL_LG_12B2014913.42%49.512.6117.05
EL_LG_137739919.3%133.991.767.1
EL_LG_142910926.61%96.333.4429.82
EL_LG_156017135.09%189.613.2129.82
EL_LG_16A2511721.37%47.381.978.64
EL_LG_16B259925.25%62.962.6210.28
EL_LG_187530524.59%165.272.2320.63
EL_LG_195720028.5%205.013.6620.63
EL_Cl_052540%1.741.741.74
EL_Cl_07A117115.49%8.020.81.74
EL_Cl_07B21118.18%0.570.570.57
EL_Cl_1175213.46%10.131.694.95
EL_Cl_16A51145.45%7.351.845.65
EL_Cl_16B61154.55%8.261.653.62
EL_Cl_1741040%47.2315.7431.74
EL_Cl_20A84318.6%10.571.513.62
EL_Cl_20B144928.57%28.282.1814.92
EL_Cl_20C44100%25.3712.6910.28
Total11744602 3042.42
Table 4. Pearson correlation coefficient between position of DArTseq markers in genetic linkage maps and narrow-leafed genomes [11,17].
Linkage GroupsCorelation Coeficient r [11]Corelation Coeficient r [17]
Cl_05
Cl_07A0.970.97
Cl_07B0.790.79
Cl_110.960.96
Cl_16A0.990.98
Cl_16B0.390.39
Cl_171.00.99
Cl_20A0.960.96
Cl_20B0.970.97
Cl_20C 1.0
LG_01A0.720.75
LG_01B0.990.99
LG_020.930.93
LG_030.950.92
LG_040.970.97
LG_050.950.94
LG_06A0.970.97
LG_06B0.980.98
LG_070.860.63
LG_08A0.990.98
LG_08B0.950.95
LG_09A0.960.88
LG_09B0.150.02
LG_100.810.82
LG_110.990.99
LG_12A0.940.95
LG_12B0.960.96
LG_130.840.87
LG_140.860.86
LG_150.940.92
LG_16A0.420.15
LG_16B0.950.95
LG_180.850.74
LG_190.910.91