Abstract
Rice leaf morphology is an essential agronomic trait to develop drought-tolerant genotypes for adequate and stable crop production in drought-prone areas. Here, rolled leaf mutant plants were acquired by CRISPR/Cas9-based mutagenesis of Semi-rolled leaf1,2 (SRL1 and SRL2) genes, and isobaric tags for relative and absolute quantification (iTRAQ) based proteomic analysis was performed to analyze the subsequent proteomic regulation events. Homozygous mutants exhibit decreased chlorophyll content, transpiration rate, stomatal conductance, vascular bundles (VB), stomatal number, and agronomic traits with increased panicle number and bulliform cells (BCs). Under drought stress, mutant plants displayed lower malondialdehyde (MDA) content while higher survival rate, abscisic acid (ABA) content, superoxide dismutase (SOD), catalase (CAT) activities, and grain filling percentage compare with their wild type (WT). Proteomic results revealed that 270 proteins were significantly downregulated, and 107 proteins were upregulated in the mutant line compared with WT. Proteins related to lateral organ boundaries’ (LOB) domain (LBD) were downregulated, whereas abiotic stress-responsive proteins were upregulated in the CRISPR mutant. LBD proteins (Q5KQR7, Q6K713, Q7XGL4, Q8LQH4), probable indole-3-acetic acid-amido synthetase (Q60EJ6), putative auxin transporter-like protein 4 (Q53JG7), Monoculm 1 (Q84MM9) and AP2 (Apetala2) domain-containing protein (Q10A97) were found to be hub-proteins. The hybrids developed from mutant restorers showed a semi-rolled leaf phenotype with increased panicle number, grain number per panicle, and yield per plant. Our findings reveal the intrinsic value of genome editing and expand the knowledge about the network of proteins for leaf rolling and drought avoidance in rice.
1. Introduction
The leaf is a primary photosynthetic organ in plants having a decisive role in plant growth, development, and survival. Leaf rolling is the key character that determines plant architecture that significantly affects crop yield and the accumulation of dry matter in the later period [1]. Rolled leaves are determined erected leaf phenotype, carbon fixation and gas exchange for photosynthesis, reduced transpiration and canopy interception of solar radiation. Studies have shown that rolled leaf genotypes reduce water loss rate and enhance drought tolerance while semi-rolled leaf plants exhibit more rapid water loss and lower water content in leaves and reduced drought tolerance [2,3,4,5,6]. Drought is a prolonged dry period in the natural climate cycle that impairs rice production and challenging tasks due to its unpredictable and complex nature. Under drought stress, plants undergo a range of biochemical and physiological pathways and excessive accumulations of ROS (reactive oxygen species). Antioxidant enzymes, such as peroxidase (POD), catalase (CAT), and superoxide dismutase (SOD), play a vital role in dealing with ROS accumulation. Abscisic acid (ABA) plays the main role in regulating stomatal closure, while malondialdehyde (MDA) production indicates cell membrane damage from water-deficit stress. Leaf rolling decreases stomatal conductance and reduced water loss under severe water-deficit conditions. Therefore, the development of leaf rolling genotypes may provide a source to enhance rice yield under drought conditions. In China, breeding for rolled leaf genotypes is preferred for high-yielding rice varieties, including super hybrid rice [2,7,8]. Therefore, generation and identification of the genetic components that modulate leaf rolling may provide tools to enhance rice yield.
Many genes in rice control rolled leaf phenotype by regulating the number, size and the arrangement of bulliform cells (BCs), including OsZHD1 [9], ACL1 and ACL2 [10], REL1 [11], REL2 [12], OsCSLD4/NRL1 [13,14,15], RL14 [16], and OsMYB103L [17]. Semi-rolled leaf 1 (SRL1) is allelic to curled leaf and dwarf 1 (cld1), which encodes a putative glycosylphosphatidylinositol-anchored protein and regulates leaf rolling on the adaxial side by increasing the number of BCs. The SRL1 mutant with loss-of-function showed lesser lignin contents and cellulose in the epidermis of BCs [6,18]. SRL2 rice mutants showed curved and narrow leaves mainly expressed in the leaf sheaths, vascular bundles (VB) of leaf blades, and roots and encode a protein of unknown biochemical function. SRL2 is also responsible for the sclerenchyma cells (SCs) or mesophyll cells (MCs), which play a critical role in leaf rolling by severely impairing cuticle development and organization of the epidermis [19].
CRISPR/Cas9 (clustered regularly interspaced short palindromic repeat CRISPR-associated endonuclease 9) is an efficient tool for targeted mutagenesis, which has been successfully applied in rice [20,21]. The CRISPR/Cas9 system has also been employed for the simultaneous editing of multiple genes [22], as well as target gene repression and activation [23].
To detect the changes in proteins induced by the mutations, including internal, external, or both stimuli, proteomic analysis proved to be a powerful tool. The isobaric tags for relative and absolute quantification (iTRAQ) based proteomic analysis is a newly developed technique that can quantitatively analyze protein abundance [24]. It has been extensively used to recognize different biological processes in rice and other plant species [25].
Many prediction tools and experimental approaches have been developed, but the vastly complex mechanisms underlying the cell’s reply to genetic mutations are still to be comprehended. Several studies have been performed related to rice rolled leaf phenotypes, but according to our knowledge, there is currently no iTRAQ-based proteomic study available to understand the rolled leaf prototype induced by CRISPR/Cas9. This study is an application of proteomics to assess the outcome of CRISPR-induced events in rolled leaf rice mutants. We generated CRISPR mutants with several morphological imperfections, and our results revealed that the SRL1 and SRL2 loss-of-function mutations led to a rolled leaf phenotype that showed drought tolerance. Our study provides some novel evidence supporting the regulatory module in leaf rolling and drought tolerance in rice.
2. Material and Methods
2.1. Plant Material and Growth Conditions
In this study, three restorer rice lines (GXU16, GXU20, and GXU28), were used for genetic transformations. Plants were grown in standard greenhouse conditions (16 h light at 30 °C/8 h dark at 22 °C), and in the experimental field of Guangxi University (22° N, 108° E), Guangxi Province, China.
2.2. CRISPR/Cas9 Plasmid Construction and Generation of Mutant Plants
Two target sites for each gene were selected by the online tool CRISPR-GE (http://skl.scau.edu.cn/home/) [21]. The first target for SRL1 was designed in the second exon (669–688 bp), and the second target was designed in the third exon (1409–1428 bp) (Figure S1A,B). The first target of SRL2 was designed in the first exon (1494–1516 bp) and second target in the second exon (1844–1863 bp) (Figure S1C,D). Targets were selected with high efficiency and low off-target scores (Table S2). The structure of sgRNA’s (Figure S2) was constructed by an online tool, CRISPR-P (version 2.0) (http://crispr.hzau.edu.cn/cgi-bin/CRISPR2/CRISPR). The sgRNA expression cassette was constructed through overlapping PCR. The cloning of the sgRNA expression cassette into the pYLCRISPR/Cas9 binary vector was performed by restriction–ligation reactions. Finally, the ligation product was transformed into Escherichia coli (DH5α) by the heat shock method, and the bacterial solution was applied to LB (Luria-broth) agar plates containing 50 ug/mL kanamycin for 12 h. Simple PCR was performed using specific primers (PB-L and PB-R) and the bacterial solution as a template [22]. Rice calli transformation was completed following the method by Hiei et al. (1994) [26], and calli were transferred to regeneration media to obtain green plants.
2.3. Genotyping of T0 Generation and Off-target Effect Detection
The genomic DNA of T0 generation was extracted, and site-specific primers (SRL1T1-F/R, SRL1T2F/R and SRL2T1F/R, SRL2T2F/R) (Table S1) were used to amplify target sites. The product confirming the target fragment size was sent to the Beijing Genomics Institute (BGI) for sequencing. The mutations were analyzed by the online analysis tool, DSDecode (http://skl.scau.edu.cn/dsdecode/) [27]. The presence/absence of T-DNA was evaluated using Cas9 gene-specific primers (Cas9-F/Cas9-R) (Table S1). The potential off-target sites were selected from an online tool, CRISPR-GE. Four off-target sites for each target were analyzed by direct Sanger sequencing with site-specific primers (POT1-POT16) (Table S3).
2.4. Morphophysiological and Microscopic Analysis
T2 plants were grown under normal irrigation in the paddy field until maturity to record the data for plant height, panicle number, panicle length, flag leaf length, flag leaf width, grain number per panicle, seed setting rate, 1000-grain weight, grain length, and grain width. In normal irrigation, the standing water was maintained from transplanting to 15 days before maturity. The transpiration rate and stomatal conductance were measured from sixty days old plants during sunny days (09:00 am, 11:00 am, and 15:00 pm) by using the Li-Cor 6400 Portable Photosynthesis System. Leaf samples (0.1 g) were taken, and chlorophyll was extracted with 80% acetone and measured according to the previous method, as reported by Lichtenthaler (1987) [28]. The leaf samples were taken at the tillering stage, and cells were observed and counted under an Olympus CX40 microscope and photographed with mshot-mc50.
2.5. Measurement of ABA Contents, MDA Contents, and Antioxidant Enzyme Assays Under Drought Stress
The 15 days old seedlings were grown in a growth chamber (16 h light at 28 °C and 8 h dark at 20 °C with 80% humidity), in nutrient solution containing 10% polyethylene glycol (PEG)-6000. The nutrient solution was refreshed after every seven days, and after five weeks, the plants were treated with 10% (w/v) PEG6000. The ABA level was determined using radioimmunoassay (RIA) [29]. The 0.2 g seedlings were ground with liquid nitrogen and homogenized in 1 ml ddH2O and then shaken overnight at 4 °C. The supernatant was used for ABA assay after centrifugation. The MDA (malondialdehyde) content was determined according to a previously established method [29]. The results were expressed as mg g−1 FW (fresh weight) of the seedlings. The seedlings were crushed into a powder in a mortar with the pestle with liquid nitrogen. The crude enzyme of the powder was extracted in 50 mM chilled sodium phosphate buffer (pH 7.8) and 1% (w/v) polyvinylpolypyrrolidone (PVPP) at 4 °C. The homogenate was centrifuged at 12,000 g at 4 °C for 15 min. The SOD activity was determined by the nitro blue tetrazolium (NBT) photochemical reduction by 50% according to the previously established method [30]. CAT activity was assayed by measuring the rate of decomposition of H2O2 at 240 nm, and units were expressed as min−1 g−1 FW, following the previous method [31]. POD activity was assayed according to the previously established method [32], at 470 nm, and units were expressed as min−1 g−1 FW. Wild type (WT) and mutant lines were also grown in controlled conditions to induce drought stress. The drought stress was imposed from 50 days (panicle initiation) to 80 days after sowing (heading). After the termination of drought stress, water was applied evenly to the planting area and grain filling percentage was calculated.
2.6. Protein Extraction, Digestion, and Labeling
Total protein was extracted from the leaf samples of WT (GXU16) and its mutant line (GXU16-19). Leaf samples were ground fully in liquid nitrogen and homogenized with borax/polyvinyl-polypyrrolidone/phenol (BPP) in a ratio of 1:3 and vortexed for 10 min at 4 °C. Tris-saturated phenol (v:v =1:1) was added and vortexed at 4 °C for 10 min and five volumes of 100 mM ammonium acetate in methanol at 4 °C was used for collection and precipitation of phenolic phase. The sample was centrifuged (20 min, 6000 rpm, 4 °C), and pellets were suspended in 10 mL of methanol soon after collection and repeated in 10 mL of acetone, 10 mL of methanol, and 1 mL of acetone again, respectively. The sample was centrifuged at 12,000 rpm for 20 min and pellets were collected, air-dried, and suspended in 150 L of radioimmunoprecipitation assay (RIPA) lysis buffer containing 1% (w/v) sodium deoxycholate, 0.1% (v/v) TritonX-100, 0.1% (w/v) SDS, 50 mM Tris-HCl (pH 8.0), and 150 mM NaCl. The protein concentration was measured by the BCA method (bicinchoninic acid). Trypsin (Promega, Madison, WI, USA) at 37 °C at a ratio of 1:50 (enzyme/substrate) was used for protein digestion overnight, and iTRAQ labeling was completed following the manufacturer’s protocol (Applied Biosystems, Sciex, Foster City, CA, USA). The samples were labeled as (16_GXU)-116 and (GXU16_19)-118. The further experimental procedure was carried out according to the previously established method [33].
2.7. Protein–Protein Interaction (PPI) and Data Analysis
Proteins were identified by the Mascot search engine (Matrix Science, London, UK; version 2.3.02), and the Osativa_204 (40869 entries) database was selected. Protein Pilot Software 4.0 (AB SCIEX, Redwood City, CA, USA) was used for data analysis with the 2-fold cutoff for quantitative changes to asses up- and downregulated proteins. The DEPs (differentially expressed proteins) were then imported to the GO (http://geneontology.org/) and KEGG database (http://www.genome.jp/kegg/pathway.html) for metabolic pathway and biological processes examination. The STRING database (version 10.0) (https://string-db.org/) was searched for protein–protein interaction (PPI) for all upregulated/downregulated proteins. This database contains interactions from earlier published interaction studies, which include physical (direct) and functional (indirect) associations; they are based on computational prediction, from the knowledge transfer among the organisms, and from the aggregated interactions from other databases. PPIs belonging to the uploaded dataset were selected to minimize false positive/negative interactions based on the confidence score, and the lines represent associations among different proteins. The experimentally validated interactions with the highest combined scores were selected as significant and DEPs. The nodes with degree, closeness, and betweenness scores higher than the mean, as calculated by the Cytoscape (version 3.7.2) plugin, Cytohubba, were considered hub nodes. The network of the top ten highly expressed proteins was constructed based on the degree of protein expression. The data analysis for all morphological characters was performed using the SPSS 16.0 Statistical Software Program.
2.8. Expression Analysis of Target Genes and Validation of Proteomic Data
Total RNA was isolated from the fresh leaves by using the TaKaRa MiniBEST Plant RNA Extraction Kit according to the manufacturer’s instructions. The rice actin gene was used as a control. The expression level of SRL1 and SRL2 was confirmed by using specific primers. A total of five proteins were randomly selected for dynamic transcriptional expression profiles. Primers used in this study are listed in Table S1. Real-time quantitative PCR analysis on a Bio-Rad CFX96 Real-time System using the qRT-PCR kit (Takara PrimeScript RT-PCR Kit-Perfect Real Time), 20 μL reaction system (SYBRT Green 10μL, RNase/DNase-free Water 3.8 μL, 0.6 forward and reverse primers) was undertaken. The amplification reaction cycle was adjusted at 95° C for 30 s, 95 °C for 5 s, 60 °C for 30 s, 65 °C for 5 s, 40 cycles. The 2−ΔΔCt method was used to calculate relative expression levels.
2.9. Development of Hybrids and Assessment of Main Agronomic Characters
The WTs (GXU16, GXU20, and GXU28) and rolled leaf mutants (GXU16-19, GXU20-8, and GXU28-12) were used as a restorer (R) and crossed with flat-leaf cytoplasmic male sterile (CMS) lines (36A and 52A) to develop F1 hybrids. All the F1 hybrids were planted in the field conditions, and the hybrid combinations and parents were used for evaluating the main agronomic characters.
3. Results
3.1. Assembly of Targets in pYLCRISPR/Cas9Pubi-H
The amplification of the sgRNA expression cassette for all targets was confirmed by overlapping PCR (Figure 1A). The PCR product was mixed and purified by TaKaRa MiniBEST Purification Kit Ver.4.0. The CRISPR/Cas9 binary vector was successfully constructed, and all target sequences were confirmed in the vector (Figure 1B) by using the specific primers (SP-L1 and SP-R) (Table S1).
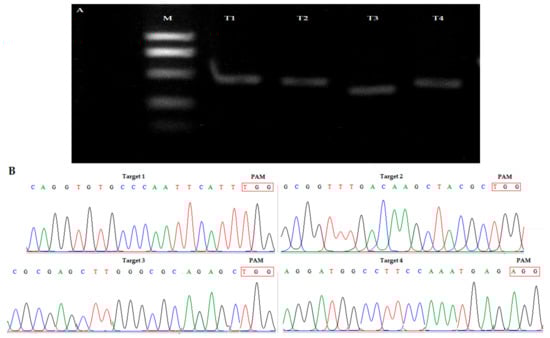
Figure 1.
(A) sgRNA expression cassette after second round of PCR, M: 2000, T1 (OsU6a-gRNA): 629 bp, T2 (OsU6b-sgRNA): 564 bp, T3 (OsU6c-sgRNA): 767 bp, T4 (OsU3m-sgRNA): 515 (B) Sequencing peak map of four target sites assembled in vector.
3.2. Frequency of Mutations and Off-target Analysis
After the CRISPR/Cas9 constructed transformation into rice embryogenic calli, the positive mutant lines were selected by using specific hygromycin phosphotransferase primers (HPTF/HPTR) (Table S1). Nucleotide sequencing analysis of T0 plants showed that mutant plants showed different mutation rates for each target. For GXU16, a total of 22 plants were obtained in T0 generation with a mean mutation rate of 22.7% homozygous and 45.4% heterozygous. A total of 19 positive mutant plants was obtained for GXU20, including 19.3% homozygous and 37.5% heterozygous mutations. For GXU28, a total of 25 plants was obtained, with 23.9% homozygous and 47.7% heterozygous mutations (Figure S3). The DNA of 30 mutant plants was amplified for four most likely sites for each target with the highest-ranking off-target potential. Results showed that there was no off-target mutation were detected (Table S4).
3.3. Screening of T-DNA-Free Plants
The results showed that 55 mutant plants were amplified to the Cas9 vector sequence, while 37 plants were not amplified and thus named as T-DNA-free plants (Figure S4). We selected three homozygous T-DNA free plants (GXU16-19, GXU20-8, and GXU28-12) for further investigations. GXU16-19 showed homozygous mutations with 5pb, 9 bp, 1 bp, and 4 bp deletions on first, second, third, and fourth target sites, respectively. Homozygous mutant GXU20-8 showed 10 bp, 8 bp, 6 bp, and 6 bp deletions on first, second, third, and fourth target sites, respectively. The mutant line GXU28-12 resulted in homozygous mutations with 11 bp, 7 bp, 5 bp, and 3 bp deletions on first, second, third, and fourth target sites, respectively (Figure 2A). Sequencing results confirmed that homozygous mutants showed stable mutations in T1 and subsequent T2 generations (Figure 2B).
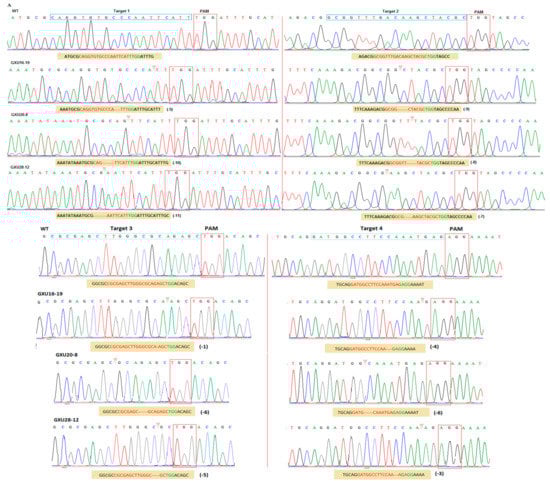
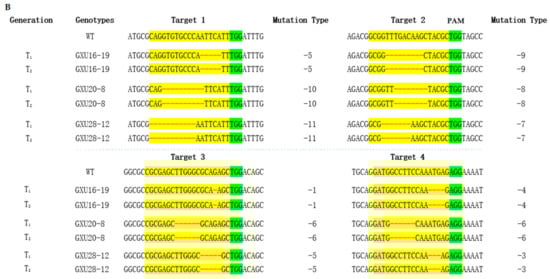
Figure 2.
(A) Sequencing peak map of wild type (WT) and mutant lines for four targets. (B) Sequence alignment for transmission of mutations in T1 and subsequent T2 generations. The yellow highlighted is the target sequence, and the PAM sequence is shown in green background. Red hyphens represent deletions. Three replicates of each line were analyzed.
3.4. Phenotyping Under Normal and Drought Conditions
The mutant lines showed a rolled leaf phenotype until maturity, while the WT leaves were flat during the whole phase of development (Figure 3A,B). The leaf rolling index of the SRL1 mutant was 87.5%, while WT showed a flat-leaf phenotype (Figure 3C). Mutant plants showed a lower transpiration rate than WT at the three different time points during sunny days (Figure 3D). The stomatal conductance was significantly lower in mutant plants (Figure 3E). Under normal conditions, the plant height of the mutant lines GXU16, GXU20, and GXU28 was about 32.0 cm, 34.9 cm, and 37.8 cm, lower than that of WT at mature stage, respectively (Table 1); the panicles number were increased from 7.7 to 11.3; the panicle length was reduced by 42%; the flag leaf length and width was decreased by 26.5% and 27.3%, respectively; the grain number per panicle and seed setting rate was decreased by 21.0% and 23.9%, respectively; the 1000 grain weight was reduced by 14.2%; the grain width and grain length of the mutants were reduced by about 16% and 15.78%, respectively, compared with WT (Table 1). Stomatal conductance was higher in WT as compared to mutant plants (Figure 3E). The grain filling percentage under normal conditions was 83% and 80% in WT and mutant plants, respectively, while under severe drought, the percentage of filled grain in WT plants was nearly 2.5%, whereas that in mutant plants was 27.5% (Figure 3F).
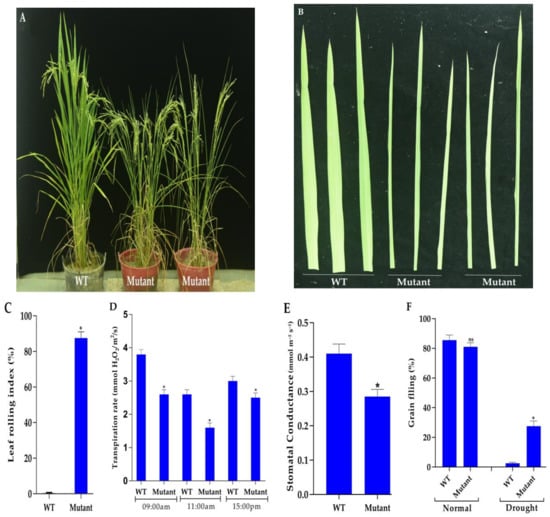
Figure 3.
The phenotype of WT and mutant plants at maturity (A). The leaf blade of WT (left) and mutant plants (right) (B). The leaf rolling index (%) of WT and mutant line (C). The transpiration rates of WT and mutant plants grown in a paddy field (D) Stomatal conductance in WT and mutant line (E) Grain filling percentage of WT and mutant plants under normal and severe drought stress (F). Data are presented as means ± sd (n = 5). * indicates a significant difference, ns indicates a non-significant difference, Student’s t-test, p ≤ 0.01.

Table 1.
Main agronomic traits of the wild type and mutant plants.
3.5. Measurement of Chlorophyll Contents
The chl a content in WTs (GXU16, GXU20, and GXU28) was 8.26 mg·g−1, 8.13 mg·g−1, and 7.99 mg·g−1, respectively, while mutant lines GXU16-19, GXU20-8 and GXU28-12 showed chl c content of 4.25 mg·g−1, 4.11 mg·g−1, and 4.14 mg·g−1, respectively. The chl b content in WTs (GXU16, GXU20, and GXU28) was 2.29 mg·g−1, 2.75 mg·g−1, and 2.86 mg·g−1, respectively, and for mutant lines GXU16-19, GXU20-8 and GXU28-12, the chl b content was 1.52 mg·g−1, 1.49 mg·g−1, and 1.39 mg·g−1, respectively. β-carotene content of GXU16, GXU20, and GXU28 was 1.39 mg·g−1, 1.47 mg·g−1, and 1.36 mg·g−1 fresh weight, respectively, and for mutant lines GXU16-19, GXU-20-8, and GXU28-12 were 0.98 mg·g−1, 1.02 mg·g −1, and 1.06 mg·g −1, respectively. Mutant lines showed decreased chlorophyll contents, which also results in a decrease in Chl a/b compared to WT (Table 2).
Table 2.
Chlorophyll contents (mg/g fresh weight) of rolled leaf mutant and wild-type.
3.6. Microscopic Analysis
There was a significant difference between WT and mutant leaf cells (Figure 4A,B). Microscopic analysis showed that the stomata number in mutant plants was less than WT (Figure 4C,D). The number of VB of WT was 49.3 ± 5.21, while the number of VB of mutant line leaves was 27.3 ± 1.35 (Figure 4E). Paraffin section observation of the leaves showed that the number and area of BCs of the mutant lines were reduced compared with WT. The number of BCs in the mutant line was (1023.7 ± 241.2)/mm2, and the number of BCs in the WT was 435.7 ± 41.3/mm2 (Figure 4F). The stomata number in mutant plants were decreased from 65 per 10−5 m2 to 51 per 10−5 m2 (Figure 4G).
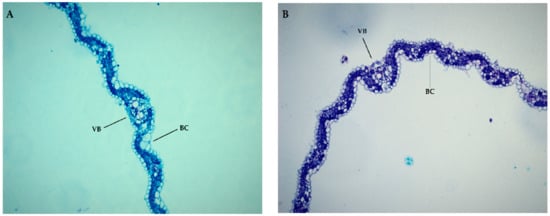
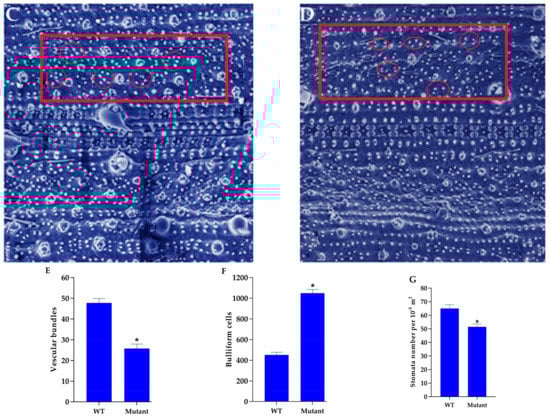
Figure 4.
Comparison of the cross-section of flag leaf between wild type (WT) (A) and mutant line in T2 generation (B). (C) Arrangements of stomas in WT and, (D) mutant plant leaf. (E) Comparison of vascular bundles (VB) of flag leaf between WT and mutant lines. (F) Comparison of bulliform cells (BCs) per square millimeter between WT and mutant line. (G) Number of stomas in WT and mutant plants. Data are presented as means ± sd (n = 5). * indicates a significant difference, Student’s t-test, p ≤ 0.01.
3.7. Mutant Plants Enhance ABA Content and Improve Antioxidant Enzyme Activities Under Drought Stress
In comparison to WT, CRISPR mutants showed a higher ABA level while MDA content was increased in WT after drought stress (Figure 5A,B). The SOD, POD, and CAT activities were higher in the mutant plants, especially SOD and CAT (Figure 5C–E). A drought tolerance assay showed that the leaves of WT became wilted after 6 days while the leaves of mutant plants were not wilted even after 15 days of drought treatment. After 15 days of drought treatment, water was again applied to the plants to recover normal growth. The survival rate of mutant plants was increased by 45% as compared to WT (Figure 5F). WT plants showed normal phenotype under controlled conditions, with more physiological damage than mutant plants after drought stress and re-watering (Figure 5G–I).
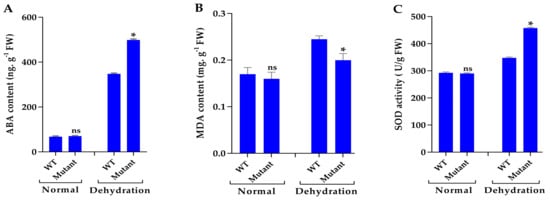
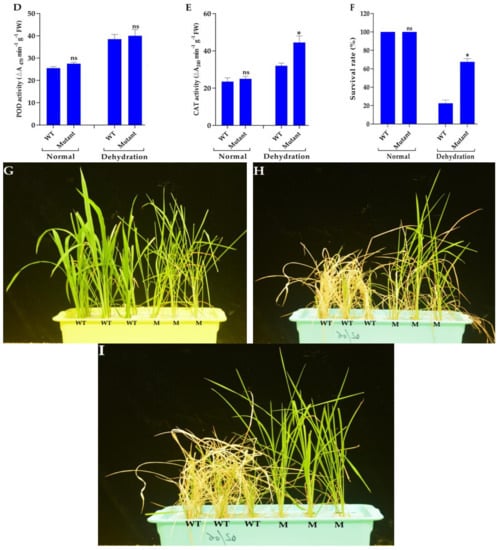
Figure 5.
Physiological changes in the wild type and T2 CRISPR mutants. (A) ABA (abscisic acid) contents (B) MDA (malondialdehyde) contents (C) SOD (superoxide dismutase) activity (D) POD (peroxidase) activity and (E) CAT (catalase) activity. (F) The survival rate of WT and mutant plants after drought and re-watering treatments. The phenotype of WT and mutant plants under controlled conditions (G). Drought stress (H) and, after re-watering (I). The abbreviations, WT, and M in the figure, represents wild type and mutants, respectively. Data are presented as means ± sd (n = 5). * and ns indicates a significant and non-significant difference, respectively, Student’s t-test, p ≤ 0.01.
3.8. Protein Identification and Quantitation of Rolled Leaf Mutant and Wild Type
A total of 441,569 spectra were produced for both samples. The raw library size was 535,647 and 806,761 and normalized library size was 667,640.122 and 674,665.262 for WT (GXU16) and CRISPR mutant (GXU16-19), respectively. The box-and-whisker plot of proteomic count data distribution showed a difference between the medians of both samples (Figure 6A). The distribution of protein count data histogram showed that the frequency of proteins was highest at 5 to 8 of log2 (counts + 1) (Figure 6B). By arranging the data, we identified 6538 proteins, and after adjusting the filter cutoff 10, we obtained 6452 proteins. The comparison showed 377 DEPs, 270 downregulated, and 107 upregulated (Figure 6C). Some DEPs were found to be highly associated with leaf rolling and abiotic stress tolerance and considered as candidate proteins (Table 3). The detailed information of all identified proteins is listed in (Additional File 2). The top twenty proteins were also selected with higher adjusted p-value cutoff to select proteins with the highest mean expression. A2YP90 (uncharacterized protein), B8BNS8 (ribosome assembly factor mrt4), and A2YI21 (PsbP domain-containing protein) showed higher expression levels in the mutant line with lower expression levels in WT. Q1KL27 (peptidyl-prolyl cis-trans isomerase), and B8BFK2 (uncharacterized protein) showed higher expression levels in WT and lower expression levels in mutant line (Figure 6D).
Figure 6.
Basic information about identification and analysis of proteome in wild type (GXU16) and its mutant line (GXU16_19). (A) A box-and-whisker plot of proteomic count data distribution with log2 values of the normalized abundance. (B) Histogram for count data distribution of the identified proteins. (C) Number of the total, differentially expressed, up- and downregulated proteins (D) Heatmap of 20 most variable proteins with the highest mean expression values. The yellow color indicates a higher expression level of protein, and the darker blue color represents a low expression. Colors represent the mean expression value, as indicated at the top right side.
Table 3.
Some differentially abundant proteins related to stress and leaf development.
3.9. Functional Networks of the Differentially Expressed Proteins
For proteins’ interaction network, the confidence (score) cutoff value 20 with maximum additional interactors of 60 was adjusted. The nodes denote the proteins, and lines between the nodes showed PPI modes. The network analysis showed that higher co-expression with interactor score of ≥5 was found between putative resistance proteins (Q0DCX5 and Q69MT5), WUSCHEL-related homeobox 4 (Q7XTV3), cellulose synthase A catalytic subunit 9 (Q69P51), myosin-like protein (A0A0N7KS97), lateral organ boundaries (LOB) domain protein-like proteins (Q6K713 and Q5KQR7), auxin response factor 16 (A3B9A0), Kelch repeat-containing protein (Q6ZXK6), transcriptional activator-like (Q6K6Q6), probable indole-3-acetic acid-amido synthetase (P0C0M3), AP2/EREBP transcription factor-like proteins (Q6K5Y1 and A0A0N7KSS8), putative OsNAC7 protein (Q6K539) and anthranilate synthase alpha subunit 2, chloroplastic (Q9XJ29) (Figure 7).
Figure 7.
STRING predicted functional network of differentially accumulated proteins association in GXU16-19 compared with GXU16. Differentially accumulated proteins are represented by a node, whereas different grey lines represent evidence for the predicted functional relationship.
3.10. Gene Ontology (GO) Annotation of Up- and Downregulated Proteins
GO annotation for upregulated proteins related to molecular function (MF) showed that most of the DEPs participated in binding, catalytic, transporter, and antioxidant activities. For cellular component (CC), the upregulated DEPs were largely enriched in the cell part, membrane part, organelle part, organelle, protein-containing complex, and extracellular region. For the biological process (BP), the upregulated DEPs were mainly enriched in the cellular process, metabolic process, biological regulation, and response to a stimulus (Figure 8A). GO terms for MF showed that most of the downregulated DEPs were involved in binding and catalytic activity. CC terms showed that the downregulated DEPs were mainly enriched in the cell part, organelle, membrane part, protein-containing complex, and organelle part. The GO terms for BP showed that most of the downregulated DEPs were involved in the cellular and metabolic processes (Figure 8B).
Figure 8.
Gene Ontology (GO) pathways of upregulated (A) and downregulated (B) proteins. The number of proteins is shown in each bar. MF; molecular function, CC; cellular component; BP; biological process.
3.11. Kyoto Encyclopedia of Genes and Genomes (KEGG) Pathway Enrichment Analysis of Up- and Downregulated Proteins
Enrichment analysis was performed with p-value ≤ 0.05 as significantly enriched in DEPs. KEGG analysis of upregulated DEPs revealed metabolic pathways, biosynthesis of secondary metabolites, and carbon metabolism, while other pathways showed a smaller number of proteins involved (Figure 9A). The downregulated DEPS were significantly enriched in metabolic pathways, ribosome, biosynthesis of secondary metabolites, glutathione metabolism, carbon metabolism, fatty acid metabolism, biosynthesis of amino acids, and carbon fixation, while other pathways showed few proteins involved (Figure 9B).
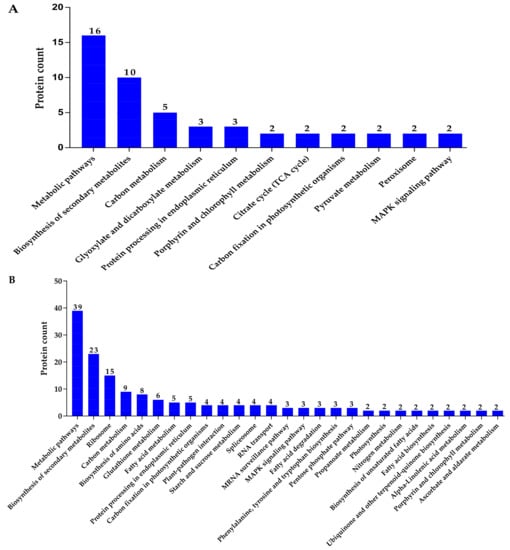
Figure 9.
KEGG pathway enrichment histogram for upregulated (A) and downregulated proteins (B). The number of proteins involved in each pathway is given on the bars of the graph.
3.12. Hub-Protein Analysis
Our analyses revealed that Os09g0572000 protein (B7F8P7), putative auxin transporter-like protein 4 (Q53JG7), LOB domain protein-like (Q6K713, Q5KQR7, Q8LQH4, and Q7XGL4), probable indole-3-acetic acid-amido synthetase GH3.4 (Q60EJ6), protein Monoculm 1 (Q84MM9), AP2/EREBP transcription factor baby boom1, putative, expressed (A0A0N7KSS8), and AP2 domain-containing protein, expressed (Q10A97) were the top ten hub-proteins among all DEPs (Figure 10).
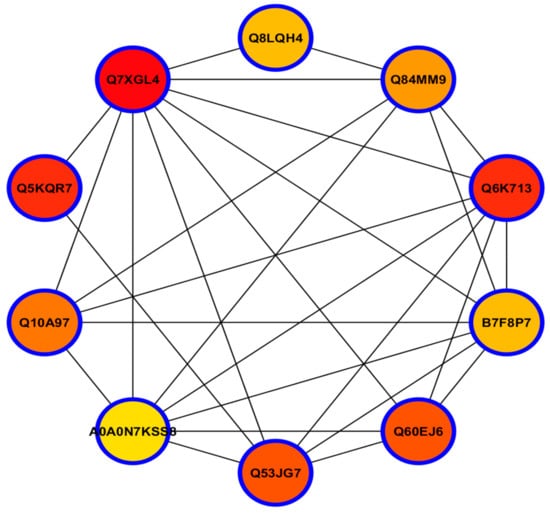
Figure 10.
Top ten hub-proteins selected from total DEPs. Nodes represent proteins, and edges (lines) indicate connections between the nodes, with a maximum of the top five highly connected hub proteins. The more forward ranking is indicated by redder color.
3.13. Expression Analysis of Target Genes Quantitative Real-Time-PCR Validation of DEPs
Results showed that the expression of SRL1 and SRL2 was significantly suppressed in mutant lines (Figure 11A). To verify the proteomic results, five DEPs associated genes were randomly selected, including proteasome subunit alpha type-2 (PAB1), the mediator of RNA polymerase II transcription subunit 17 (MED17), ethylene response factor (Snorkel 2), pathogenesis-related protein (Pr1b), and pathogenesis-related protein (Pr1a). The RT-qPCR results were consistent with the proteomic analyses (Figure 11B).
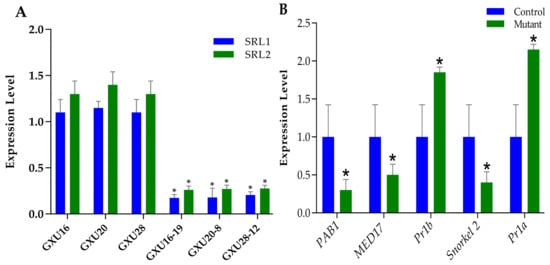
Figure 11.
Real-time quantitative PCR analysis. (A) Expression analysis of SRL1 and SRL2 and, (B) five selected DEPs responsive genes. The data were analyzed by three independent repeats. * indicates significant differences in expression level, Student’s t-test, p ≤ 0.01.
3.14. Performance of Semi-Rolled Leaf Hybrids Produced by Wild Type and Mutant Rolled Leaf Restorers
The performance of the hybrids was investigated and was compared with those hybrids produced by the WT restorers crossed with the same CMS lines. The hybrids (36A/GXU16, 52A/GXU16, 36A/GXU20, 52A/GXU20, 36A/GXU28, and 52A/GXU28) produced from WT restorer lines showed flat-leaf type, but the hybrids (36A/GXU16-19, 52A/GXU16-19, 36A/GXU20-8, 52A/GXU20-8, 36A/GXU28-12, and 52A/GXU28-12) developed from mutant restorer lines showed the semi-rolled leaf phenotype (Figure S5). The results revealed that the other agronomic characteristics, such as plant height, panicle length, seed set rate, grain weight, grain length, and grain width, were the same with the hybrids produced by WT restorers (Table 4). However, two major yield components, the panicle number and grain number per panicle, were significantly increased from 7.8 to 10.5 and 134 to 170, respectively, in the hybrids produced by mutant restorers. The yield per plant was also significantly increased from 29.7g to 44.5g, in hybrids produced by mutant restorers. These results showed that the hybrids produced by mutant restorers resulted in significant yield heterosis (Table 4).
Table 4.
Main agronomic traits of the F1 hybrids produced from wild type and mutant rolled leaf restorers.
4. Discussion
CRISPR/Cas9 based mutations were successfully generated, and homozygous, heterozygous, and WT plants were obtained in the T0 generation. These results suggest the efficiency of the CRISPR/Cas9 system in rice and the generation of homozygous mutants in the T0 generation without any off-target events. Previous studies also suggested that Cas9 seldom tempts off-target mutations and concluded that the off-target rate in rice is very low [20,21]. In our study, we screened the T-DNA free plants at a frequency of 40.2%, and expression of SRL1 and SRL2 was significantly depressed in the mutant plants. Under normal conditions, mutant lines displayed an 87% leaf rolling index, decreased agronomic character, transpiration rate, stomatal conductance, chlorophyll content, VB, number of stomata, while panicles number, and BCs were significantly increased. Rolled leaf mutants possess low net photosynthesis rate and chlorophyll content, resulting in less yield compare to WT at low plant intensity [3]. The mutant plants conferred drought tolerance and showed higher ABA content, anti-oxidants activities, and survival rate at the seedling stage. Under drought stress, the mutant plants showed higher grain filling percentage than WTs at maturity. Previous studies also showed that leaf rolling and increased BCs have a positive role in stress tolerance by adjusting transpiration [34,35]. ABA is significantly induced by drought stress and plays a role in triggering the enhanced ROS generation [36]. In previous studies, mutations in the rice OsCHR4 gene induce narrow and rolled leaves with increased cuticular wax resulting in reduced water loss rate and enhanced drought tolerance [5]. The knockdown of rice microRNA166, using the short tandem target mimic (STTM) system, resulted in rolled-leaf phenotype, morphological changes that confer drought resistance. STTM166 plants had smaller BCs, reduced stomatal conductance, and showed decreased transpiration rates [37].
To ensure the fidelity of biological conclusions, it is important to confirm the success of any gene editing at the protein level. Recently, researchers have successfully edited OsGA20ox2 in rice and studied the proteome-wide changes that were induced [38]. Here, the iTRAQ-based proteomic approach was applied both to confirm protein level changes induced by gene editing and to measure the proteome-wide changes that occur in response to the system perturbation in a single experiment. A total of 377 differentially abundant proteins were identified, containing 107 upregulated proteins and 270 downregulated proteins. The KEGG analysis showed that up- and downregulated proteins were mostly enriched in the biosynthesis of secondary metabolites, metabolic pathways, and carbon metabolism. Metabolic responses play a significant role in drought stress within a variety of plant species, and different metabolic adjustments were observed under water-deficit stress [39,40,41]. Secondary metabolites, such as phenolic acid and flavonoids, described as markers of abiotic and biotic stress tolerance, are ubiquitous in the plant kingdom [42]. Carbon metabolism helps the plants decrease photosynthetic carbon assimilation, which results in enhanced ROS production by disrupting cellular homeostasis [43].
GO analysis displayed that most of the DEPs were involved in binding, catalytic, transporter, and antioxidant activities. Proteins having binding and catalytic activities, such as DNA-binding proteins and tRNA-binding proteins, may be involved in the regulation of intra- and extra-cellular signals associated with sugar biosynthesis, development, and growth. Antioxidant components enhancement is a strategy to prevent oxidative damage under drought stress [36].
The proteins related to stress, including POD, SOD, ABA-ripening protein 5, HSP domain-containing protein, hydrolase_4 domain-containing protein, ParB domain-containing protein, NAD(P)-bd domain-containing protein, were upregulated. Antioxidants, POD and SOD are vital ROS-scavenging components in plants, and their increased expression resulted in drought tolerance in rice [36]. ABA-induced proteins are regulated by abiotic stresses, which are hydrophilically charged, low-molecular-weight, plant-specific proteins [44]. Heat shock proteins (HSPs) are ubiquitous proteins that function as molecular chaperons encoded by a multigene family and play important roles in abiotic stress tolerance [45]. NAD(P) domain proteins and respiratory burst oxidase homolog proteins (rbohs) are homologs that play a significant regulatory role in promoting ABA-induced stomatal closing, Ca2+ increase, and ROS production in plants [46].
Lateral organ boundaries (LOB) domain protein-like (LBD) (Q8L3S3, Q7XGL4, Q852M3, and Q8L4M5), glycosyltransferase, phosphoglycerate kinase, peptidylprolyl isomerase, and acyl-coenzyme A oxidase, were significantly accumulated in the rolled leaf mutant. The LBD gene family is a plant-specific transcription factor family with a coiled structure, having a potential role in lateral organ development, such as flowers, leaves, and roots. Forty-three members of the LBD gene family in rice have been identified. LOB domain proteins are negative regulators of cell proliferation in the adaxial side of leaves. [47]. Glycosyl hydrolases, acyl-coenzyme A oxidase, peptidylprolyl isomerase, and Phosphoglycerate kinase are common enzymes in plants having a crucial role in the degradation of biomass such as starch, cellulose, and hemicellulose [6].
In protein network analysis and hub-protein analysis, we found some proteins related to abiotic stress and leaf development. The proteins, including WUSCHEL-related homeobox 4, putative auxin transporter-like protein 4, LOB domain proteins, probable indole-3-acetic acid-amido synthetase GH3.4, protein Monoculm 1, AP2/EREBP transcription factor baby boom1 and AP2 domain-containing protein, were top co-expressed (Figure 10). Wuschel (WUS) plays a role in shoot apical meristem (SAM) maintenance, and its mutants display aborted SAM maintenance during embryonic and later developmental stages [48]. Monoculm 1 (MOC1) is the first cloned gene which is responsible for tiller formation in rice [49]. AP2/EREBPs (Apetala2/ethylene-responsive element-binding proteins) are involved in regulatory networks of response to pathogen attack, hormones, and environmental signals involving ERFs (ethylene-responsive factors) and DREBs (dehydration responsive element binding proteins) [50]. Hub-proteins reveal multiple dysregulated pathways. Highly connected hub nodes are central to a network’s architecture and function. Unsupervised hierarchical clustering analysis based on the hub protein expression profiles showed that the identified top hub proteins serve as a molecular signature to differentiate CRISPR/cas9 mutants and WTs. The proteomic results were validated by performing RT-qPCR for five selected genes (PAB1, MED17, Snorkel 2, Pr1b, and Pr1a). As expected, the results were found to be correlated with proteomic data (Figure 11A). In the top twenty proteins, the ribosome assembly factor mrt4 and PsbP domain-containing protein were highly expressed in mutant while peptidyl-prolyl cis-trans isomerase showed higher expression level in WT. The psbP proteins have been reported to be differentially expressed under abiotic stress, while ribosomal proteins have been differentially regulated under both biotic and abiotic stresses [51,52]. Peptidyl prolyl cis-trans isomerase (PPIase) plays a role under drought stress by different regulatory pathways in the presence of both cyclophilins (Cyps) and FK506-binding proteins (FKBPs) [53].
The hybrids produced from mutant restorers showed semi-rolled leaf phenotype, increased panicle number, grain number per panicle, and grain yield per. This indicates that the semi-rolled leaf hybrids have more reasonable plant types and the use of one roll leaf parent crossing with another flat-leaf parent to produce a semi-rolled leaf hybrid is helpful to produce an ideal plant type. The hybrids showed an intermediated leaf phenotype to the WTs and mutant plants, which may be due to incomplete dominance. These incomplete dominance loci should play an important role in leaf rolling, which implies that dominance is an important contributor to heterosis in hybrid breeding. The generation of numerous F1 crossed will provide efficient ways to study the mechanism underlying this phenomenon. This study opens an era of research that deserves more attention in the future, including the generation of more suitable mutant populations via CRISPR/Cas9 and the development of more powerful genomic and statistical analysis frameworks.
Our results provide a unique molecular mechanism underlying rice leaf rolling. According to our knowledge, many studies have been carried out on leaf rolling, but there was no study found based on the CRISPR/Cas9-generated rolled leaf mutants and iTRAQ based proteomic analysis of directed mutations. The employment of CRISPR/Cas9 and proteomics together will open a new way to understand the effect of single or multiple gene mutations on the whole proteome. Many identified proteins in our study were different from previous studies because the rolled leaf mutants were generated by nucleases-based mutagenesis at different frequencies of mutations. The hybrids produced in this study are usually more valuable to commercial growers and have worthwhile advantages to plant breeders to produce new and better cultivars by employing modern technologies. Further studies are warranted to explore the molecular regulatory mechanism underlying rolled leaf mutants and to devise strategies for improving the rice phenotype and drought tolerance.
5. Conclusions
In summary, the present study added some novel insights into the functional role of SRL1 and SRL2. CRISPR mutants influence the expression of many proteins that directly affect the different BP, CC, and MF pathways. The up- and downregulation of stress-related proteins showed that rolled leaf mutants play a role in abiotic stress tolerance. Further study with these mutants will help to gain a better understanding of regulatory pathways involved in leaf rolling and abiotic stress tolerance. The downregulation of LBD proteins in rolled leaf mutants will bring a sharp focus in future molecular breeding of rice. Identified uncharacterized and known hub-genes will provide the correlative support to study the leaf rolling and abiotic stress tolerance in rice. Undoubtedly, homozygous mutants with heritable mutations lacking off-target effects and T-DNA will provide the basic breeding material for the development of new rice varieties for water deficit areas. We provided the molecular evidence that rolled leaf CRISPR mutants affected the expression of different proteins and showed that drought tolerance could be improved by developing rolled leaf genotypes. Moreover, the semi-rolled leaf hybrids produced from mutant restorers provide the basic idea to fast track the breeding system and to improve the plant architecture and yield. These results might pave the way for understanding the gene action and inheritance pattern of CRISPR/Cas9 generated mutants.
Supplementary Materials
The following are available online at https://www.mdpi.com/2073-4395/9/11/728/s1, Table S1: List of primers used in this study; Table S2: Efficiency score and positions all targets; Table S3: Primers used for off-target analysis; Table S4: Detection of mutations on the putative off-target sites; Figure S1: (A) Sequence and position of both targets of and target-specific primers in SRL1. (B) The structure of the SRL1 gene and an illustration of both target sites in exon2 and exon3. (C) Sequence and position of both targets of and target-specific primers in SRL2. (D) The structure of SRL2 and illustration of both target sites in exon1 and exon1. Yellow highlighted sequences represent target sites; PAM (protospacer adjacent motif) is green highlighted, and target-specific primers are purple highlighted. The black box represents the exon regions, and the lines between them indicate introns. T1 and T2 represent target1 and target2, respectively; Figure S2: Schematic representation of secondary structures of (A) sgRNA1; (B) sgRNA2; (C) sgRNA3 and (D) sgRNA4 used in the experiment. Figure S3: (A) Mutation rates of all targets in T0 generation; Figure S4: The gel electrophoresis results of T-DNA free plants; Figure S5: Morphological performance of hybrid plants of mutant roll leaf restorers (A,B). Open field population of semi roll leaf hybrids (C).
Author Contributions
Conceptualization, S.L., X.Q., and L.L.; Data curation, L.L., B.U., and G.N.; Formal analysis, X.Q. and X.W.; Funding acquisition, R.L.; Investigation, S.L., L.L., Y.H., B.U., and N.Z.; Methodology, S.L., X.Q., Y.H., X.W., G.N., Y.L., and R.L.; Resources, R.L.; Software, B.U., G.N., N.Z., and Y.L.; Supervision, Y.L. and R.L.; Validation, Y.L. and R.L.; Writing – original draft, B.U. and G.N.; Writing – review & editing, B.U., G.N., and R.L..
Funding
This research was funded by the Key Technology Research and Development Program Guike, Guangxi (Guike AB16380066; Guike AB16380093).
Acknowledgments
We would like to thank Mohsin Niaz, Baoxiang Qin, and Fang Liu for the helpful discussion and invaluable comments to make this research meaningful. We are highly grateful to Yaoguang Liu for providing us the vector and promoters for the experiment.
Conflicts of Interest
The authors declare that they have no competing interests.
Accession Numbers
Sequence data from this article can be found in the GenBank data library under accession numbers GenBank: KR029105, KR029107, KR029108, and KR559259 for the sgRNA intermediate plasmids and GenBank: KR029109 for the CRISPR/Cas9 binary vector.
References
- Walter, A.; Silk, W.K.; Schurr, U. Environmental effects on spatial and temporal patterns of leaf and root growth. Annu. Rev. Plant Biol. 2009, 60, 279–304. [Google Scholar] [CrossRef]
- Zhu, D.; Lin, X.; Cao, W. Comparison of leaf photosynthetic characteristics among rice hybrids with different leaf rolling index. Zuo Wu Xue Bao 2001, 27, 329–333. [Google Scholar]
- Lang, Y.; Zhang, Z.; Gu, X.; Yang, J.; Zhu, Q. Physiological and ecological effects of crimpy leaf character in rice (Oryza sativa L.) I. Leaf orientation, canopy structure and light distribution. Zuo Wu Xue Bao 2004, 30, 806–810. [Google Scholar]
- Kadioglu, A.; Terzi, R. A dehydration avoidance mechanism: Leaf rolling. Bot. Rev. 2007, 73, 290–302. [Google Scholar] [CrossRef]
- Guo, T.; Wang, D.; Fang, J.; Zhao, J.; Yuan, S.; Xiao, L.; Li, X. Mutations in the Rice OsCHR4 Gene, Encoding a CHD3 Family Chromatin Remodeler, Induce Narrow and Rolled Leaves with Increased Cuticular Wax. Int. J. Mol. Sci. 2019, 20, 2567. [Google Scholar] [CrossRef] [PubMed]
- Xiang, J.J.; Zhang, G.H.; Qian, Q.; Xue, H.W. Semi-rolled leaf1 encodes a putative glycosylphosphatidylinositol-anchored protein and modulates rice leaf rolling by regulating the formation of bulliform cells. Plant Physiol. 2012, 159, 1488–1500. [Google Scholar] [CrossRef] [PubMed]
- Yuan, L.; Denning, G.; Mew, T. Hybrid Rice Breeding for Super High Yield; Denning, G.L., Mew, T.W., Eds.; Chinese Academy of Agricultural Sciences: Beijing, China, 1998; pp. 10–12. [Google Scholar]
- Chen, Z.; Zuo, S.; Zhang, Y.; Li, L.; Pan, X.; Ma, Y. Current progress in genetics research and breeding application of rolled leaf in rice. J. Yangzhou Univ. Agric. Life Sci. 2010, 31, 22–27. [Google Scholar]
- Xu, Y.; Wang, Y.; Long, Q.; Huang, J.; Wang, Y.; Zhou, K.; Zheng, M.; Sun, J.; Chen, H.; Chen, S. Overexpression of OsZHD1, a zinc finger homeodomain class homeobox transcription factor, induces abaxially curled and drooping leaf in rice. Planta 2014, 239, 803–816. [Google Scholar] [CrossRef] [PubMed]
- Li, L.; Shi, Z.Y.; Li, L.; Shen, G.Z.; Wang, X.Q.; An, L.S.; Zhang, J.L. Overexpression of ACL1 (abaxially curled leaf 1) increased bulliform cells and induced abaxial curling of leaf blades in rice. Mol. Plant 2010, 3, 807–817. [Google Scholar] [CrossRef]
- Chen, Q.; Xie, Q.; Gao, J.; Wang, W.; Sun, B.; Liu, B.; Zhu, H.; Peng, H.; Zhao, H.; Liu, C. Characterization of Rolled and Erect Leaf 1 in regulating leave morphology in rice. J. Exp. Bot. 2015, 66, 6047–6058. [Google Scholar] [CrossRef]
- Yang, S.Q.; Li, W.Q.; Miao, H.; Gan, P.F.; Qiao, L.; Chang, Y.L.; Shi, C.H.; Chen, K.M. REL2, a gene encoding an unknown function protein which contains DUF630 and DUF632 domains controls leaf rolling in rice. Rice 2016, 9, 37. [Google Scholar] [CrossRef] [PubMed]
- Li, M.; Xiong, G.; Li, R.; Cui, J.; Tang, D.; Zhang, B.; Pauly, M.; Cheng, Z.; Zhou, Y. Rice cellulose synthase-like D4 is essential for normal cell-wall biosynthesis and plant growth. Plant J. 2009, 60, 1055–1069. [Google Scholar] [CrossRef] [PubMed]
- Hu, J.; Zhu, L.; Zeng, D.; Gao, Z.; Guo, L.; Fang, Y.; Zhang, G.; Dong, G.; Yan, M.; Liu, J. Identification and characterization of NARROW ANDROLLED LEAF 1, a novel gene regulating leaf morphology and plant architecture in rice. Plant Mol. Biol. 2010, 73, 283–292. [Google Scholar] [CrossRef] [PubMed]
- Luan, W.; Liu, Y.; Zhang, F.; Song, Y.; Wang, Z.; Peng, Y.; Sun, Z. OsCD1 encodes a putative member of the cellulose synthase-like D sub-family and is essential for rice plant architecture and growth. Plant Biotech. J. 2011, 9, 513–524. [Google Scholar] [CrossRef]
- Fang, L.; Zhao, F.; Cong, Y.; Sang, X.; Du, Q.; Wang, D.; Li, Y.; Ling, Y.; Yang, Z.; He, G. Rolling-leaf14 is a 2OG-Fe (II) oxygenase family protein that modulates rice leaf rolling by affecting secondary cell wall formation in leaves. Plant Biotech. J. 2012, 10, 524–532. [Google Scholar] [CrossRef]
- Yang, C.; Li, D.; Liu, X.; Ji, C.; Hao, L.; Zhao, X.; Li, X.; Chen, C.; Cheng, Z.; Zhu, L. OsMYB103L, an R2R3-MYB transcription factor, influences leaf rolling and mechanical strength in rice (Oryza sativa L.). BMC Plant Biol. 2014, 14, 158. [Google Scholar] [CrossRef]
- Li, W.Q.; Zhang, M.J.; Gan, P.F.; Qiao, L.; Yang, S.Q.; Miao, H.; Wang, G.F.; Zhang, M.M.; Liu, W.T.; Li, H.F. CLD 1/SRL 1 modulates leaf rolling by affecting cell wall formation, epidermis integrity and water homeostasis in rice. Plant J. 2017, 92, 904–923. [Google Scholar] [CrossRef]
- Liu, X.; Li, M.; Liu, K.; Tang, D.; Sun, M.; Li, Y.; Shen, Y.; Du, G.; Cheng, Z. Semi-Rolled Leaf2 modulates rice leaf rolling by regulating abaxial side cell differentiation. J. Exp. Bot. 2016, 67, 2139–2150. [Google Scholar] [CrossRef]
- Han, Y.; Luo, D.; Usman, B.; Nawaz, G.; Zhao, N.; Liu, F.; Li, R. Development of high yielding glutinous cytoplasmic male sterile rice (Oryza sativa L.) lines through CRISPR/Cas9 based mutagenesis of Wx and TGW6 and proteomic analysis of anther. Agronomy 2018, 8, 290. [Google Scholar] [CrossRef]
- Nawaz, G.; Han, Y.; Usman, B.; Liu, F.; Qin, B.; Li, R. Knockout of OsPRP1, a gene encoding proline-rich protein, confers enhanced cold sensitivity in rice (Oryza sativa L.) at the seedling stage. 3 Biotech 2019, 9, 254. [Google Scholar] [CrossRef]
- Ma, X.; Zhang, Q.; Zhu, Q.; Liu, W.; Chen, Y.; Qiu, R.; Wang, B.; Yang, Z.; Li, H.; Lin, Y. A robust CRISPR/Cas9 system for convenient, high-efficiency multiplex genome editing in monocot and dicot plants. Mol. Plant 2015, 8, 1274–1284. [Google Scholar] [CrossRef] [PubMed]
- Bikard, D.; Jiang, W.; Samai, P.; Hochschild, A.; Zhang, F.; Marraffini, L.A. Programmable repression and activation of bacterial gene expression using an engineered CRISPR-Cas system. Nucleic Acids Res. 2013, 41, 7429–7437. [Google Scholar] [CrossRef] [PubMed]
- Evans, C.; Noirel, J.; Ow, S.Y.; Salim, M.; Pereira-Medrano, A.G.; Couto, N.; Pandhal, J.; Smith, D.; Pham, T.K.; Karunakaran, E. An insight into iTRAQ: Where do we stand now? Anal. Bioanal. Chem. 2012, 404, 1011–1027. [Google Scholar] [CrossRef] [PubMed]
- Wang, J.; Islam, F.; Li, L.; Long, M.; Yang, C.; Jin, X.; Ali, B.; Mao, B.; Zhou, W. Complementary RNA-sequencing based transcriptomics and iTRAQ proteomics reveal the mechanism of the alleviation of quinclorac stress by salicylic acid in Oryza sativa ssp. japonica. Int. J. Mol. Sci. 2017, 18, 1975. [Google Scholar] [CrossRef]
- Hiei, Y.; Ohta, S.; Komari, T.; Kumashiro, T. Efficient transformation of rice (Oryza sativa L.) mediated by Agrobacterium and sequence analysis of the boundaries of the T-DNA. Plant J. 1994, 6, 271–282. [Google Scholar] [CrossRef]
- Ma, X.; Chen, L.; Zhu, Q.; Chen, Y.; Liu, Y.G. Rapid decoding of sequence-specific nuclease-induced heterozygous and biallelic mutations by direct sequencing of PCR products. Mol. Plant 2015, 8, 1285–1287. [Google Scholar] [CrossRef]
- Lichtenthaler, H.K. Chlorophylls and carotenoids: Pigments of photosynthetic biomembranes. Methods Enzymol. 1987, 148, 350–382. [Google Scholar] [CrossRef]
- Zhu, G.; Ye, N.; Zhang, J. Glucose-induced delay of seed germination in rice is mediated by the suppression of ABA catabolism rather than an enhancement of ABA biosynthesis. Plant Cell Physiol. 2009, 50, 644–651. [Google Scholar] [CrossRef]
- Heath, R.L.; Packer, L. Photoperoxidation in isolated chloroplasts: II. Role of electron transfer. Arch. Biochem. Biophys. 1968, 125, 850–857. [Google Scholar] [CrossRef]
- Giannopolitis, C.N.; Ries, S.K. Superoxide dismutases: I. Occurrence in higher plants. Plant Physiol. 1977, 59, 309–314. [Google Scholar] [CrossRef]
- Aebi, H. Catalase in vitro. Methods Enzymol. 1984, 105, 121–126. [Google Scholar] [CrossRef] [PubMed]
- Wang, Z.Q.; Xu, X.Y.; Gong, Q.Q.; Xie, C.; Fan, W.; Yang, J.L.; Lin, Q.S.; Zheng, S.J. Root proteome of rice studied by iTRAQ provides integrated insight into aluminum stress tolerance mechanisms in plants. J. Proteom. 2014, 98, 189–205. [Google Scholar] [CrossRef] [PubMed]
- O’Toole, J.C.; Cruz, R.T. Response of leaf water potential, stomatal resistance, and leaf rolling to water stress. Plant Physiol. 1980, 65, 428–432. [Google Scholar] [CrossRef] [PubMed]
- De Micco, V.; Aronne, G. Morpho-anatomical traits for plant adaptation to drought. Plant Res. Drought Stress 2012, 37–61. [Google Scholar] [CrossRef]
- Jiang, M.; Zhang, J. Water stress-induced abscisic acid accumulation triggers the increased generation of reactive oxygen species and up-regulates the activities of antioxidant enzymes in maize leaves. J. Exp. Bot. 2002, 53, 2401–2410. [Google Scholar] [CrossRef]
- Zhang, J.; Zhang, H.; Srivastava, A.K.; Pan, Y.; Bai, J.; Fang, J.; Shi, H.; Zhu, J.K. Knockdown of rice microRNA166 confers drought resistance by causing leaf rolling and altering stem xylem development. Plant Physiol. 2018, 176, 2082–2094. [Google Scholar] [CrossRef]
- Han, Y.; Teng, K.; Nawaz, G.; Feng, X.; Usman, B.; Wang, X.; Luo, L.; Zhao, N.; Liu, Y.; Li, R. Generation of semi-dwarf rice (Oryza sativa L.) lines by CRISPR/Cas9-directed mutagenesis of OsGA20ox2 and proteomic analysis of unveiled changes caused by mutations. 3 Biotech 2019, 9, 387. [Google Scholar] [CrossRef]
- Ullah, N.; Yüce, M.; Gökçe, Z.N.Ö.; Budak, H. Comparative metabolite profiling of drought stress in roots and leaves of seven Triticeae species. BMC Gen. 2017, 18, 969. [Google Scholar] [CrossRef]
- Guo, R.; Shi, L.; Jiao, Y.; Li, M.; Zhong, X.; Gu, F.; Liu, Q.; Xia, X.; Li, H. Metabolic responses to drought stress in the tissues of drought-tolerant and drought-sensitive wheat genotype seedlings. AoB Plants 2018, 10, ply016. [Google Scholar] [CrossRef]
- Urano, K.; Maruyama, K.; Ogata, Y.; Morishita, Y.; Takeda, M.; Sakurai, N.; Suzuki, H.; Saito, K.; Shibata, D.; Kobayashi, M. Characterization of the ABA-regulated global responses to dehydration in Arabidopsis by metabolomics. Plant J. 2009, 57, 1065–1078. [Google Scholar] [CrossRef]
- Torras-Claveria, L.; Jáuregui, O.; Codina, C.; Tiburcio, A.F.; Bastida, J.; Viladomat, F. Analysis of phenolic compounds by high-performance liquid chromatography coupled to electrospray ionization tandem mass spectrometry in senescent and water-stressed tobacco. Plant Sci. 2012, 182, 71–78. [Google Scholar] [CrossRef] [PubMed]
- Noctor, G.; Mhamdi, A.; Foyer, C.H. The roles of reactive oxygen metabolism in drought: Not so cut and dried. Plant Phys. 2014, 164, 1636–1648. [Google Scholar] [CrossRef] [PubMed]
- Dai, J.R.; Liu, B.; Feng, D.R.; Liu, H.Y.; He, Y.M.; Qi, K.B.; Wang, H.B.; Wang, J.F. MpAsr encodes an intrinsically unstructured protein and enhances osmotic tolerance in transgenic Arabidopsis. Plant Cell Rep. 2011, 30, 1219–1230. [Google Scholar] [CrossRef] [PubMed]
- Vierling, E. The roles of heat shock proteins in plants. Annu. Rev. Plant Biol. 1991, 42, 579–620. [Google Scholar] [CrossRef]
- Torres, M.A.; Onouchi, H.; Hamada, S.; Machida, C.; Hammond-Kosack, K.E.; Jones, J.D. Six Arabidopsis thaliana homologues of the human respiratory burst oxidase (gp91phox). Plant. J. 1998, 14, 365–370. [Google Scholar] [CrossRef] [PubMed]
- Shuai, B.; Reynaga-Pena, C.G.; Springer, P.S. The lateral organ boundaries gene defines a novel, plant-specific gene family. Plant Physiol. 2002, 129, 747–761. [Google Scholar] [CrossRef]
- Mayer, K.F.; Schoof, H.; Haecker, A.; Lenhard, M.; Jürgens, G.; Laux, T. Role of WUSCHEL in regulating stem cell fate in the Arabidopsis shoot meristem. Cell 1998, 95, 805–815. [Google Scholar] [CrossRef]
- Li, X.; Qian, Q.; Fu, Z.; Wang, Y.; Xiong, G.; Zeng, D.; Wang, X.; Liu, X.; Teng, S.; Hiroshi, F. Control of tillering in rice. Nature 2003, 422, 618. [Google Scholar] [CrossRef]
- Jisha, V.; Dampanaboina, L.; Vadassery, J.; Mithöfer, A.; Kappara, S.; Ramanan, R. Overexpression of an AP2/ERF type transcription factor OsEREBP1 confers biotic and abiotic stress tolerance in rice. PLoS ONE 2015, 10, e0127831. [Google Scholar] [CrossRef]
- Sharma, A.D.; Singh, P. Comparative studies on drought-induced changes in peptidyl prolyl cis–trans isomerase activity in drought-tolerant and susceptible cultivars of Sorghum bicolor. Curr. Sci. 2003, 84, 911–918. [Google Scholar]
- Fromont-Racine, M.; Senger, B.; Saveanu, C.; Fasiolo, F. Ribosome assembly in eukaryotes. Gene 2003, 313, 17–42. [Google Scholar] [CrossRef]
- Bai, J.; Yan, Q.; Jinghui, L.; Yuqing, W.; Rula, S.; Na, Z.; Ruizong, J. Proteomic response of oat leaves to long-term salinity stress. Environ. Sci. Pollut. Res. 2017, 24, 3387. [Google Scholar] [CrossRef] [PubMed]


© 2019 by the authors. Licensee MDPI, Basel, Switzerland. This article is an open access article distributed under the terms and conditions of the Creative Commons Attribution (CC BY) license (http://creativecommons.org/licenses/by/4.0/).