Abstract
Nitrate vulnerable zones (NVZs) are areas considered to be at high risk of water pollution due to an excess of nitrates and, according to European regulations, codes of good agricultural practice are to be implemented by farmers, such as reducing doses of the applied fertilizers, or the use of fertilizers that minimize nitrate leaching. In this work, the influence of organic fertilization with dried pig manure (DPM) as compared to mineral fertilization with ammonium sulfate nitrate with 3,4-dimethylpyrazole phosphate nitrification inhibitor was studied in a barley crop planted in a NVZ in Fompedraza (Valladolid, Spain). Organic and mineral fertilizers were applied at different rates (85, 133 and 170 kg N·ha−1·year−1 vs. 90 and 108 kg N·ha−1·year−1, respectively) over a three-year period, in a randomized complete block design with six treatments and four blocks. DPM-based fertilization resulted in a 65% increase in crop yield as compared to the control soil, reaching 1800 kg·ha−1 for an application rate of 85 kg N·ha−1·year−1. Higher DPM rates were found to increase the electrical conductivity and assimilable phosphorus, potassium, magnesium and organic matter contents, but did not lead to yield enhancements. Final nitrate and ammonium concentrations were lower than 10 mg·kg−1 and 20 mg·kg−1, respectively, and no increase in soil salinity or heavy metal pollution was observed. DPM fertilization should be supplemented with small doses of inorganic fertilizers to obtain crop yields similar to those attained with mineral fertilization.
1. Introduction
Changes in the management of traditional livestock farms have resulted in greater intensification of production and a high concentration of farms in small rural areas. This has led to excessive disposal of pig slurry in agricultural soils which has become a major environmental problem in several European countries [1,2,3,4]. This problem is particularly serious in Spain, which—with over 43 million pigs—is the second largest producer in the European Union (EU) [5].
The aforementioned intensive direct spreading of manure as a fertilizer has occasioned a high concentration of nitrates in surface and sub-surface water sources in certain areas, which—in accordance with European Regulation (91/676/CEE) [6]—have been declared nitrate vulnerable zones or NVZs (when 50 mg nitrates·L−1 concentration was exceeded). Nitrate levels in the range of 25–50 mg·L−1 of nitrate are considered dangerous to human health and to the environment. Water pollution due to N causes eutrophication and acidification in fresh water, and may cause cancer and infant methemoglobinemia in drinking water [7].
In order to prevent and reduce this excess of nutrients (nitrates) in agricultural soils, the EU Directive obliges member states to take action in order to minimize risks by applying codes of good agricultural practice. To solve excess manure production, the Spanish public administration promoted cogeneration plants in areas with a high concentration of pig farms, particularly in those classified as NVZs. In these plants, the surplus of thermal energy produced by the combined heat and power unit (which uses biogas derived from an anaerobic digestion process) is used to dry the solid fraction of digestate or manure. This results in nutrient (N, P and K) and organic matter concentration and recovery. The dried end-product features a low water content and can be regarded as a less problematic bio-fertilizer with a reduced odorous nuisance [8].
Organic solid waste materials primarily contain nitrogen in its organic form, which reduces nitrate-leaching capacity, since the organic nitrogen mineralization process is slower than the NH4+-N nitrification process. Their application can also initially generate the immobilization of plant- available N (mainly in crop residues and soil microorganisms) during the microbial decomposition of the organic matter of the residue [9,10,11]. Nonetheless, there are also negative aspects associated with the application of solid pig manure, since it may increase the risk of copper and zinc soil pollution [2,12,13].
As compared to organic fertilizers, the application of mineral fertilizers usually generates a higher residual effect in the soil (due to their NO3−N content) and increases the risk of leaching [14]. Nitrogen losses can be reduced by resorting to nitrification inhibitors, i.e., chemical compounds (such as 3,4-dimethylpyrazol phosphate, DMPP) that depress the activity of nitrifying bacteria and hence delay ammonium to nitrate conversion in the soil [15,16]. Their application can increase the nitrogen supply capacity over time and may enhance the nitrogen agronomic efficiency (NAE) and crop quality in some systems [15,17].
Both for mineral and organic fertilizers, dosages should be adjusted to the actual crop needs. Optimizing fertilizer application rate requires a trade-off between meeting the nutrient requirements of the crop and environmental friendliness (for example, the threshold for long-term application of pig manure from an environmental-safety perspective would be around 360 kg N·ha−1 [18]). In line with this, the goal of this study was to study fertilization alternatives for areas contaminated by nitrates in order to reach the expected yield goals while minimizing negative environmental side-effects, by: (1) assessing the effect on the performance and quality of the barley crop of different dried pig manure (DPM) rates in comparison to a mineral fertilizer with nitrification inhibitors; (2) evaluating the content of inorganic N concentration in the soil after three years of application; (3) determining possible contaminations by heavy metals; and (4) establishing if the nutrient requirements of the crop can be met with only DPM fertilization (without adverse effects).
2. Materials and Methods
2.1. Location
The experiment was carried out over a three-year period in a NVZ located in Fompedraza (Valladolid, Spain), at an altitude of 889 m.a.s.l. The climate in the region is semiarid continental Mediterranean, with low annual precipitation (425 mm), a minimum average air temperature of 3 °C and a maximum average air temperature of 18 °C. The mean temperatures and rainfall during the period of study are depicted in Figure 1 [19].
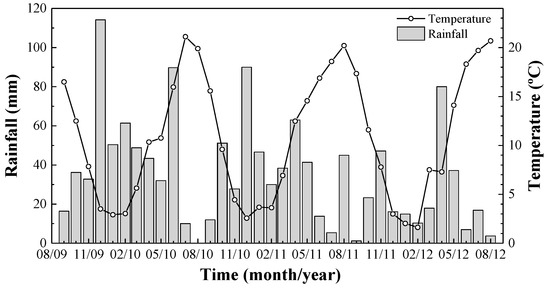
Figure 1.
Mean temperature and rainfall in the region under study over the three-year period (September 2009–August 2012).
All the cropping seasons showed similar temperatures. However, rainfall was highly variable from one year to another, with 535 mm, 465 mm and 276 mm in the 2009–2010, 2010–2011 and 2011–2012 seasons, respectively.
2.2. Soil Samples
Soil samples for analysis were collected before the field test and in the third year of the experiment, at the end of the growing season (after harvesting). Three independent samples were taken from each subplot, at two different depths (from 0 to 15 cm, S15; and from 15 to 30 cm, S30). All soil samples were air-dried, crushed, and sieved (θ < 2 mm) for homogenization purposes, and were stored in glass containers.
The physicochemical properties of the soil before fertilizer application are summarized in Table A1. The soil was rich in carbonates (28.7%). The phosphorus content, extracted by the Olsen method, was also high (22.1 mg kg−1), given that the high content in carbonates promotes the formation of insoluble calcium phosphate. Exchange cations saturated 100% of the cation exchange capacity, as one would expect in a basic pH soil.
2.3. Organic and Mineral Fertilizers
Two types of fertilizers were used. The organic fertilizer (DPM), resulting from the treatment of liquid and solid waste from pig farms, was collected from a cogeneration plant located in Fompedraza. The physico-chemical properties of the DPM are presented in Table A2.
The electrical conductivity (EC) had a high value (4.5 ± 2.2 mS·cm−1), indicating a high salt content in the waste material. The phosphorus content was also high (1.6 ± 0.7), so its application would, in most cases, meet the needs of the plants without adding a mineral supplement.
As regards the heavy metal content, 176.6 mg Cu·kg−1 and 745.6 mg Zn·kg−1 levels of copper and zinc were registered, respectively. Considering average concentrations of Cu in pig manure of around 600 mg·kg−1 [20] and 418 mg·kg−1 [21], the Cu content of the waste materials used in this study may be deemed to be low. Likewise, the Zn values of the waste materials used in this study may be deemed to be medium-low as compared to the 1514 mg·kg−1 and 625 mg·kg−1 reported by Shi et al. [22] and Lipoth et al. [21], respectively.
Apropos of the mineral fertilizer with nitrification inhibitor, ENTEC® 24 + 8 + 7 was used (supplied by EuroChem Agro Iberia, Barcelona, Spain). This commercial product contains 24% N (10.5% NO3−-N and 13.5% NH4+-N), 8% P2O5, 7% K2O, 5% SO3 and 0.8% DMPP nitrification inhibitor.
2.4. Experimental Design
The field test was performed following a randomized complete block design. The plot was divided into four blocks and each block was subdivided into six subplots of 6 × 10 m (60 m2), one per assayed treatment, with a 2 m spacing between subplots. The treatments applied during the three-year period (Table 1) were: control soil without fertilizer (T0); soil treated with mineral fertilizer at the usual rate applied in the region (T1); soil treated with mineral fertilizer according to crop needs (T2); DPM at an application rate of 85 kg N·ha−1·year−1 (T3); DPM at 133 kg N·ha−1·year−1 (T4); and DPM at 170 kg N·ha−1·year−1 (T5).

Table 1.
Fertilizer and KCl application rates, and nitrogen rates for the treatments.
In the subplots to which DPM treatment was applied, no additional mineral fertilizer was added, given that the crop P and K needs were met solely with the organic waste. A potassium supplement (60% KCl) had to be added to T2 treatment subplots to meet crop needs.
Since the plot under study was located in an area declared as a NVZ, the maximum application rate of DPM was limited to 170 kg N·ha−1 [23], which was the rate chosen for the T5 treatment.
In this study, the mineralization of N from soil organic matter (SOM) was not considered for the calculation of the fertilizer rate, reflecting the agricultural practices developed in the area of study. Thus, the N needs of the crop would be solely met by fertilizers.
The crop under study was barley (Hordeum vulgare L.), which was planted as an annual crop. Its nitrogen needs were estimated at 30 kg N·t−1, and crop production at 3000 kg·ha−1 for non-irrigated land [24]. Crop seeding was conducted in early March and harvesting took place in July. The organic fertilizers were applied one month before seeding, whereas the mineral fertilizers were applied one week before seeding. A minimum tillage system was used.
2.5. Methodology for Soil, Dried Pig Manure and Grain Analyses
For homogenization purposes, the soil samples were air-dried, ground using a ball mill (Retsch HM302; Biometa, Spain), and sieved at 2 mm mesh size.
The pH and EC determination was conducted for a suspension of the sample in water, at a 1:2.5 ratio for the soils and at a 1:10 ratio for the DPM. Texture was obtained by the pipette method [25]. Organic carbon was determined by the Walkley-Black procedure [26]. Available P was extracted with NaHCO3 according to Olsen et al. [27]. Total C and N were determined on a CNH Leco-2000 (Leco Corp., St. Joseph, MI, USA) analyzer. For the measurement of CaCO3 content, the CO2 released upon HCl addition was determined with a calcimeter. Na, K, Ca and Mg were extracted by ammonium acetate and determined using flame atomic absorption spectrometry with a Varian AA240FS spectrometer (Agilent Technologies, Santa Clara, CA, USA). Fe, Cu, Mn, Cr, Ni, Zn, Pb and Cd were determined by Zeeman atomic absorption spectrometry using a Varian AA240Z apparatus with GTA 120 graphite tube atomizer. NH4+-N concentration in soils was measured by colorimetric analysis in a 2 M KCl extract [28]. Nitrate in soil extracts was determined by dual-wavelength ultraviolet spectrophotometry [29] with a Shimadzu (Kyoto, Japan) UV-2450 ultraviolet-visible (UV-Vis) spectrophotometer. Organic matter, total N, NO3−-N and NH4+-N levels were measured—after barley harvesting—in samples taken at two depths (0–15 and 15–30 cm).
The barley yield was estimated considering the weight of the grains of 10 randomly picked spikes in subplots of 0.5 m2 sampling area. Subplots were hand-harvested, and the grains were separated from the straw once the whole plants had been dried in a stove.
2.6. Nitrogen Agronomic Efficiency Parameter (NAE)
To assess the efficiency of nitrogen utilization by the crop for each experimental subplot, the nitrogen agronomic efficiency (NAE) parameter based on the yield was chosen. The NAE (in kg kg−1) can be defined as the amount of additional grain harvested per kilogram of nitrogen applied to a grain crop (Equation (1)):
where YN is the grain yield (in kg·ha−1) of the treated plots, Y0 is the grain yield (in kg·ha−1) of the plot without N fertilization, and AN is the N fertilizer rate during barley growing season (in kg N·ha−1) [17,30,31].
NAE = (YN − Y0)/AN
2.7. Statistical Analyses
Statistical analyses were conducted with a mixed model for the analysis of variance (MIXED procedure in SAS). A separate analysis was carried out for the S15 (physicochemical properties, heavy metals and organic matter, nitrogen, nitrate, ammonium) and S30 (organic matter, nitrogen, nitrate and ammonium) soil data in the third year of the experiment. Data normality and variance homogeneity were verified prior to the analysis. Tukey’s multiple range test at 0.05 probability level (p < 0.05) was chosen for the post hoc comparison of means. SAS software v.9.2 (SAS Institute Inc., Cary, NC, USA) was used for all the statistical analyses.
3. Results and Discussion
3.1. Grain Yield, N Content and NAE
The response of the barley crop to the application of fertilization during the three-year study period is shown in Figure 2. The average barley grain yield in soils with fertilizer was higher than that of the unfertilized control soil (T0). The mineral fertilizer treatments (T1 and T2) resulted in higher yields than their organic counterparts (T3–T5), but no statistically significant differences were found. Mean production values were used in order to average out the effect of the environmental variations.
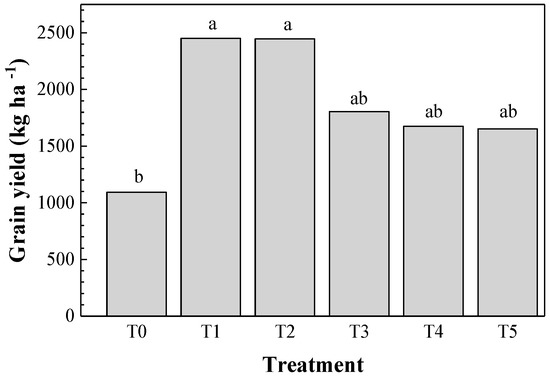
Figure 2.
Average barley grain yield for each treatment throughout the three-year period. Treatments labelled with the same lowercase letters were not significantly different at p < 0.05 using Tukey’s test.
Average barley grain yields were 1150 kg·ha−1 for the unfertilized control (T0), varied between 1650 and 1800 kg·ha−1 for the DPM treatments (T3–T5) and reached 2450 kg·ha−1 for the mineral fertilizer treatments (T1 and T2). In these latter cases, production was increased by 124% as compared to the control, while organic fertilizers led to an increase ranging from 51% (for T5) to 65% (for T3). This is in line with the findings of other studies [14,32], in which mineral fertilization also had a greater impact on crop yield and N content.
It is worth noting that the same average barley grain yield was obtained for T1 and T2 treatments. Thus, the application of the mineral fertilizer according to the needs of the crop (as is the case for T2, in agreement with López Bellido et al. [24]), would involve significant savings (18 kg N·ha−1) in comparison to the traditional mineral fertilization approach used in this region (T1).
The application of DPM as a fertilizer did not result in yields comparable to those usually attained with mineral fertilization (in 2010 and 2011), but differences were not statistically significant. Further, the increase in its application rate did not lead to a positive response in terms of crop yield (see Figure 2 and Table 2). The highest crop yields were attained for the lowest rate (9.5 t·ha−1), suggesting that for higher application rates the potential benefits of DPM as a fertilizer would be affected by its toxicity, and by the decomposition rate, quantity of N immobilization and timing of nutrient release [33,34].
Table 2.
Grain yield, grain N concentration and N content, and nitrogen agronomic efficiency (NAE) of the barley crop over the three-year period.
Several authors have reported that the sole application of organic fertilizers cannot result in the same performance levels as those attained with mineral fertilizers [14,32,35], and that nitrification inhibitors improve ammonium supply in the soil, increasing crop performance [36]. Hence, the larger increase in yield for the subplots treated with the mineral fertilizers than in those treated with DPM may be related to higher N availability in the early stages of crop development, even before the strong spring growth starts, due to the impact this has on the final crop production.
Regarding the N content in grain (Table 2), it can be observed that the maximum values were associated with the mineral fertilizer (T1 and T2), in the 1.73% to 2.03% range, while the lowest values were found for the control soil (T0) (1.32% and 1.37%). The values for the organic fertilizer treatments ranged from 1.29% to 1.54%. Villar and Guillaumes [35] also observed higher N content in wheat grain with mineral fertilization as compared to the application of pig slurry. Riley [37] reported that the N content in grain increased with the mineral fertilizer application rate, from 1.68% to 2.17%, for application rates ranging from 0 to 120 kg N·ha−1, respectively. These values are similar to those obtained in this study for T1 and T2 treatments. It is also worth mentioning that all values were below the maximum concentration limit (2.16% in barley) that would result in problems for the malting process [38].
It should be noted that while the lowest rate of DPM (9.5 t·ha−1) led to higher production yields than for the other two organic fertilization treatments, the N content in grain was lower. Higher crop yields entail higher N requirements and, if the availability of N in the form of nitrates is limited, it may result in a lower N content in grain [38].
The NAE values (Table 2), in a similar fashion to the other analyzed parameters, were affected by the type of fertilization, with values up to 18 and 20 kg grain·kg−1 N for mineral fertilization (T1 and T2, respectively). As regards the treatments with organic fertilization, T3 obtained the highest values (up to 14 kg grain·kg−1 N). In fact, in the last year of the experiment, the climatic conditions (with very low precipitation) led to a higher NAE value for T3 than for the mineral fertilizers. Delogu et al. [30] determined that barley and wheat have similar responses to nitrogen fertilization, so NAE data for wheat can be used for comparison purposes (given that the data published on barley crops is scarcer). The highest values reported in the literature would range from 20 to 30 kg wheat grain·kg−1 of applied N, in optimum cultivation conditions [39,40]. Delogu et al. [30] obtained a value of 9 kg grain·kg−1 N, while Duan et al. [31] found NAE values in the 9 to 29 kg grain·kg−1 N range, attaining the maximum values with chemical NPK combinations with manure. Villar and Guillaumes [35] obtained values between −4.0 and 5.9 kg grain·kg−1 N for pig slurry treatments without top-dress fertilizer, and values ranging from 13.9 to 16.9 kg grain·kg−1 N when ENTEC® mineral fertilizer was used. In this study, intervals similar to those reported by Villar and Guillaumes [35] were obtained, with NAE values ranging from 1 to 14 kg grain·kg−1 N for the treatments with DPM (T3- T5) and between 11 and 20 kg grain·kg−1 N for the plots treated with ENTEC® (T1 and T2). Nonetheless, it should be noted that these studies are not strictly comparable, as pig slurry features a lower C:N ratio and a higher ammonium content than manure.
3.2. Physicochemical Properties of Soils
The pH, EC, assimilable P, K, Na, Ca and Mg values in soils were determined for the different fertilization treatments over the three-year period. Average values with their corresponding standard deviations are summarized in Table 3.
Table 3.
Physicochemical properties of the soils after the application of the different treatments over a three-year period.
The pH value was not significantly modified upon the application of the different treatments, probably because of the strong buffering capacity characteristic of calcareous soils [41].
EC values were significantly lower in the soils treated with T0 and T1 than in those treated with T2, T3, T4 and T5. Several authors have reported a significant increase in the EC of the soil after the application of manure [33,42]. In the case of T2 treatment, the fact that it was supplemented with a K contribution should be taken into consideration.
Assimilable P values were also significantly different. The highest value was associated with T5 treatment, which is reasonable, given that DPM contained significant amounts of P. The application of organic fertilizers has been reported to have a positive correlation with the P and K content in the topsoil, depending on the rates and chemical composition of organic amendments [43].
In relation to the Na, K, Ca and Mg cations, there were significant differences for K and Mg; treatments with DPM were different from the control soil and similar to T2 mineral fertilization. In general, it could be observed that their values were higher when more DPM was applied. The increase in the SOM content implies an increase in the cation-exchange capacity [44], which explains why it improves the capacity of retention of the cation content in the soils treated with DPM. In addition, the contents of K, Na, Mg and Ca were related to the increase of EC discussed above.
3.3. Metal Pollution
In general, the average values of heavy metal contents were slightly higher in the soils with fertilization than in the control soil, although significant differences were only found for Zn. The Fe, Cu, Mn, Zn, Ni, Cr and Pb average values, with their corresponding deviations, are presented in Table 4.
Table 4.
Heavy metals content in the soil depending on the fertilization treatment after the three-year application period.
The highest Zn content occurred for T2, which was the only treatment for which significant differences from the control were found. Organic fertilization treatments with DPM, in spite of having noticeable amounts of Zn, did not lead to significant differences in terms of Zn accumulation versus mineral fertilization treatments or the control. According to Spanish Royal Decree 1310/1990, for soils with pH > 7, the thresholds for Cu and Zn contents are 210 and 450 mg·kg−1, respectively. Hence, upon the application of these amounts of fertilizers, reaching those levels would take several years. Jensen et al. [2] applied other more stringent criteria, so the PNEC (predicted no effect concentrations, in kg·kg−1 dry weight) according to European Food Safety Authority (EFSA)—for clay soils—would be 121 mg·kg−1 for Zn and 67 mg·kg−1 for Cu. Nonetheless, these values also remain far from the average content obtained in the soil under study.
3.4. Organic Matter, Nitrogen, Nitrates and Ammonium Contents in the Soil
The organic matter content (Figure 3a) and total N content (Figure 3b) at different soil depths showed similar trends, with higher values in the surface layer than in the deepest layer [32] and in soils treated with DPM than in those to which mineral fertilization was added (or than in the control soil). Similar results have been reported in the literature [32,43,45].
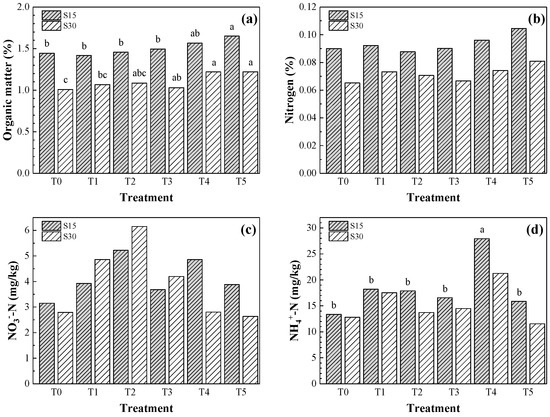
Figure 3.
(a) Organic matter content (%); (b) nitrogen content (%); (c) NO3−-N content (mg·kg−1); and (d) NH4+-N content (mg·kg−1) at two different depths as a function of the different fertilization treatments after the three-year application period. Values are expressed as average values across four repetitions. S15 stands for 0 to 15 cm depth, S30 stands for 15 to 30 cm depth. Treatments followed by the same letter are not significantly different (Tukey’s test, significance at 0.05 level).
In the surface soil layer (S15), SOM content was in the 1.42%–1.65% range, while at a greater depth (S30) it was between 1.01% and 1.22%, mainly due to the minimum tillage system used, which did not homogenize the soil profile. Significantly different values were obtained in terms of the SOM content between the control soil and T5 organic fertilization treatment in S15, and as compared to T4 and T5 treatments in S30.
Organic matter showed a positive response to the increase in the application rate of DPM from 9.5 to 19.0 t·ha−1, increasing by 3.5%, 8.5% and 14.4% for T3, T4 and T5, respectively, as compared to the values obtained in control soil in S15. This was an expected result, since organic fertilizers with high C:N (16 for the one studied herein) and low inorganic N content are known to be useful to increase organic matter content. The application of organic wastes at similar rates to those used herein has been reported to increase [32,43,45,46] or prevent the decrease of SOM content [47], as is the case for T3. It should also be taken into consideration that the organic matter applied to calcareous soils is more stable, which also contributes to its increase [43].
Regarding the total N content (Figure 3b), no significant differences were found between treatments. The N content in S15 was in the 0.09–0.11% range, higher than in S30 (0.07–0.08%). In a similar fashion to the SOM, total N content was higher in the soils treated with DPM (T4 and T5) in S15. This nitrogen would not be available to the plant, being mostly organic N, leading to the low barley grain yields obtained in these subplots (Figure 2). The lowest total N content corresponded to the subplots with organic fertilizer (T3), mineral fertilizer (T1 and T2) and the control (T0).
The SOM and the total N in the agricultural soil increased for all the fertilization treatments as compared to the control, obtaining the highest values when DPM was applied at rates higher than 14.2 t·ha−1·year−1 (133 kg N·ha−1·year−1). In the DPM treatments, the contribution of organic matter would be exogenous, whereas in the mineral fertilization ones the increase in SOM would only be due to crop residues such as roots [32,48], which would account for the slight increases (in SOM and total nitrogen) in S30 for T1 and T2.
At this point, it should be clarified that, whereas there would be a clear relationship between SOM and total N in the soil, such relationship would not be observed between SOM and mineral N (nitrate and ammonium) [32]. Thus, there would be no relationship either between the mineral N and the total N contents, in line with the results discussed below.
The NO3−-N content in the soil (Figure 3c) did not significantly differ as a function of the type of fertilization treatment, neither in the surface layer nor in the deepest one. The average values ranged from 3.13 to 5.51 mg·kg−1 in S15 and from 2.53 to 6.59 mg·kg−1 in S30, and were always lower than 10 mg·kg−1. The low nitrate values can be deemed normal, given that the sampling was conducted after the harvest, when the crop had already absorbed the maximum amounts of NO3−-N.
Residual NO3−-N contents were higher in the fertilized subplots (ranging from 20% to 77%) than in the control subplot. The highest soil nitrate enrichment did not correspond to the highest N application rates (T1 and T5 for mineral and organic fertilization, respectively), in contrast to other studies in which the maximum leaching nitrate losses were generated when the highest amounts of N were applied [49,50]. This will be discussed later on.
The average amounts of NH4+-N (Figure 3d) were significantly different for the surface layer in the subplots to which T4 treatment was applied. Further, the ammonium content values were higher in S15 (13.3–27.9 mg·kg−1) than in S30 (11.5–21.2 mg·kg−1) for all treatments, with a mean value lower than 20 mg·kg−1 for all treatments except for T4. The mean ammonium content values were higher in the soils to which treatments were applied than in the control. The increase in the content of NH4+–N in the subplots treated with DPM as compared to the control soil ranged from 19% to 109%, whereas the two mineral fertilizer treatments increased the NH4+-N content in the soil surface by similar values (34% and 36%). Among the soils treated with DPM, the nitrate and ammonium values for T4 (14.2 t·ha−1·year−1) were higher than for T3 (9.5 t·ha−1·year−1) and T5 (19 t·ha−1·year−1).
In contrast to the nitrate anion, which features a high leaching capacity and high mobility through the soil profile [15,18], the ammonium cation has a greater capacity of retention in the soil [51], which explains why its values were higher in the surface layer than in deeper layers.
The final content of nitrate and ammonium in soils was relatively low at the end of the crop harvest [11]. The obtained values for NO3-N content in the soil were similar to the results obtained by other authors upon application of pig slurry [35,50], sludge waste materials subjected to different stabilization treatments [45], and mineral fertilization treatments with ENTEC® [35], with values generally lower than 10 mg·kg−1 and no differences between mineral and organic treatments. Nitrate values below 20 mg·kg−1 would be classified as ‘low’, according to Zhu et al. [52]. The values for the NH4+-N content would, in turn, be expected to be lower than 10 mg·kg−1 and lower than the nitrate content [10,45,50,53]. However, the transformation process of ammonium into nitrate is strongly correlated with the pH [54,55,56] and, in soils with pH≃8.0—as is the case in this experiment—a strong reduction in the nitrification process is known to occur [56]. This would explain why they are higher than the nitrate content, being favored by ammonia volatilization, which would contribute to this decrease in inorganic N [57].
It is also noteworthy that the highest crop yield values (Figure 2) corresponded to those treatments (T1, T2 and T3) with higher nitrate amounts in S30 than in S15. This is an indication that those treatments would have been able to supply higher amounts of plant-available N (nitrates) than the other two (T4 and T5), which—after not being absorbed by the crop—would have been leached to deeper soil layers.
In relation to the mineral fertilization treatments (T1, with 108 kg N·ha−1, and T2, with 90 kg N·ha−1), the amounts of ammonium in the agricultural soil increased as the mineral fertilizer application rate was increased, whereas the nitrate content was higher in T2 than in T1. Soil texture is a relevant factor that affects the efficiency of nitrification inhibitors, and the inhibition effect of DMPP varies depending both on the type of soil and the material applied, increasing its efficiency with sand content. Fangueiro et al. [11] determined that the nitrification inhibitory effect would last from 8 to 40 days, in such a way that its effect would be most favored in sandy soils—as is the case for the soils under study—given that the inhibitor is less likely to be retained in the soil. Nonetheless, this would have had a similar effect in both cases, so there must be a process that favors the nitrification of ammonia to nitrate in T2 as compared to T1. A reasonable explanation would be that the application of K (to meet crop needs in T2 treatment, and which was not supplied in T1) would favor the availability of NH4+-N [58] and, in turn, its nitrification.
The results in terms of production, nitrate and ammonium contents for the treatments with DPM suggest that some sort of inhibition of the organic N mineralization would have taken place, which would be directly proportional to the amount of organic waste material applied, and which would disappear over time (as in T4 treatment). The mineralization of the organic N provided by DPM seems to be higher for T3 treatment, while in T4 and T5 treatments it may be slower, resulting in insufficient amounts of nutrients for the crop, and, consequently, in lower crop yields.
The crop can uptake the N supplied by the mineral fertilizers during the year in which they were applied. Conversely, for the organic fertilizers at applications rates higher than 9.5 t·ha−1·year−1, part of the mineralized N may be immobilized by the microorganisms after its incorporation to the soil. It would be from the third year onwards when the mineralization processes would cause an increment vs. the immobilization processes (i.e., the immobilized N would be released in subsequent years).
4. Conclusions
The treatments assayed are appropriate for NVZs: they did not result in a significant increase in the residual nitrate amounts (concentrations remained below 10 mg·kg−1). Further, they did not generate pollution problems in terms of increase in salinity (cations in soil) or toxic effects (heavy metals), despite the Cu and Zn content in DPM. Crop yield and NAE were lower for DPM than for mineral fertilization, with ENTEC® attaining the best results for an application rate of 85 kg N·ha−1·year−1. This can be ascribed to an immobilization process of the mineralized nitrogen up to the third year of the experiment for DPM application rates above 14.2 t·ha−1·year−1, which resulted in a reduction of the nutrients available to the barley crop.
Taking into consideration the restrictions on the maximum application rates for organic fertilizers in NVZs (170 kg N·ha−1, according to Spanish Royal Decree 261/1996), the integrated use of small amounts of mineral N-rich inorganic fertilizers with the organic waste material would be necessary to balance the manure nutrient composition and to meet crop needs.
Author Contributions
Conceptualization, M.S.-B. and J.M.-G.; Formal analysis, J.M.A.-R. and P.M.-R.; Funding acquisition, M.S.-B. and J.M.-G.; Investigation, J.M.A.-R. and C.T.B.-S.; Methodology, M.S.-B., J.M.A.-R., J.M.-G. and P.M.-R.; Project administration, M.S.-B.; Resources, M.S.-B.; Supervision, M.S.-B. and J.M.-G.; Validation, J.M.A.-R., J.M.-G. and P.M.-R.; Visualization, P.M.-R.; Writing—Original Draft Preparation, J.M.A.-R., J.M.-G., and P.M.-R.; Writing—Review & Editing, J.M.A.-R. and P.M.-R.
Funding
This research was funded by Castilla-y-León Regional Government under “Los efectos de los subproductos biodegradables en la calidad de los suelos y la productividad de los cultivos” project. The APC was funded by Castilla-y-León Regional Government.
Acknowledgments
This work was also supported by the Castilla-y-León Regional Government (Regional Ministry of Environment), VA258P18.
Conflicts of Interest
The authors declare no conflicts of interest. The funders had no role in the design of the study; in the collection, analyses, or interpretation of data; in the writing of the manuscript, or in the decision to publish the results.
Appendix A
Table A1.
Physicochemical soil properties before the application of fertilizers.
Table A1.
Physicochemical soil properties before the application of fertilizers.
| Parameter * | Soil |
|---|---|
| Location | Fompedraza (41°32′10″ N 4°8′45″ W) |
| Sand (%) | 46.0 ± 2.2 |
| Silt (%) | 25.6 ± 1.4 |
| Clay (%) | 28.4 ± 3.6 |
| Texture (USDA) | Sandy Clay Loam |
| pH | 7.9 ± 0.1 |
| EC (μS·cm−1) | 145 ± 24 |
| Organic matter (%) | 1.42 ± 0.05 |
| Total carbon (%) | 4.07 ± 0.45 |
| Total nitrogen (%) | 0.10 ± 0.01 |
| Phosphorus (mg·kg−1) | 22.1 ± 1.3 |
| CaCO3 (%) | 28.7 ± 1.4 |
| K (meq·100 g−1) | 0.30 ± 0.04 |
| Na (meq·100 g−1) | 0.05 ± 0.02 |
| Ca (meq·100 g−1) | 17.7 ± 2.1 |
| Mg (meq·100 g−1) | 0.85 ± 0.01 |
| Fe (%) | 1.27 ± 0.05 |
| Mn (mg·kg−1) | 252 ± 21 |
| Zn (mg·kg−1) | 21.1 ± 3.3 |
| Cu (mg·kg−1) | 7.55 ± 0.6 |
| Cr (mg·kg−1) | 26.1 ± 1.7 |
| Ni (mg·kg−1) | 27.6 ± 7.2 |
| Pb (mg·kg−1) | 22.2 ± 5.8 |
| Cd (μg·kg−1) | 6.86 ± 4.3 |
* Variables expressed in air-dried soil. The values correspond to average values ± standard deviation (n = 3).
Table A2.
Physicochemical properties of the dried pig manure.
Table A2.
Physicochemical properties of the dried pig manure.
| Parameter * | Dried Pig Manure |
|---|---|
| Dry matter (%) | 29.9 ± 4.4 |
| pH | 7.8 ± 0.6 |
| EC (mS·cm−1) | 4.5 ± 2.2 |
| Organic matter (%) | 52.4 ± 15.3 |
| Total carbon (%) | 39.0 ± 3.3 |
| Total nitrogen (%) | 2.5 ± 0.1 |
| C:N ratio | 16.0 ± 2.1 |
| P (%) | 1.6 ± 0.7 |
| K (%) | 1.4 ± 0.2 |
| Na (%) | 0.6 ± 0.2 |
| Ca (%) | 1.7 ± 1.6 |
| Mg (%) | 1.9 ± 1.5 |
| Fe (mg·kg−1) | 226 ± 39 |
| Mn (mg·kg−1) | 493 ± 125 |
| Cu (mg·kg−1) | 176 ± 40 |
| Zn (mg·kg−1) | 745 ± 301 |
| Ni (mg·kg−1) | 12.0 ± 3.2 |
| Cr (mg·kg−1) | 16.8 ± 3.2 |
| Pb (mg·kg−1) | 11.9 ± 4.8 |
| Cd (mg·kg−1) | 0.08 ± 0.03 |
| N-NH4 (%) | 0.13 ± 0.02 |
* Variables expressed in air-dried biowaste. The values correspond to average values ± standard deviation over the three-year period, with 3 repetitions per year.
References
- Sánchez, M.; González, J.L. The fertilizer value of pig slurry. I. Values depending on the type of operation. Bioresour. Technol. 2005, 96, 1117–1123. [Google Scholar] [PubMed]
- Jensen, J.; Larsen, M.M.; Bak, J. National monitoring study in Denmark finds increased and critical levels of copper and zinc in arable soils fertilized with pig slurry. Environ. Pollut. 2016, 214, 334–340. [Google Scholar] [PubMed]
- Pirlo, G.; Carè, S.; Casa, G.D.; Marchetti, R.; Ponzoni, G.; Faeti, V.; Fantin, V.; Masoni, P.; Buttol, P.; Zerbinatti, L.; et al. Environmental impact of heavy pig production in a sample of Italian farms. A cradle to farm-gate analysis. Sci. Total Environ. 2016, 565, 576–585. [Google Scholar] [PubMed]
- Van Grinsven, H.J.M.; Tiktak, A.; Rougoor, C.W. Evaluation of the Dutch implementation of the nitrates directive, the water framework directive and the national emission ceilings directive. Wageningen J. Life Sci. 2016, 78, 69–84. [Google Scholar]
- USDA. Spain: Record Year for Spanish Swine and Cattle Production. Available online: https://www.fas.usda.gov/data/spain-record-year-spanish-swine-and-cattle-production (accessed on 24 September 2018).
- European Commission. Council Directive 91/676/EEC of 12 December 1991 Concerning the Protection of Waters Against Pollution Caused by Nitrates from Agricultural Sources. 91/676/EEC. 1991. Available online: https://eur-lex.europa.eu/legal-content/en/ALL/?uri=CELEX:31991L0676 (accessed on 23 January 2019).
- Sutton, M.A.; Howard, C.M.; Erisman, J.W.; Billen, G.; Bleeker, A.; Grennfelt, P.; Van Grinsven, H.; Grizzetti, B. The European Nitrogen Assessment: Sources, Effects and Policy Perspectives; Cambridge University Press: Cambridge, UK, 2011; p. 664. [Google Scholar]
- Bernal, M.P.; Bescós, B.; Burgos, L.; Bustamante, M.; Clemente, R.; Fabbri, C.; Flotats Ripoll, X.; García-González, M.C.; Herrero Mallén, E.; Mattachini, G. Evaluation of Manure Management Systems in Europe; UPCommons: Valencia, Spain, 2015; p. 180. [Google Scholar]
- Sørensen, P.; Amato, M. Remineralisation and residual effects of N after application of pig slurry to soil. Eur. J. Agron. 2002, 16, 81–95. [Google Scholar]
- Li, L.L.; Li, S.T. Nitrogen mineralization from animal manures and its relation to organic N fractions. J. Integr. Agric. 2014, 13, 2040–2048. [Google Scholar]
- Fangueiro, D.; Surgy, S.; Fraga, I.; Monteiro, F.G.; Cabral, F.; Coutinho, J. Acidification of animal slurry affects the nitrogen dynamics after soil application. Geoderma 2016, 281, 30–38. [Google Scholar]
- L’Herroux, L.; Roux, S.L.; Appriou, P.; Martinez, J. Behaviour of metals following intensive pig slurry applications to a natural field treatment process in Brittany (France). Environ. Pollut. 1997, 97, 119–130. [Google Scholar]
- Formentini, T.A.; Mallmann, F.J.K.; Pinheiro, A.; Fernandes, C.V.S.; Bender, M.A.; da Veiga, M.; dos Santos, D.R.; Doelsch, E. Copper and zinc accumulation and fractionation in a clayey Hapludox soil subject to long-term pig slurry application. Sci. Total Environ. 2015, 536, 831–839. [Google Scholar]
- Biau, A.; Santiveri, F.; Mijangos, I.; Lloveras, J. The impact of organic and mineral fertilizers on soil quality parameters and the productivity of irrigated maize crops in semiarid regions. Eur. J. Soil Biol. 2012, 53, 56–61. [Google Scholar]
- Serna, M.D.; Bañuls, J.; Quiñones, A.; Primo-Millo, E.; Legaz, F. Evaluation of 3,4-dimethylpyrazole phosphate as a nitrification inhibitor in a Citrus-cultivated soil. Biol. Fertil. Soils 2000, 32, 41–46. [Google Scholar] [CrossRef]
- Yu, Q.G.; Chen, Y.X.; Ye, X.Z.; Tian, G.M.; Zhang, Z.J. Influence of the DMPP (3,4-dimethyl pyrazole phosphate) on nitrogen transformation and leaching in multi-layer soil columns. Chemosphere 2007, 69, 825–831. [Google Scholar] [CrossRef] [PubMed]
- Alonso-Ayuso, M.; Gabriel, J.L.; Quemada, M. Nitrogen use efficiency and residual effect of fertilizers with nitrification inhibitors. Eur. J. Agron. 2016, 80, 1–8. [Google Scholar] [CrossRef]
- Long, G.Q.; Sun, B. Nitrogen leaching under corn cultivation stabilized after four years application of pig manure to red soil in subtropical China. Agric. Ecosyst. Environ. 2012, 146, 73–80. [Google Scholar] [CrossRef]
- MAPAMA. Sistema de Información Agroclimática para el Regadío (SiAR). Available online: http://eportal.mapama.gob.es/websiar/Inicio.aspx (accessed on 24 September 2018).
- Xiong, X.; Yanxia, L.; Wei, L.; Chunye, L.; Wei, H.; Ming, Y. Copper content in animal manures and potential risk of soil copper pollution with animal manure use in agriculture. Resour. Conserv. Recycl. 2010, 54, 985–990. [Google Scholar] [CrossRef]
- Lipoth, S.L.; Schoenau, J.J. Copper, zinc, and cadmium accumulation in two prairie soils and crops as influenced by repeated applications of manure. J. Plant Nutr. Soil Sci. 2007, 170, 378–386. [Google Scholar] [CrossRef]
- Shi, J.; Yu, X.; Zhang, M.; Lu, S.; Wu, W.; Wu, J.; Xu, J. Potential risks of copper, zinc, and cadmium pollution due to pig manure application in a soil-rice system under intensive farming: A case study of Nanhu, China. J. Environ. Qual. 2011, 40, 1695–1704. [Google Scholar] [CrossRef] [PubMed]
- Spanish Ministry of the Presidency. Real Decreto 261/1996, de 16 Febrero, Sobre Protección de las Aguas Contra la Contaminación Producida por los Nitratos Procedentes de Fuentes Agrarias; 261/1996; Spanish Ministry of the Presidency: Madrid, Spain, 1996; p. 4.
- López Bellido, L.; Betrán Aso, J.; Ramos Monreal, Á.; López Córcoles, H.; López Fuster, P.; Bermejo Corrales, J.L.; Urbano Terrón, P.; Piñeiro Andión, J.; Castro Insua, J.; Blázquez Rodríguez, R. Abonado de los Principales Cultivos en España, 2nd ed.; Ministerio de Medio Ambiente y Medio Rural y Marino: Madrid, Spain, 2009; Volume 2, p. 144.
- Gee, G.W.; Bauder, J.W. Particle-size analysis. In Methods of Soil Analysis: Part 1—Physical and Mineralogical Methods; Klute, A., Ed.; Soil Science Society of America, American Society of Agronomy: Madison, WI, USA, 1986; pp. 383–411. [Google Scholar]
- Walkey, A.J.; Black, I.A. Estimation of soil organic carbon by the chromic acid titration method. Soil Sci. 1934, 37, 29–38. [Google Scholar]
- Olsen, S.R.; Cole, C.V.; Watanabe, F.S.; Dean, L.A. Estimation of Available Phosphorus in Soils by Extraction with Sodium Bicarbonate; United States Department of Agriculture: Washington, DC, USA, 1954; pp. 1–19.
- Keeney, D.R.; Nelson, D.W. Nitrogen—Inorganic forms. In Methods of Soil Analysis. Part 2. Chemical and Microbiological Properties; Page, A.L., Ed.; American Society of Agronomy, Soil Science Society of America: Madison, WI, USA, 1982; pp. 643–698. [Google Scholar]
- Norman, R.J.; Edberg, J.C.; Stucki, J.W. Determination of nitrate in soil extracts by dual-wavelength ultraviolet spectrophotometry. Soil Sci. Soc. Am. J. 1985, 49, 1182–1185. [Google Scholar] [CrossRef]
- Delogu, G.; Cattivelli, L.; Pecchioni, N.; De Falcis, D.; Maggiore, T.; Stanca, A.M. Uptake and agronomic efficiency of nitrogen in winter barley and winter wheat. Eur. J. Agron. 1998, 9, 11–20. [Google Scholar] [CrossRef]
- Duan, Y.; Xu, M.; Gao, S.; Yang, X.; Huang, S.; Liu, H.; Wang, B. Nitrogen use efficiency in a wheat–corn cropping system from 15 years of manure and fertilizer applications. Field Crops Res. 2014, 157, 47–56. [Google Scholar] [CrossRef]
- Zhengchao, Z.; Zhuoting, G.; Zhouping, S.; Fuping, Z. Effects of long-term repeated mineral and organic fertilizer applications on soil organic carbon and total nitrogen in a semi-arid cropland. Eur. J. Agron. 2013, 45, 20–26. [Google Scholar] [CrossRef]
- Azeez, J.O.; Van Averbeke, W.; Okorogbona, A.O.M. Differential responses in yield of pumpkin (Cucurbita maxima L.) and nightshade (Solanum retroflexum Dun.) to the application of three animal manures. Bioresour. Technol. 2010, 101, 2499–2505. [Google Scholar] [CrossRef] [PubMed]
- Gentile, R.; Vanlauwe, B.; Chivenge, P.; Six, J. Trade-offs between the short- and long-term effects of residue quality on soil C and N dynamics. Plant Soil 2010, 338, 159–169. [Google Scholar] [CrossRef]
- Villar, J.M.; Guillaumes, E. Use of nitrification inhibitor DMPP to improve nitrogen recovery in irrigated wheat on a calcareous soil. Span. J. Agric. Res. 2010, 8, 1218. [Google Scholar] [CrossRef]
- Ball-Coelho, B.R.; Roy, R.C. Enhanced ammonium sources to reduce nitrate leaching. Nutr. Cycl. Agroecosyst. 1999, 54, 73–80. [Google Scholar] [CrossRef]
- Riley, H. Soil mineral-N and N-fertilizer requirements of spring cereals in two long-term tillage trials on loam soil in southeast Norway. Soil Tillage Res. 1998, 48, 265–274. [Google Scholar] [CrossRef]
- Baethgen, W.E.; Christianson, C.B.; Lamothe, A.G. Nitrogen fertilizer effects on growth, grain yield, and yield components of malting barley. Field Crops Res. 1995, 43, 87–99. [Google Scholar] [CrossRef]
- Dobermann, A.R. Nitrogen use efficiency–state of the art. In IFA International Workshop on Enhanced-Efficiency Fertilizers; International Fertilizer Association: Frankfurt, Germany, 2005; pp. 1–16. [Google Scholar]
- Hooper, P. Strategic Applications of Nitrogen Fertiliser to Increase the Yield and Nitrogen Use Efficiency of Wheat. Ph.D. Thesis, University of Adelaide, Adelaide, Australia, 2010. [Google Scholar]
- Medina, E.; Paredes, C.; Bustamante, M.A.; Moral, R.; Moreno-Caselles, J. Relationships between soil physico-chemical, chemical and biological properties in a soil amended with spent mushroom substrate. Geoderma 2012, 173–174, 152–161. [Google Scholar] [CrossRef]
- Díez, J.A.; Hernaiz, P.; Muñoz, M.J.; Torre, A.; Vallejo, A. Impact of pig slurry on soil properties, water salinization, nitrate leaching and crop yield in a four-year experiment in Central Spain. Soil Use Manag. 2004, 20, 444–450. [Google Scholar] [CrossRef]
- Morlat, R.; Chaussod, R. Long-term additions of organic amendments in a Loire Valley vineyard. I. Effects on properties of a calcareous sandy soil. Am. J. Enol. Vit. 2008, 59, 353–363. [Google Scholar]
- Bernal, M.P.; Roig, A.; Lax, A.; Navarro, A.F. Effects of the application of pig slurry on some physico-chemical and physical properties of calcareous soils. Bioresour. Technol. 1992, 42, 233–239. [Google Scholar] [CrossRef]
- Tarrasón, D.; Ojeda, G.; Ortiz, O.; Alcañiz, J.M. Differences on nitrogen availability in a soil amended with fresh, composted and thermally-dried sewage sludge. Bioresour. Technol. 2008, 99, 252–259. [Google Scholar] [CrossRef] [PubMed]
- Zhang, Y.; Luo, W.; Jia, J.; Kong, P.; Tong, X.; Lu, Y.; Xie, L.; Ma, F.; Giesy, J.P. Effects of pig manure containing copper and zinc on microbial community assessed via phospholipids in soils. Environ. Monit. Assess. 2014, 186, 5297–5306. [Google Scholar] [CrossRef] [PubMed]
- Maltas, A.; Charles, R.; Jeangros, B.; Sinaj, S. Effect of organic fertilizers and reduced-tillage on soil properties, crop nitrogen response and crop yield: Results of a 12-year experiment in Changins, Switzerland. Soil Tillage Res. 2013, 126, 11–18. [Google Scholar] [CrossRef]
- Meng, L.; Ding, W.; Cai, Z. Long-term application of organic manure and nitrogen fertilizer on N2O emissions, soil quality and crop production in a sandy loam soil. Soil Biol. Biochem. 2005, 37, 2037–2045. [Google Scholar] [CrossRef]
- Berenguer, P.; Santiveri, F.; Boixadera, J.; Lloveras, J. Fertilisation of irrigated maize with pig slurry combined with mineral nitrogen. Eur. J. Agron. 2008, 28, 635–645. [Google Scholar] [CrossRef]
- Guillaumes, E.; Carrasco, I.; Villar, J.M. Response of wheat to additional nitrogen fertilizer application after pig slurry on over-fertilized soils. Agron. Sustain. Dev. 2006, 26, 127–133. [Google Scholar] [CrossRef]
- Yu, Q.G.; Ye, X.Z.; Chen, Y.X.; Zhang, Z.J.; Tian, G.M. Influences of nitrification inhibitor 3,4-dimethyl pyrazole phosphate on nitrogen and soil salt-ion leaching. J. Environ. Sci. 2008, 20, 304–308. [Google Scholar] [CrossRef]
- Zhu, T.; Zeng, S.; Qin, H.; Zhou, K.; Yang, H.; Lan, F.; Huang, F.; Cao, J.; Müller, C. Low nitrate retention capacity in calcareous soil under woodland in the karst region of southwestern China. Soil Biol. Biochem. 2016, 97, 99–101. [Google Scholar] [CrossRef]
- Díez, J.A.; Arauzo, M.; Hernaiz, P.; Sanz, A. The side effects of nitrification inhibitors on leaching water and soil salinization in a field experiment. Span. J. Agric. Res. 2010, 8, 218. [Google Scholar] [CrossRef]
- Morrill, L.G.; Dawson, J.E. Patterns observed for the oxidation of ammonium to nitrate by soil organisms. Soil Sci. Soc. Am. J. 1967, 31, 757–760. [Google Scholar] [CrossRef]
- Khalil, M.I.; Hossain, M.B.; Schmidhalter, U. Carbon and nitrogen mineralization in different upland soils of the subtropics treated with organic materials. Soil Biol. Biochem. 2005, 37, 1507–1518. [Google Scholar] [CrossRef]
- Zhang, J.; Zhu, T.; Cai, Z.; Müller, C. Nitrogen cycling in forest soils across climate gradients in Eastern China. Plant Soil 2011, 342, 419–432. [Google Scholar]
- Guerrero, C.; Moral, R.; Gómez, I.; Zornoza, R.; Arcenegui, V. Microbial biomass and activity of an agricultural soil amended with the solid phase of pig slurries. Bioresour. Technol. 2007, 98, 3259–3264. [Google Scholar] [CrossRef]
- Nieder, R.; Benbi, D.K.; Scherer, H.W. Fixation and defixation of ammonium in soils: A review. Biol. Fertil. Soils 2010, 47, 1–14. [Google Scholar] [CrossRef]


© 2019 by the authors. Licensee MDPI, Basel, Switzerland. This article is an open access article distributed under the terms and conditions of the Creative Commons Attribution (CC BY) license (http://creativecommons.org/licenses/by/4.0/).