3.1. Calibration and Validation of Summer Maize Genetic Parameters
The calibration of CSM-CERES-maize model mainly focused on determining the variety and genetic parameters of summer maize cultivated in the experiments. The genetic parameters need to be calibrated and validated in this study included P1, P2, P5, G2, G3, and PHINT [
39], and the detailed descriptions are indicated in
Table 4. These parameters were adjusted using the generalized likelihood uncertainty estimation (GLUE) procedure of DSSAT set to 10,000 iterations.
The recorded dates of the beginning of flowering and maturity for summer maize in the experiments, dry matter accumulation and grain yield at harvest time were respectively selected as the output variables for calibrating and validating the genetic parameters. In detail, these observed results in the 2016 season were used to calibrate the parameters, and those in 2017 were used for validation. The absolute relative error (
ARE) and relative root mean square error (
RRMSE) were applied to assess the applicability and accuracy of the calibrated summer maize genetic parameters. In addition, the smaller the value of
ARE or
RRMSE, the lower the error between the observed and simulated output variable, and the more accurate the calibrated genetic parameters.
where
k represents the number of samples for an output variable;
Simi is the simulated result of the
ith sample by CSM-CERES-maize model;
Obsi is the observed result of the
ith sample by crop experiments; and
Obs’ represents the average value of all observation samples for a output variable.
The results of calibration showed that the dates of the beginning of flowering and maturity were precisely simulated based on the calibrated and validated summer maize genetic parameters, the errors were both within four days relative to the observed values (
Table 5). For these two outputs, the values of
ARE and
RRMSE in both seasons were all less than 5%. Similarly, the simulated grain yield and dry matter accumulation at harvest time during the calibration and verification phases were all close to the observed results. Therefore, the adjusted genetic parameters of summer maize in the experiments were accurate and reliable, the simulations of maize growth process under various drought patterns could be further carried out based on the calibrated and validated CSM-CERES-maize model with these parameters.
Furthermore, this study aimed at exploring the quantitative effects of different drought patterns on maize growth and yield formation by CSM-CERES-maize model. Meanwhile, the simulation precision of soil water content directly determined the reliability and accuracy of the entire simulated results under various drought conditions. Study had shown that 85–90% of maize roots during the whole growth period were mainly distributed in the columnar soil with a radius of 20 cm and a height of 40 cm [
40]. Therefore, the observed soil water content at layer above 40 cm deep was selected to verify the simulated results in the model.
Table 6 indicates the average value of simulated soil water content during the whole summer maize growth stage at two different layers based on the adjusted genetic parameters and observed results during the two seasons, and the values of the corresponding
RRMSE were all less than 10%. Moreover, the tendency and distribution of simulated soil water content were both mostly close to the measured values (
Figure 6); therefore, the model could accurately simulate the soil water content in time and space. Consequently, the simulated soil water deficit and maize growth processes under different drought patterns based on the calibrated and validated CSM-CERES-maize model could be reliably and reasonably used to build sensitivity curves.
3.2. Soil Water Deficit (SWD)
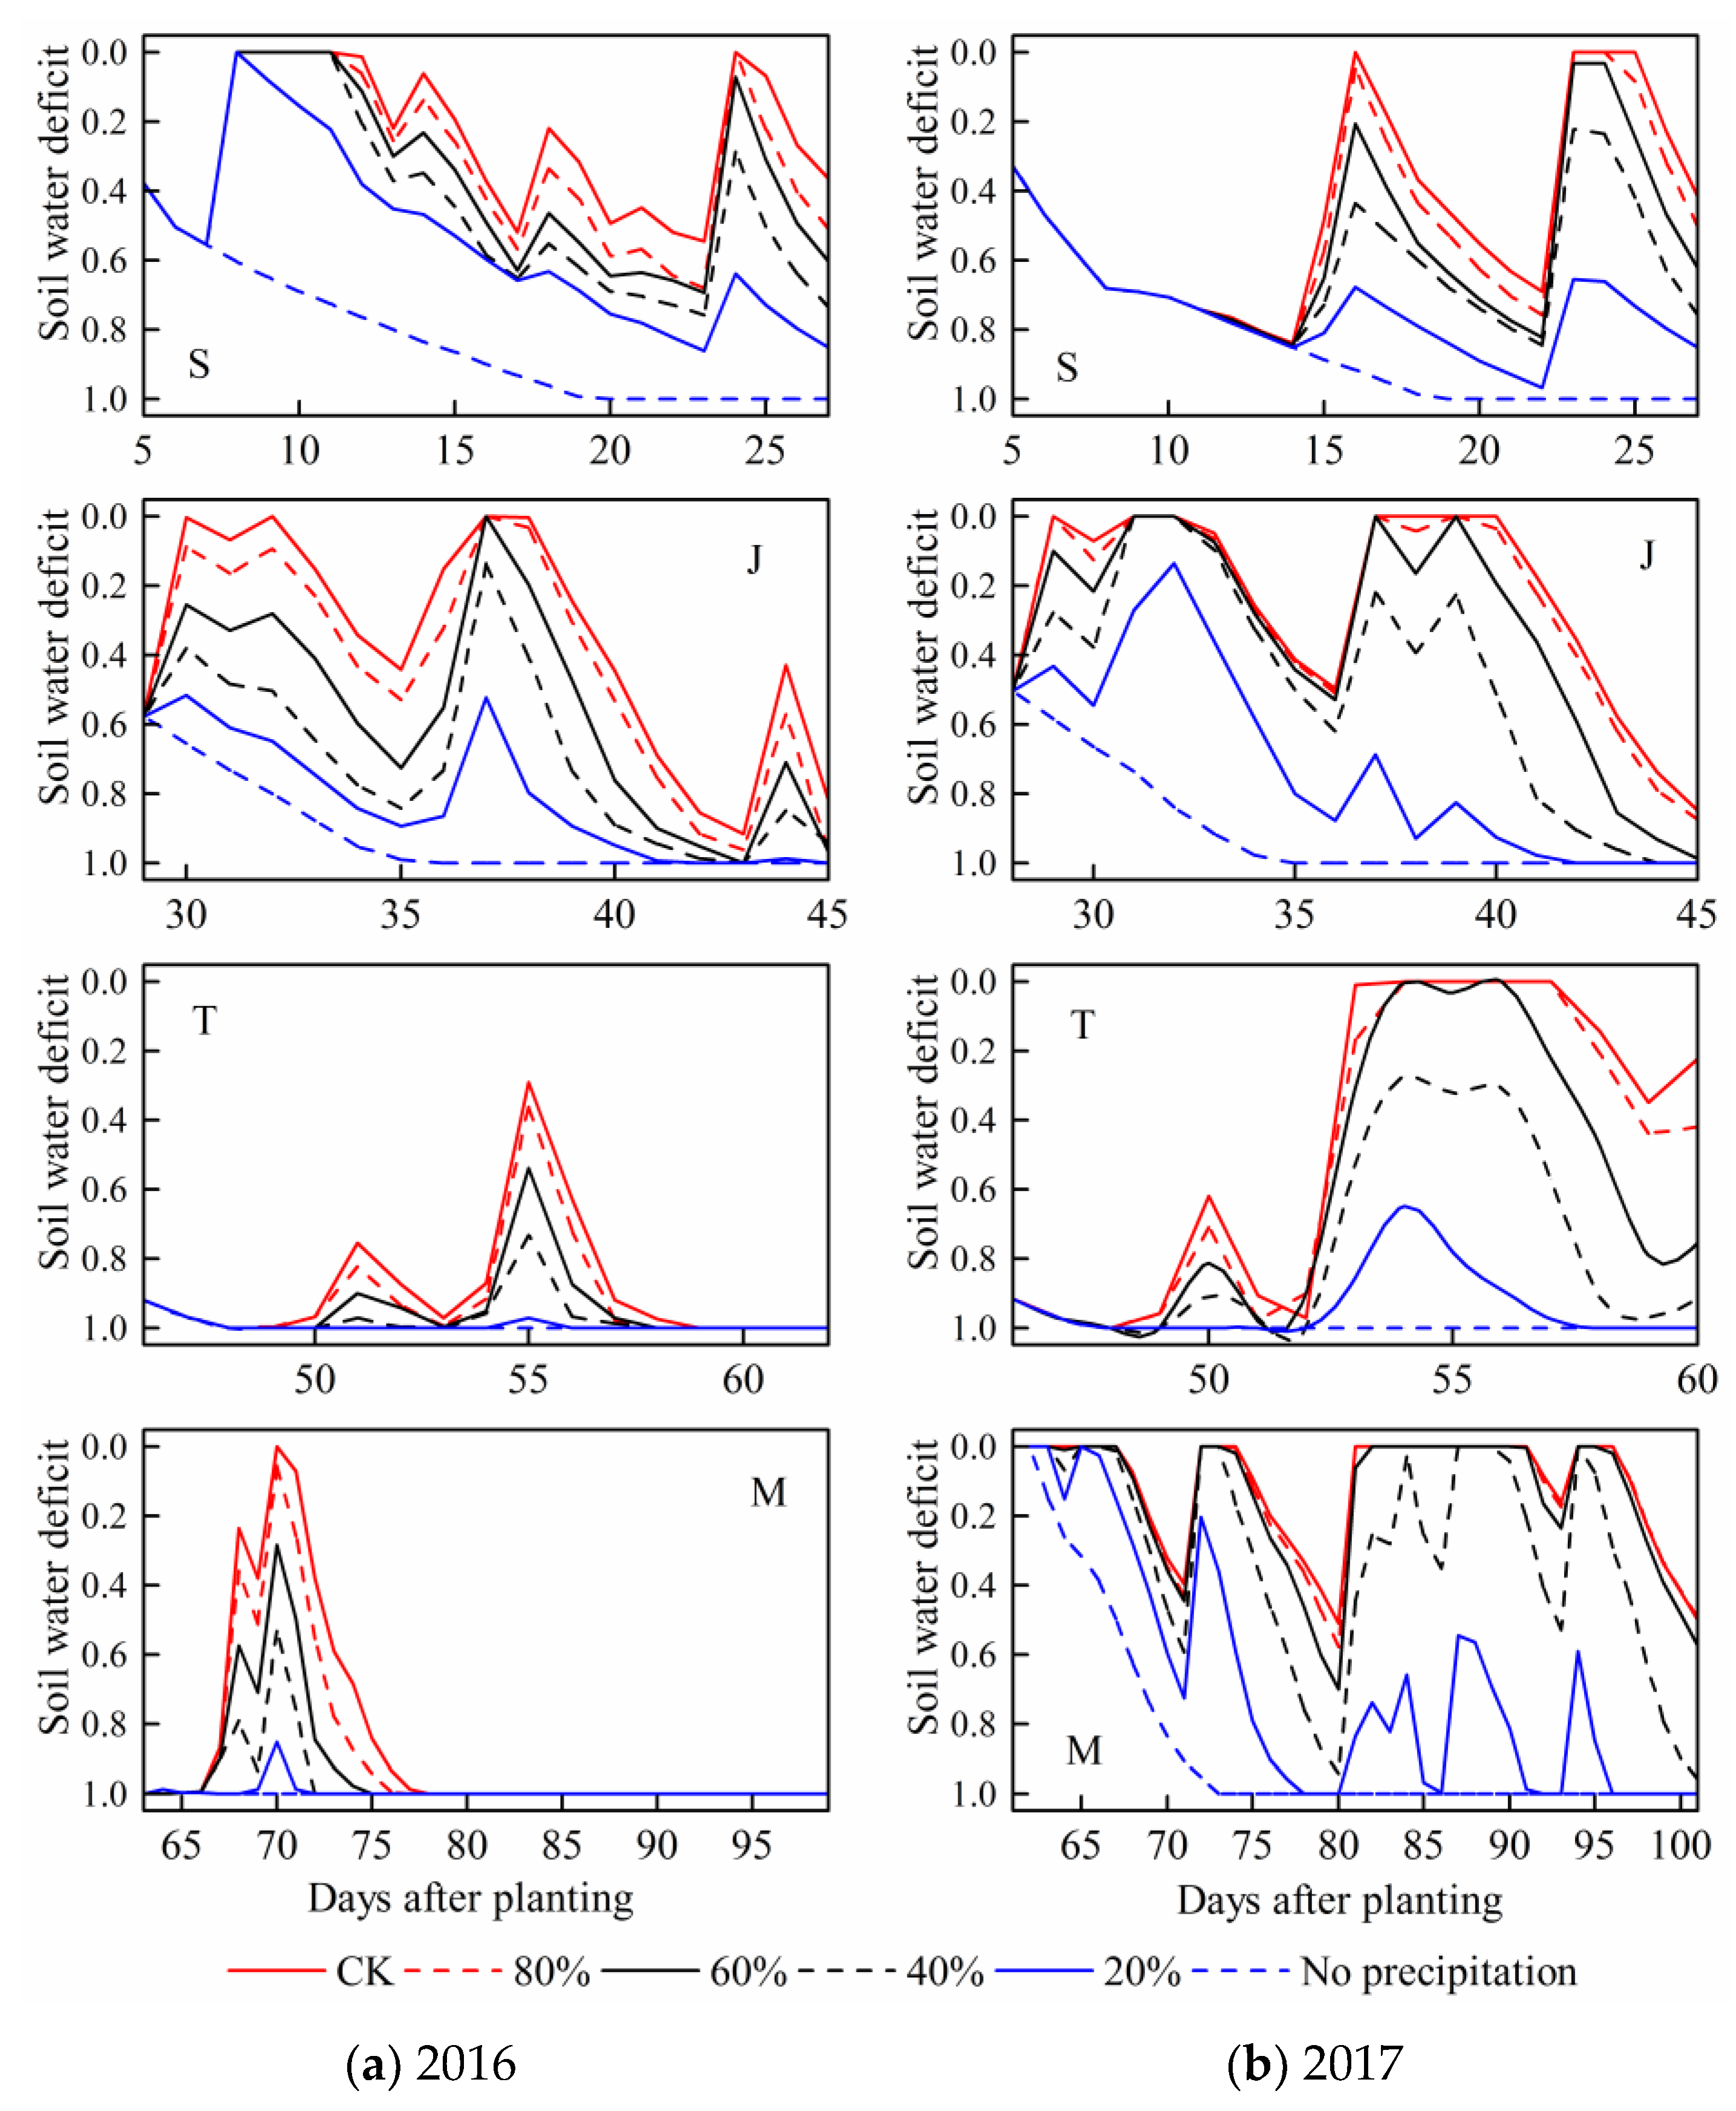
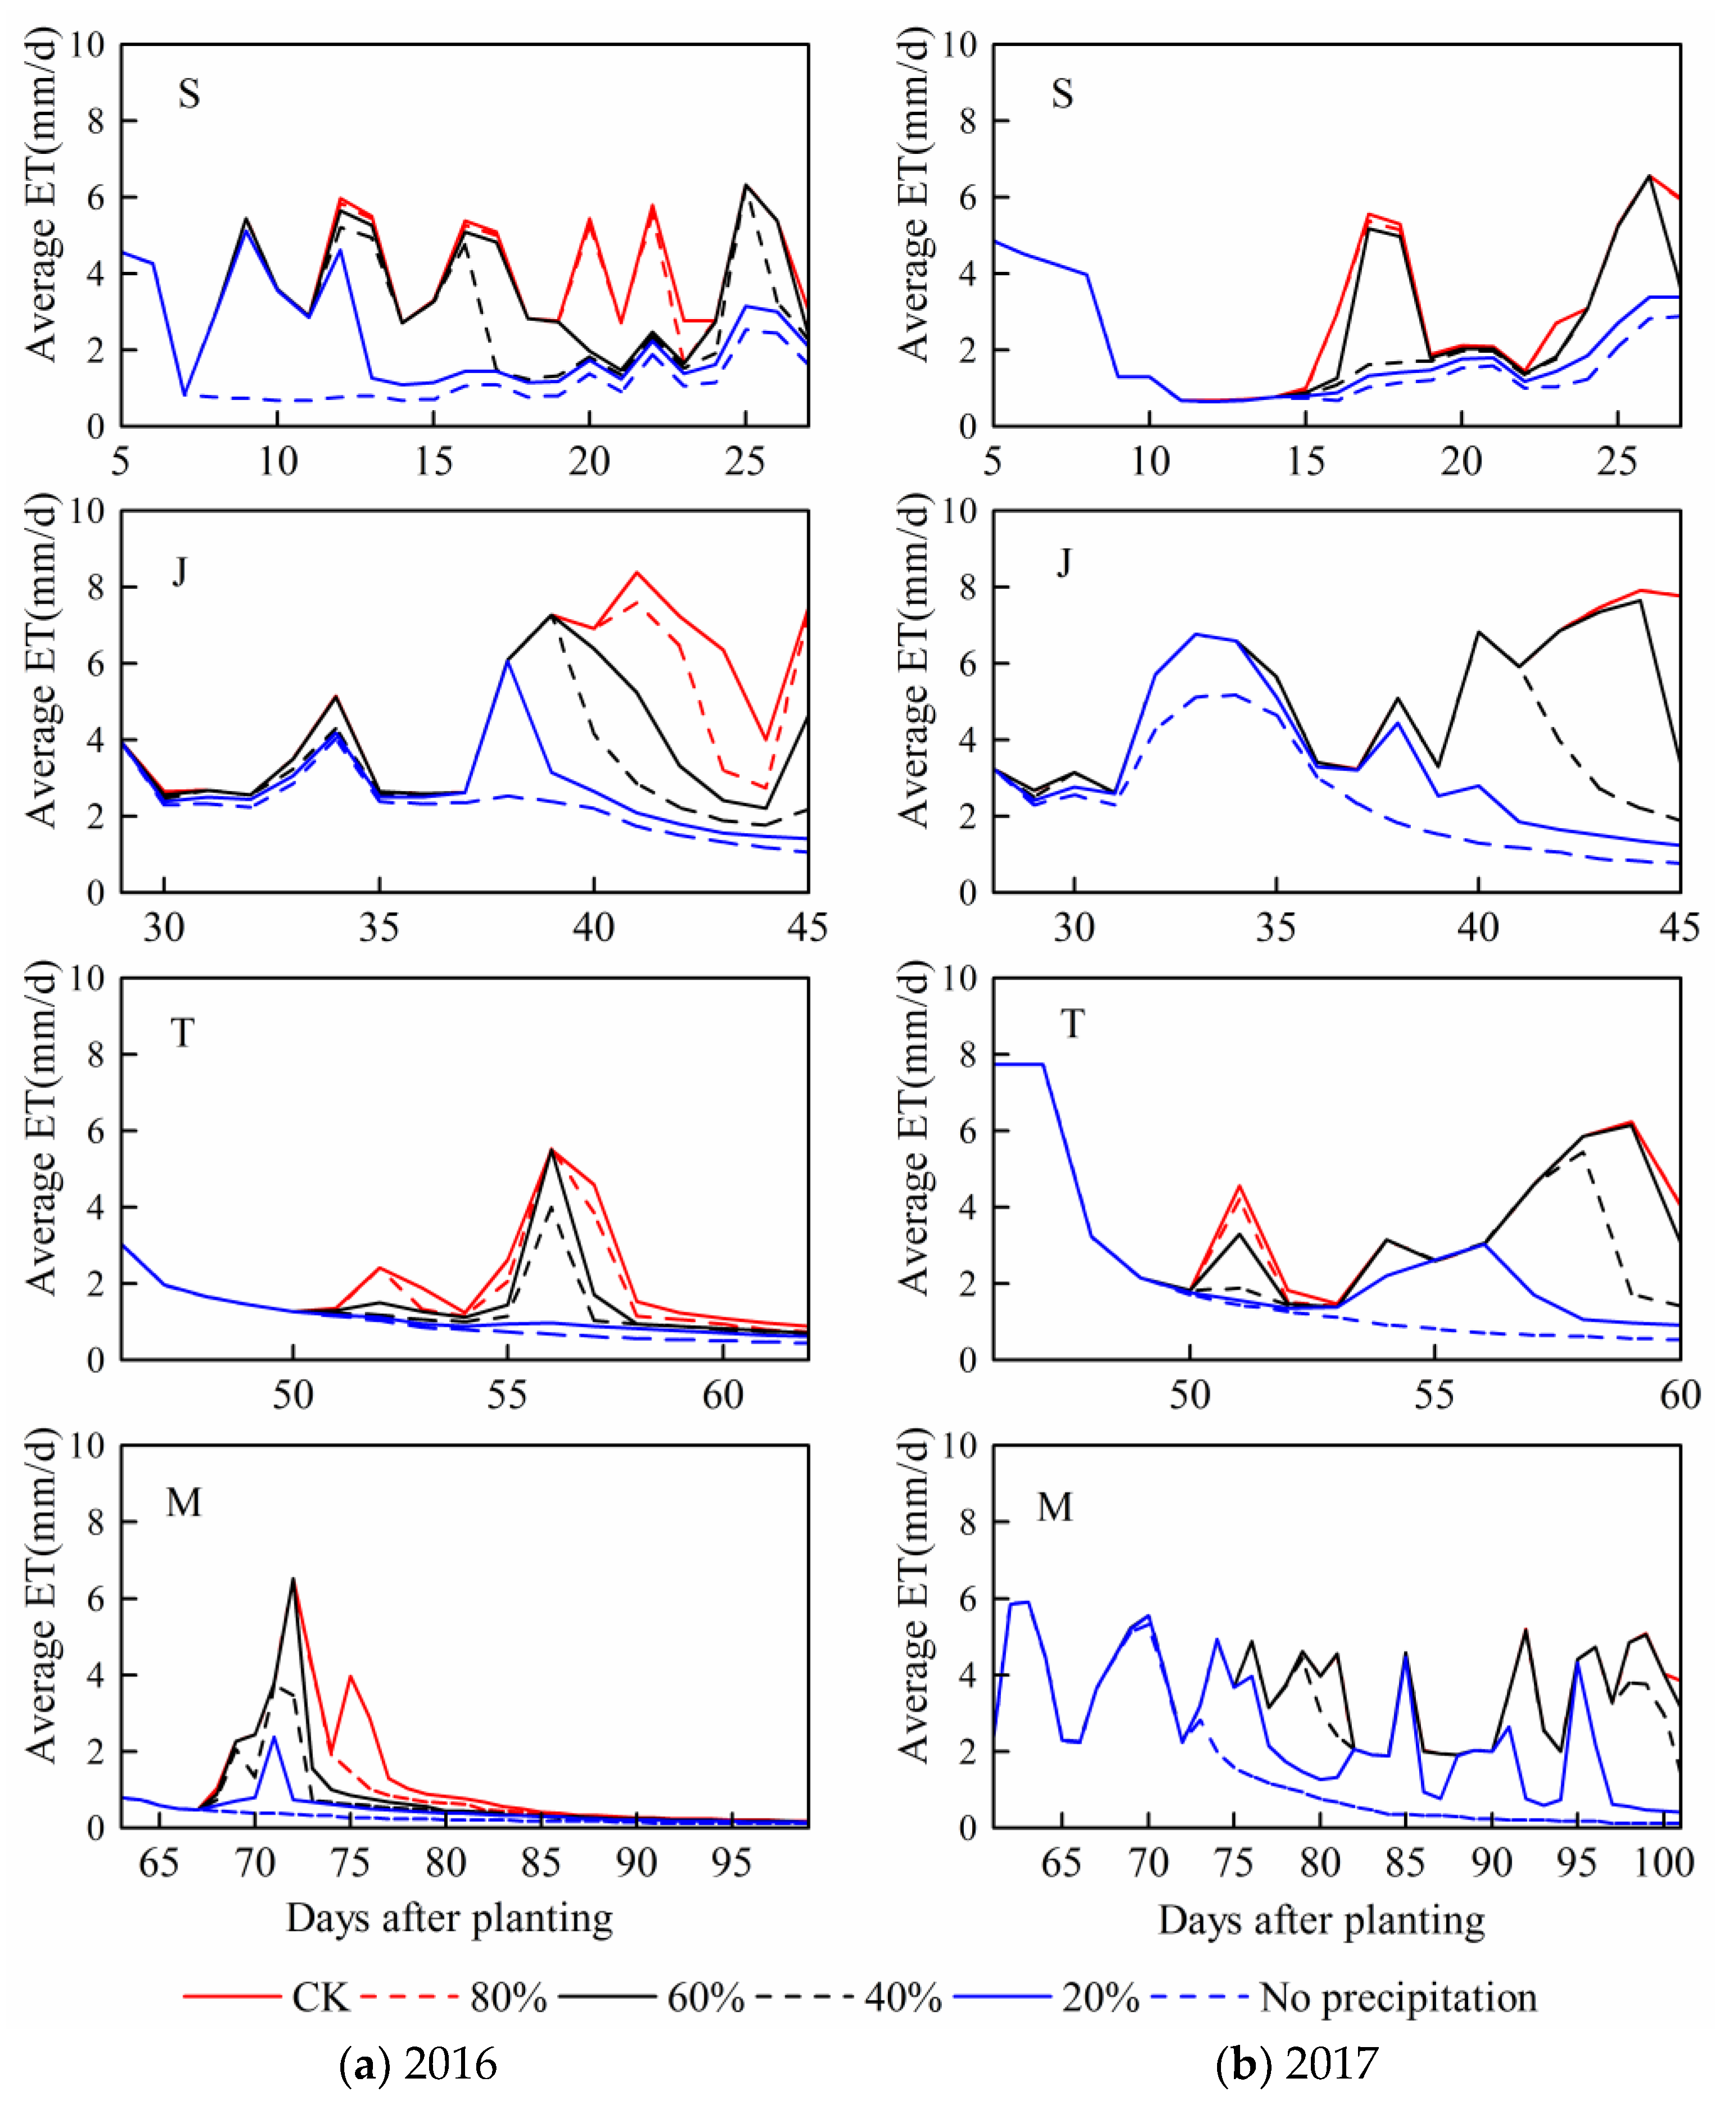
For each stage, the daily soil water deficit under patterns with relatively sufficient precipitation were obviously lower. By contrast,
SWD under no precipitation condition at each maize growth stage were basically the largest. The soil water content gradually decreased with the maize water consumption, then it increased after rainfall event, with
SWD change accordingly (
Figure 7).
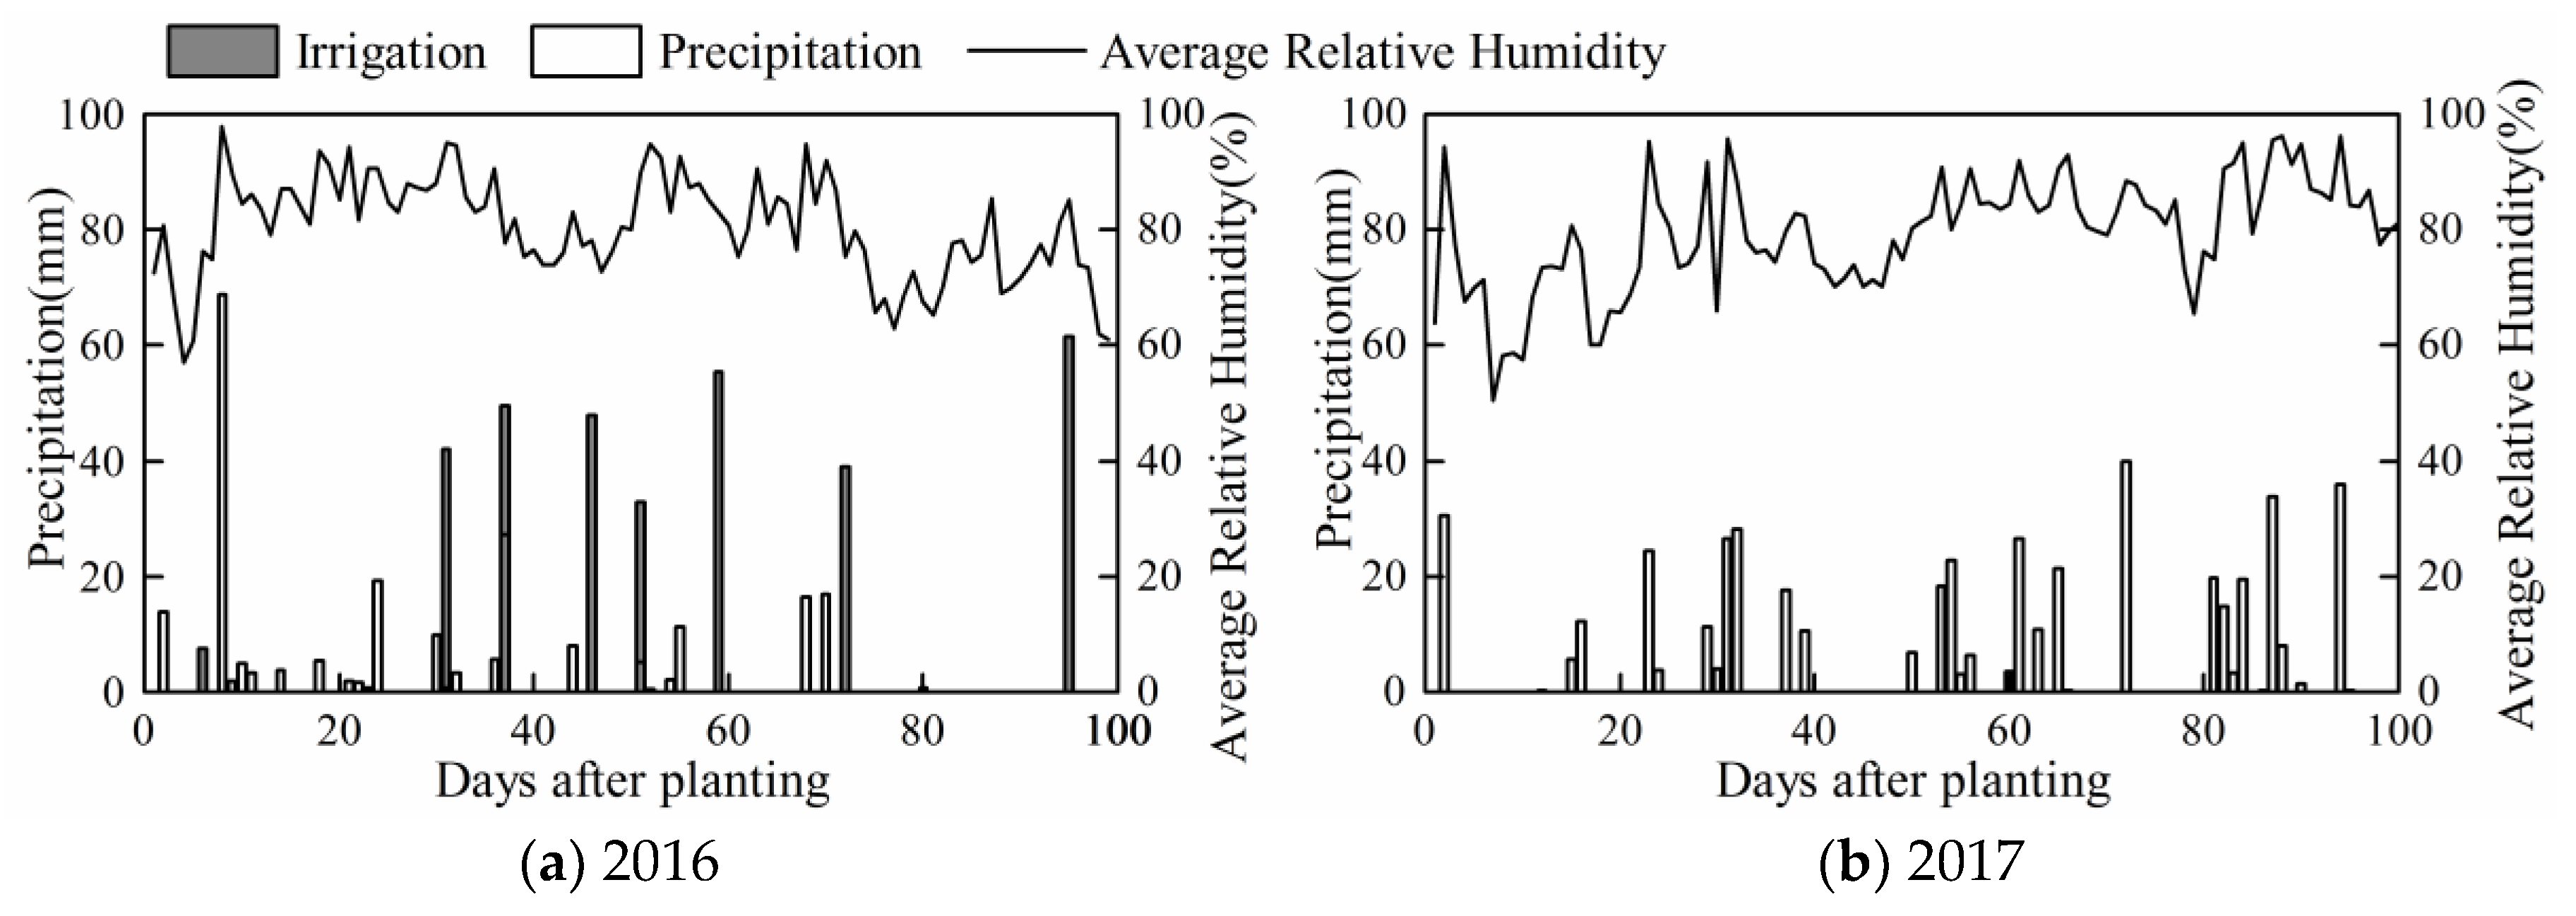
SWD during the seedling and jointing stages fluctuated more frequently than those during the following two stages in the 2016 season. However, the values of SWD during the tasseling and milking stages were relatively higher. These results were accorded with the actual situation that the precipitation events mainly occurred at summer maize earlier growth period in 2016. The actual precipitation amount during the four stages in the 2016 season were respectively 111, 55, 19, and 34 mm. However, SWD fluctuated more frequently during the milking stage in 2017. Similarly, it was related to the precipitation during each maize growth stage. The actual precipitation amount at the milking stage in 2017 had reached 210 mm, which was the largest among four stages in the season. In a word, the simulated soil water content and corresponding SWD could accurately reflect the actual water deficit processes during maize growth period under various drought conditions, the calibrated and validated model was reliable and could be used for building sensitivity curves.
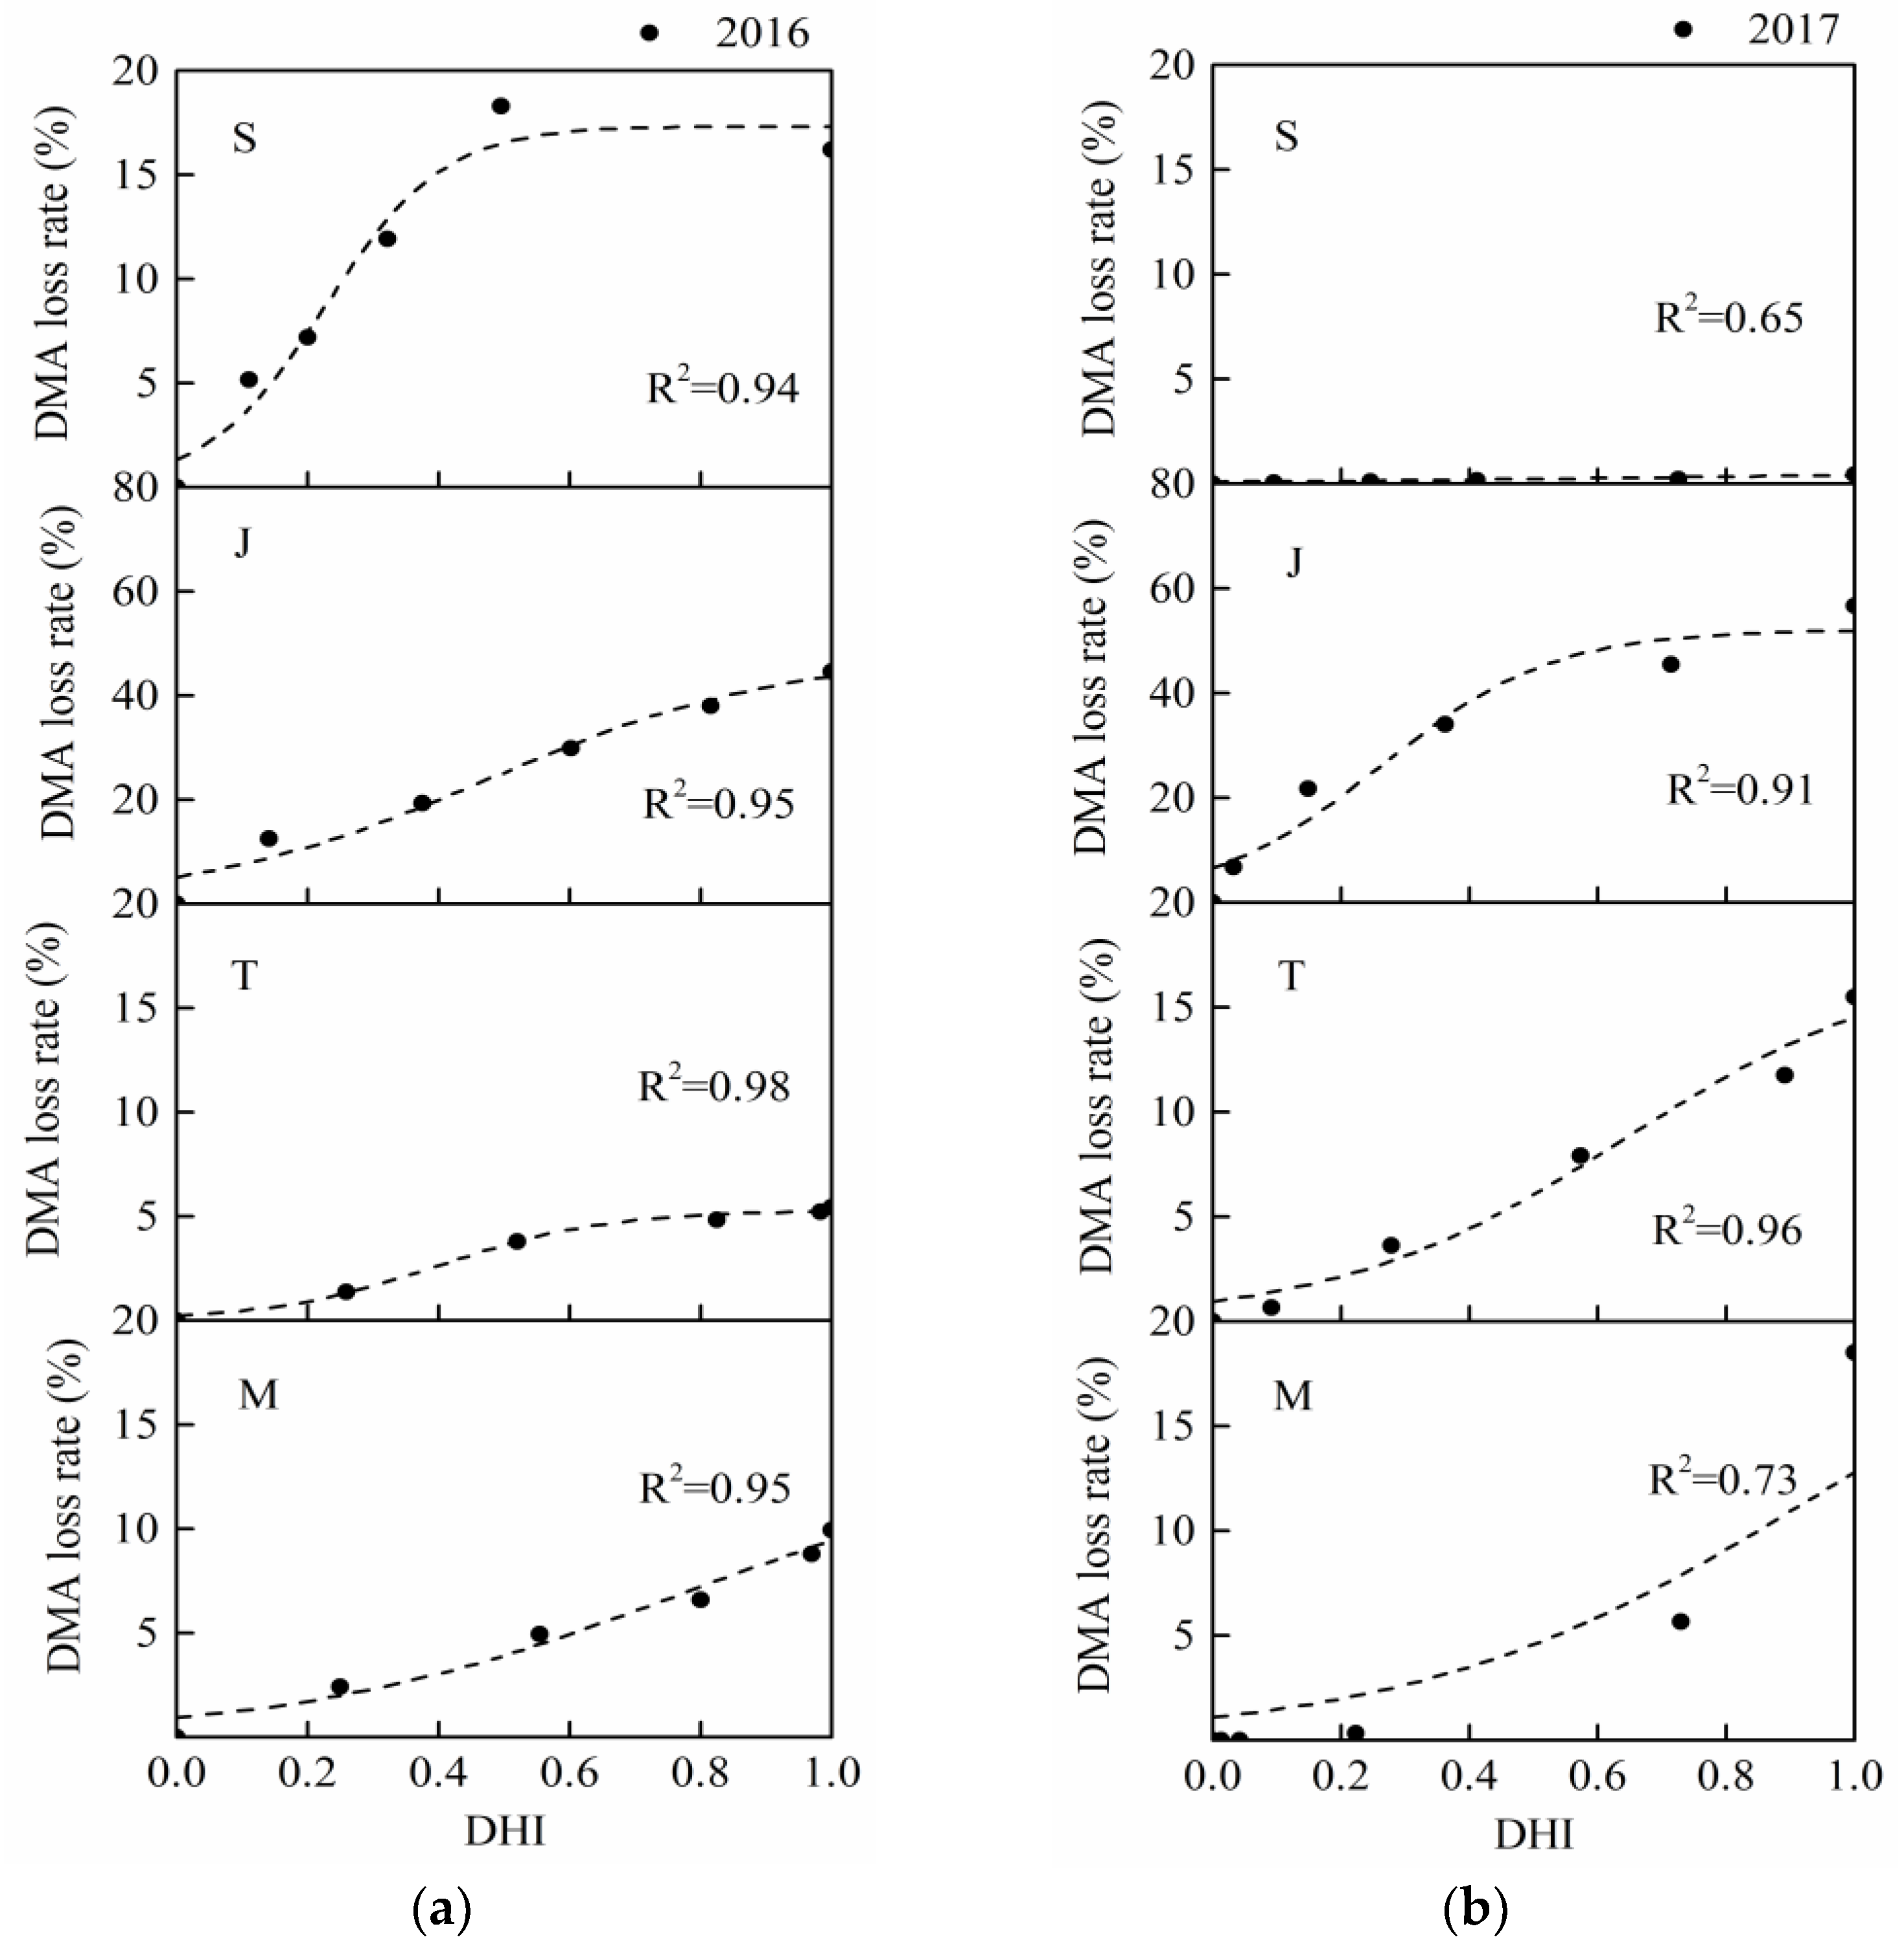
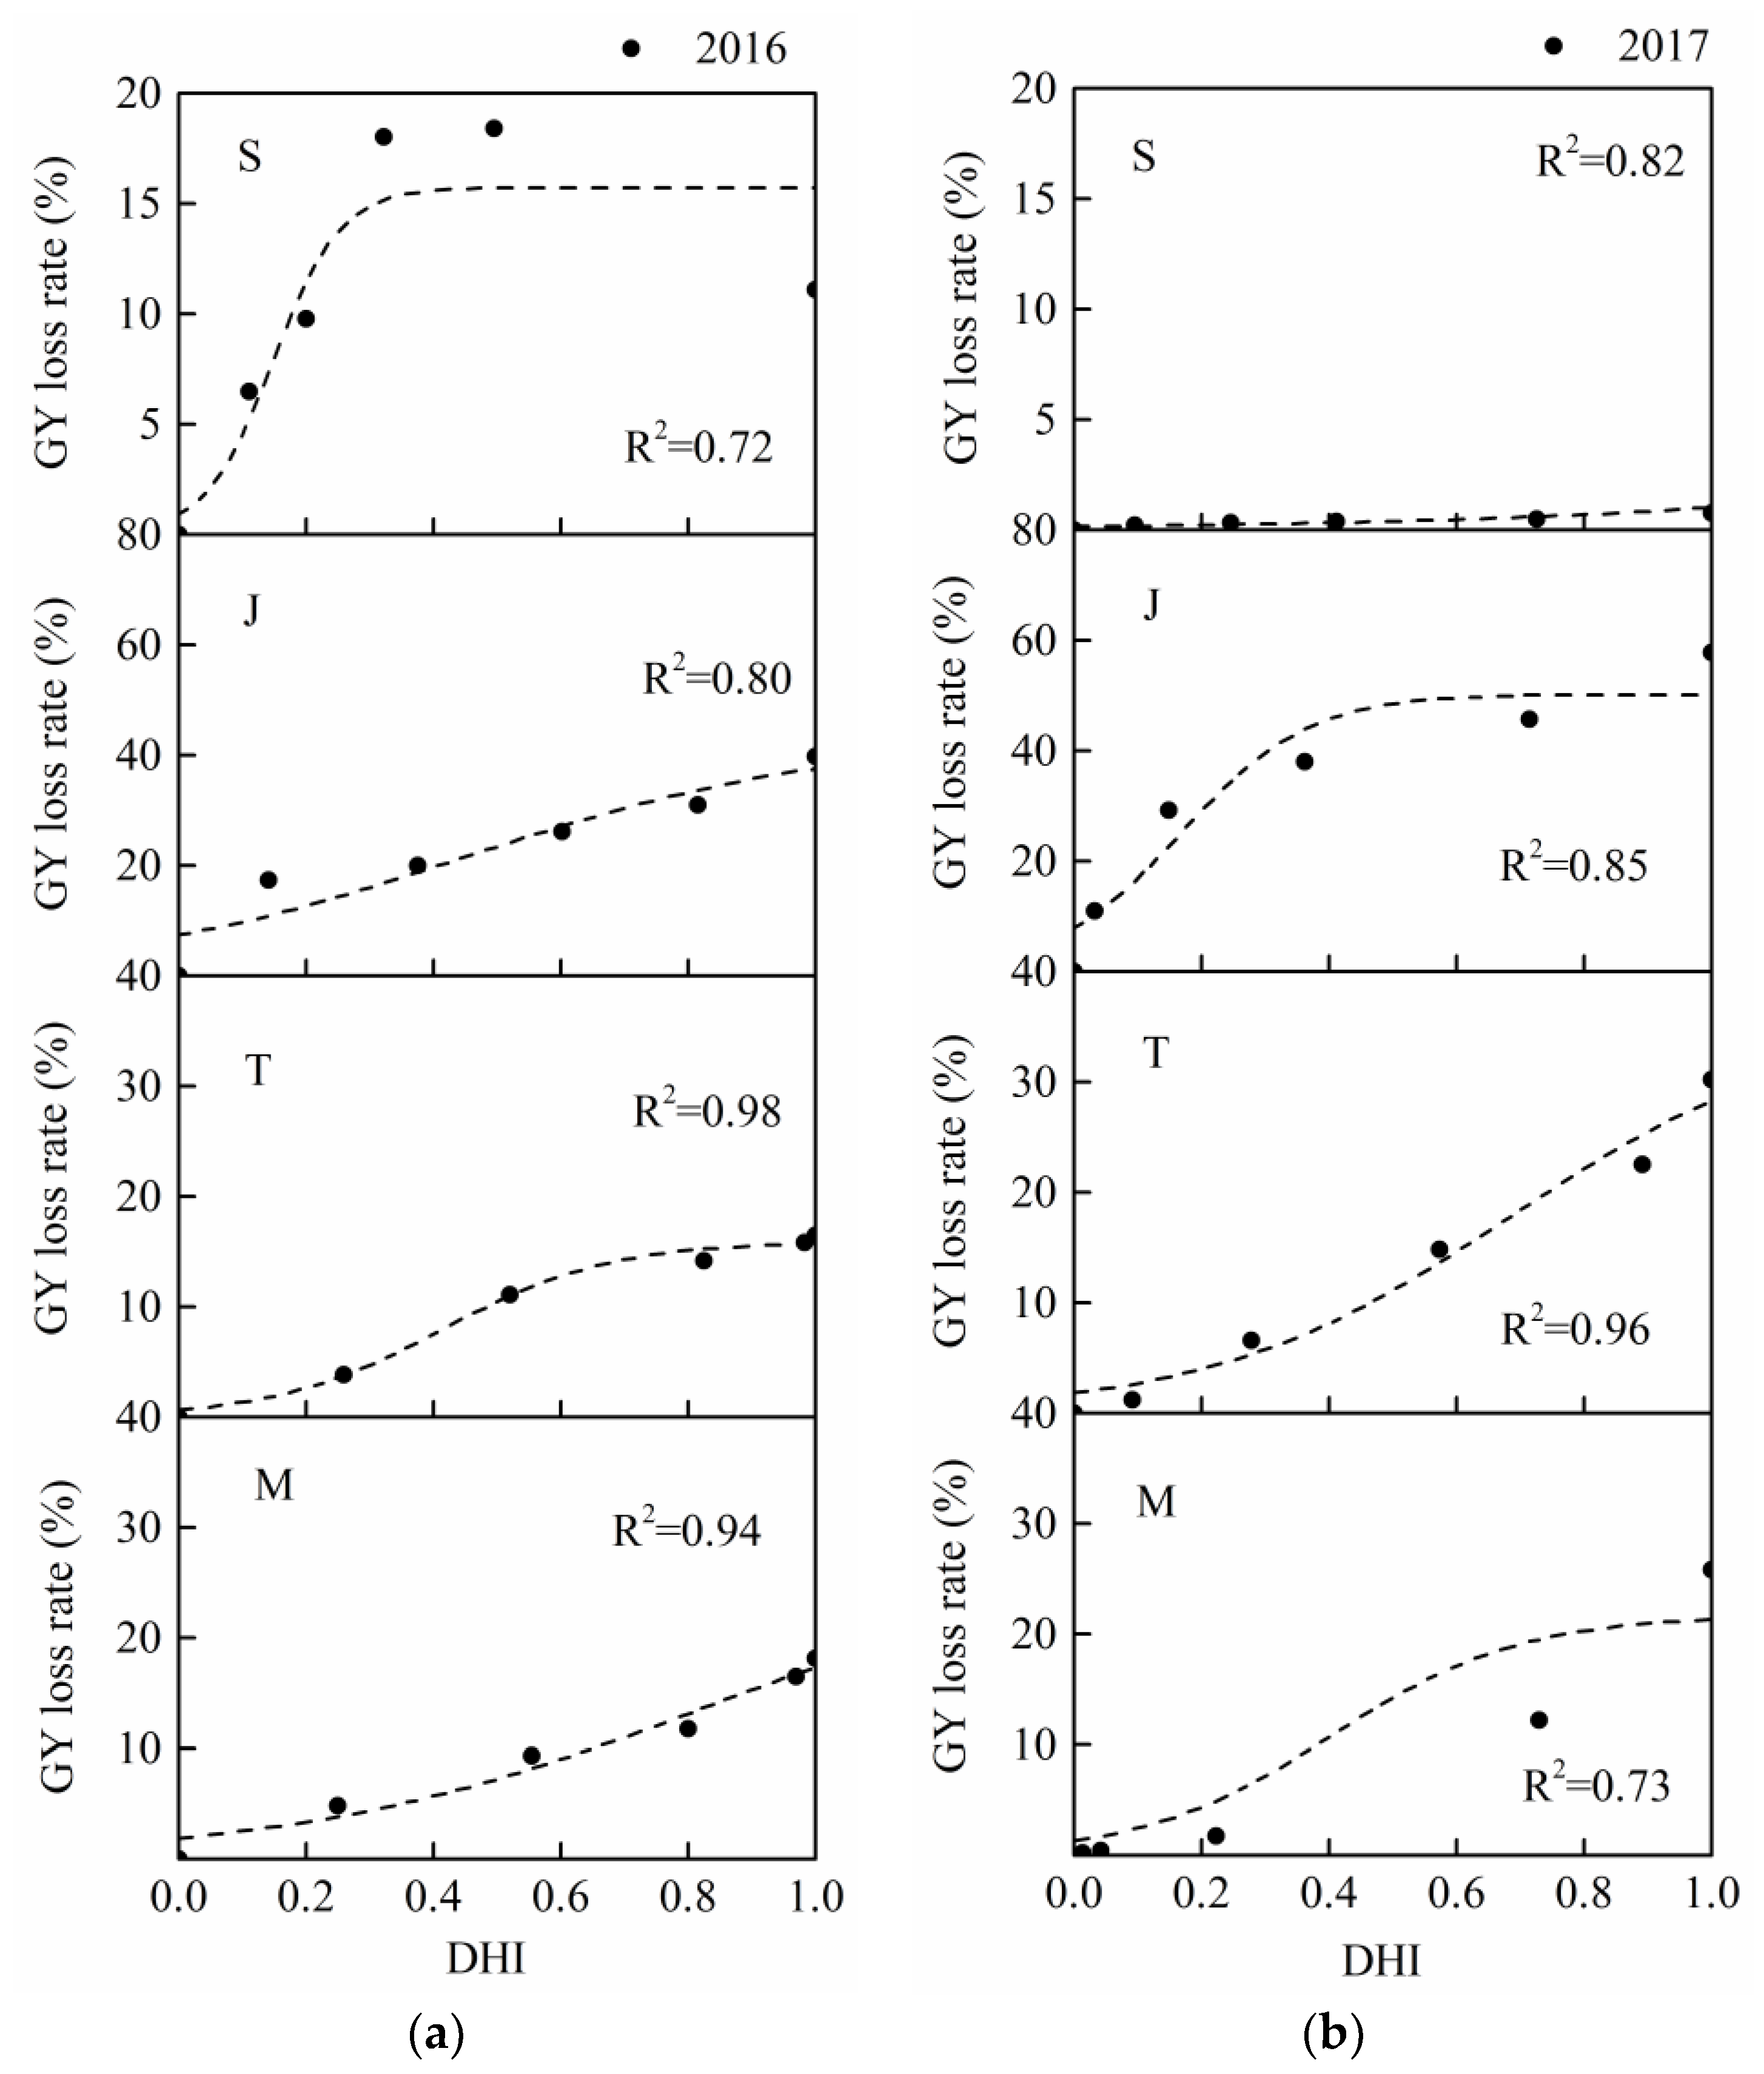
3.4. Summer Maize Sensitivity Curves
The coefficients of determination (
R2) of summer maize drought loss sensitivity curves were all higher than 0.7 (
Table 7 and
Table 8), and this the S-shaped function had a clear physical meaning. This result also showed that it was suitable and accurate to describe the changes of maize growth damage with water deficit intensity (
Figure 9 and
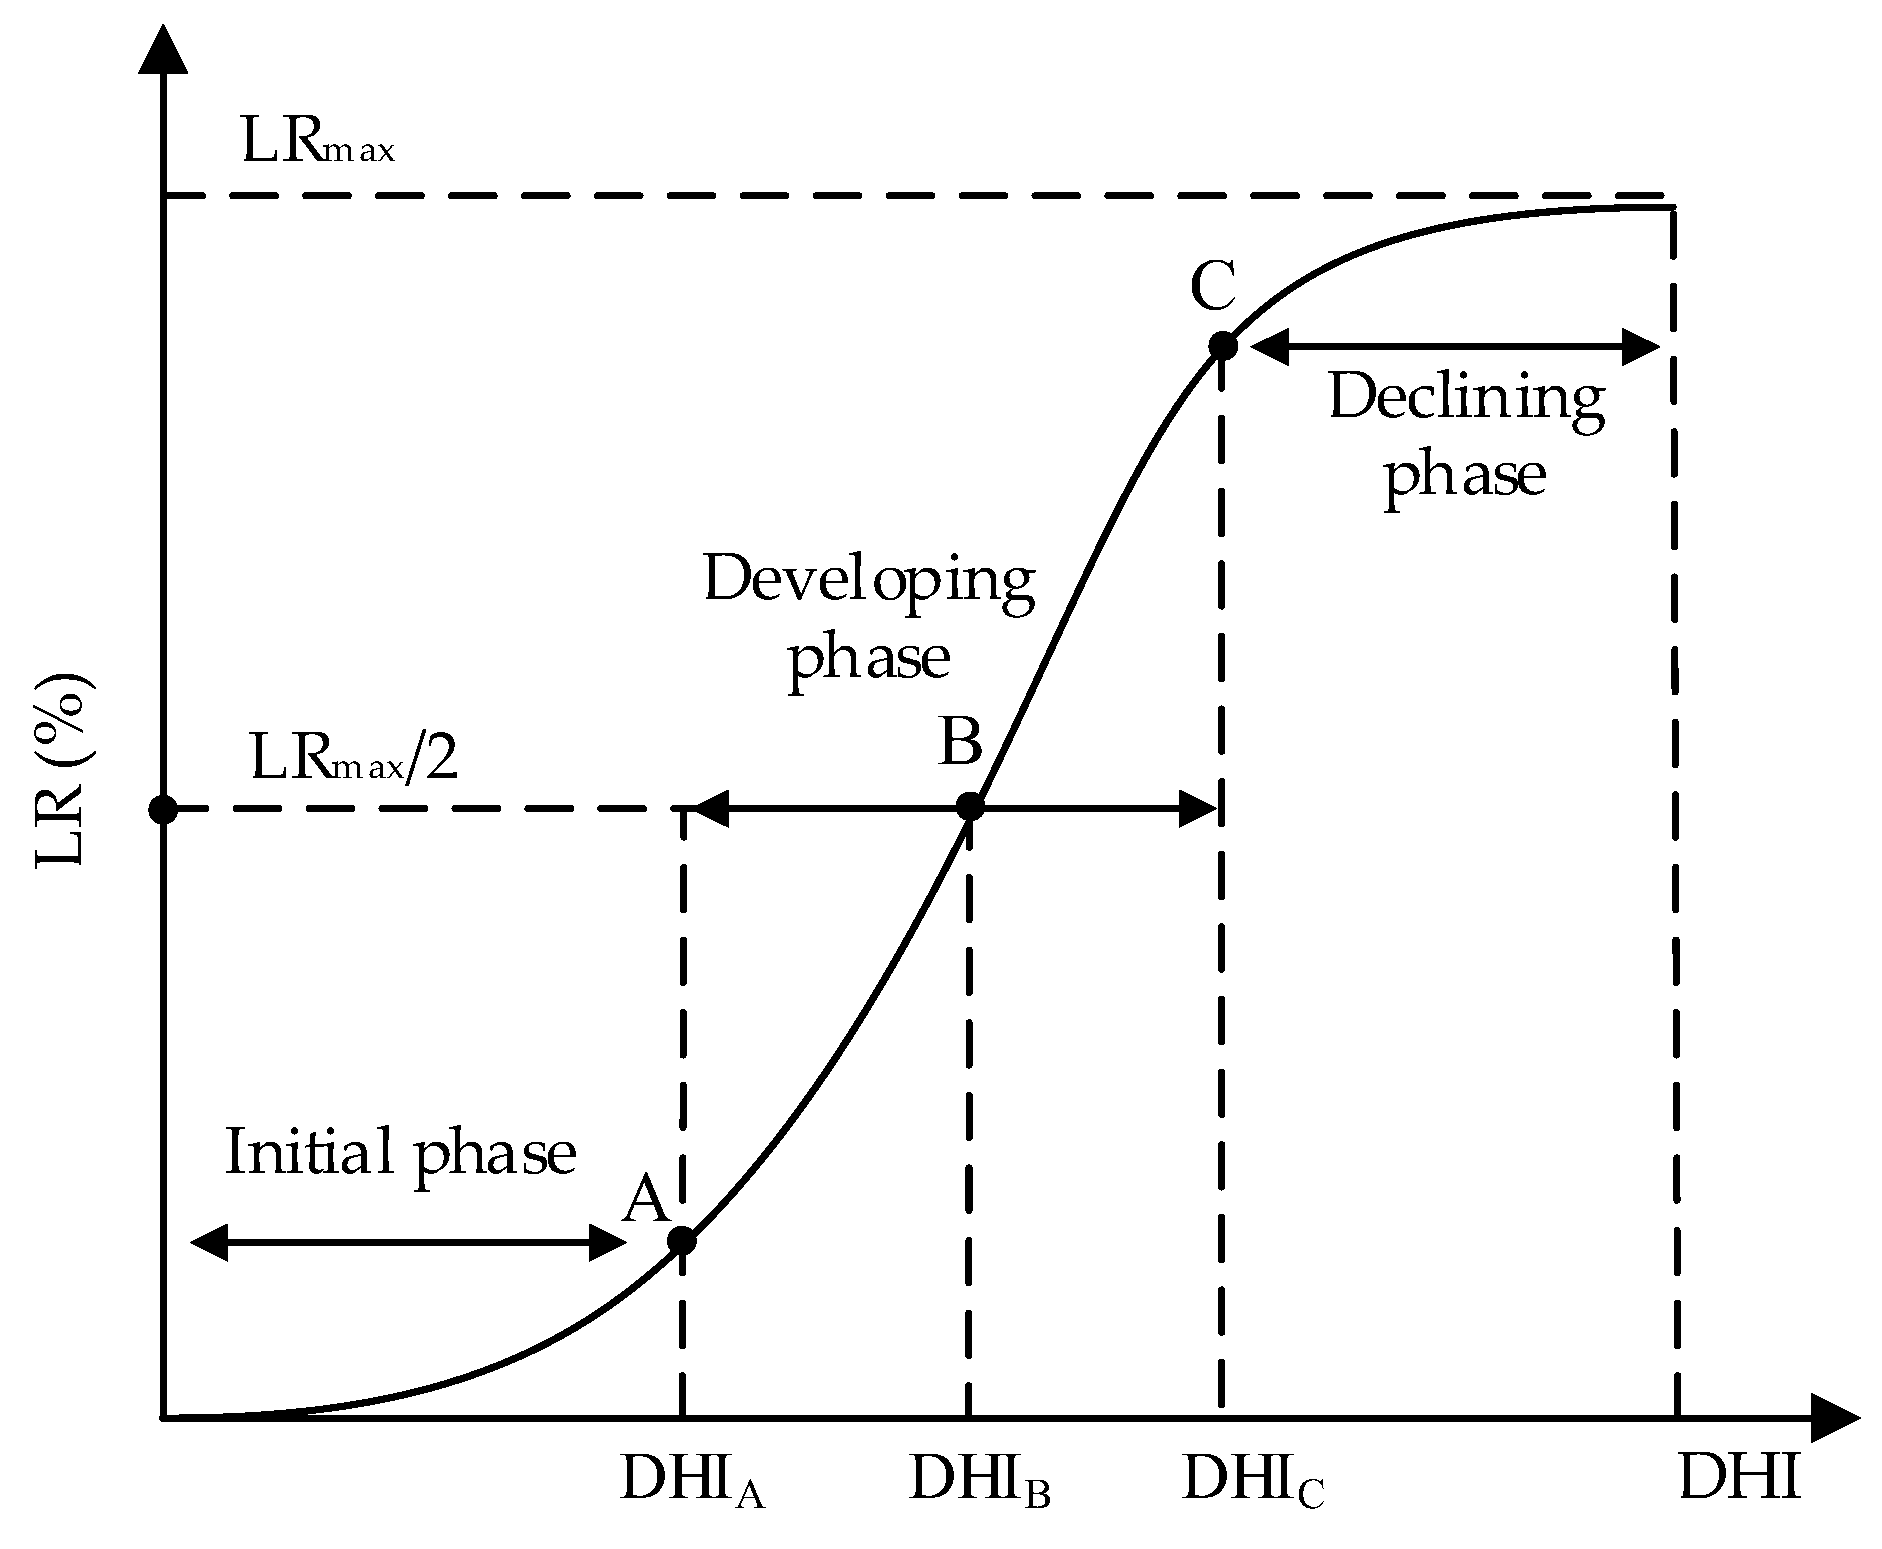
Figure 10). The curves of four periods for the two seasons had the similar tendencies. According to the physical meanings of parameters in the S-shaped damage curve [
35],
LRmax reflects the upper limit of maize GY loss or DMA loss. The highest GY loss rates in the 2016 and 2017 seasons both occurred at the jointing stage, the values were 43% and 50% (
Table 7), respectively. Moreover, the values of
LRmax during the seedling stage were much lower (16% and 2% in 2016 and 2017, respectively). There were similar results for the DMA loss curves, the largest values of
LRmax occurred at the jointing stage and those during the seedling stage were the lowest (
Table 8). This result indicated that the growth damage was the most serious if the maize plants suffered severe drought stress during the jointing stage. Thus, maize growth was more sensitive to drought stress during the jointing stage when the drought degree was high, and water supply should be guaranteed. Meanwhile, maize had a less loss when the plants experienced a severe water stress during the seedling stage. Moreover, it reflected that the influences of serious drought stress during each maize growth on dry matter and yield formation were basically consistent. Similar results were reported by Cakir et al. [
41], who found that drought stress during the maize jointing stage reduced the grain yield by 57–63%, while the reductions were only 20–38% caused by stress at other stages. Furthermore, previous studies found that the crops could partially recover from the previous drought stress after the stress was relieved during the following growth periods, the loss caused by the early drought may be compensated by this recovery ability [
42,
43].
The fact that water stress reduces plant leaf area has been shown in many studies [
41,
44]. Furthermore, deficit irrigation during plant vegetative growth phase may inhibit the leaf development, thereby limit the canopy development [
45]. Stone et al. [
46] studied the responses of sweet corn biomass and yield formation to duration and severity of water deficit, and found that the yield was strongly related to the biomass, and the biomass was reduced by water deficit because of the reduced total radiation interception, especially for the early water deficit treatments. Moreover, drought during plant vegetative growth phase may lead to a premature or postponed tendency of the following stages [
47], which affects the reproductive growth and kernel development of plant. In addition, although the water deficit at vegetative stage may reduce biomass accumulation, the negative influence could be compensated by an adequate irrigation during the later growth periods [
48]. Farré et al. [
49] discovered that deficit irrigation at early vegetative phase reduced maize yield in 1995 but not in 1996, which was due to the much lower seasonal rainfall in 1995. Therefore, the effect of compensation may not be obvious if the irrigation at the following stages are not sufficient. Similarly, for the summer maize sensitivity curve results in this study, the upper limits of drought loss on sensitivity curves at the seedling stage in 2016 were both higher than those in 2017 (
Figure 9 and
Figure 10), which was consistent with the fact that the precipitation during the 2017 season was more adequate than that in 2016.
The parameter
β indicates the speed to attain the upper limit of maize drought growth loss. At a given growth stage, a higher value of
β indicates that the loss may reach the limit under a slighter drought intensity. Taking the grain yield loss sensitivity curves in the 2016 season (
Figure 9) as an example, the largest value of
β in the 2016 season was 18.80 and this value was found at the sensitivity curve during the seedling stage. However, the maximum value of
β in 2017 was found at the jointing stage (9.98 in
Table 7). This was likely due to a lower precipitation in 2016, which mainly happened at the early growth period, the influence of drought stress at the seedling stage was further exaggerated by the continued stress during the following stages. Moreover, although the upper limits of the sensitivity curves in these two stages were lower than those in other stages, the loss rate reached the corresponding limit more quickly (the value of
DHI which corresponded to the disaster-ceasing point was lower). This finding may be explained by the fact that the resistance abilities to water deficit of summer maize during the vegetative growth period were small [
41]. Thus, summer maize tolerance to water deficit at the seedling and jointing stages were relatively weak, and grain yield accumulation was more sensitive to drought stress during these two stages when the stress was slight, the intensity of water stress during the two periods should be controlled.
The DHI of the drought disaster-inducing points on maize GY loss sensitivity curves during the seedling, jointing, tasseling, and milking stages in the 2017 seasons were 0.30, 0.04, 0.38, and 0.21, respectively. For the DMA loss sensitivity curves, the corresponding DHI were 0.47, 0.08, 0.35, and 0.46. There were similar results in 2016, the smallest DHI of the disaster-inducing points on GY and DMA loss sensitivity curves were 0.07 and 0.11, respectively, which were also found during the jointing stage. Moreover, the DHI of the drought disaster-breaking points on GY loss sensitivity curves at the seedling, jointing, tasseling, and milking stages respectively were 0.82, 0.17, 0.69, and 0.40 in the 2017 season. For DMA curves, the corresponding DHI were 0.94, 0.26, 0.64, and 0.81, respectively. The minimum DHI for GY and DMA curves were both found during the jointing stage. However, the minimum DHI on the breaking points on GY and DMA curves were both discovered at the seedling stage in 2016 (0.15 and 0.23). This difference could be induced by a relatively uneven precipitation in 2016. The precipitation during the whole maize growth period was lower, and mainly occurred at the seedling stage. This may magnify the effects of drought during this stage.


