Article

Defining Spatial Priorities for Irrigation Development Using the Soil Conservation and Water Use Efficiency Criteria

1
Department of Water Management, University of Novi Sad, Faculty of Agriculture, Trg Dositeja Obradovića 8, 21000 Novi Sad, Serbia
2
Department of Forest Biomaterials and Technology, Swedish University of Agricultural Sciences, Skogsmarksgränd 17, 90183 Umeå, Sweden
*
Authors to whom correspondence should be addressed.
Agronomy 2019, 9(6), 324; https://doi.org/10.3390/agronomy9060324
Submission received: 25 May 2019 / Revised: 3 June 2019 / Accepted: 4 June 2019 / Published: 20 June 2019
(This article belongs to the Section Water Use and Irrigation)

Abstract

:
This paper presents a methodology for defining spatial priorities for irrigation development in Vojvodina Province (Serbia). The purpose of the methodology is to take into account several UN Sustainable Development Goals and to try to minimize land degradation, while maximizing water use efficiency. In the first step, areas that can be irrigated over long-term periods with minimal risk of soil degradation were selected in the geographic information system (GIS) environment. Then, three experts used the analytic hierarchy process (AHP) to define the weights of four criteria related to water use efficiency. After that, the consensus model was used to obtain group weights of the criteria. These criteria were standardized and presented as GIS layers. Finally, cell values in all the layers were multiplied by corresponding consensus weights of the criteria. The weighted layers are summarized in the final map representing spatial priorities for irrigation development.

1. Introduction

As reported by the UN [1], water scarcity already affects around 1.2 billion people while 500 million people are approaching this situation. Similar problems can be expected in the Republic of Serbia (Figure 1a) where the frequency and intensity of droughts have increased, especially during the summer crop-growing season [2]. It has been estimated that agricultural production in Serbia will decrease by 10% in the second half of this century due to climate change. Vojvodina Province (Figure 1b)—as the main agricultural region in Serbia with 75% of agricultural land (more than 16,000 km2)—is particularly vulnerable because the variation in crop yields in Vojvodina is strongly correlated with the amount and distribution of rain during the growing season [3]. Drought events and occurrences of inland excess water in Serbia affect agricultural production and the food industry, which leads to variations of supply and demand, and fluctuations of the price of agricultural products [4]. Drought may become a problem in the future development of Serbia [5].
In the Vojvodina region, there are natural resources and high potential for irrigation development [6]. According to the data of the public water management company Vode Vojvodine, it is possible to irrigate 936,000 hectares of agricultural land in this region [7]. Despite the well-known fact that irrigation increases agricultural productivity, the percentage of irrigated land is very low (3%) (Figure 1c). Intensification of irrigation could ensure stable and increased crop production, and the expansion of exports into foreign markets, which would have a positive impact on the agricultural sector and the entire economy of Serbia [8]. For that reason, the agricultural policy of Serbia prioritizes expanding the area of land under irrigation, especially in Vojvodina Province.
The relevant literature [3,9,10] presents examples of evaluations of the suitability of land for irrigation, where different criteria are analyzed. To the best of our knowledge, the focus in those methodologies was not sustainable development—defined as achieving economic, social, and environmental well-being, without compromising the ability of future generations to meet their needs [11]. Therefore, in this paper, we present a methodology for defining spatial priorities for irrigation development based on three targets defined in the UN Sustainable Development Goals [12]:
(T1)
By 2030, combat desertification, restore degraded land and soil, including land affected by desertification, drought and floods, and strive to achieve a land degradation-neutral world (the goal 15.3);
(T2)
Integrate climate change measures into national policies, strategies, and planning (the goal 13.2);
(T3)
By 2030, substantially increase water use efficiency across all sectors (the goal 6.4).
The structure of this paper is as follows. After the introduction, Section 2 gives an overview of the applied methodology based on the UN Sustainable Development Goals, and the combining of the geographic information system (GIS) and analytic hierarchy process (AHP). The results of the application of the methodology are presented in Section 3, followed by the concluding remarks in Section 4.

2. Materials and Methods

For the purpose of defining spatial priorities for irrigation development based on the three targets indicated in the UN Sustainable Development Goals, we propose treating soil and water conservation criteria separately, not combined as they are in previous case studies. In order to achieve T1 (a land degradation-neutral world), we first selected land that can be irrigated over long-term periods with low (or no) risk of land degradation. These areas are defined according to the physical and chemical properties of the soil. Then, taking into account T2 (integrate climate change measures into planning) and T3 (increase water-use efficiency), the criteria related to water conservation and water use efficiency—availability of water in the root zone, water deficit, drought hazard, and distance from water bodies—were used to define spatial priorities for irrigation. These criteria were analyzed in a group context by using the geographic information system (GIS) and the multi-criteria decision-making method (MCDM) named the analytic hierarchy process (AHP) [13] in combination with the consensus model. Although there are several MCDMs that can be used in combination with GIS, AHP is used in more than 80% of all MCDA–GIS articles [14]. The main reason for this is the fact that AHP is understandable and user friendly, easy to use in group settings, and has the ability to combine qualitative and quantitative data in an effective manner [15]. In this paper, GIS was used to present all the criteria spatially (as maps or raster layers) and to enable their combination (summarization) in the final suitability map for irrigation, while the AHP and the consensus models were used for defining the corresponding criteria weights.
The methodology presented in Figure 2 was applied to define spatial priorities for irrigation development. In the first step, the areas which can be irrigated over long-term periods with minimal risk of soil degradation were selected in the GIS environment. Then, agricultural experts used AHP to elicit weights of the four criteria related to water conservation and water use efficiency. After that, the geometric cardinal consensus model (GCCM) [16] was used to obtain group weights of criteria. All computations regarding the application of AHP and the consensus model are programed in FORTRAN programming language.
In the next step, these criteria were standardized in the GIS environment. A value on a scale from 1 (low priority for irrigation) to 5 (very high priority) was assigned to each cell in the four criteria layers. Finally, the cell values were multiplied by the corresponding weights of the criteria and summarized in the GIS software using a raster calculator. The final result is the map of the spatial priorities for irrigation development in Vojvodina Province.

2.1. The Analytic Hierarchy Process (AHP)

AHP [13] is a multi-criteria decision-making method that enables decomposition of a complex decision problem into a hierarchy where the goal is at the top level, criteria and sub-criteria (if any) lie below the goal, and alternatives are placed at the lowest level of the hierarchy. In AHP, the decision maker (expert) compares all the elements in pairs at one hierarchy level in relation to all the elements on a higher level using Saaty’s importance scale (Table 1).
In addition, there are many cases [17] when AHP is only used to derive the weights of the criteria. Similarly, in this paper, AHP is used only for defining the weights of GIS layers (which represent the criteria). After all the n criteria are compared in pairs, numerical values that are equivalent to linguistic definitions are ordered into a matrix A, which is symmetric and reciprocal, that is, all the a i j values are greater than zero, a i j = 1 / a j i , and all the main diagonal elements are equal to one. Then, the weights of the criteria are calculated from the matrix A using one of the several prioritization methods. Here is used the logarithmic least squares (LLS) method [18]—as the required prioritization method for the consensus model used later—where the weights of the criteria are the normalized geometric means of the rows of matrix A:
w i = j = 1 n a i j n i = 1 n ( j = 1 n a i j n )
For the LLS, the geometric consistency index (GCI) is used to measure individual consistency:
G C I ( A ) = 2 ( n 1 ) ( n 2 ) i < j   ( ln ( a i j ) ln ( w i ) + ln ( w j ) ) 2
Matrix A is fully consistent if GCI(A) = 0, or it has acceptable inconsistency if GCI < 0.31 for n = 3, GCI < 0.35 for n = 4, and GCI < 0.37 for n > 4 [19]. Otherwise, the expert needs to revise their judgments.

2.2. The Consensus Model

As previously mentioned, AHP is based on the subjective opinion of the expert, which may result in an unreliable and biased decision. This uncertainty can be decreased if there is a group of experts. In such cases, the implementation of a group decision is easier if the level of consensus among the experts is higher [20]. Very often, a full and unanimous agreement of all the experts, which is a classic definition of consensus, is impossible to achieve in real life. In order to automatically increase the level of consensus among experts, AHP can be combined with compatible consensus models. In this paper, the geometric cardinal consensus model (GCCM) [16] was used, which is based on the iterative modification of judgments within individual matrices so that the distance of individual decisions from a group decision is decreased. According to [16], this model consists of the following steps:
Step 1: Let z = 0 and A z c = ( a i j , z c ) n × n = ( a i j c ) n × n , c = 1 , , m , where m is the number of experts.
Step 2: Let w z g = ( w 1 , z g ,   w 2 , z g , ,   w n , z g ) be the group priority vector obtained by LLS from the group matrix A z g = ( a i j , z g ) n × n , the elements of which are:
a i j , z g = c = 1 m ( a i j , z c ) α c
where z is the number of iterations, and αc is the weights of the experts (in this paper all the experts have equal weights, αc = 0.333).
Step 3: Compute distance between individual judgments a i j , z c and the group priority vector w z g for each A z c . This distance is called the geometric cardinal consensus index (GCCI) and is given by Equation (4):
G C C I ( A z c ) = 2 ( n 1 ) ( n 2 ) i < j i , j = 1 n ( ln ( a i j , z c ) ln ( w i , z g ) + ln ( w j , z g ) ) 2
If for each c, GCCI ≤ 0.001, go to Step 5. Otherwise, proceed to the next step.
Step 4: Select the expert c with the highest GCCI value (the distance between individual and group decision), and then modify the judgments of that expert using the following equation:
a i j , z + 1 c = ( a i j , z c ) θ ( w i , z g w j , z g ) 1 θ ,   where   0 < θ < 1  
In this paper θ = 0.8, which is the same as in [16]. Other matrices in the iteration z+1 remain the same as in the iteration z. After that, go back to Step 2.
Step 5: The output of the consensus model includes the corrected initial individual matrices (where GCCI values are less than 0.001), the number of iterations (z), the group matrix ( A z g ) , and group priority vector w z g .

3. Results

3.1. Step # 1

Miljkovic [21] defined soil suitability classification for irrigation using the following soil properties: soil structure and aggregate stability, humus content, CaCO3 status, pH, salinity, sodicity, etc. The classes of soil suitability for irrigation are defined according to the ability to irrigate without degradation of the soil over long periods of time (Table 2, Figure 3a). In the first step of the proposed methodology, the whole area within the first two classes (values 4 and 5) of soil suitability for irrigation was extracted in the GIS environment (Figure 3b). To minimize the risk of soil degradation, only this area will be analyzed.

3.2. Steps #2–4

According to previously published results, the available data for Vojvodina Province, and the opinions of agricultural and irrigation experts, the four water use efficiency criteria important for defining spatial priorities in irrigation development are identified as follows:
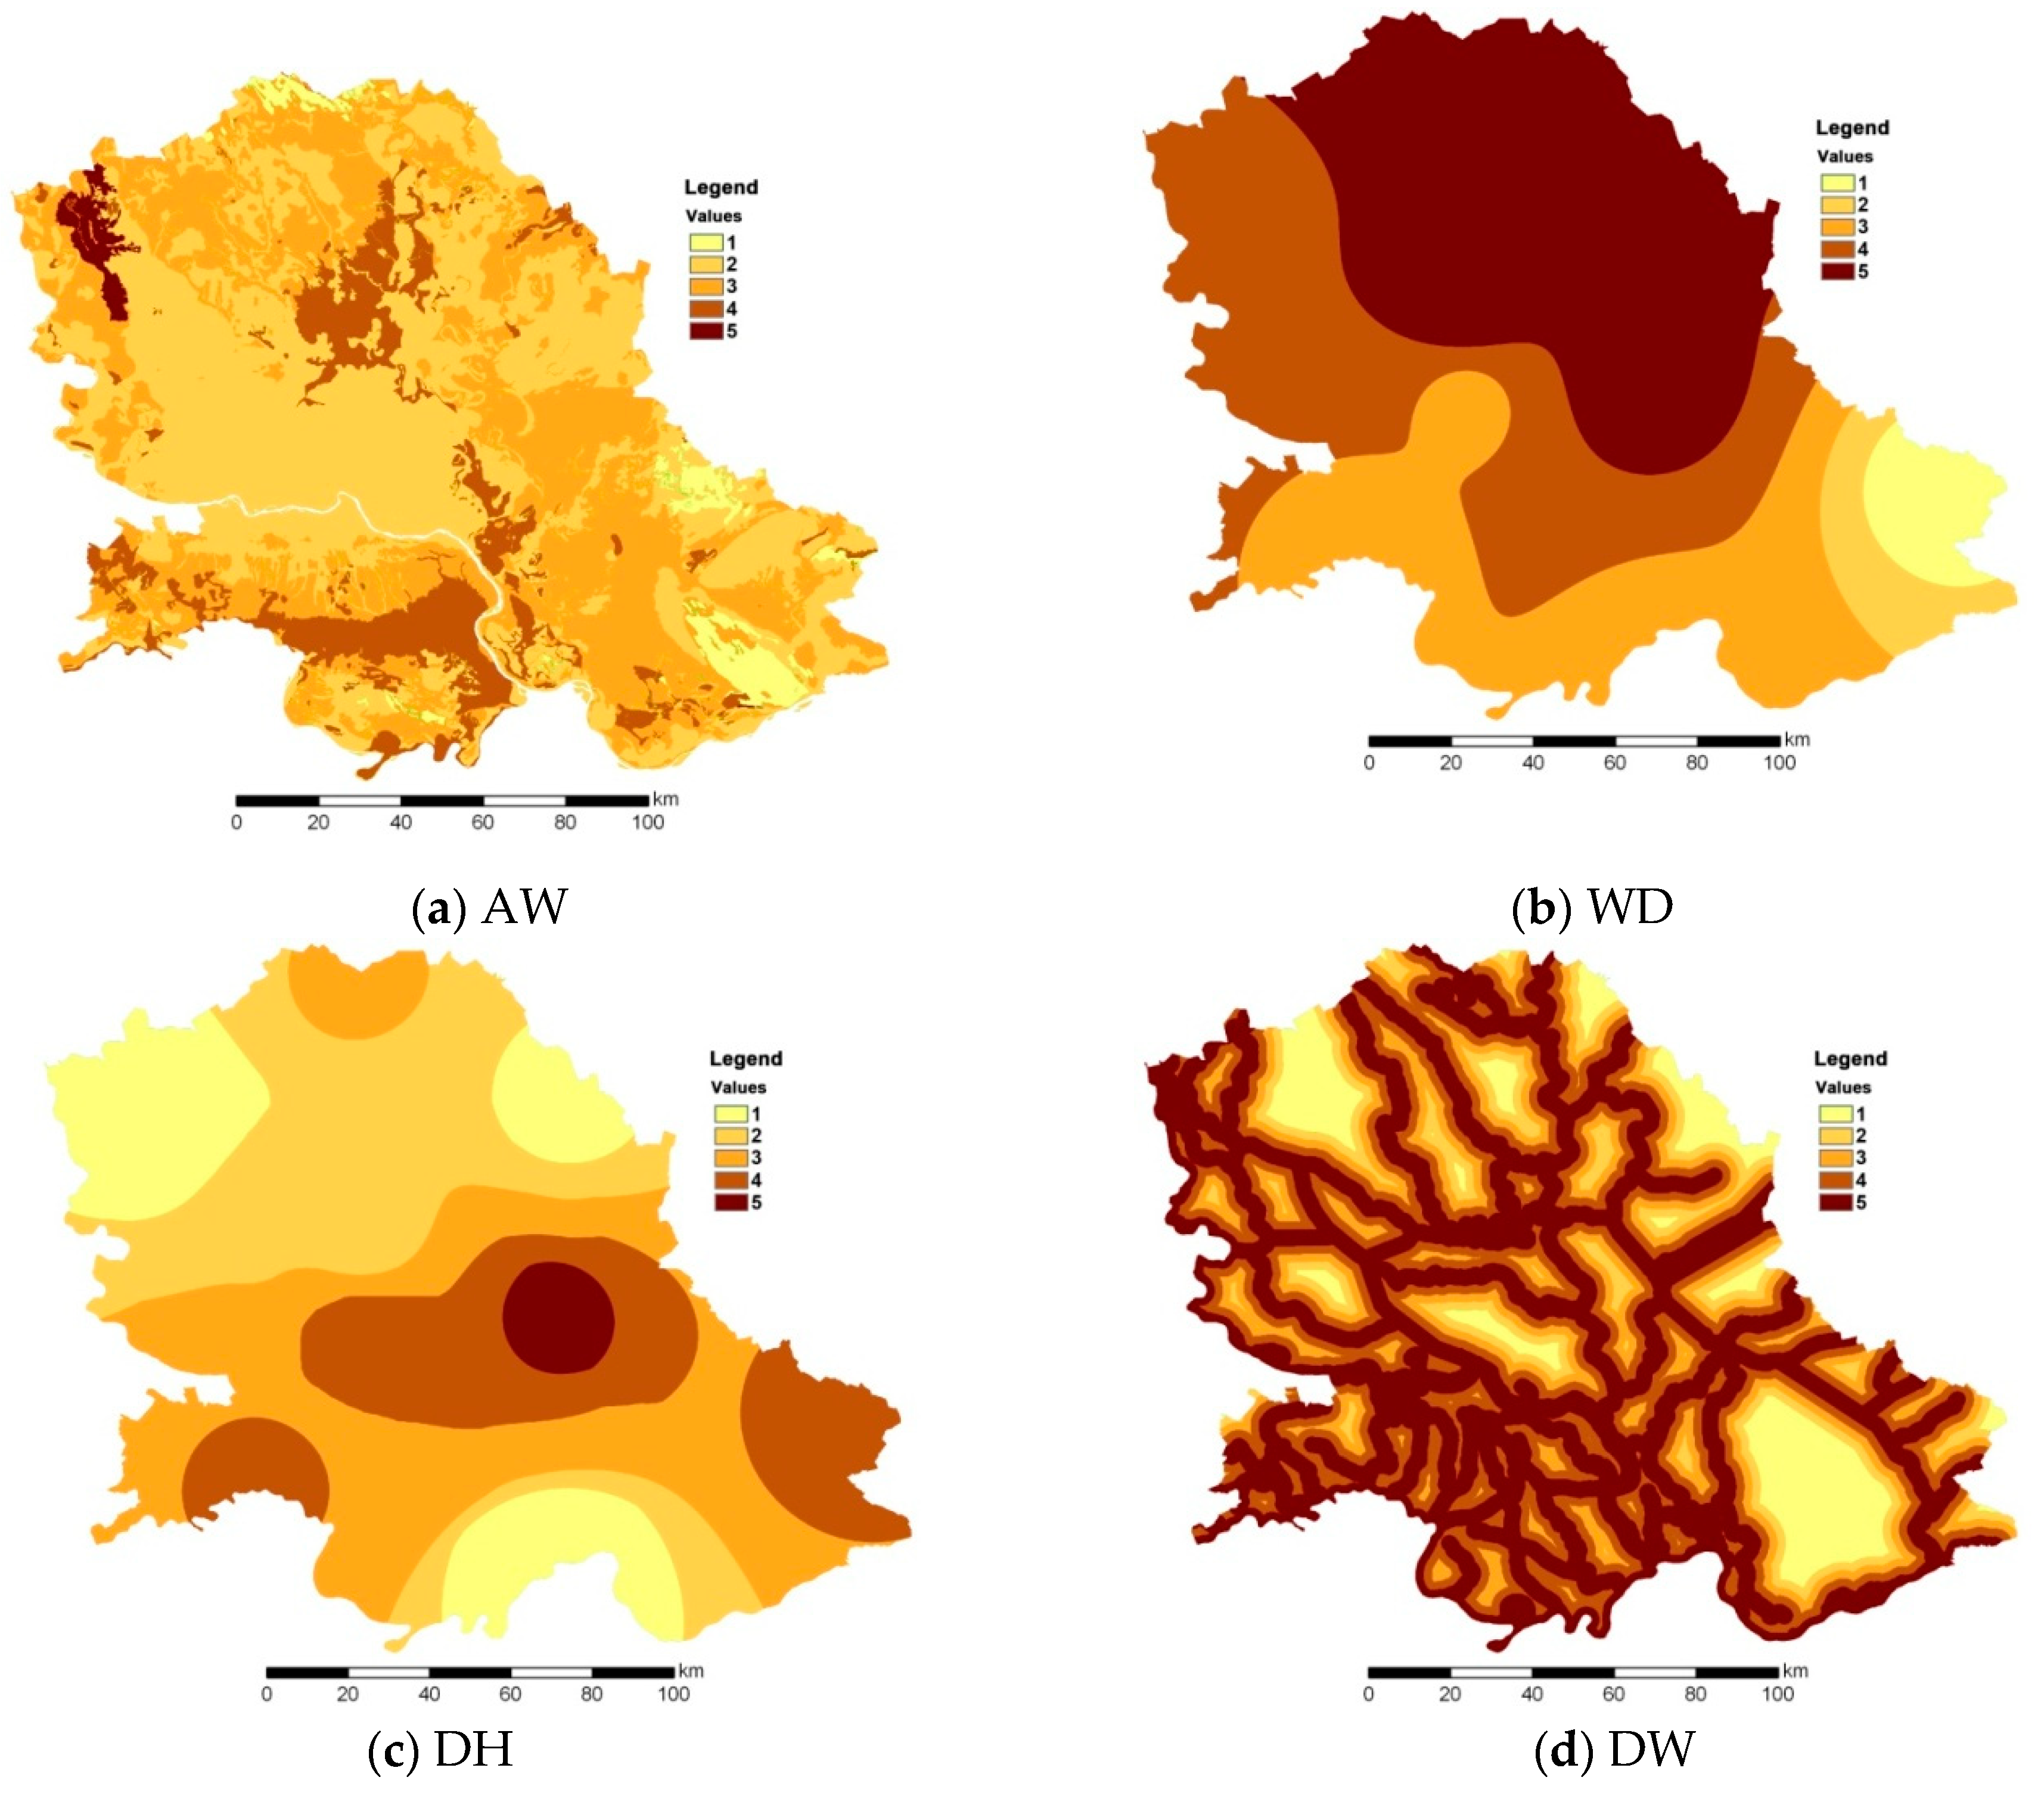
  • The total available water in the root zone (AW) was determined as a difference between the water content at field capacity and the wilting point in the root zone. In Vojvodina (where the topsoil depth varies from 0.1 m to 1.5 m), AW ranges from 5 mm to 200 mm [22].
  • The water deficit (WD) during the growing season is the most common way of elaborating the need for irrigation. Water balance represents the difference between precipitation and potential evapotranspiration (ET0). It is calculated using monthly precipitation data from nine principal meteorological stations in Vojvodina from 1971 to 2011 and ET0 using the Thornthwaite method [23].
  • Drought hazard (DH): drought is usually quantified by drought indices, which enable drought characterization, including magnitude, duration, severity, and spatial extent of drought. In this step, we used the drought hazard map from our previous research [22], where drought occurrences were analysed and drought-prone areas in Vojvodina were identified using the four state first-order homogeneous Markov chain model applied to the time series of the standardized precipitation index–SPI [24] calculated on a three-month scale (SPI3) for each month.
  • Distance from water bodies (DW): part of the water for irrigation is lost during transport through the water bodies because of evaporation, percolation, etc. This means that irrigation efficiency is higher when the distance from water bodies is shorter. Here, four buffer zones are drawn around water bodies, each at a distance of 2 km.
The decision problem hierarchy is presented in Figure 4. Then, the three agricultural experts (AE1–AE3) from the Faculty of Agriculture at the University of Novi Sad individually evaluated the criteria in pairs using Saaty’s scale [13] (Table 1). Individual criteria weights were obtained using the LLS method (Table 3). The consistencies (GCI values) of the agricultural experts were computed and presented in Table 3. The results show that all the experts had acceptable inconsistency (GCI < 0.35).
After that, the consensus model was applied and a group decision was obtained. Reaching the consensus required 49 iterations. The GCCI for all the experts was less than 0.001, meaning that a full agreement among the experts was reached. Group weights of the criteria (w(g)) and consensus matrix are also presented in Table 3. The obtained results show that the most important criterion is drought hazard (DH) with a weight of 0.335, the second is total available water in the root zone (AW) with a weight of 0.334, then the criteria distance from the water bodies (DW) (0.175), and water deficit (WD) (0.157).

3.3. Steps # 5–7

In this phase of the methodology, all the criteria are presented as GIS raster layers. The inverse distance weighting method was used to interpolate the water deficit and drought hazard data. As mentioned in the previous section, all the layers were standardized by assigning to each cell a rating on the scale from 1, meaning a low priority for irrigation (light yellow colour), to 5, representing a very high priority (dark brown colour). The ratings are assigned as shown in Table 4. The highest priorities (suitability) for irrigation development are given to the land units with:
(a)
The highest capacity to hold considerable amounts of water (for the AW criterion);
(b)
The highest water deficit (for WD criterion);
(c)
Very high drought hazard (for DH criterion); and
(d)
The smallest distance from water bodies (for DW criterion).
The spatial distributions of suitability ratings (regarding all the analyzed criteria) are presented in the suitability maps (criteria layers) for irrigation (Figure 5a–d). All the layers are identically georeferenced and have the same pixel resolution, which enables the GIS overlay analysis.
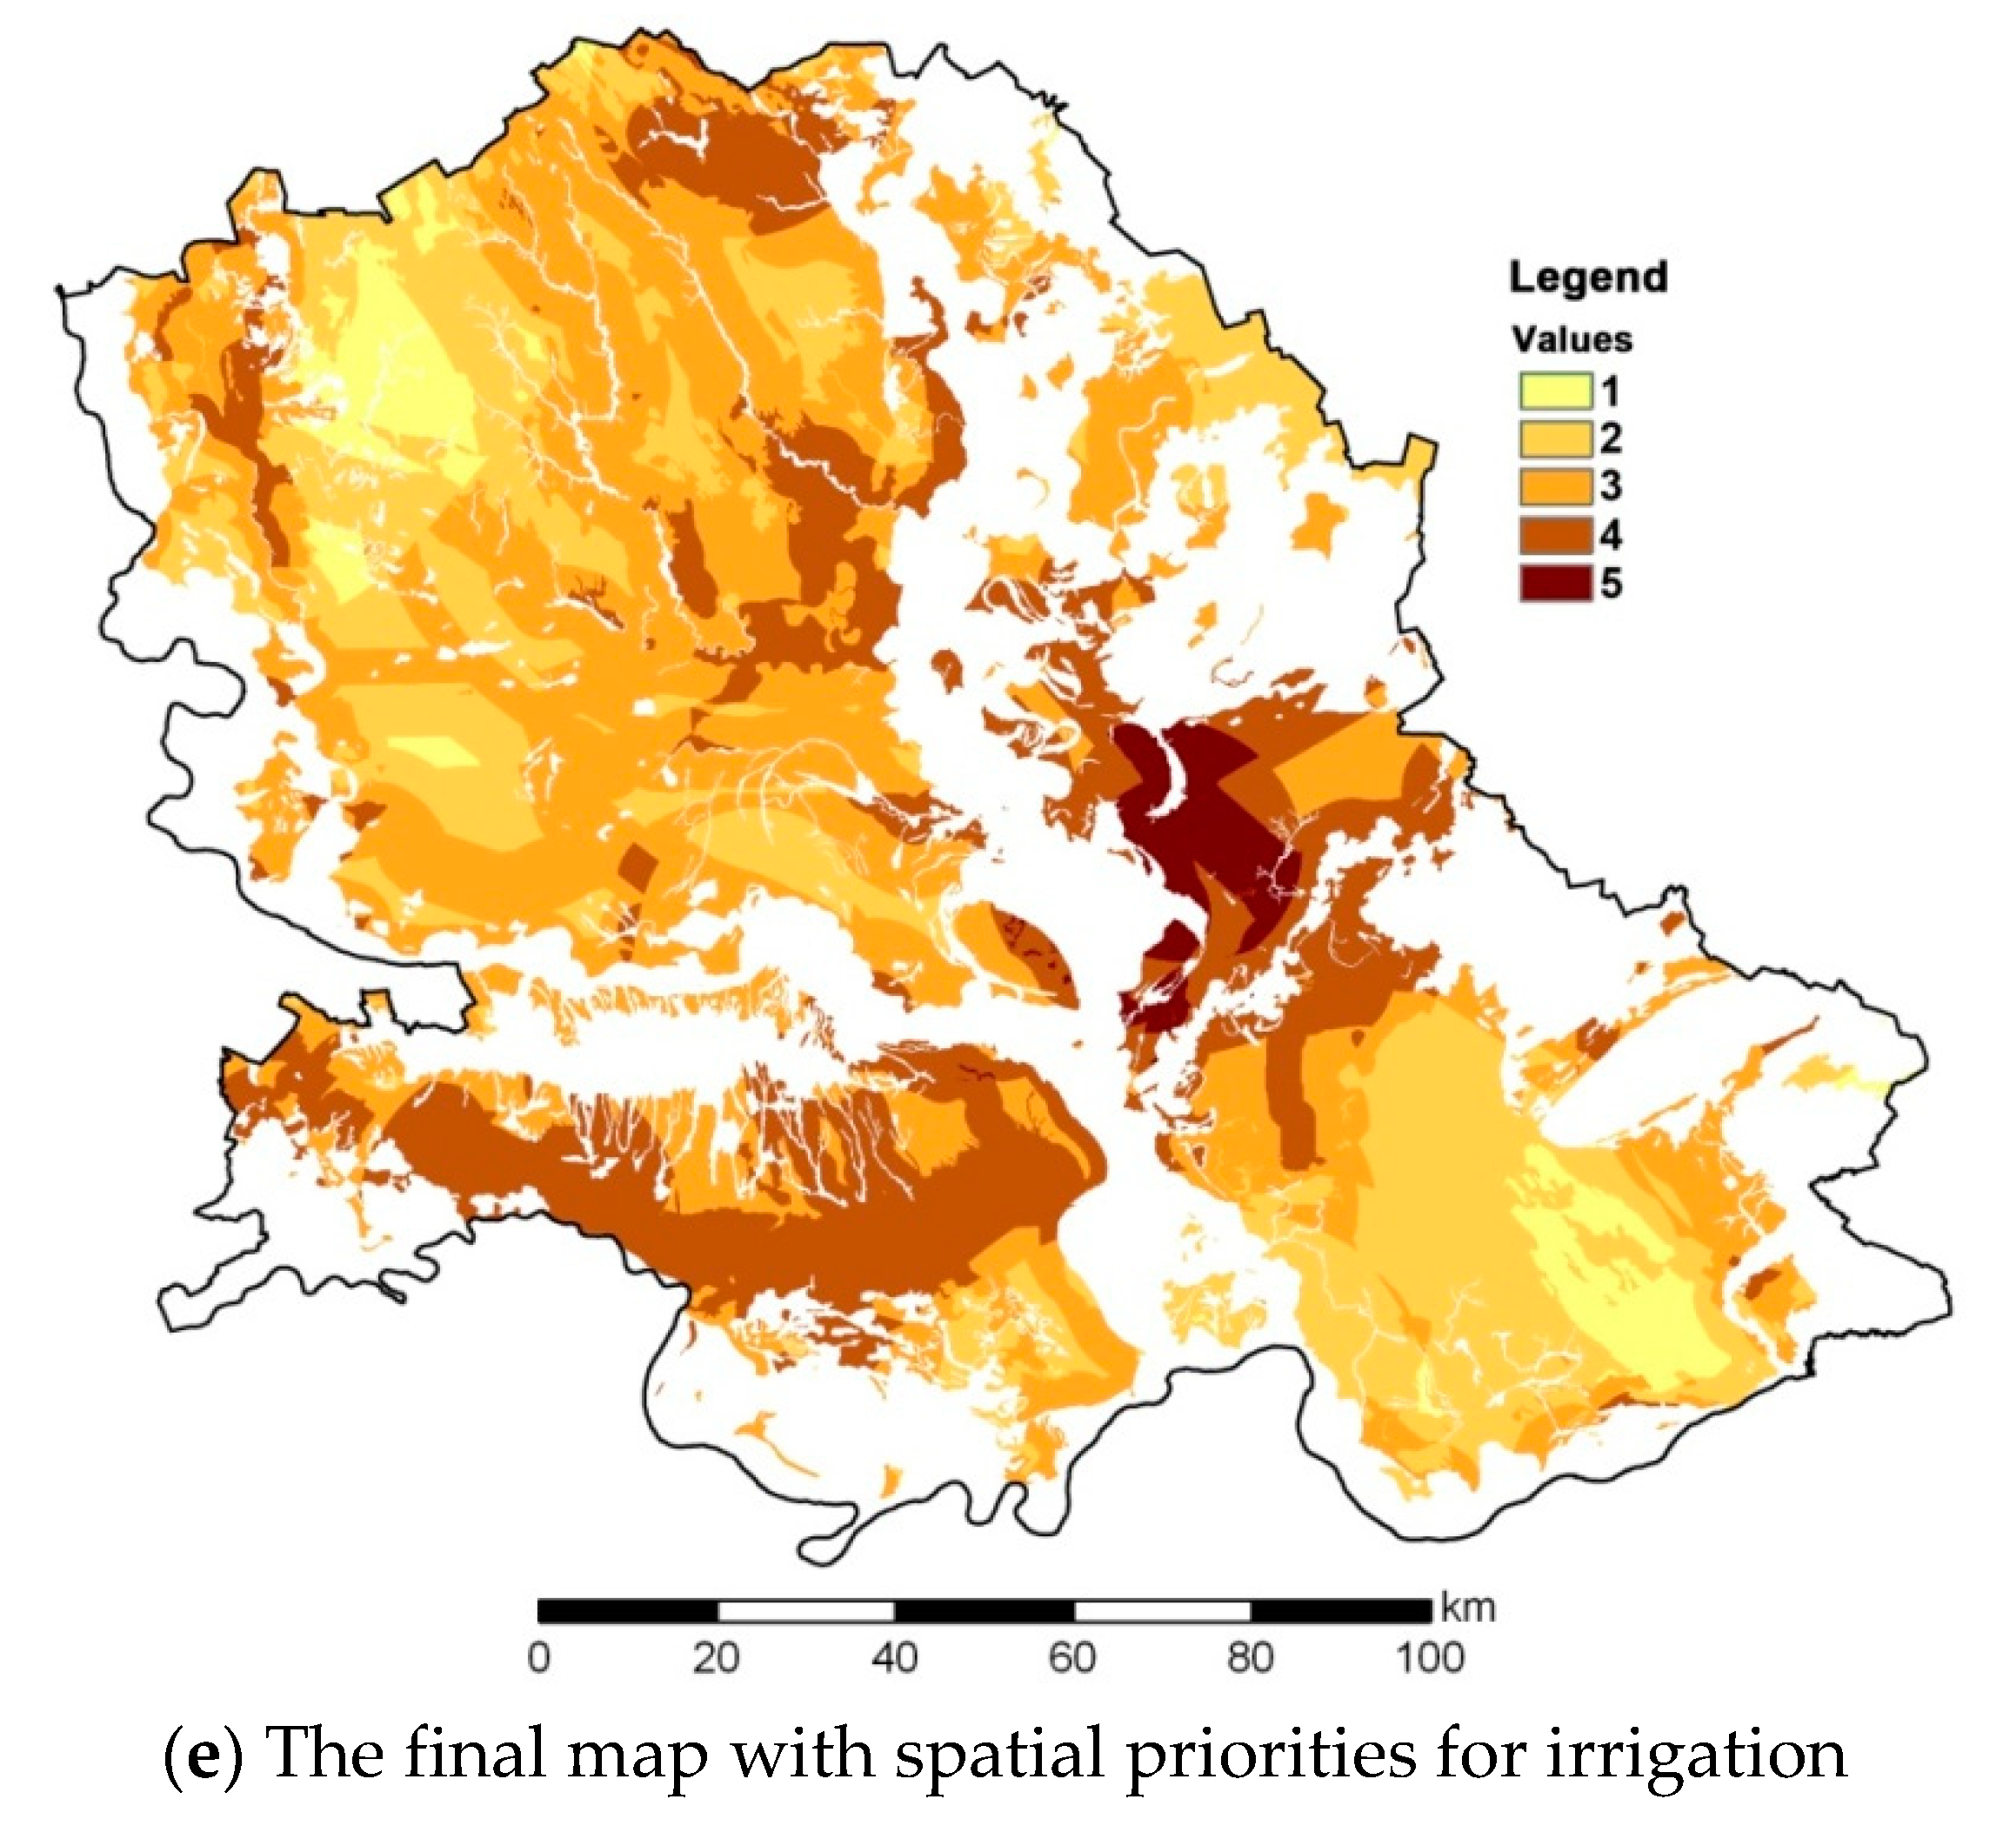
Finally, the cell values were multiplied by the corresponding consensus weights of the criteria and these weighted layers are summarized in the final map (Figure 5e). This was done using the raster calculator in GIS. Notice that only the area selected in Step 1 (the first two classes of soil suitability for irrigation presented in Figure 3b) was analyzed. Thus, we created the map with spatial priorities for irrigation development, the purpose of which was to minimize land degradation and to maximize water use efficiency.
According to the obtained results, the areas with the highest priorities (rating 5) for irrigation development are located in the central-eastern part of Vojvodina and cover 2.4% of the analyzed area. These areas are rated as the most suitable due to the combination of favorable soil properties (high water holding capacity), dense network of natural and artificial watercourses, and adverse climatic characteristics such as high deficit in the soil water balance and high drought hazard. The second most suitable areas (rating 4) are mostly located in the southwestern parts, but also in the central-eastern and northern parts of the Vojvodina region. They cover 23.5% of the analyzed area. This map can be used by the government of Vojvodina as a helpful and trustful foundation for defining land with priorities for irrigation development. Although this map is based on objective and scientific data, it allows the policy makers from the government to modify the spatial priorities according to political, social, and economic criteria which are not analyzed in this paper.

4. Conclusions

In this paper, we presented a methodology for defining spatial priorities for irrigation development, the main goal of which was to try to achieve several UN Sustainable Development Goals, mainly related to a land degradation-neutral world and water use efficiency. For that purpose, we proposed to treat soil and water conservation criteria separately. This means that we decided to first select the land with minimal risk of soil degradation (which can be caused by long-term irrigation), and then to evaluate those areas using water use efficiency criteria. In the future, affected by climate change, water use efficiency will become even more important than it is now. This is true especially for the agricultural sector where irrigation accounts for 70% of global water withdrawals [13]. This is the reason why we highlighted the water use efficiency criteria in defining spatial priorities for irrigation. The central part of the methodology is the combination of AHP and GIS—today almost considered to be the standard procedure for any spatial land evaluation—used in a group context together with the consensus model. We believe that group decision making can help the involved experts make wiser decisions and that it can decrease the risk related to the bias and subjectivity of experts. In addition, the consensus model used here can help experts to increase the consensus level among them automatically, and it satisfies the Pareto principle of social choice theory. Finally, it is important to notice that our selection of the water use efficiency related criteria was mainly based on the available data. We believe that in future work, we should try to include more UN Sustainable Development Goals and other relevant socio-environmental–economic criteria.

Author Contributions

Conceptualization, A.B. and B.B.; methodology, A.B. and B.B.; formal analysis, A.B. and B.B.; investigation, B.B. and M.V.; data curation, B.B., A.B., M.V., J.B., P.B., and R.S.; writing—original draft preparation, B.B. and A.B.; writing—revision and editing, B.B., A.B., and J.B.; visualization, A.B., P.B., and B.B.; supervision, R.S. and J.B.

Acknowledgments

This research represents a result of the research activity carried out within the project: Interreg-IPA CBC Hungary–Serbia (HUSRB/1602/11/0057): WATER@RISK-Improvement of drought and excess water monitoring for supporting water management and mitigation of risks related to extreme weather conditions, co-financed by the European Union (IPA). This work was also supported in part by the Ministry of Education, Science, and Technological Development of Serbia under the grant 174,003 (2011–2019)—Theory and application of analytic hierarchy process (AHP) in multi-criteria decision making under the conditions of risk and uncertainty (individual and group context).

Conflicts of Interest

The authors declare no conflict of interest.

References

  1. UN-Water. Coordinating the UN’s Work on Water and Sanitation. Available online: http://www.unwater.org (accessed on 9 December 2018).
  2. Rajić, M.; Bezdan, A. Contribution to research of droughts in Vojvodina Province. Carpath. J. Earth Environ. 2012, 7, 101–107. [Google Scholar]
  3. Srdjevic, Z.; Bezdan, A.; Blagojevic, B.; Dunkel, Z.; Srdjevic, B. Spatial multi-criteria evaluation of land suitability for irrigation in Vojvodina Province (Serbia) based on its soil and climate characteristics. Ital. J. Agrometeorol. 2015, 97–103. [Google Scholar]
  4. Stricevic, R.; Cosic, M.; Djurovic, N.; Pejic, B.; Maksimovic, L. Assessment of the FAO AquaCrop model in the simulation of rainfed and supplementally irrigated maize, sugar beet and sunflower. Agric. Water Manag. 2011, 98, 1615–1621. [Google Scholar] [CrossRef]
  5. Stricevic, R.; Djurovic, N. Determination of spatiotemporal distribution of agricultural drought in Central Serbia (Sumadija). Sci. Res. Essays 2013, 8, 438–446. [Google Scholar]
  6. Savić, R.; Pejić, B.; Ondrašek, G.; Vranešević, M.; Bezdan, A. Iskorišćenost prirodnih resursa Vojvodine za navodnjavanje (Utilisation of Natural Resources for Irrigation in Vojvodina). Агрoзнање 2013, 14, 133–142. [Google Scholar] [CrossRef]
  7. JVP “Vode Vojvodine” Novi Sad. Available online: http://www.vodevojvodine.com/ (accessed on 7 December 2018).
  8. Ðuričin, S.; Savic, S.; Bodroza, D.; Cvijanovic, G.; Ðorðevic, S. Climate change impacts on agricultural water management: Challenge for increasing crop productivity in Serbia. Econ. Agric. 2016, 63, 1333–1346. [Google Scholar]
  9. Albaji, M.; Landi, A.; Boroomand Nasab, S.; Moravej, K. Land Suitability Evaluation for Surface and Drip Irrigation in Shavoor Plain Iran. J. Appl. Sci. 2008, 8, 654–659. [Google Scholar] [CrossRef] [Green Version]
  10. Blagojevic, B.; Srdjevic, Z.; Bezdan, A.; Srdjevic, B. Group decision-making in land evaluation for irrigation: A case study from Serbia. J. Hydroinf. 2016, 18, 579–598. [Google Scholar] [CrossRef]
  11. Marchi, E.; Chung, W.; Visser, R.; Abbas, D.; Nordfjell, T.; Mederski, P.S.; McEwan, A.; Brink, M.; Laschi, A. Sustainable Forest Operations (SFO): A new paradigm in a changing world and climate. Sci. Total Environ. 2018, 634, 1385–1397. [Google Scholar] [CrossRef] [PubMed] [Green Version]
  12. United Nations Sustainable Development. Available online: https://www.un.org/sustainabledevelopment/ (accessed on 9 December 2018).
  13. Saaty, T.L. The Analytical Hierarchy Process; McGraw Hill: New York, NY, USA, 1980; p. 287. [Google Scholar]
  14. Huang, I.B.; Keisler, J.; Linkov, I. Multi-criteria decision analysis in environmental sciences: Ten years of applications and trends. Sci. Total Environ. 2011, 409, 3578–3594. [Google Scholar] [CrossRef] [PubMed]
  15. Blagojevic, B.; Jonsson, R.; Björheden, R.; Nordström, E.M.; Lindroos, O. Multi-Criteria Decision Analysis (MCDA) in Forest Operations—An Introductional Review. Croat. J. For. Eng. 2019, 40, 191–205. [Google Scholar]
  16. Dong, Y.C.; Zhang, G.Q.; Hong, W.C.; Xu, Y.F. Consensus models for AHP group decision making under row geometric mean prioritization method. Decis. Support Syst. 2010, 49, 281–289. [Google Scholar] [CrossRef]
  17. Dragincic, J.; Korac, N.; Blagojevic, B. Group multi-criteria decision making (GMCDM) approach for selecting the most suitable table grape variety intended for organic viticulture. Comput. Electron. Agric. 2015, 111, 194–202. [Google Scholar] [CrossRef]
  18. Crawford, G.; Williams, C. A note on the analysis of subjective judgment matrices. J. Math. Psychol. 1985, 29, 387–405. [Google Scholar] [CrossRef]
  19. Aguarón, J.; Moreno-Jiménez, J.M. The geometric consistency index: Approximated thresholds. Eur. J. Oper. Res. 2003, 147, 137–145. [Google Scholar] [CrossRef]
  20. Pedrycz, W.; Ekel, P.; Parreiras, R. Fuzzy Multicriteria Decision-Making: Models, Methods and Applications; John Wiley & Sons: Hoboken, NJ, USA, 2011; p. 360. [Google Scholar]
  21. Miljkovic, N. Meliorative Pedology (Meliorativna pedologija); Faculty of Agriculture, Novi Sad: Novi Sad, Serbia, 2005. [Google Scholar]
  22. Bezdan, A.; Benka, P.; Grabic, J.; Salvai, A. Estimation of Agricultural Drought Vulnerability Using GIS Tools: A Case Study of Vojvodina Region (Serbia). In Proceedings of the Balwois 2012, Balwois, Macedonia, 28 May–2 June 2012. [Google Scholar]
  23. Thornthwaite, C.W.; Mather, J.R. The Water Balance; Publications in Climatology VIII; Drexel Institute of Climatology: Centerton, NJ, USA, 1955; pp. 1–104. [Google Scholar]
  24. Mckee, T.B.; Doesken, N.J.; Kleist, J. The relationship of drought frequency and duration to time scales. In Proceedings of the 8th Conference on Applied Climatology; American Meteorological Society: Boston, MA, USA, 1993; pp. 17–22. [Google Scholar]
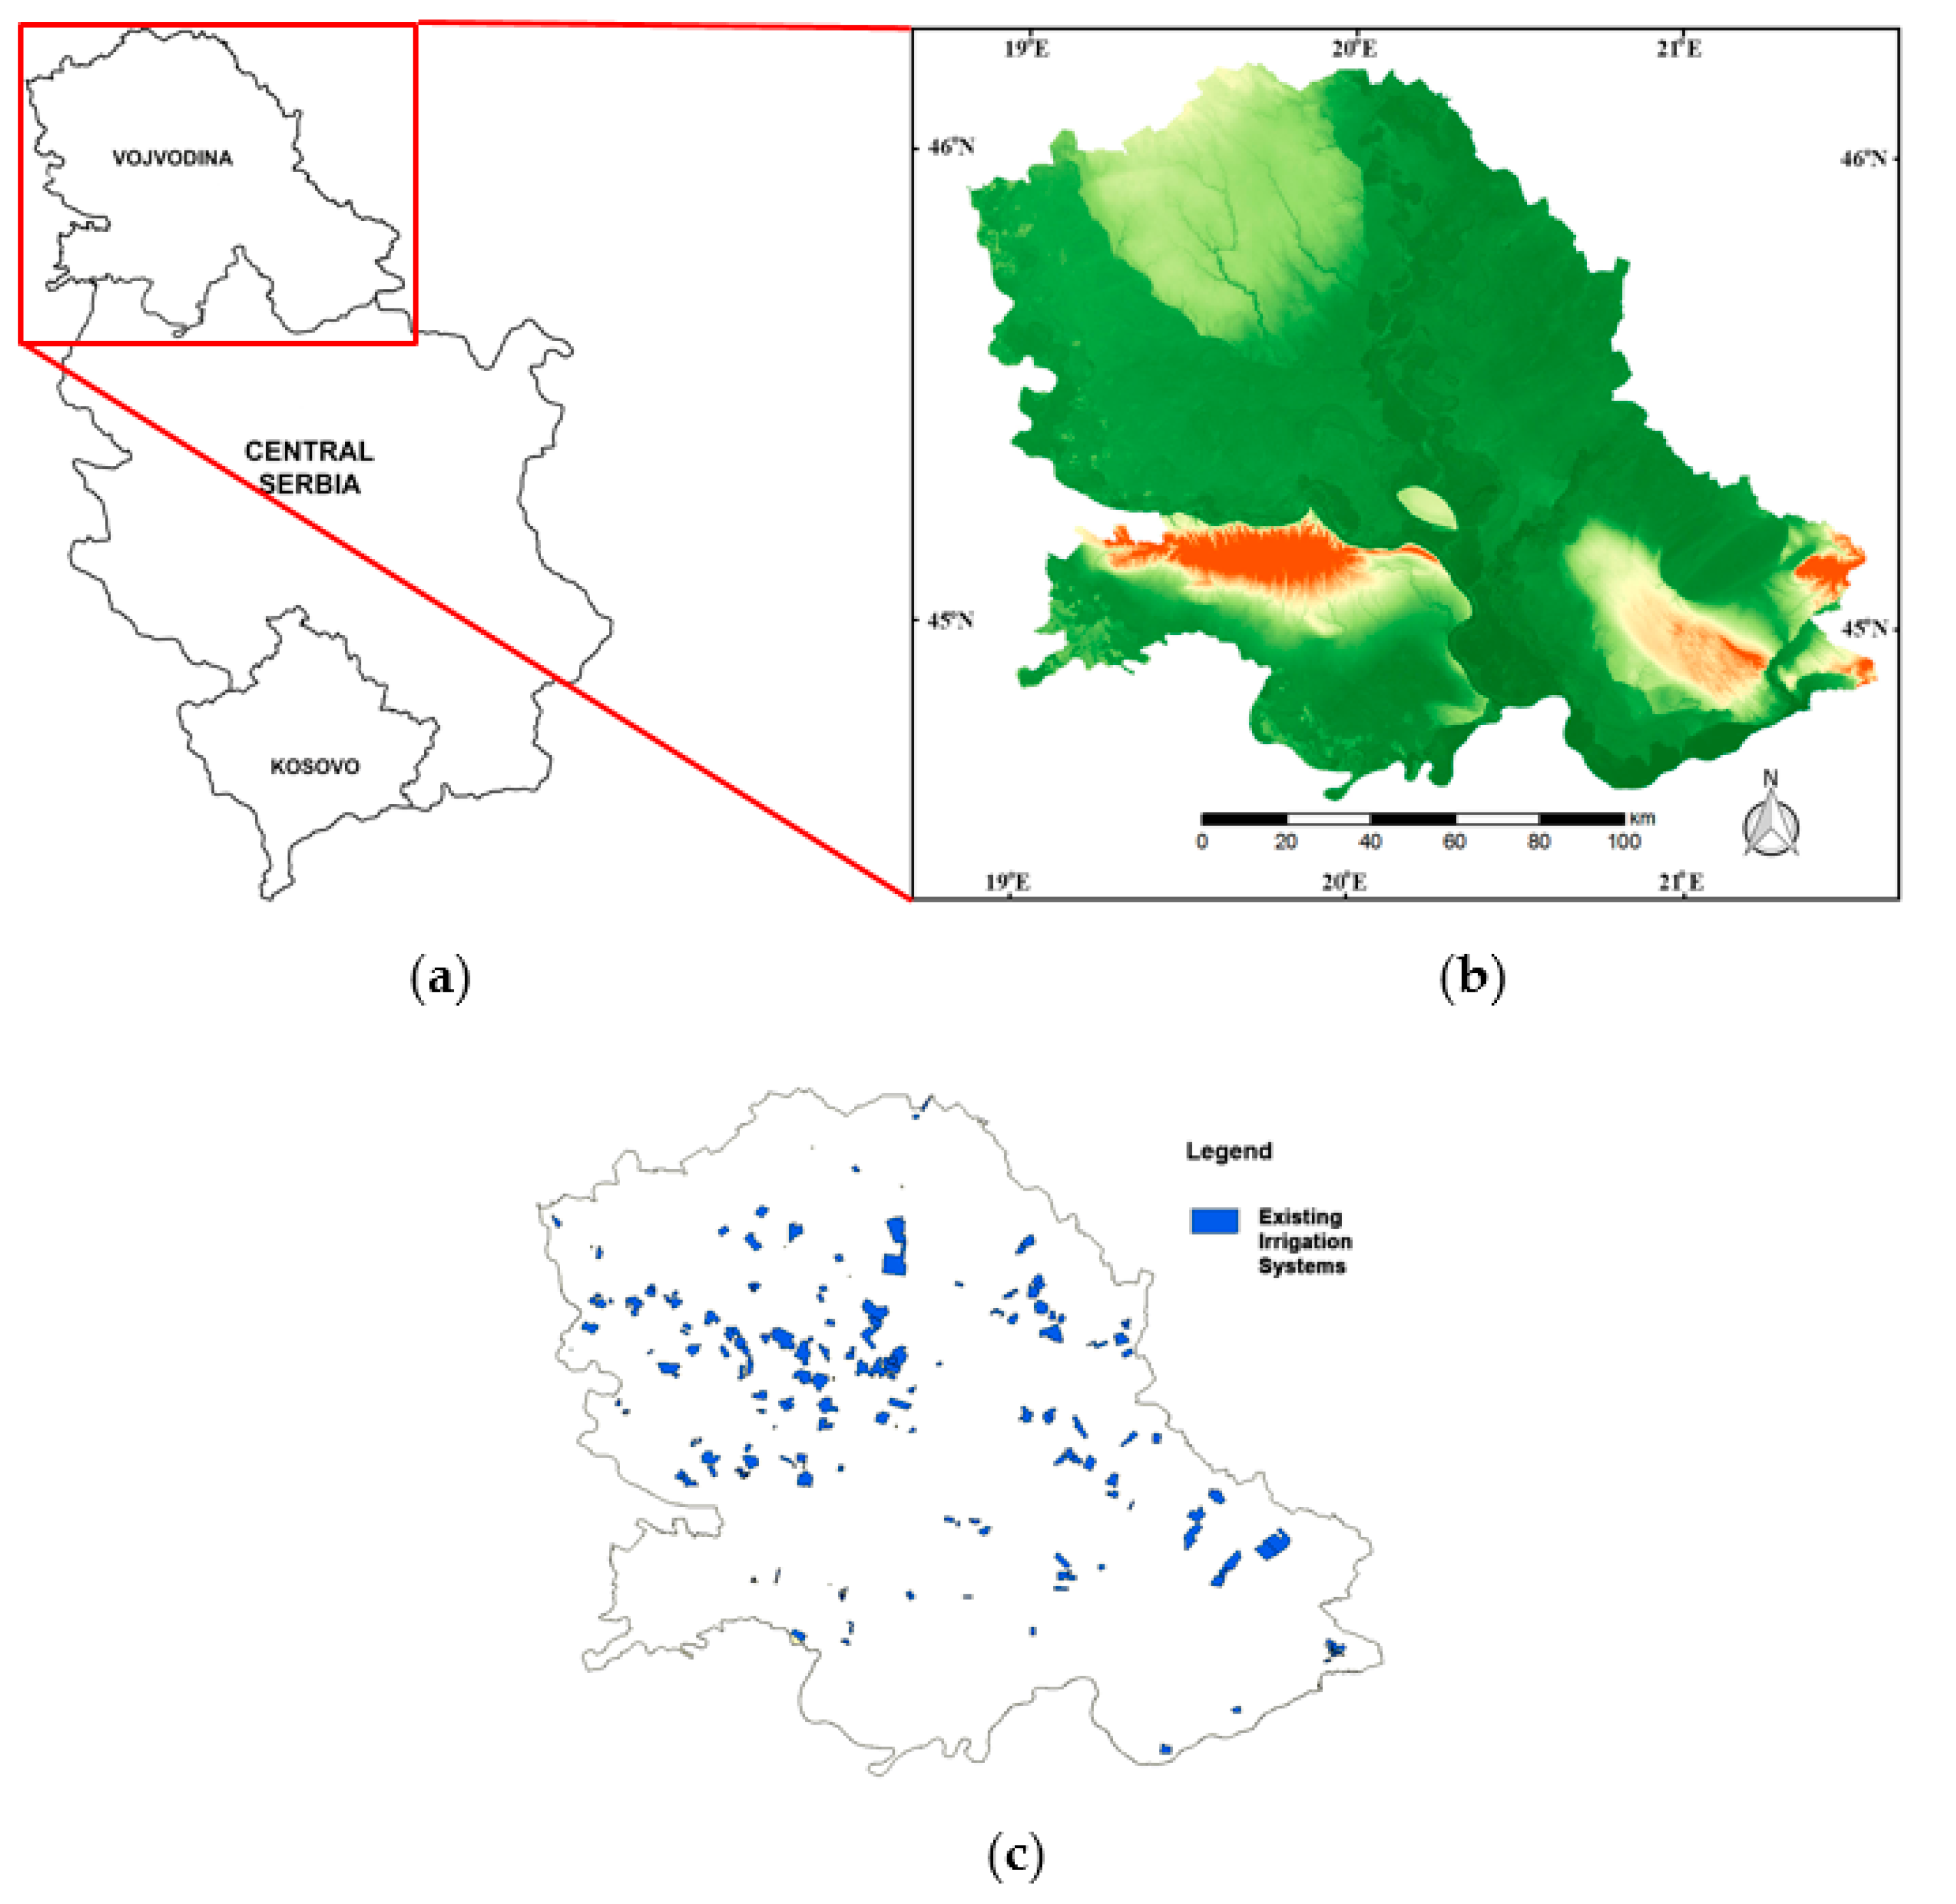
Figure 1. Map of the Republic of Serbia (a) and Vojvodina Province (b), with existing irrigation systems (c).
Agronomy 09 00324 g001
Figure 2. The methodology for defining spatial priorities for irrigation development.
Agronomy 09 00324 g002
Figure 3. Defining analyzed area.
Agronomy 09 00324 g003
Figure 4. Decision problem hierarchy.
Agronomy 09 00324 g004
Figure 5. The criteria layers and the final map with spatial priorities for irrigation.
Agronomy 09 00324 g005aAgronomy 09 00324 g005b
Table 1. Saaty’s importance scale.
DefinitionImportance
Equal importance1
Weak dominance3
Strong dominance5
Demonstrated dominance7
Absolute dominance9
Intermediate values(2,4,6,8)
Table 2. Irrigation suitability soil classification [21].
Irrigability ClassDescriptionIrrigation
Suitability Value
INo limitation for sustained use under irrigation5
IISlight soil limitation for sustained use under irrigation4
IIIaModerate soil limitation for sustained use under irrigation3
IIIbSevere soil limitation for sustained use under irrigation2
IIIcVery severe soil limitation for sustained use under irrigation1
Table 3. Individual judgment matrices (AE1–AE3) with priority vectors, and consensus matrix with group priority vector.
AE1AE2
AWWDDHDWw AWWDDHDWw
AW 1½10.194AW 3310.375
WD ½20.230WD 11/30.125
DH 30.429DH 1/30.125
DW 0.147DW 0.375
GCI = 0.061GCI = 0.000
AE3Consensus matrix
AWWDDHDWw AWWDDHDWw(g)
AW 4130.395AW 2.1411.900.334
WD 1/310.114WD 0.470.900.157
DH 30.368DH 1.920.335
DW 0.123DW 0.175
GCI = 0.014Z = 49
Table 4. The four criteria with five classes and corresponding suitability ratings.
Suitability RatingAWWDDHDW
5—the most suitable160–200 mm275–297 mmVery high0–2 km
4120–160 mm254–275 mmHigh 2–4 km
380–120 mm233–254 mmModerate 4–6 km
240–80 mm212–233 mmLow to moderate6–8 km
1—the least suitable<40 mm191–212 mmLow>8 km